Attached files
| file | filename |
|---|---|
| 8-K - ROCK-TENN COMPANY 8-K - Rock-Tenn CO | a50193432.htm |
Exhibit 99.1
RockTenn Longbow Research Basic Materials Investor Conference March 6, 2012
Statements in this presentation that do not relate strictly to historical facts are forward-looking statements within the meaning of the Private Securities Litigation Reform Act of 1995. Forward-looking statements are based on our current expectations, beliefs, plans or forecasts and use words in this presentation such as will, estimate, trending, or refer to future time periods. You should not place undue reliance on any forward-looking statements as such statements involve risks, uncertainties, assumptions and other factors that could cause actual results to differ materially, including the following: our ability to integrate Smurfit-Stone or to achieve benefits from the Smurfit Acquisition, including, without limitation, synergies and performance improvements; expected levels of depreciation, corporate expenses, interest expense, income tax rates, federal NOL availability and utilization, Cellulosic Biofuel/Black Liquor and AMT tax credit utilization, pension contributions, capital expenditures, commodity costs, maintenance outages, containerboard inventory builds; the level of demand for our products; our ability to successfully identify and make performance improvements; anticipated returns on our capital investments; possible increases in energy, raw materials, shipping and capital equipment costs; any reduction in the supply of raw materials; fluctuations in selling prices and volumes; intense competition; the potential loss of certain customers; adverse changes in general market and industry conditions and other risks, uncertainties and factors discussed in Item 1A "Risk Factors" and under the caption "Business — Forward-Looking Information" in our 2011 Annual Report on Form 10-K and by similar disclosures in any of our subsequent SEC filings. The information contained herein speaks as of the date hereof and we do not have or undertake any obligation to update such information as future events unfold. 2 Cautionary Statement Regarding Forward-Looking Information
Use of Non-GAAP Financial Measures and Reconciliations We have included financial measures that are not prepared in accordance with accounting principles generally accepted in the United States ("GAAP"). The non-GAAP financial measures presented are not intended to be a substitute for GAAP financial measures, and any analysis of non-GAAP financial measures should be used only in conjunction with results presented in accordance with GAAP and thereconciliations of non-GAAP financial measures to GAAP financial measures included in the Appendix to this presentation. 3
Disclaimer We may from time to time be in possession of certain information regarding RockTenn that applicable law would not require us to disclose to the public in the ordinary course of business, but would require us to disclose if we were engaged in the purchase or sale of our securities. This presentation shall not be considered to be part of any solicitation of an offer to buy or sell RockTenn securities. This presentation also may not include all of the information regarding RockTenn that you may need to make an investment decision regarding RockTenn securities. Any such investment decision should be made on the basis of the overall mix of information regarding RockTenn that is publicly available as of the date of such decision. Certain pages of this presentation contain market and other information produced by RISI, a third party information provider for the global forest products industry. RockTenn has not verified or confirmed the RISI information, disclaims any responsibility for it and urges viewers of this presentation to make their own assessment of the RISI information. The views expressed on the slides containing RISI information are those of RISI and do not necessarily reflect the views of RockTenn or any of its employee. 4 RockTenn
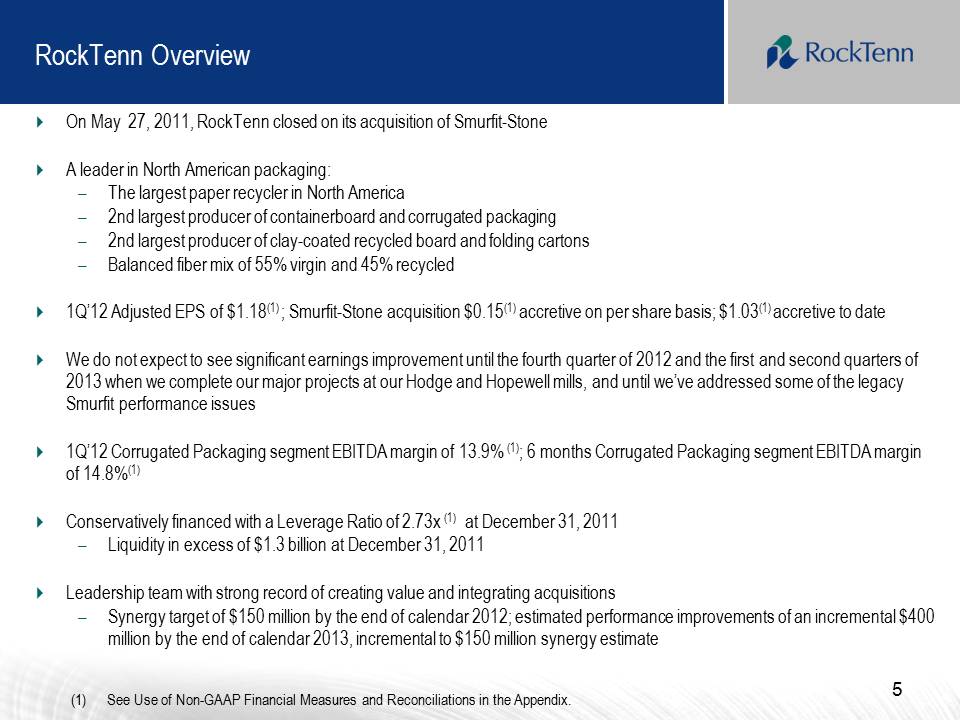
RockTenn Overview �� On May 27, 2011, RockTenn closed on its acquisition of Smurfit-Stone �� A leader in North American packaging: – The largest paper recycler in North America – 2nd largest producer of containerboard and corrugated packaging – 2nd largest producer of clay-coated recycled board and folding cartons – Balanced fiber mix of 55% virgin and 45% recycled �� 1Q’12 Adjusted EPS of $1.18(1) ; Smurfit-Stone acquisition $0.15(1) accretive on per share basis; $1.03(1) accretive to date �� We do not expect to see significant earnings improvement until the fourth quarter of 2012 and the first and second quarters of 2013 when we complete our major projects at our Hodge and Hopewell mills, and until we’ve addressed some of the legacy Smurfit performance issues �� 1Q’12 Corrugated Packaging segment EBITDA margin of 13.9% (1); 6 months Corrugated Packaging segment EBITDA margin of 14.8%(1) �� Conservatively financed with a Leverage Ratio of 2.73x (1) at December 31, 2011 – Liquidity in excess of $1.3 billion at December 31, 2011 �� Leadership team with strong record of creating value and integrating acquisitions – Synergy target of $150 million by the end of calendar 2012; estimated performance improvements of an incremental $400 million by the end of calendar 2013, incremental to $150 million synergy estimate 5 (1) See Use of Non-GAAP Financial Measures and Reconciliations in the Appendix.
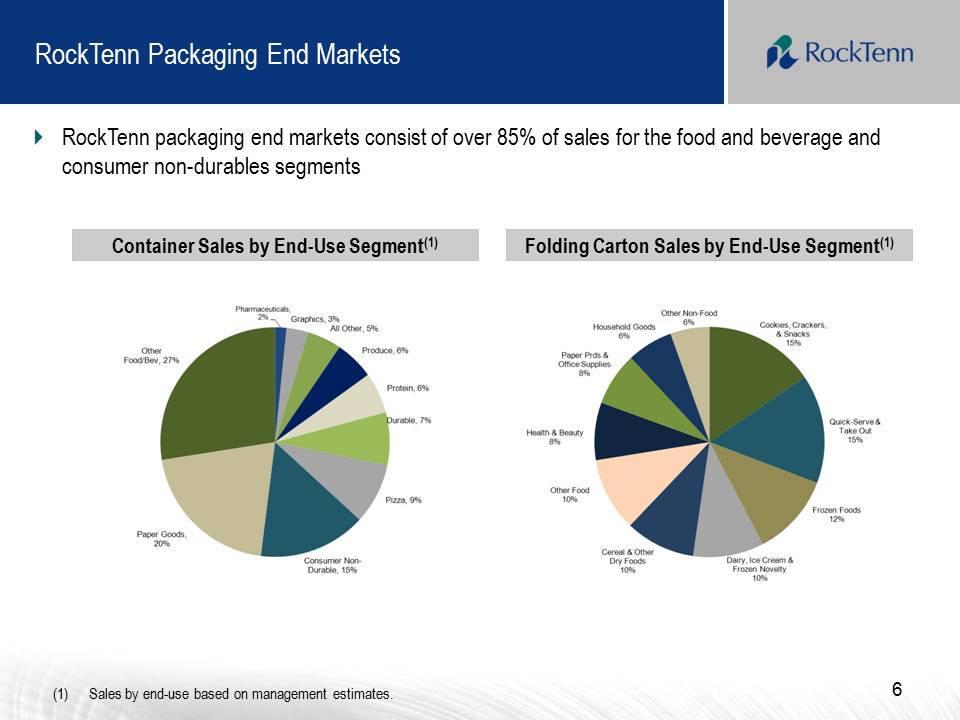
6 �� RockTenn packaging end markets consist of over 85% of sales for the food and beverage and consumer non-durables segments Container Sales by End-Use Segment (1) Folding Carton Sales by End-Use Segment (1) Other Food/Bev, 27% Pharmaceuticals, 2% Graphics, 3% All Other, 5% Produce, 6% Protein, 6% Durable, 7% Pizza, 9% Consumer Non-Durable 15% Paper Goods, 20% (1) Sales by end-use based on management estimates. Paper Prds & Office Supplies 8% Household Goods 6% Other Non-Food 6% Cookies, Crackers, & Snacks 15% Quick-Serve & Take Out 15% Frozen Foods 12% Dairy, Ice Cream & Frozen Novelty 10% Cereal & Other Dry Foods 10% Other Food 10% Health & Beauty 8%
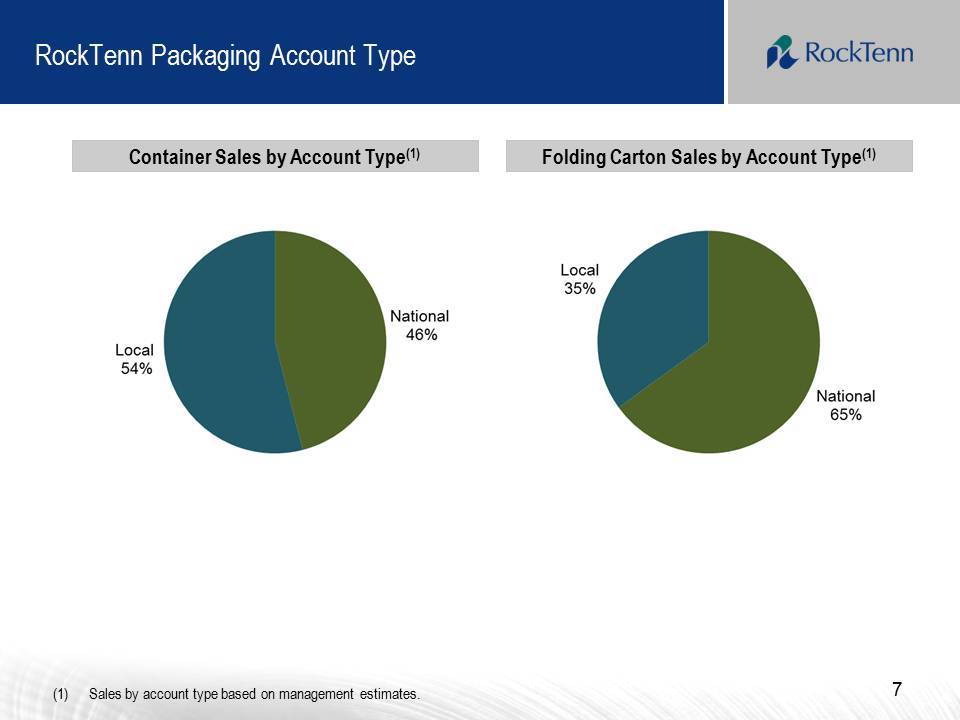
7 RockTenn Packaging Account Type Container Sales by Account Type(1) Folding Carton Sales by Account Type(1) (1) Sales by account type based on management estimates. Local 54% National 46% Local 35% National 65%
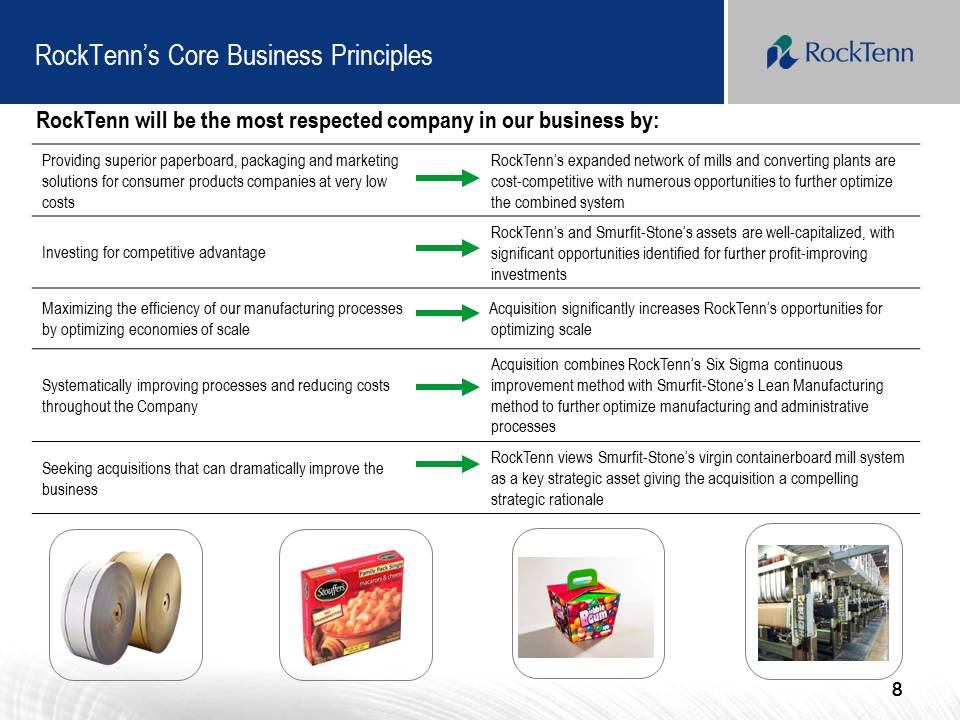
8 RockTenn’s Core Business Principles Providing superior paperboard, packaging and marketing solutions for consumer products companies at very low costs RockTenn’s expanded network of mills and converting plants are cost-competitive with numerous opportunities to further optimize the combined system Investing for competitive advantage RockTenn’s and Smurfit-Stone’s assets are well-capitalized, with significant opportunities identified for further profit-improving investments Maximizing the efficiency of our manufacturing processes by optimizing economies of scale Acquisition significantly increases RockTenn’s opportunities for optimizing scale Systematically improving processes and reducing costs throughout the Company Acquisition combines RockTenn’s Six Sigma continuous improvement method with Smurfit-Stone’s Lean Manufacturing method to further optimize manufacturing and administrative processes Seeking acquisitions that can dramatically improve the business RockTenn views Smurfit-Stone’s virgin containerboard mill system as a key strategic asset giving the acquisition a compelling strategic rationale RockTenn will be the most respected company in our business by:
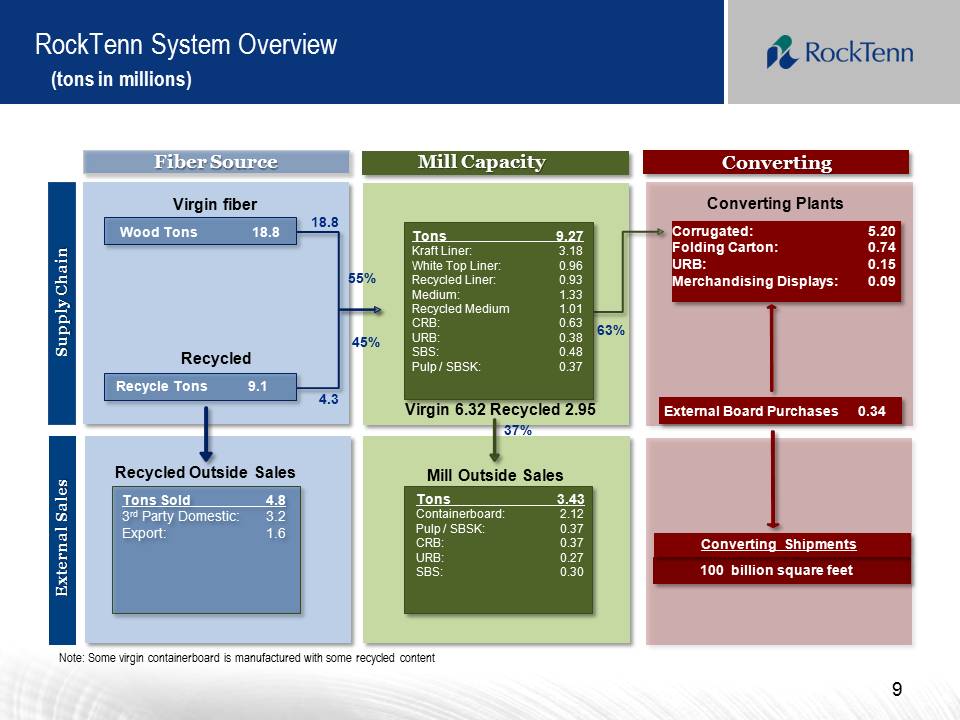
RockTenn System Overview (tons in millions) Mill Capacity Converting Supply Chain External Sales Virgin fiber Recycled Mill Outside Sales Virgin 6.32 Recycled 2.95 Converting Plants Corrugated: 5.20 Folding Carton: 0.74 URB: 0.15 Merchandising Displays: 0.09 External Board Purchases 0.34 18.8 4.3 Fiber Source Recycle Tons 9.1 Wood Tons 18.8 Tons 9.27 Kraft Liner: 3.18 White Top Liner: 0.96 Recycled Liner: 0.93 Medium: 1.33 Recycled Medium 1.01 CRB: 0.63 URB: 0.38 SBS: 0.48 Pulp / SBSK: 0.37 Tons 3.43 Containerboard: 2.12 Pulp / SBSK: 0.37 CRB: 0.37 URB: 0.27 SBS: 0.30 Tons Sold 4.8 3rd Party Domestic: 3.2 Export: 1.6 Recycled Outside Sales Converting Shipments 100 billion square feet Note: Some virgin containerboard is manufactured with some recycled content 63% 37% 9 55% 45%
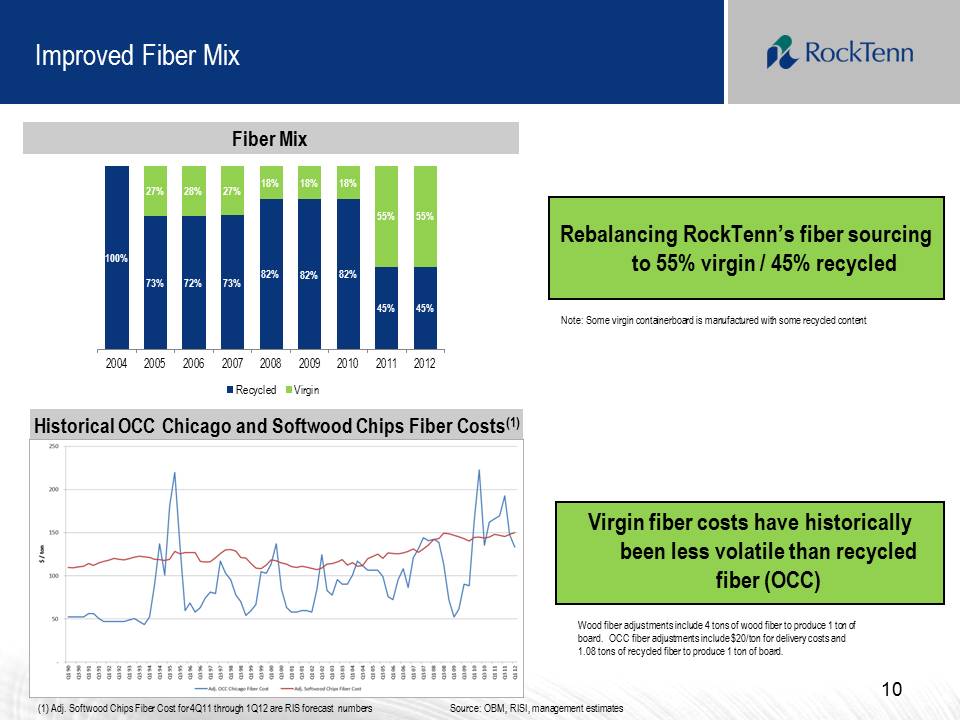
Improved Fiber Mix 10 Rebalancing RockTenn’s fiber sourcing to 55% virgin / 45% recycled Note: Some virgin containerboard is manufactured with some recycled content Source: OBM, RISI, management estimates Wood fiber adjustments include 4 tons of wood fiber to produce 1 ton of board. OCC fiber adjustments include $20/ton for delivery costs and 1.08 tons of recycled fiber to produce 1 ton of board. Fiber Mix Historical OCC Chicago and Softwood Chips Fiber Costs(1) Virgin fiber costs have historically been less volatile than recycled fiber (OCC) (1) Adj. Softwood Chips Fiber Cost for 4Q11 through 1Q12 are RIS forecast numbers 100% 73% 72% 73% 82% 82% 82% 45% 45% 27% 28% 27% 18% 18% 18% 55% 55% 2004 2005 2006 2007 2008 2009 2010 2011 2012 Recycled Virgin
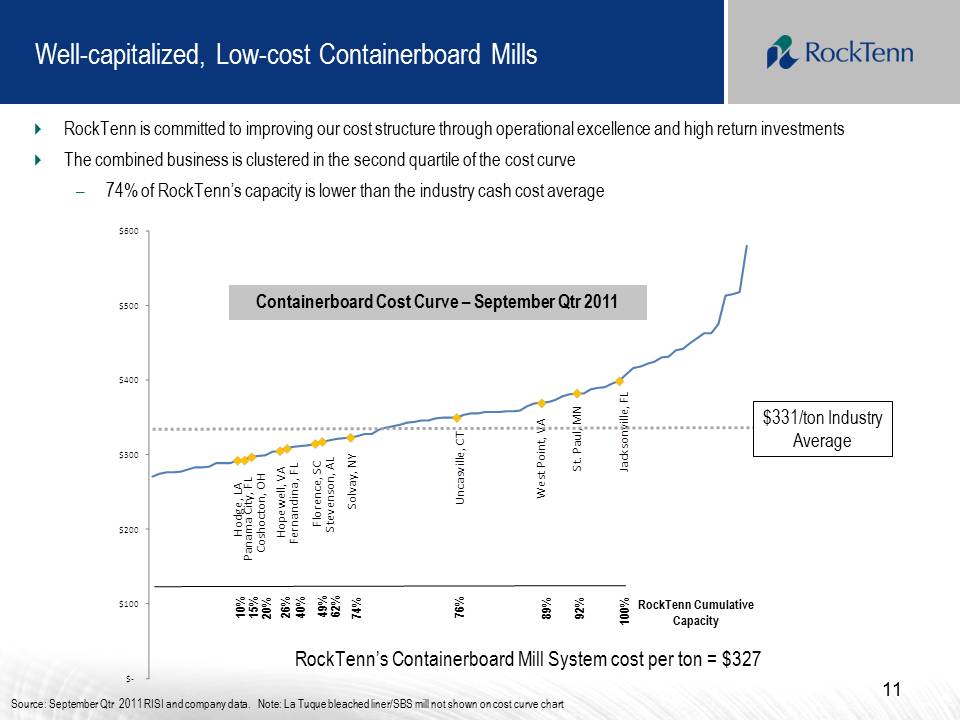
$‐ $100 $200 $300 $400 $500 $600 Hopewell, VA Florence, SC Panama City, FL Stevenson, AL Coshocton, OH Fernandina , FL Solvay, NY Jacksonville, FL Uncasville, CT West Point, VA St. Paul, MN Hodge, LA �� RockTenn is committed to improving our cost structure through operational excellence and high return investments �� The combined business is clustered in the second quartile of the cost curve – 74% of RockTenn’s capacity is lower than the industry cash cost average Well-capitalized, Low-cost Containerboard Mills $331/ton Industry Average Source: September Qtr 2011 RISI and company data. Note: La Tuque bleached liner/SBS mill not shown on cost curve chart Containerboard Cost Curve – September Qtr 2011 RockTenn’s Containerboard Mill System cost per ton = $327 RockTenn Cumulative Capacity 20% 15% 26% 100% 10% 74% 62% 49% 40% 92% 89% 76% 11
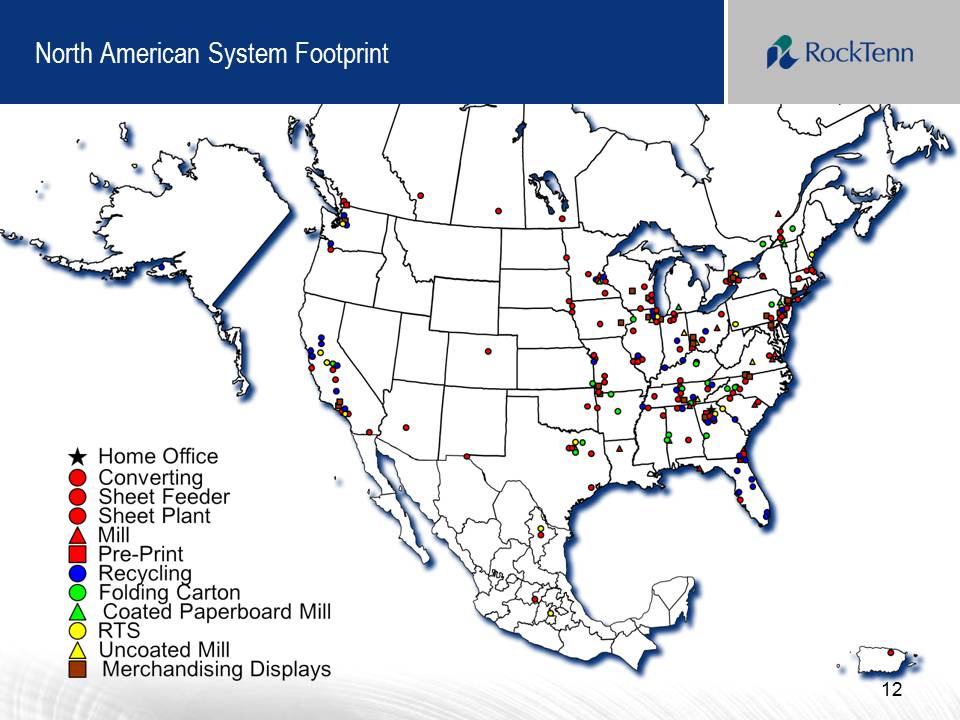
North American System Footprint 12 Home Office Converting Sheet Feeder Sheet Plant Mill Pre-Print Recycling Folding Carton Coated Paperboard Mill RTS Uncoated Mill Merchandising Displays
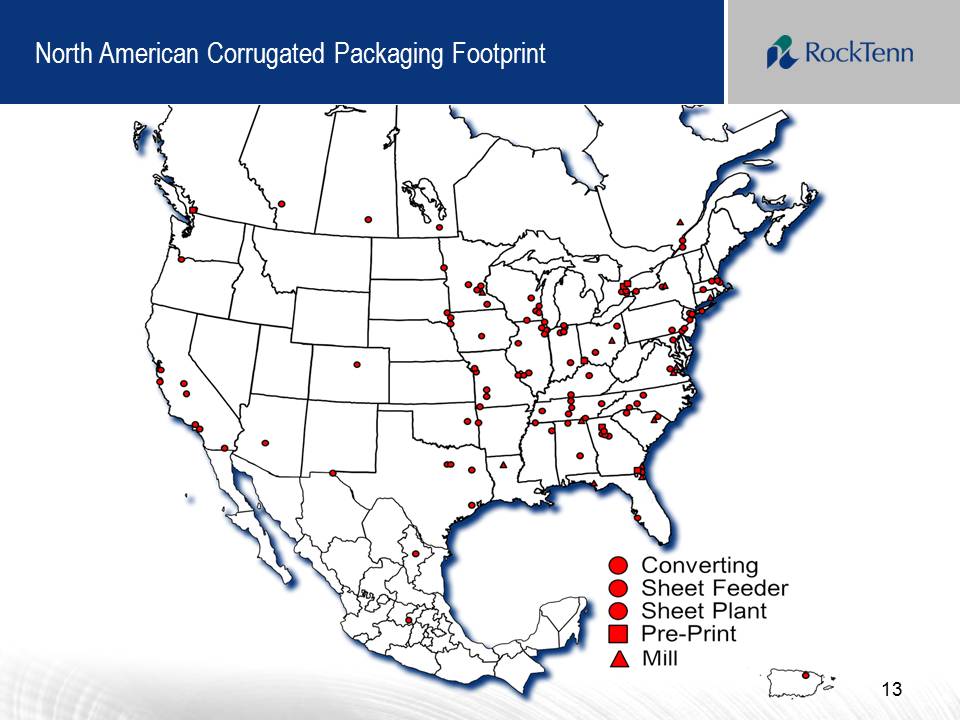
13 North American Corrugated Packaging Footprint Converting Sheet Feeder Sheet Plant Pre-Print Mill
Overview of Integration �� Applying the RockTenn business model to the box plant system, driving product innovation, customer satisfaction (product quality and service) and low-cost manufacturing �� Creating a single RockTenn culture �� Identifying and executing on opportunities within the operating businesses �� Investing in the mill assets with low cost, high return projects �� Consolidating administration activities – Leveraging purchasing opportunities – Standardizing systems, functional activities and processes �� Significant opportunity to improve a solid business and participate in an attractive market 14
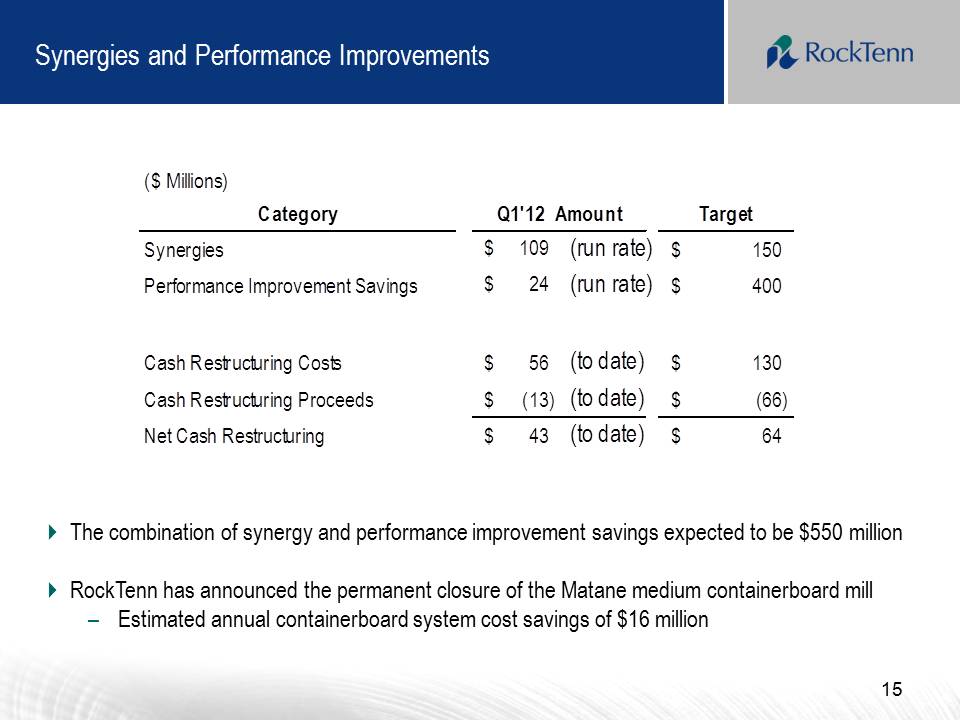
Synergies and Performance Improvements 15 ($ Millions) Category Target Synergies 109 $ (run rate) 150 $ Performance Improvement Savings 24 $ (run rate) 400 $ Cash Restructuring Costs 56 $ (to date) 130 $ Cash Restructuring Proceeds (13) $ (to date) (66) $ Net Cash Restructuring 43 $ (to date) 64 $ Q1'12 Amount �� The combination of synergy and performance improvement savings expected to be $550 million �� RockTenn has announced the permanent closure of the Matane medium containerboard mill – Estimated annual containerboard system cost savings of $16 million
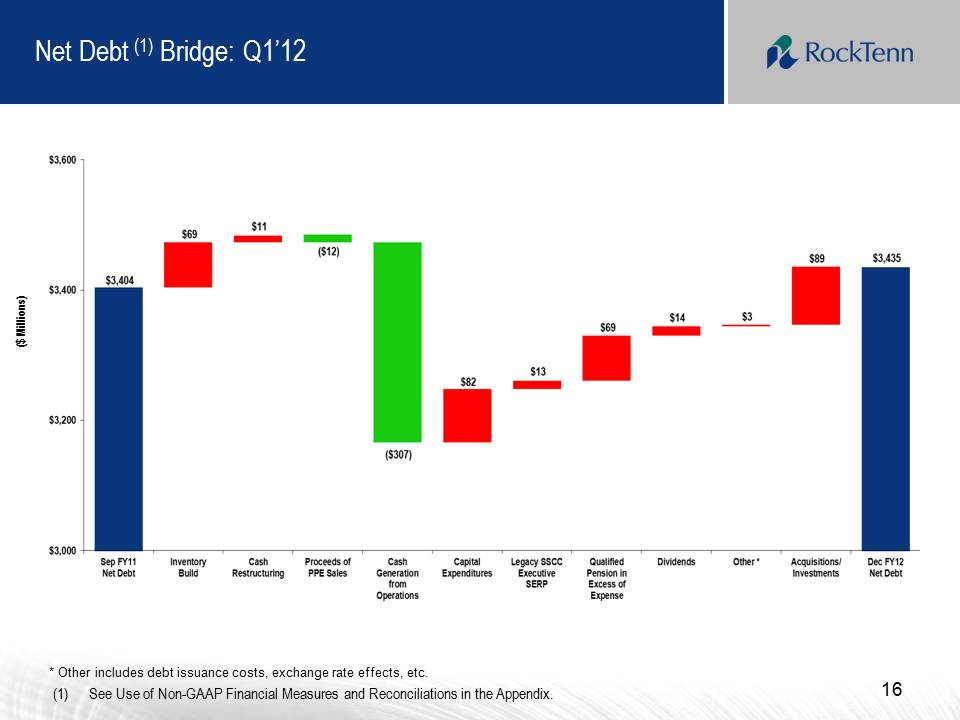
Net Debt (1) Bridge: Q1’12 * Other includes debt issuance costs, exchange rate effects, etc. 16 (1) See Use of Non-GAAP Financial Measures and Reconciliations in the Appendix. ($ Millions) $3,000 $3,200 $3,400 $3,600 $3,404 $69 $11 ($12) ($307) $82 $13 $69 $14 $3 $89 $3,435 Sep FY11 Net Debt Inventory Build Cash Restructuring Proceeds of PPE Sales Cash Generation from Operations Capital Expenditures Legacy SSCC Executive SERP Qualified Pension in Excess of Expense Dividends Other* Acquisitions/Investments Dec FY12 Net Debt
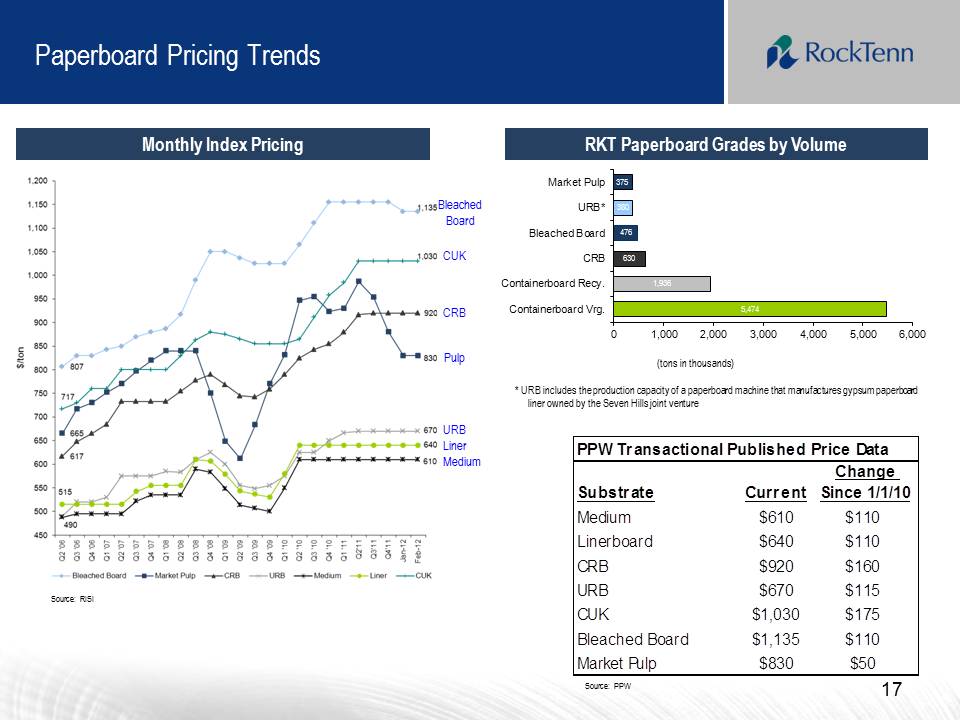
Liner Paperboard Pricing Trends Monthly Index Pricing Source: RISI Source: PPW RKT Paperboard Grades by Volume (tons in thousands) * URB includes the production capacity of a paperboard machine that manufactures gypsum paperboard liner owned by the Seven Hills joint venture Bleached Board CUK CRB Pulp URB Medium PPW Transactional Published Price Data Substrate Current Change Since 1/1/10 Medium $610 $110 Linerboard $640 $110 CRB $920 $160 URB $670 $115 CUK $1,030 $175 Bleached Board $1,135 $110 Market Pulp $830 $50 17 5,474 1,936 630 476 380 375 0 1,000 2,000 3,000 4,000 5,000 6,000 Containerboard Vrg. Containerboard Recy. CRB Bleached Board URB* Market Pulp
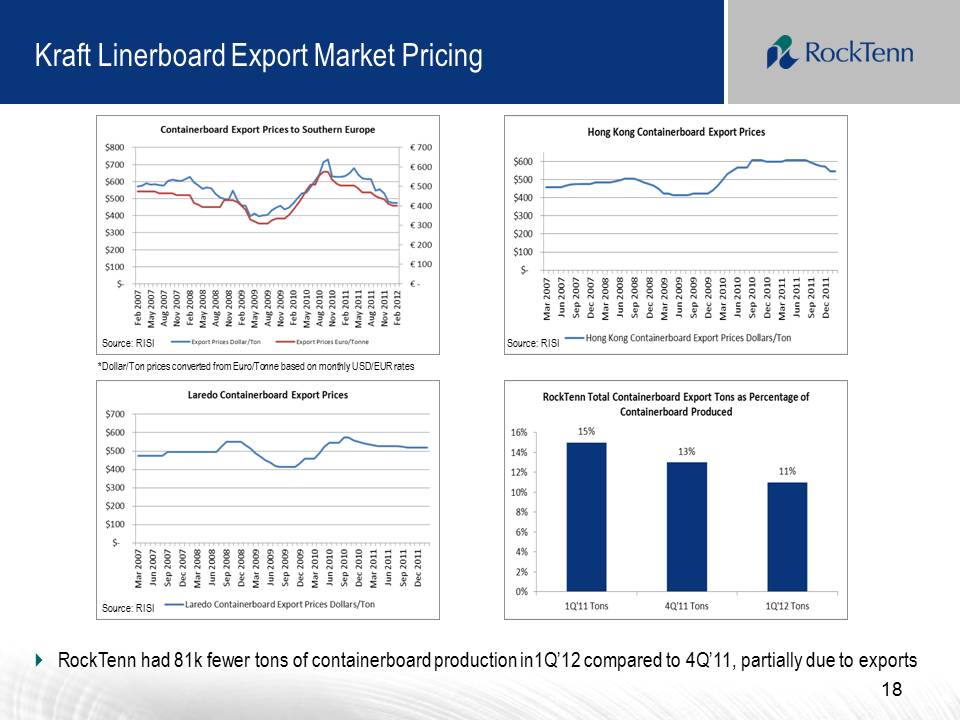
Kraft Linerboard Export Market Pricing Source: RISI �� RockTenn had 81k fewer tons of containerboard production in1Q’12 compared to 4Q’11, partially due to exports *Dollar/Ton prices converted from Euro/Tonne based on monthly USD/EUR rates 18 Source: RISI Source: RISI
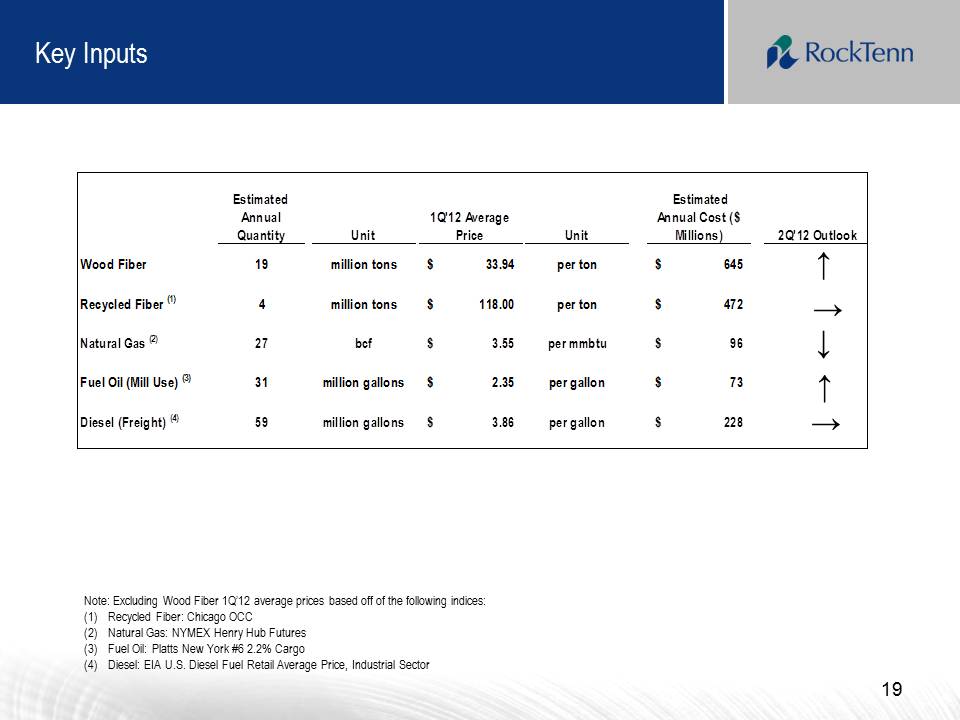
Estimated Annual Quantity Unit 1Q'12 Average Price Unit Estimated Annual Cost ($ Millions) 2Q'12 Outlook Wood Fiber 19 million tons 33.94 $ per ton 645 $ Recycled Fiber (1) 4 million tons 118.00 $ per ton 472 $ Natural Gas (2) 27 bcf 3.55 $ per mmbtu 96 $ Fuel Oil (Mill Use) (3) 31 million gallons 2.35 $ per gallon 73 $ Diesel (Freight) (4) 59 million gallons 3.86 $ per gallon 228 $ Key Inputs 19 Note: Excluding Wood Fiber 1Q’12 average prices based off of the following indices: (1) Recycled Fiber: Chicago OCC (2) Natural Gas: NYMEX Henry Hub Futures (3) Fuel Oil: Platts New York #6 2.2% Cargo (4) Diesel: EIA U.S. Diesel Fuel Retail Average Price, Industrial Sector
Conclusion �� The largest paper recycler in North America �� 2nd largest producer of containerboard and corrugated packaging in North America�� 2nd largest producer of clay-coated recycled paperboard and folding cartons in North America �� Significant ownership of strategically valuable virgin containerboard mills; balanced fiber mix of 55% virgin and 45% recycled �� Significant, quantified opportunities to improve results through cost reduction and capital investment �� Delivered results in first 7 months of ownership �� Leadership team with strong record of creating value and integrating acquisitions 20

Appendix 21
22 Use of Non-GAAP Financial Measures and Reconciliations Below, we define the non-GAAP financial measures, provide a reconciliation of each non-GAAP financial measure to the most directly comparable financial measure calculated in accordance with GAAP, and discuss the reasons that we believe this information is useful to management and may be useful to investors. These measures may differ from similarly captioned measures of other companies in our industry. Non-GAAP Measures Our definitions of Credit Agreement EBITDA and Segment EBITDA may differ from other similarly titled measures at other companies. Credit Agreement EBITDA (as defined) and Adjusted EBITDA (as defined) are not defined in accordance with GAAP and should not be viewed as alternatives to GAAP measures of operating results or liquidity. RockTenn management believes that net income is the most directly comparable GAAP measure to Credit Agreement EBITDA (as defined) and Segment Income is the most directly comparable GAAP measure to Segment EBITDA.
23 Non-GAAP Measures: Credit Agreement EBITDA, Segment EBITDA and Total Funded Debt (as defined) “Credit Agreement EBITDA” is calculated in accordance with the definition of “EBITDA” contained in the Company’s Credit Agreement. Credit Agreement EBITDA is generally defined as Consolidated Net Income, on a pro forma basis giving effect to the Smurfit-Stone Acquisition, plus: consolidated interest expense; consolidated tax expenses; depreciation and amortization expenses; charges and expenses for financing fees and expenses and write-offs of deferred financing fees and expenses, remaining portions of OID on prepayment of indebtedness, premiums due in respect of prepayment of indebtedness, and commitment fees in respect of financing commitments; various charges and expenses related to, or incurred in connection with, the Smurfit-Stone acquisition; costs and expenses relating to the integration of Smurfit-Stone and the achievement of synergies relating to the Smurfit-Stone acquisition; certain run-rate synergies expected to be achieved due to the Smurfit-Stone acquisition; all non-cash charges; all cash charges and expenses for plant and other facility closures and other cash restructuring charges; labor disruption charges; officer payments associated with any permitted acquisitions; “black liquor” expenses; cash charges and expenses incurred in respect of the Chapter 11 bankruptcy proceeding and plan of reorganization of Smurfit-Stone; and all non-recurring cash expenses taken in respect of any multi-employer and defined benefit pension plan obligations that are related to plant and other facilities closures. For additional information on the calculation see our Credit Agreement, dated as of May 27, 2011, filed as Exhibit 10.1 to our Form 8-K, dated May 27, 2011. “Segment EBITDA” is calculated as Segment Income plus segment depreciation and amortization. Segment EBITDA Margin is Segment EBITDA divided by segment sales. “Total Funded Debt” is calculated in accordance with the definition of “Total Funded Debt” contained in the Company’s Credit Agreement. Total Funded Debt is generally defined as aggregate debt obligations reflected in our balance sheet, less the hedge adjustments resulting from terminated and existing fair value interest rate derivatives or swaps, plus additional outstanding letters of credit not already reflected in debt, plus debt guarantees.
24 Non-GAAP Measures: Credit Agreement EBITDA, Segment EBITDA and Total Funded Debt Our management uses Credit Agreement EBITDA and Total Funded Debt to evaluate compliance with RockTenn’s debt covenants and borrowing capacity available under its Credit Agreement. Management also uses Credit Agreement EBITDA and Segment EBITDA as measures of our Company’s core operating performance. Management believes that investors also use these measures to evaluate the Company’s compliance with its debt covenants and available borrowing capacity. Management also believes that investors use Credit Agreement EBITDA and Segment EBITDA as measures of our Company’s core operating performance. Borrowing capacity is dependent upon, in addition to other measures, the “Total Funded Debt/EBITDA ratio” or the “Leverage Ratio,” which is defined as Total Funded Debt divided by Credit Agreement EBITDA.
25 Non-GAAP Measures: Net Debt We have defined the non-GAAP measure Net Debt to include the aggregate debt obligations reflected in our balance sheet, less the hedge adjustments resulting from terminated and existing fair value interest rate derivatives or swaps, the balance of our cash and cash equivalents, restricted cash (which includes the balance sheet line items restricted cash and restricted cash and marketable debt securities) and certain other investments that we consider to be readily available to satisfy such debt obligations. Our management uses Net Debt, along with other factors, to evaluate our financial condition. We believe that Net Debt is an appropriate supplemental measure of financial condition and may be useful to investors because it provides a more complete understanding of our financial condition before the impact of our decisions regarding the appropriate use of cash and liquid investments.
26 Non-GAAP Measures: Adjusted Net Income and Adjusted Earnings Per Diluted Share We also use the non-GAAP measures “adjusted net income” and “adjusted earnings per diluted share”. Management believes these non-GAAP financial measures provide our board of directors, investors, potential investors, securities analysts and others with useful information to evaluate the performance of the Company because it excludes restructuring and other costs, net, the alternative fuel mixture credit and cellulosic biofuel producer credit and other specific items that management believes are not indicative of the ongoing operating results of the business. The Company and the board of directors use this information to evaluate the Company’s performance relative to other periods.
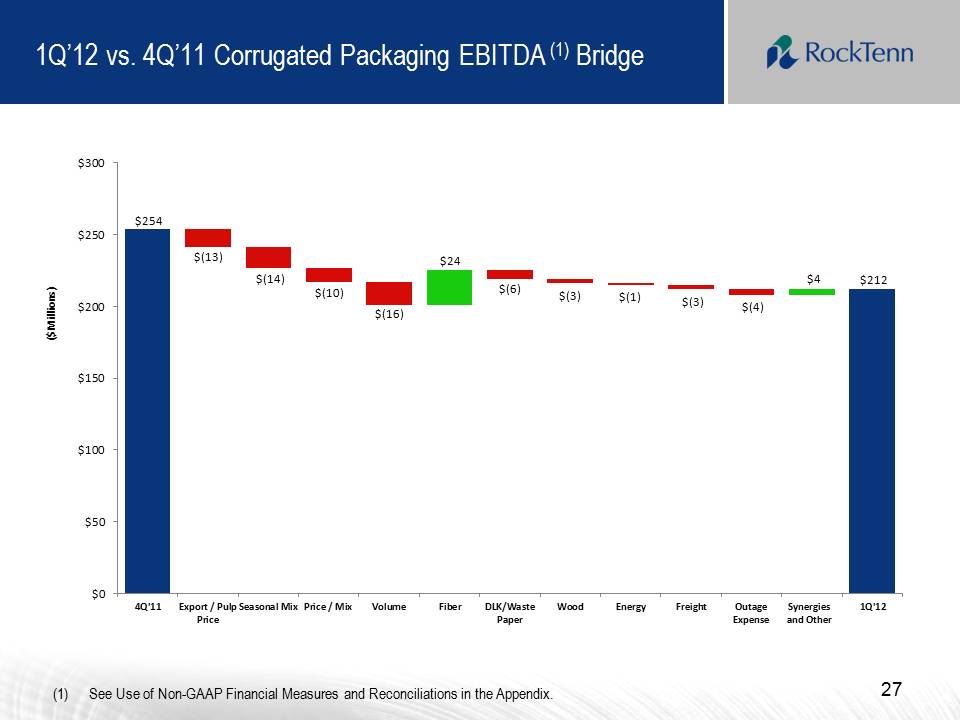
1Q’12 vs. 4Q’11 Corrugated Packaging EBITDA (1) Bridge 27 (1) See Use of Non-GAAP Financial Measures and Reconciliations in the Appendix. $254 $(13) $(14) $(10) $(16) $24 $(6) $(3) $(1) $(3) $(4) $4 $212 $0 $50 $100 $150 $200 $250 $300 4Q'11 Export / Pulp Price Seasonal Mix Price / Mix Volume Fiber DLK/Waste Paper Wood Energy Freight Outage Expense Synergies and Other 1Q'12 ($Millions)
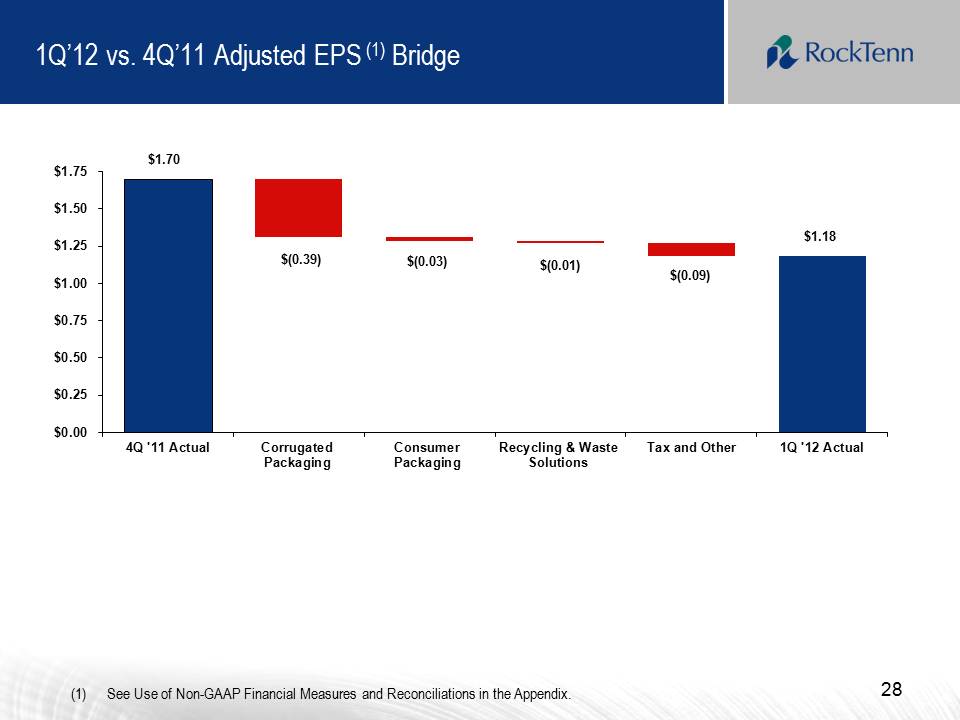
1Q’12 vs. 4Q’11 Adjusted EPS (1) Bridge 28 (1) See Use of Non-GAAP Financial Measures and Reconciliations in the Appendix. $1.70 $1.18 $(0.03) $(0.39) $(0.01) $(0.09) $0.00 $0.25 $0.50 $0.75 $1.00 $1.25 $1.50 $1.75 4Q '11 Actual Corrugated Packaging Consumer Packaging Recycling & Waste Solutions Tax and Other 1Q '12 Actual
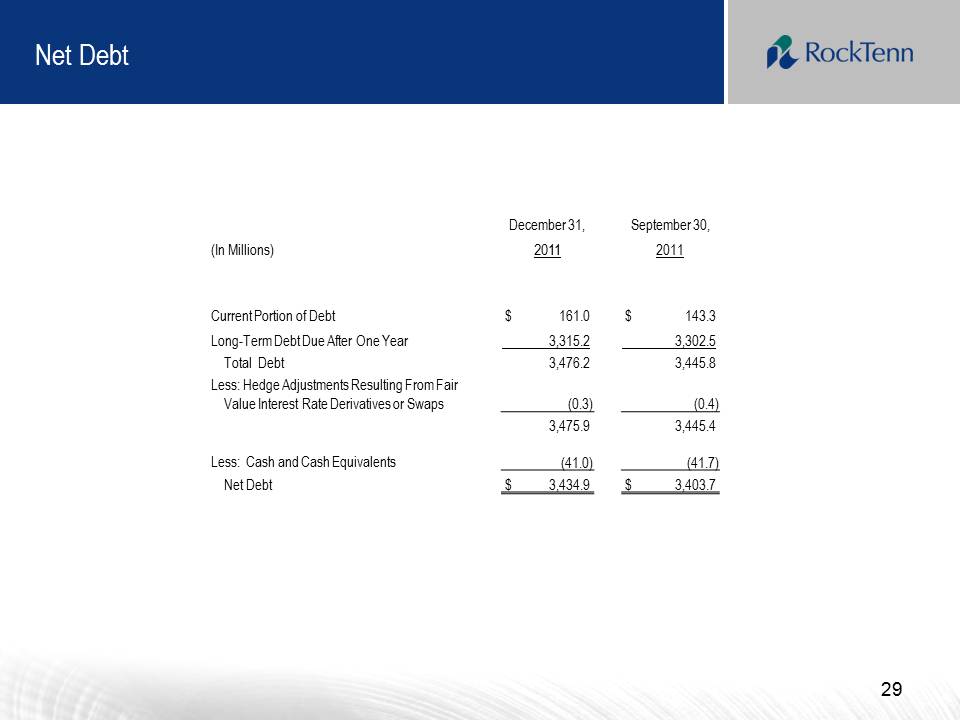
Net Debt 29 December 31, September 30, (In Millions) 2011 2011 Current Portion of Debt $ 161.0 $ 143.3 Long-Term Debt Due After One Year 3,315.2 3,302.5 Total Debt 3,476.2 3,445.8 Less: Hedge Adjustments Resulting From Fair Value Interest Rate Derivatives or Swaps (0.3) (0.4) 3,475.9 3,445.4 Less: Cash and Cash Equivalents (41.0) (41.7) Net Debt $ 3,434.9 $ 3,403.7
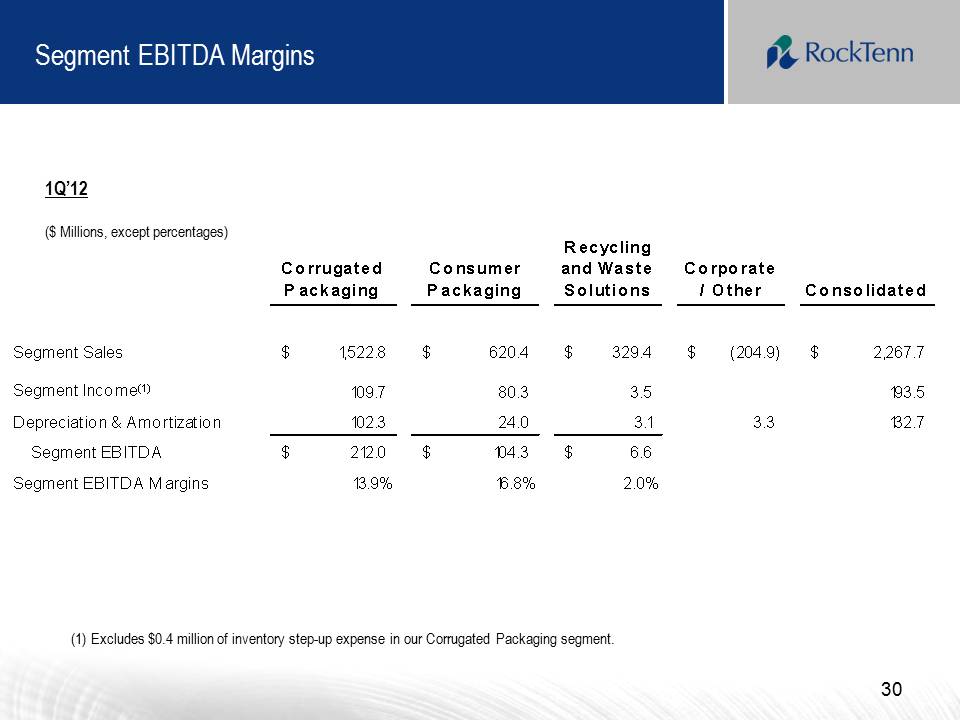
Segment EBITDA Margins 30 (1) Excludes $0.4 million of inventory step-up expense in our Corrugated Packaging segment. Corrugated Packaging Consumer Packaging Recycling and Waste Solutions Corporate / Other Consolidated Segment Sales 1,522.8 $ 620.4 $ 329.4 $ (204.9) $ 2,267.7 $ Segment Income(1) 109.7 80.3 3.5 193.5 Depreciation & Amortization 102.3 24.0 3.1 3.3 132.7 Segment EBITDA 212.0 $ 104.3 $ 6.6 $ Segment EBITDA M argins 13.9% 16.8% 2.0% 1Q’12 ($ Millions, except percentages)
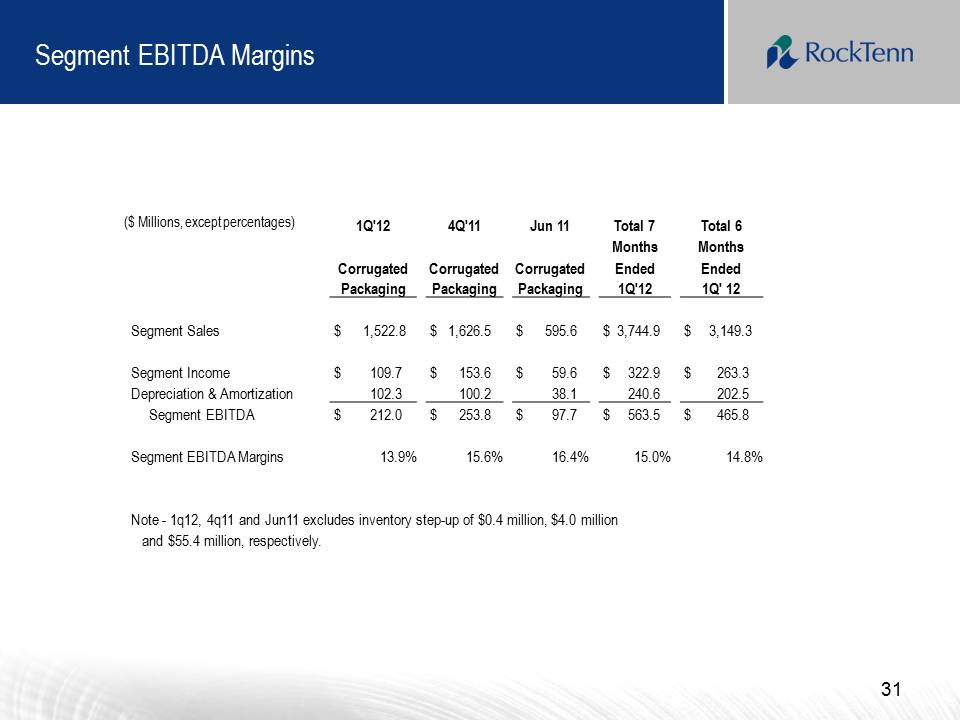
1Q'12 4Q'11 Jun 11 Total 7 Total 6 Months Months Corrugated Packaging Corrugated Packaging Corrugated Packaging Ended 1Q'12 Ended 1Q' 12 Segment Sales $ 1,522.8 $ 1,626.5 $ 595.6 $ 3,744.9 $ 3,149.3 Segment Income $ 109.7 $ 153.6 $ 59.6 $ 322.9 $ 263.3 Depreciation & Amortization 102.3 100.2 38.1 240.6 202.5 Segment EBITDA $ 212.0 $ 253.8 $ 97.7 $ 563.5 $ 465.8 Segment EBITDA Margins 13.9% 15.6% 16.4% 15.0% 14.8% Note - 1q12, 4q11 and Jun11 excludes inventory step-up of $0.4 million, $4.0 million and $55.4 million, respectively. Segment EBITDA Margins 31 ($ Millions, except percentages)
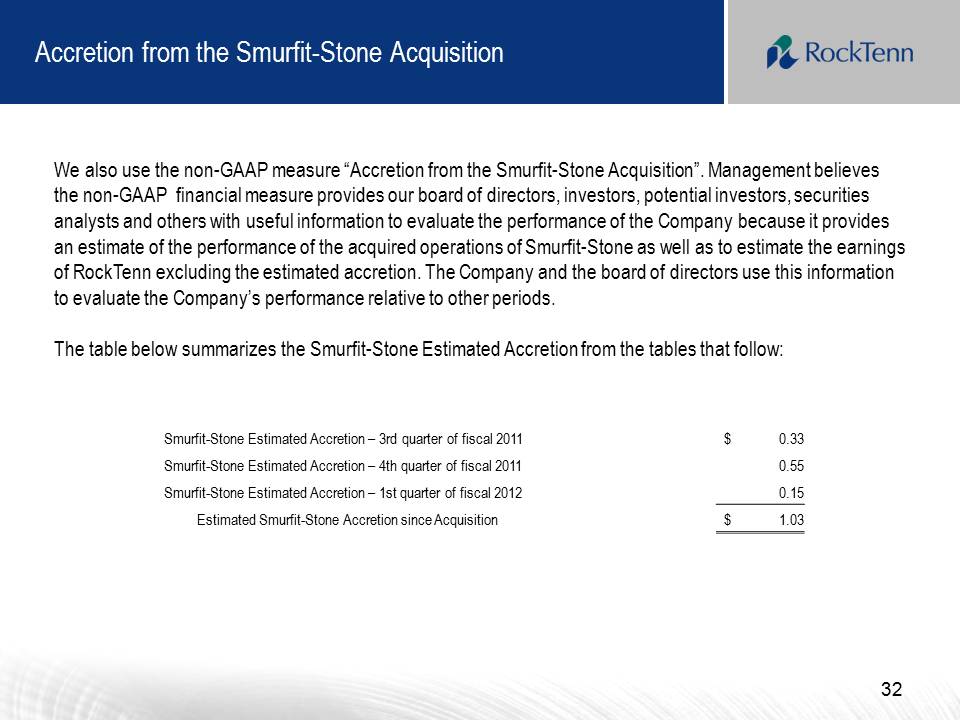
32 Accretion from the Smurfit-Stone Acquisition We also use the non-GAAP measure “Accretion from the Smurfit-Stone Acquisition”. Management believes the non-GAAP financial measure provides our board of directors, investors, potential investors, securities analysts and others with useful information to evaluate the performance of the Company because it provides an estimate of the performance of the acquired operations of Smurfit-Stone as well as to estimate the earnings of RockTenn excluding the estimated accretion. The Company and the board of directors use this information to evaluate the Company’s performance relative to other periods. The table below summarizes the Smurfit-Stone Estimated Accretion from the tables that follow: Smurfit-Stone Estimated Accretion – 3rd quarter of fiscal 2011 $ 0.33 Smurfit-Stone Estimated Accretion – 4th quarter of fiscal 2011 0.55 Smurfit-Stone Estimated Accretion – 1st quarter of fiscal 2012 0.15 Estimated Smurfit-Stone Accretion since Acquisition $ 1.03
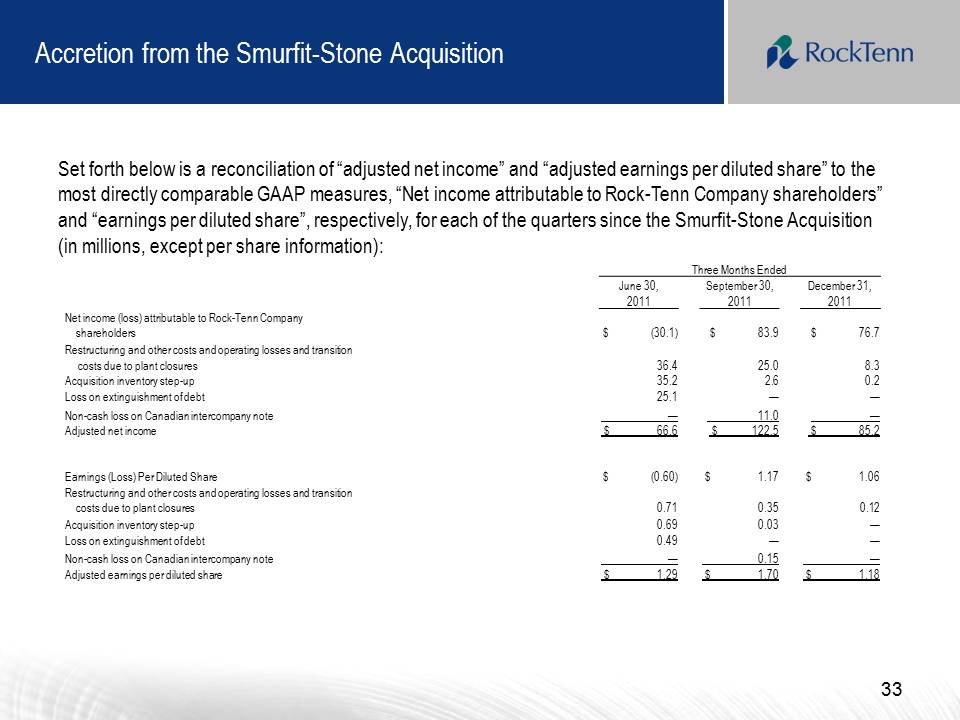
Accretion from the Smurfit-Stone Acquisition 33 Set forth below is a reconciliation of “adjusted net income” and “adjusted earnings per diluted share” to the most directly comparable GAAP measures, “Net income attributable to Rock-Tenn Company shareholders” and “earnings per diluted share”, respectively, for each of the quarters since the Smurfit-Stone Acquisition (in millions, except per share information): Three Months Ended June 30, September 30, December 31, 2011 2011 2011 Net income (loss) attributable to Rock-Tenn Company shareholders $ (30.1) $ 83.9 $ 76.7 Restructuring and other costs and operating losses and transition costs due to plant closures 36.4 25.0 8.3 Acquisition inventory step-up 35.2 2.6 0.2 Loss on extinguishment of debt 25.1 — — Non-cash loss on Canadian intercompany note — 11.0 — Adjusted net income $ 66.6 $ 122.5 $ 85.2 Earnings (Loss) Per Diluted Share $ (0.60) $ 1.17 $ 1.06 Restructuring and other costs and operating losses and transition costs due to plant closures 0.71 0.35 0.12 Acquisition inventory step-up 0.69 0.03 — Loss on extinguishment of debt 0.49 — — Non-cash loss on Canadian intercompany note — 0.15 — Adjusted earnings per diluted share $ 1.29 $ 1.70 $ 1.18
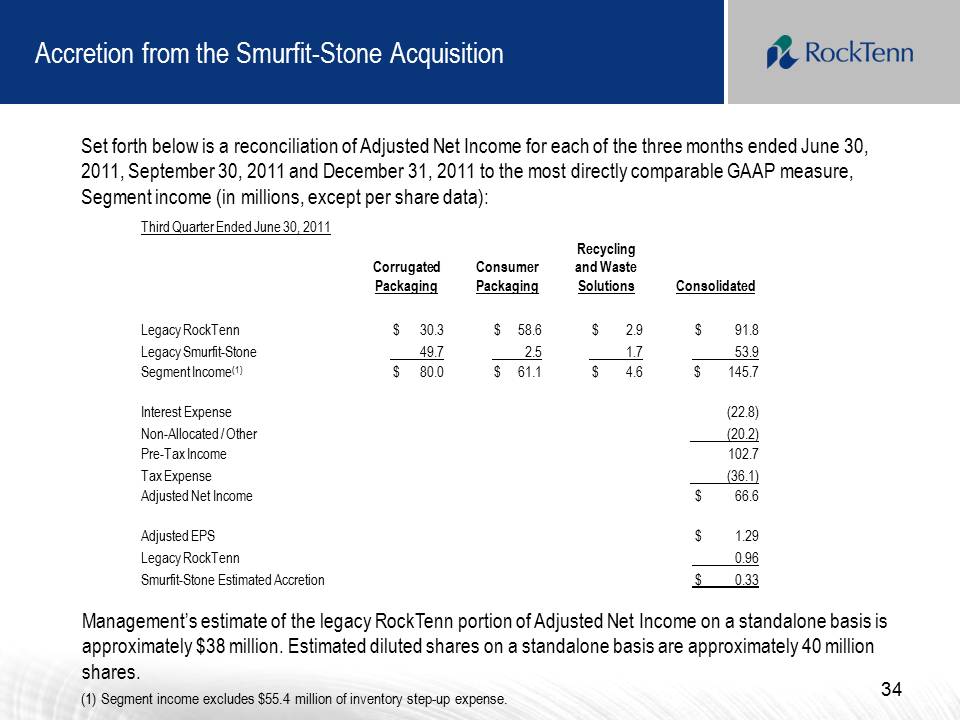
34 Accretion from the Smurfit-Stone Acquisition Set forth below is a reconciliation of Adjusted Net Income for each of the three months ended June 30, 2011, September 30, 2011 and December 31, 2011 to the most directly comparable GAAP measure, Segment income (in millions, except per share data): Third Quarter Ended June 30, 2011 Recycling Corrugated Consumer and Waste Packaging Packaging Solutions Consolidated Legacy RockTenn $ 30.3 $ 58.6 $ 2.9 $ 91.8 Legacy Smurfit-Stone 49.7 2.5 1.7 53.9 Segment Income(1) $ 80.0 $ 61.1 $ 4.6 $ 145.7 Interest Expense (22.8) Non-Allocated / Other (20.2) Pre-Tax Income 102.7 Tax Expense (36.1) Adjusted Net Income $ 66.6 Adjusted EPS $ 1.29 Legacy RockTenn 0.96 Smurfit-Stone Estimated Accretion $ 0.33 (1) Segment income excludes $55.4 million of inventory step-up expense. Management’s estimate of the legacy RockTenn portion of Adjusted Net Income on a standalone basis is approximately $38 million. Estimated diluted shares on a standalone basis are approximately 40 million shares.
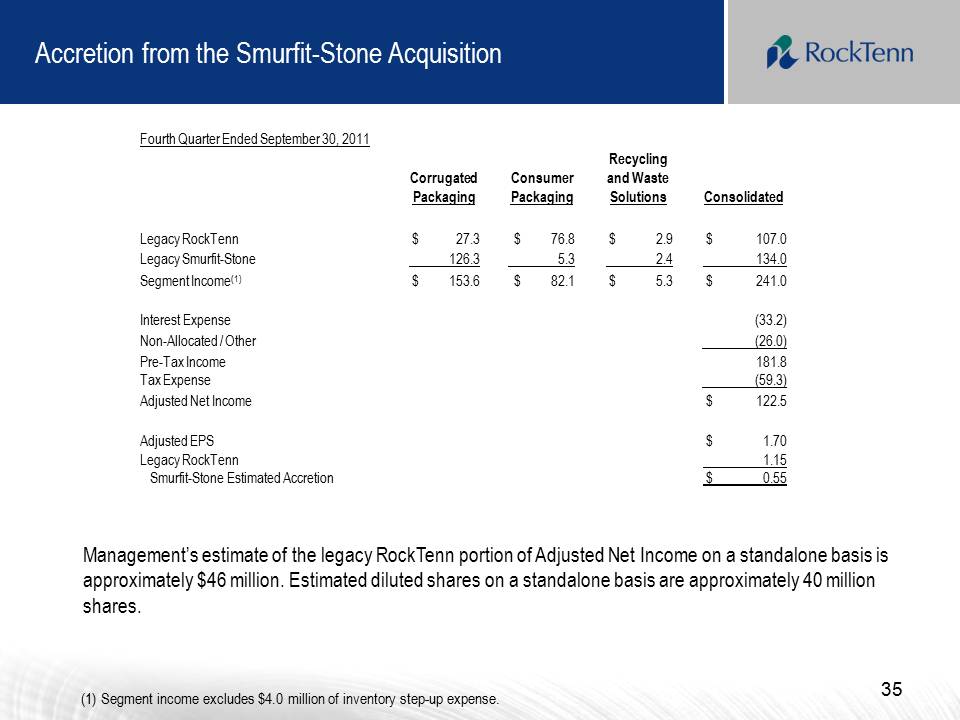
35 Accretion from the Smurfit-Stone Acquisition Fourth Quarter Ended September 30, 2011 Recycling Corrugated Consumer and Waste Packaging Packaging Solutions Consolidated Legacy RockTenn $ 27.3 $ 76.8 $ 2.9 $ 107.0 Legacy Smurfit-Stone 126.3 5.3 2.4 134.0 Segment Income(1) $ 153.6 $ 82.1 $ 5.3 $ 241.0 Interest Expense (33.2) Non-Allocated / Other (26.0) Pre-Tax Income 181.8 Tax Expense (59.3) Adjusted Net Income $ 122.5 Adjusted EPS $ 1.70 Legacy RockTenn 1.15 Smurfit-Stone Estimated Accretion $ 0.55 Management’s estimate of the legacy RockTenn portion of Adjusted Net Income on a standalone basis is approximately $46 million. Estimated diluted shares on a standalone basis are approximately 40 million shares. (1) Segment income excludes $4.0 million of inventory step-up expense.
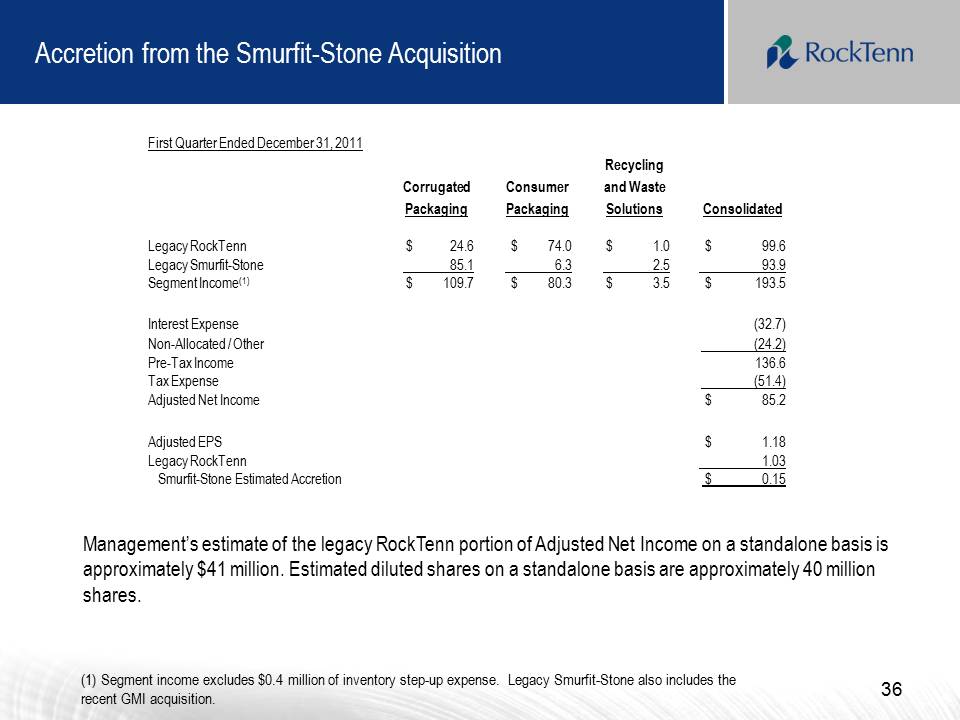
36 Accretion from the Smurfit-Stone Acquisition Management’s estimate of the legacy RockTenn portion of Adjusted Net Income on a standalone basis is approximately $41 million. Estimated diluted shares on a standalone basis are approximately 40 million shares. (1) Segment income excludes $0.4 million of inventory step-up expense. Legacy Smurfit-Stone also includes the recent GMI acquisition. First Quarter Ended December 31, 2011 Recycling Corrugated Consumer and Waste Packaging Packaging Solutions Consolidated Legacy RockTenn $ 24.6 $ 74.0 $ 1.0 $ 99.6 Legacy Smurfit-Stone 85.1 6.3 2.5 93.9 Segment Income(1) $ 109.7 $ 80.3 $ 3.5 $ 193.5 Interest Expense (32.7) Non-Allocated / Other (24.2) Pre-Tax Income 136.6 Tax Expense (51.4) Adjusted Net Income $ 85.2 Adjusted EPS $ 1.18 Legacy RockTenn 1.03 Smurfit-Stone Estimated Accretion $ 0.15
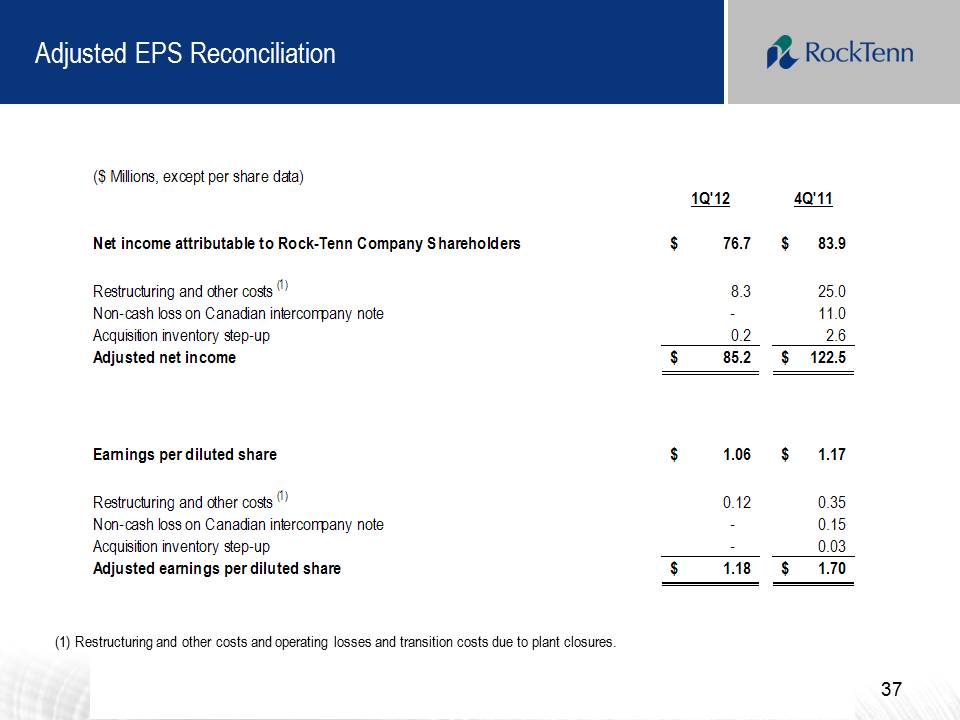
Adjusted EPS Reconciliation 37 ($ Millions, except per share data) 1Q'12 4Q'11 Net income attributable to Rock-Tenn Company Shareholders 76.7 $ 83.9 $ Restructuring and other costs (1) 8.3 25.0 Non-cash loss on Canadian intercompany note - 11.0 Acquisition inventory step-up 0.2 2.6 Adjusted net income 85.2 $ 122.5 $ Earnings per diluted share 1.06 $ 1.17 $ Restructuring and other costs (1) 0.12 0.35 Non-cash loss on Canadian intercompany note - 0.15 Acquisition inventory step-up - 0.03 Adjusted earnings per diluted share 1.18 $ 1.70 $ (1) Restructuring and other costs and operating losses and transition costs due to plant closures.
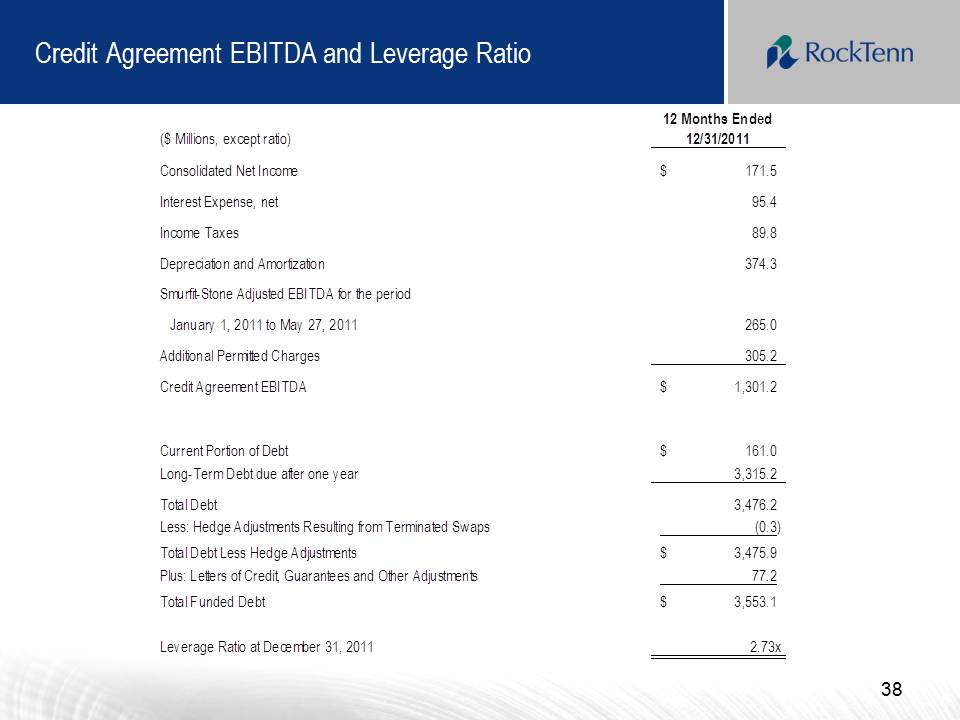
Credit Agreement EBITDA and Leverage Ratio 38 ($ Millions, except ratio) 12 Months Ended 12/31/2011 Consolidated Net Income 171.5 $ Interest Expense, net 95.4 Income Taxes 89.8 Depreciation and Amortization 374.3 Smurfit-Stone Adjusted EBITDA for the period January 1, 2011 to May 27, 2011 265.0 Additional Permitted Charges 305.2 Credit Agreement EBITDA 1,301.2 $ Current Portion of Debt 161.0 $ Long-Term Debt due after one year 3,315.2 Total Debt 3,476.2 Less: Hedge Adjustments Resulting from Terminated Swaps (0.3) Total Debt Less Hedge Adjustments 3,475.9 $ Plus: Letters of Credit, Guarantees and Other Adjustments 77.2 Total Funded Debt 3,553.1 $ Leverage Ratio at December 31, 2011 2.73x
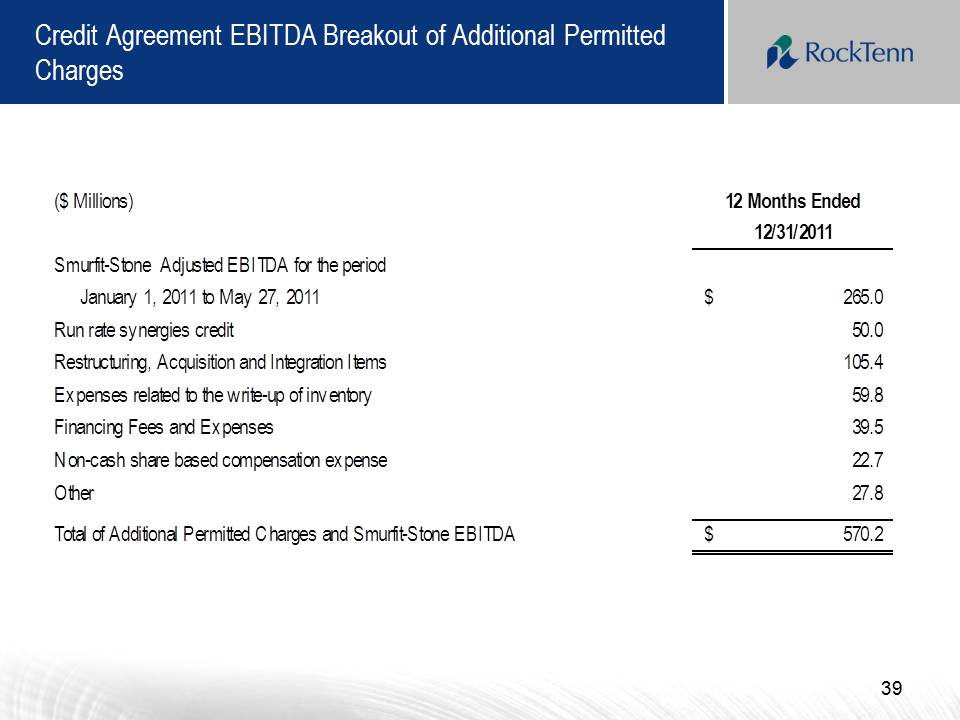
Credit Agreement EBITDA Breakout of Additional Permitted Charges 39 ($ Millions) 12 Months Ended 12/31/2011 Smurfit-Stone Adjusted EBITDA for the period January 1, 2011 to May 27, 2011 265.0 $ Run rate synergies credit 50.0 Restructuring, Acquisition and Integration Items 105.4 Expenses related to the write-up of inventory 59.8 Financing Fees and Expenses 39.5 Non-cash share based compensation expense 22.7 Other 27.8 Total of Additional Permitted Charges and Smurfit-Stone EBITDA 570.2 $
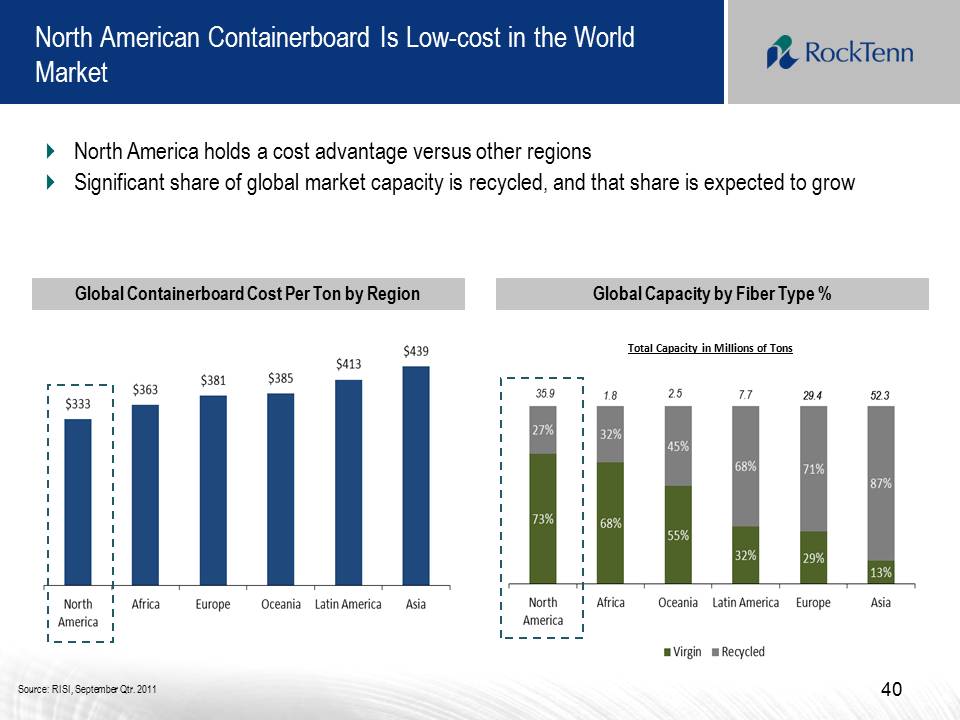
40 North American Containerboard Is Low-cost in the World Market �� North America holds a cost advantage versus other regions �� Significant share of global market capacity is recycled, and that share is expected to grow Global Capacity by Fiber Type % Global Containerboard Cost Per Ton by Region Source: RISI, September Qtr. 2011 Total Capacity in Millions of Tons North America Africa Europe Oceania Latin America Asia $333 $363 $381 $385 $413 $439 Total Capacity in Millions of Tons 735% 27% 35.9 1.8 2.5 7.7 29.4 52.3 32% 45% 68% 71% 87% 68% 55% 32% 29% 13% Virgin Recycled
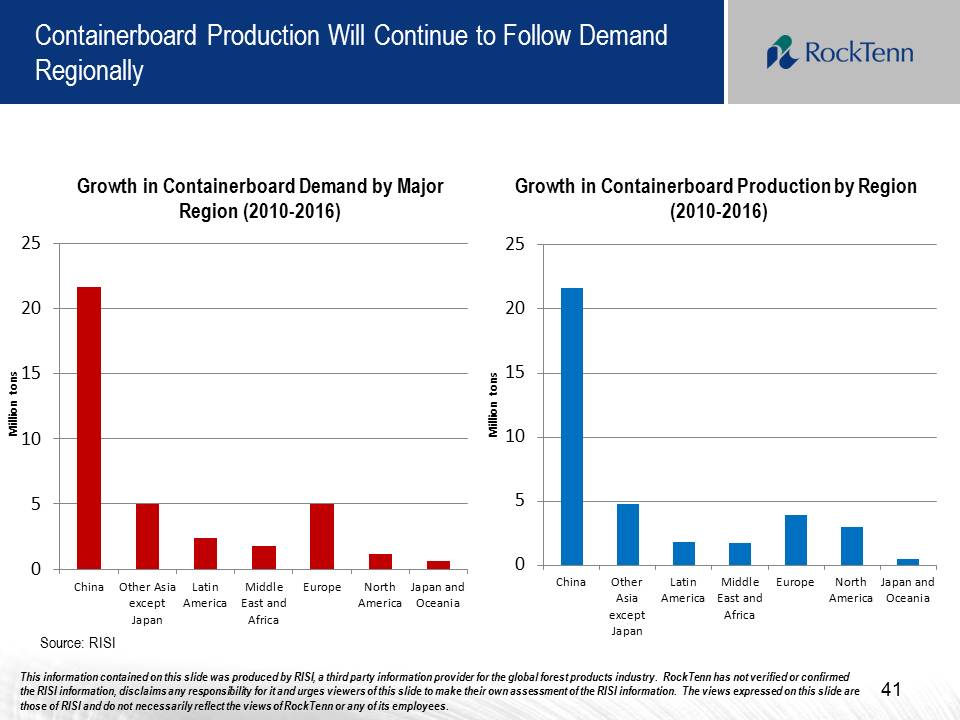
Containerboard Production Will Continue to Follow Demand Regionally Growth in Containerboard Demand by Major Region (2010-2016) Growth in Containerboard Production by Region (2010-2016) Source: RISI 41 0 5 10 15 20 25 China Other Asia except Japan Latin America Middle East and Africa Europe North America Japan and Oceania Million tons 0 5 10 15 20 25 China Other Asia Except Japan Latin America Middle East and Africa Europe North America Japan and Oceania Million tons This information contained on this slide was produced by RISI, a third party information provider for the global forest products industry. RockTenn has not verified or confirmed the RISI information, disclaims any responsibility for it and urges viewers of this slide to make their own assessment of the RISI information. The views expressed on this slide are those of RISI and do not necessarily reflect the views of RockTenn or any of its employees.
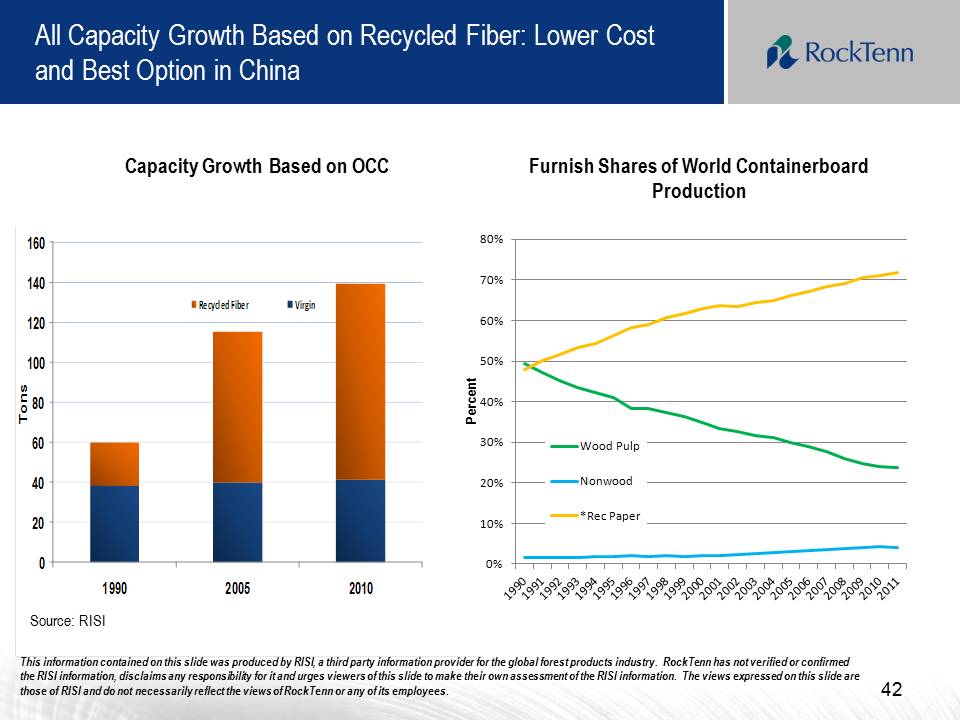
All Capacity Growth Based on Recycled Fiber: Lower Cost and Best Option in China Capacity Growth Based on OCC 0 20 40 60 80 100 120 140 160 1990 2005 2010 Tons Recycled Fiber Virgin Furnish Shares of World Containerboard Production Source: RISI Percent 42 0% 10% 20% 30% 40% 50% 60% 70% 80% Wood Pulp Nonwood *Rec Paper This information contained on this slide was produced by RISI, a third party information provider for the global forest products industry. RockTenn has not verified or confirmed the RISI information, disclaims any responsibility for it and urges viewers of this slide to make their own assessment of the RISI information. The views expressed on this slide are those of RISI and do not necessarily reflect the views of RockTenn or any of its employees.
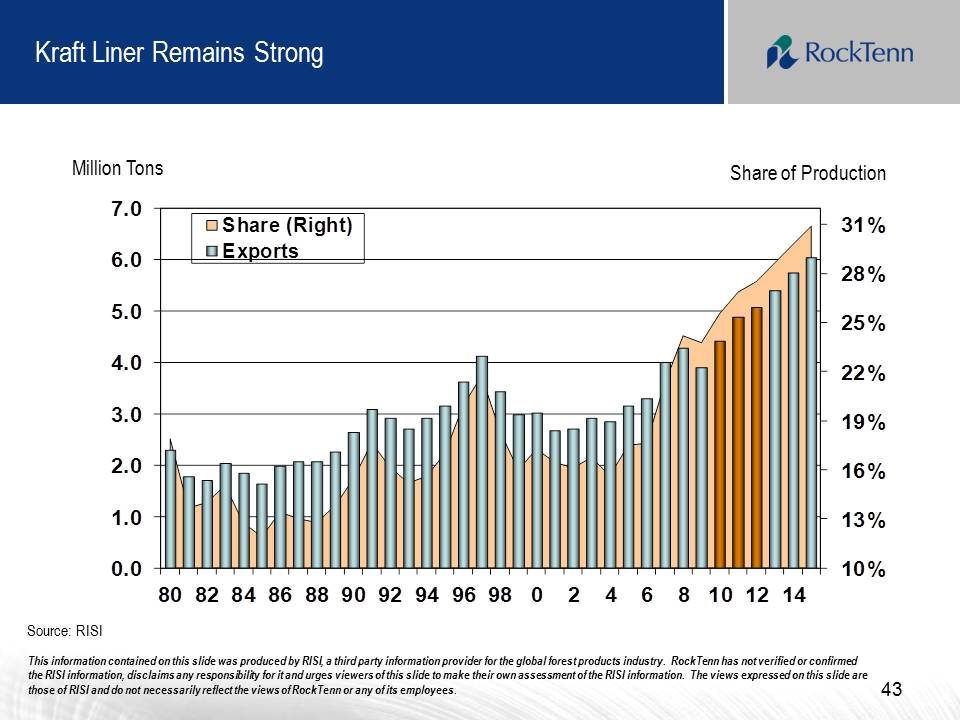
Kraft Liner Remains Strong Million Tons Share of Production Source: RISI 43 10% 13% 16% 19% 22% 25% 28% 31% 0.0 1.0 2.0 3.0 4.0 5.0 6.0 7.0 80 82 84 86 88 90 92 94 96 98 0 2 4 6 8 10 12 14 Share (Right) Exports This information contained on this slide was produced by RISI, a third party information provider for the global forest products industry. RockTenn has not verified or confirmed the RISI information, disclaims any responsibility for it and urges viewers of this slide to make their own assessment of the RISI information. The views expressed on this slide are those of RISI and do not necessarily reflect the views of RockTenn or any of its employees.
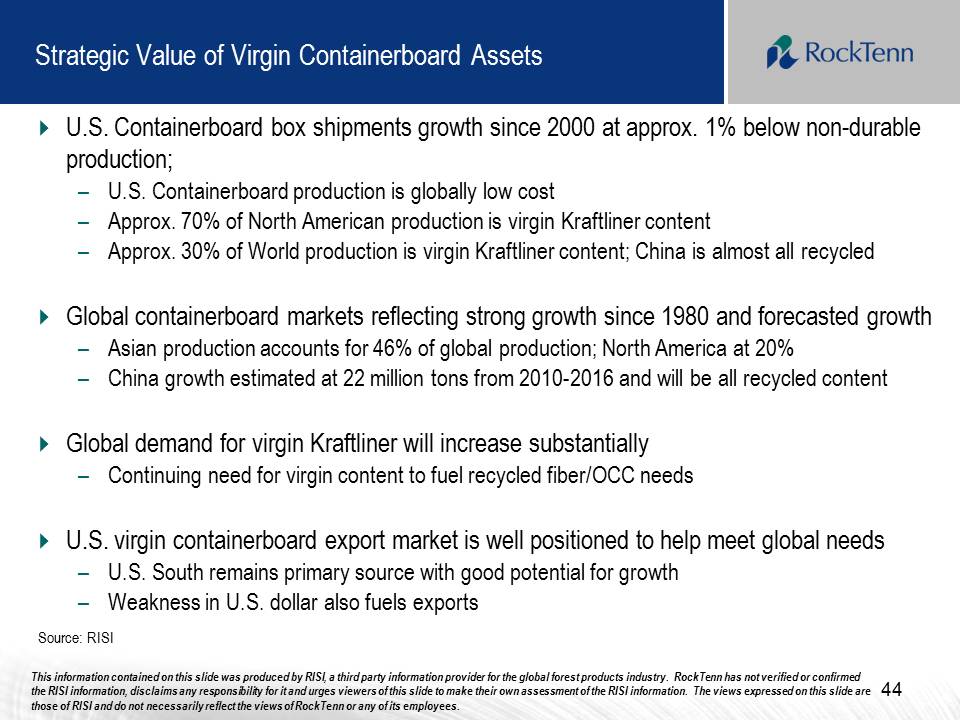
Strategic Value of Virgin Containerboard Assets �� U.S. Containerboard box shipments growth since 2000 at approx. 1% below non-durable production; – U.S. Containerboard production is globally low cost – Approx. 70% of North American production is virgin Kraftliner content – Approx. 30% of World production is virgin Kraftliner content; China is almost all recycled �� Global containerboard markets reflecting strong growth since 1980 and forecasted growth – Asian production accounts for 46% of global production; North America at 20% – China growth estimated at 22 million tons from 2010-2016 and will be all recycled content �� Global demand for virgin Kraftliner will increase substantially – Continuing need for virgin content to fuel recycled fiber/OCC needs �� U.S. virgin containerboard export market is well positioned to help meet global needs – U.S. South remains primary source with good potential for growth – Weakness in U.S. dollar also fuels exports 44 Source: RISI This information contained on this slide was produced by RISI, a third party information provider for the global forest products industry. RockTenn has not verified or confirmed the RISI information, disclaims any responsibility for it and urges viewers of this slide to make their own assessment of the RISI information. The views expressed on this slide are those of RISI and do not necessarily reflect the views of RockTenn or any of its employees.
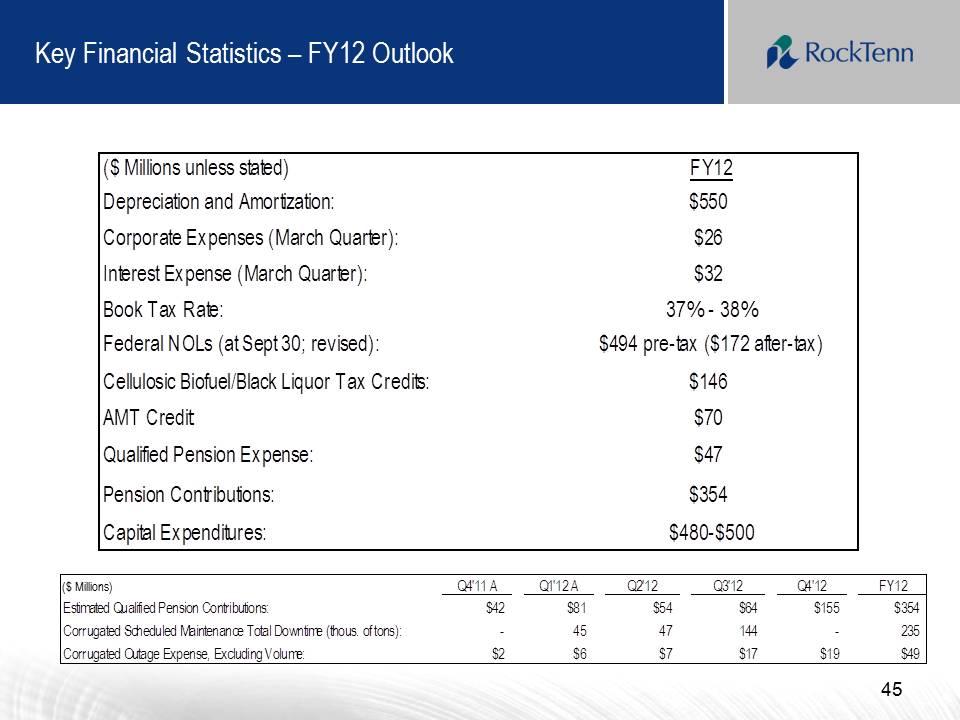
Key Financial Statistics – FY12 Outlook ($ Millions unless stated) FY12 Depreciation and Amortization: $550 Corporate Expenses (March Quarter): $26 Interest Expense (March Quarter): $32 Book Tax Rate: 37% - 38% Federal NOLs (at Sept 30; revised): $494 pre-tax ($172 after-tax) Cellulosic Biofuel/Black Liquor Tax Credits: $146 AMT Credit: $70 Qualified Pension Expense: $47 Pension Contributions: $354 Capital Expenditures: $480-$500 Q4'11 A Q1'12 A Q2'12 Q3'12 Q4'12 FY12 Estimated Qualified Pension Contributions: $42 $81 $54 $64 $155 $354 Corrugated Scheduled Maintenance Total Downtime (thous. of tons): - 45 47 144 – 235 Corrugated Outage Expense, Excluding Volume: $2 $6 $7 $17 $19 $49 ($ Millions) 45
RockTenn