Attached files
| file | filename |
|---|---|
| 8-K - FORM 8-K - Bridge Capital Holdings | v304746_8k.htm |

Daniel P. Myers President Chief Executive Officer Director Thomas A. Sa Executive Vice President Chief Financial Officer Chief Strategy Officer NASDAQ: BBNK WWW.BRIDGECAPITALHOLDINGS.COM Bridge Capital Holdings Investor Update – 4 th Quarter 2011 SANDLER O'NEILL + PARTNERS L.P. WEST COAST FINANCIAL SERVICES CONFERENCE

Forward Looking Statements Certain matters discussed herein constitute forward - looking statements within the meaning of the Private Securities Litigation Reform Act of 1995 , and are subject to the safe harbors created by that Act . Forward - looking statements describe future plans, strategies, and expectations, and are based on currently available information, expectations, assumptions, projections, and management's judgment about the Bank, the banking industry and general economic conditions . These forward looking statements are subject to certain risks and uncertainties that could cause the actual results, performance or achievements to differ materially from those expressed, suggested or implied by the forward looking statements . These risks and uncertainties include, but are not limited to : ( 1 ) competitive pressures in the banking industry ; ( 2 ) changes in interest rate environment ; ( 3 ) general economic conditions, nationally, regionally, and in operating markets ; ( 4 ) changes in the regulatory environment ; ( 5 ) changes in business conditions and inflation ; ( 6 ) changes in securities markets ; ( 7 ) future credit loss experience ; ( 8 ) the ability to satisfy requirements related to the Sarbanes - Oxley Act and other regulation on internal control ; ( 9 ) civil disturbances or terrorist threats or acts, or apprehension about the possible future occurrences of acts of this type ; and ( 10 ) the involvement of the United States in war or other hostilities . The reader should refer to the more complete discussion of such risks in Bridge Capital Holdings reports on Forms 10 - K and 10 - Q on file with the SEC . 2

■ Total Assets $ 1.2 billion ■ Total Loans $ 762.0 million ■ Total Deposits $ 998.7 million ■ Total Stockholders' Equity $ 129.5 million ■ CPP Preferred Redeemed (Q1 ‘11) ■ TCE/TA 11.15% ■ Tier 1 RBC Ratio 14.80% ■ Total RBC Ratio 16.06% ■ Loans/Deposits 76.30% ■ Cost of Deposits 11 bps ■ Net Interest Margin 4.90% ■ Efficiency Ratio 72.68% ■ ROAA 0.75% ■ ROAE 6.12% ■ FY11 Net Income $ 7.8 million Financial Highlights 3 Balance sheet data at FYE 2011; operating data FY 2011
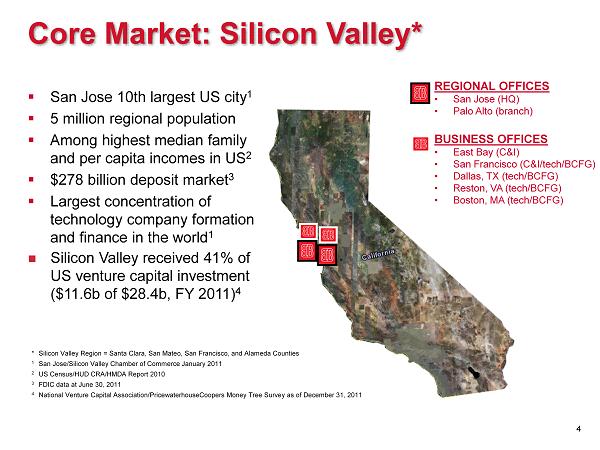
Core Market: Silicon Valley* ▪ San Jose 10th largest US city 1 ▪ 5 million regional population ▪ Among highest median family and per capita incomes in US 2 ▪ $278 billion deposit market 3 ▪ Largest concentration of technology company formation and finance in the world 1 Silicon Valley received 41% of US venture capital investment ($11.6b of $28.4b, FY 2011) 4 REGIONAL OFFICES • San Jose (HQ) • Palo Alto (branch) BUSINESS OFFICES • East Bay (C&I) • San Francisco (C&I/tech/BCFG) • Dallas, TX (tech/BCFG) • Reston, VA (tech/BCFG) • Boston, MA (tech/BCFG) * Silicon Valley Region = Santa Clara, San Mateo, San Francisco, and Alameda Counties 1 San Jose/Silicon Valley Chamber of Commerce January 2011 2 US Census/HUD CRA/HMDA Report 2010 3 FDIC data at June 30, 2011 4 National Venture Capital Association/PricewaterhouseCoopers Money Tree Survey as of December 31, 2011 4

Business Banking Focus ▪ Relationship Business Banking ▪ Solutions for All Lines of Business: Commercial & Industrial Technology & Emerging Business Structured Finance Small Business Administration I nternational Trade Banking & Services Commercial Real Estate & Construction Advanced Treasury & Cash Management 5

BBNK 2011 Summary ▪ Strong performance across all areas of the Company’s business ▪ Operating profit of $7.8 million +203% from FY 2010 ▪ Revenue growth of $9.4 million / +19% over 2010 ▪ Consistent balance sheet growth core deposits +18% over 2010 loans outstanding +17% over 2010 ▪ Continued credit quality improvement 1.38% NPA / Assets $394,000 in net recoveries 157% ALLL / NPL ▪ Exceptionally well capitalized TCE of 11.15% 6

Expanding Market Presence $250 $500 $750 $1,000 $1,250 2005 2006 2007 2008 2009 2010 2011 $ Millions Average Total Assets Core deposit driven Purely organic growth $1.16b total assets EOP Q4 ’11 7

Focus on Core Deposits 40% 31% 30% 34% 47% 52% 67% $0 $250 $500 $750 $1,000 $1,250 2005 2006 2007 2008 2009 2010 2011 $ Millions (EOP) Deposit Mix Noninterest-bearing Demand Money Market and Savings Certificates of Deposit 96% core deposits Cost of deposits • 11 bps Q4 ‘11 8

SBA 11% CRE 18% Construction 6% Land 1% Other 3% ABL/F 19% Tech 19% C&I 24% Commercial Lending 62% Loans as of 12 - 31 - 11 True C & I Focus BBNK % RE = 38% ( 62% Non - RE) Peer* % RE = 81% (19% Non - RE) * Peer – SNL Data: US Public Banks $500M - $1.5b Total Assets as of September 30, 2011 ** Asset - based lending / Factoring 9 **

2.00% 3.00% 4.00% 5.00% 6.00% 7.00% 8.00% 2005 2006 2007 2008 2009 2010 2011 NET INTEREST MARGIN BBNK BAC WFC CMA SIVB HTBK High Value Business Peer* Average 3.90% BBNK: 4.90% 10 *= Peer – SNL Data: US Public Banks $500M - $1.5b Total Assets as of September 30, 2011

$- $10 $20 $30 $40 $50 $60 $70 2005 2006 2007 2008 2009 2010 2011 $MM Improving Operating Leverage REVENUE Non - Interest Expense 11
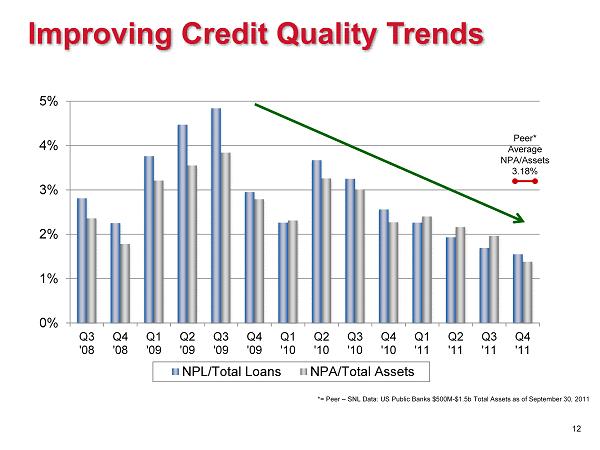
Improving Credit Quality Trends 0% 1% 2% 3% 4% 5% Q3 '08 Q4 '08 Q1 '09 Q2 '09 Q3 '09 Q4 '09 Q1 '10 Q2 '10 Q3 '10 Q4 '10 Q1 '11 Q2 '11 Q3 '11 Q4 '11 NPL/Total Loans NPA/Total Assets Peer* Average NPA/Assets 3.18% *= Peer – SNL Data: US Public Banks $500M - $1.5b Total Assets as of September 30, 2011 12

Capital for Growth and Opportunity * Peer – SNL Data: US Public Banks $500M - $1.5b Total Assets as of September 30, 2011 TCE Ratio Leverage Total RBC Regulatory Minimum 6.00% 10.00% Peer* 8.21% 10.06% 15.84% BBNK 11.15% 13.36% 16.06% 0% 5% 10% 15% 20% As of December 31, 2011 13

Catalysts for Earnings Growth ▪ Continued organic balance sheet growth ▪ Utilization rates on LOC at low ebb Utilization currently in the low 30% range, well below historical level ▪ NIM expansion Loan - to - Deposit ratio of 76% provides good opportunity to add leverage that will positively impact NIM ▪ Lower levels of credit stress Potential recoveries and normalizing of credit costs ▪ Increased FX income ▪ Gain on sale of SBA loans ▪ Increased operating leverage as we grow into cost structure 14

15 Thank You / Q & A