Attached files
| file | filename |
|---|---|
| 8-K - FORM 8-K - BROADRIDGE FINANCIAL SOLUTIONS, INC. | d311092d8k.htm |
 March 2012
Continued Market Leadership
through Execution and Innovation
Investor Presentation
©
2012 Broadridge Financial Solutions, Inc.
Broadridge and the Broadridge logo are registered trademarks of Broadridge
Financial Solutions, Inc. Exhibit 99.1 |
 1
Forward-looking statements
Use of non-GAAP financial measures
Use of material contained herein
The
information
contained
in
this
presentation
is
being
provided
for
your
convenience
and
information
only.
This
information
is
accurate as of the date of its
initial presentation. If you plan to use this information for any purpose,
verification of its continued accuracy is your responsibility. Broadridge assumes no
duty to update or revise the information contained in this presentation. You
may reproduce information contained in this presentation provided you do not
alter, edit, or delete any of the content and provided you identify the source of
the information as Broadridge Financial Solutions, Inc., which owns the
copyright.
Pre-Spin financial information
Financial information presented for periods prior to the March 30, 2007
spin-off of Broadridge from Automatic Data Processing, Inc. (“ADP”) represents the
operations of the brokerage services business which were operated as part of
ADP. Broadridge’s financial results for periods before the spin-off from ADP
may not be indicative of our future performance and do not necessarily reflect what
our results would have been had Broadridge operated as a separate,
stand-alone entity during the periods presented, including changes in our
operations and capitalization as a result of the spin-off from ADP. This presentation and
other written or oral statements made from time to time by representatives of Broadridge may contain “forward-looking statements”
within the meaning of the Private Securities Litigation Reform Act of 1995. Statements that are
not historical in nature, and which may be identified by the use of words like
“expects,” “assumes,” “projects,” “anticipates,” “estimates,” “we believe,” “could be” and other words of similar meaning, are forward-
looking statements. In particular, information appearing in the “Fiscal Year 2012 Financial
Guidance” section and statements about our future financial performance are
forward-looking statements. These statements are based on management’s expectations and assumptions and are subject to risks and
uncertainties that may cause actual results to differ materially from those expressed. These
risks and uncertainties include those risk factors discussed in Part I, “Item 1A. Risk
Factors” of our Annual Report on Form 10-K for the fiscal year ended June 30, 2011 (the “2011 Annual Report”), as they may be
updated in any future reports filed with the Securities and Exchange Commission. All
forward-looking statements speak only as of the date of this presentation and are expressly
qualified in their entirety by reference to the factors discussed in the 2011 Annual Report. These risks include: the
success of Broadridge in retaining and selling additional services to its existing clients and in
obtaining new clients; Broadridge’s reliance on a relatively small number of clients, the
continued financial health of those clients, and the continued use by such clients of Broadridge’s sevices with favorable
pricing terms; changes in laws and regulations affecting the investor communication services provided
by Broadridge; declines in participation and activity in the securities markets; overall market
and economic conditions and their impact on the securities markets; any material breach of Broadridge security
affecting its clients’ customer information; the failure of Broadridge’s outsourced data
center services provider to provide the anticipated levels of service; any significant slowdown
or failure of Broadridge’s systems or error in the performance of Broadridge’s services; Broadridge’s failure to keep pace with
changes in technology and demands of its clients; Broadridge’s ability to attract and retain key
personnel; the impact of new acquisitions and divestitures; and competitive conditions.
Broadridge disclaims any obligation to update or revise forward-looking statements that may be made to reflect events or
circumstances that arise after the date made or to reflect the occurrence of unanticipated events,
other than as required by law. In certain
circumstances, results have been presented that are not generally accepted accounting principles measures (“Non-GAAP”) and should be viewed in
addition to, and not as a substitute for, the Company’s reported results. Net earnings excluding
the Penson “other-than-temporary impairment” charge (the “Penson OTTI
charge”) and the IBM Migration costs, diluted earnings per share excluding the Penson OTTI charge and the IBM Migration costs, and pre-tax
earnings margins excluding the Penson OTTI charge and the IBM Migration costs are Non-GAAP
measures. These measures are adjusted to exclude costs to be incurred in connection with
the Penson OTTI charge and the IBM Migration as Broadridge believes this information helps investors understand the effect of
the Penson OTTI charge and the IBM Migration on reported results and provides a better representation
of our actual performance. Free cash flow is a Non- GAAP measure and is defined as
cash flow from operating activities, less capital expenditures and purchases of intangibles. Management believes such Non-
GAAP measures provide investors with a more complete understanding of Broadridge’s underlying
operational results. These Non-GAAP measures are indicators that management uses to provide
additional meaningful comparisons between current results and prior reported results, and as a basis for planning
and forecasting for future periods. Accompanying this presentation is a reconciliation of
Non-GAAP measures to the comparable GAAP measures. |
 2
Broadridge Overview |
 3
Broadridge is a strong, resilient business
with significant growth potential
History of market leadership
–
Proven ability to address increasingly complex customer needs
through technology
–
Innovation and thought leader in industry for >40 years
Strong position in large and attractive markets
–
Leader in investor communications and global securities
processing –
Resilient through financial crisis due to mission-critical nature of
services –
Deeply respected by industry and regulators
–
Room for expansion into naturally adjacent markets
Excellent team
–
Results-driven and deeply experienced management team aligned
with long-term interests of shareholders
–
NY
1
for 5
th
consecutive year
1. As recognized by the NY Society of Human Resources in
2008-2012
Highly
engaged associates -
one of the best large companies to work for in |
 4
Broadridge Strategy Statement
Our vision is to be the leading provider of Investor
Communications and Technology and Operations Solutions to
Banks/Broker-Dealers, Mutual Funds, and Corporate Issuers
globally
–
Our mission is to drive the industry we serve to higher levels of efficiency
and compliance; to partner with financial institutions and public companies
to enable their growth; and to provide innovative outsourcing solutions for
mission-critical activities
–
We will grow our businesses by leveraging our unique network, our market
position, and our brand/service reputation
–
We will do so with a combination of organic growth and M&A
–
We anticipate that this approach will drive 6-9% revenue growth and
low-to- mid-teens earnings growth
–
We expect to pay a meaningful dividend and to opportunistically buy back
shares |
 5
Our market position is differentiated
and sustainable
Revenue growth
Investor Communication Services
$B
2.4
2.0
1.4
2011
2005
Growth through
crisis and recession
•
Proxy services for >85%
of outstanding
shares in US
•
Processed >600 billion shares in 2011
•
Used by >4,000 institutional investors
globally
•
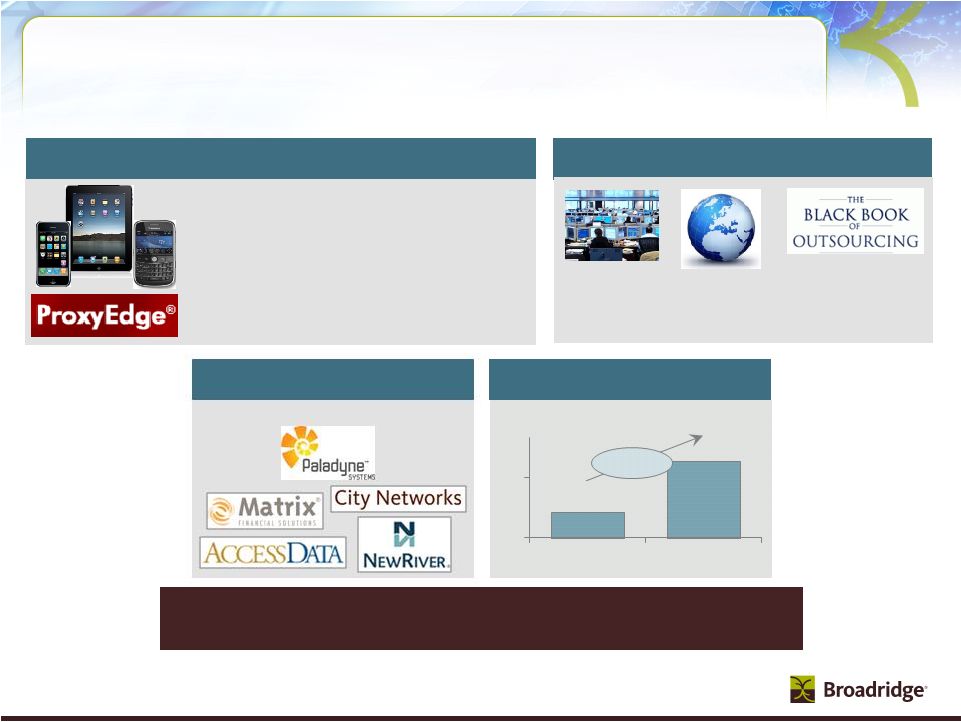
Eliminates >50%
of physical mailings
•
>500K
votes through mobile apps since
launch
New businesses
Tuck-in acquisitions
Broadridge is well positioned to accelerate growth
and continue driving strong free cash flow
Securities Processing Services
Ranked
#1
Brokerage Service
Outsourcing
Provider (2010)
Enable
clients to
process in
>50 countries
Processes
>$4 trillion
in FI trades
per day
5% CAGR |
 6
We are the leader in several markets
Market
Rank
Bank/Broker-Dealer
Regulatory
Communications
Broker-Dealer
Transactional
Communications
Corporate Issuer
Regulatory
Communications
Mutual Fund Proxy
Mail and Tabulation
Market
Rank
US Brokerage
Processing
US Fixed Income
Processing
Canadian Brokerage
Processing
#1
#1
#1
#1
#1
#1
#1
1. Rank by market share
1
1
Investor Communication
Services
Securities Processing
Services |
 7
Investor Communication Solutions (ICS) |
 8
Mutual Fund—Natural adjacencies
Transaction reporting
Imaging and workflow, etc.
Mutual Fund—Core
Retirement processing
Data aggregation
Marketing communications
Proxy/solicitation
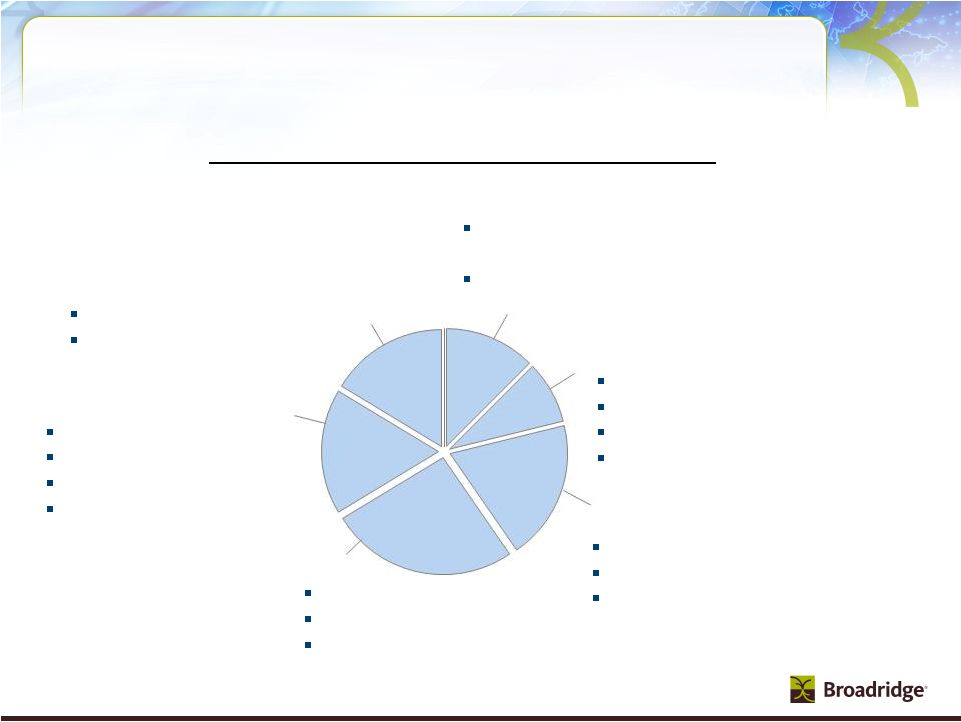
Large and attractive markets –
Investor
Communications (ICS) is a $10B+ market
BBD—Emerging products
Global proxy and communications
Tax reporting and outsourcing
Security class actions
Advisor services
Bank/Broker-Dealer (BBD)—Core
Regulatory communications
(proxy, interims, etc.)
Customer communications
(transaction statements, etc.)
Total addressable market $10B+ fee revenue
Issuer
Transfer agency
Shareholder analytics
Investor communications
BBD—Natural adjacencies
Enterprise archiving
On-boarding
International tax reclaim
$1.3B
$0.9B
$2.0B
$3.0B
$1.8B
$1.7B
Sources: BCG, Bain, Patpatia, Broadridge estimates |
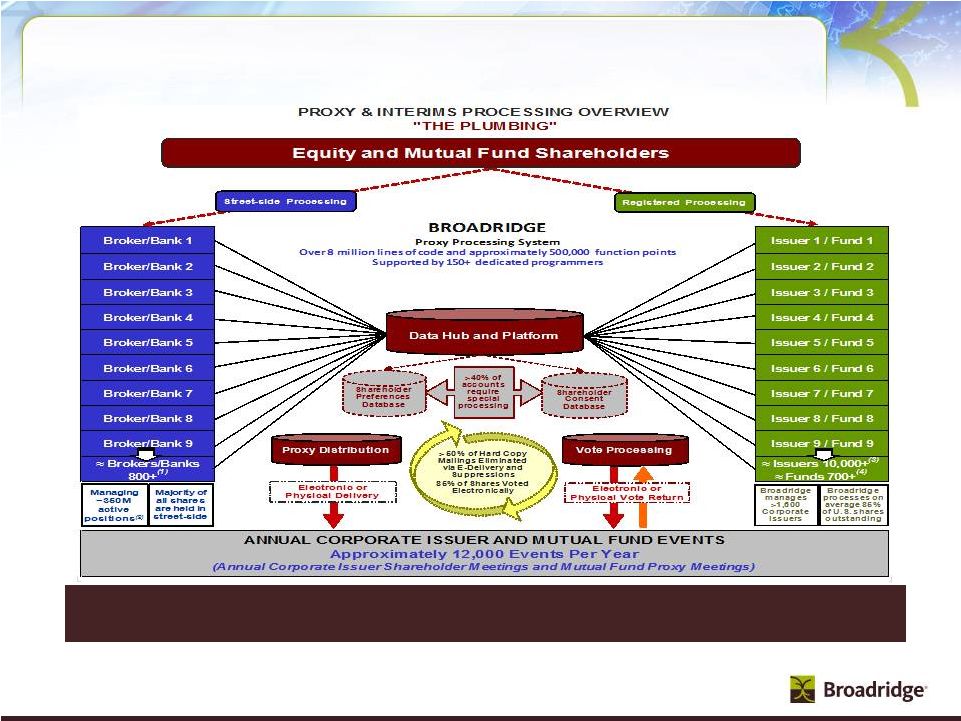 ICS Unique
Business Systems Processing Model Proxy
and
Interim
processing
system
is
the
“plumbing”
supporting
the
voting
process for corporate governance
(1)
Represents Broadridge’s estimated total number of brokerage firms
and banks in the U.S. and international markets (2)
Represents Broadridge’s estimated total number of positions
managed by U.S. brokers and banks (3)
Represents Broadridge’s estimated total number of corporate
issuers in the U.S. (4)
Represents total number of Fund Sponsors in the U.S. who manage over
16,000 funds including Mutual Funds, Closed-end Funds, ETFs and UITs,
according to
the
Investment Company Institute’s 2009 Investment Company Year Book
9 |
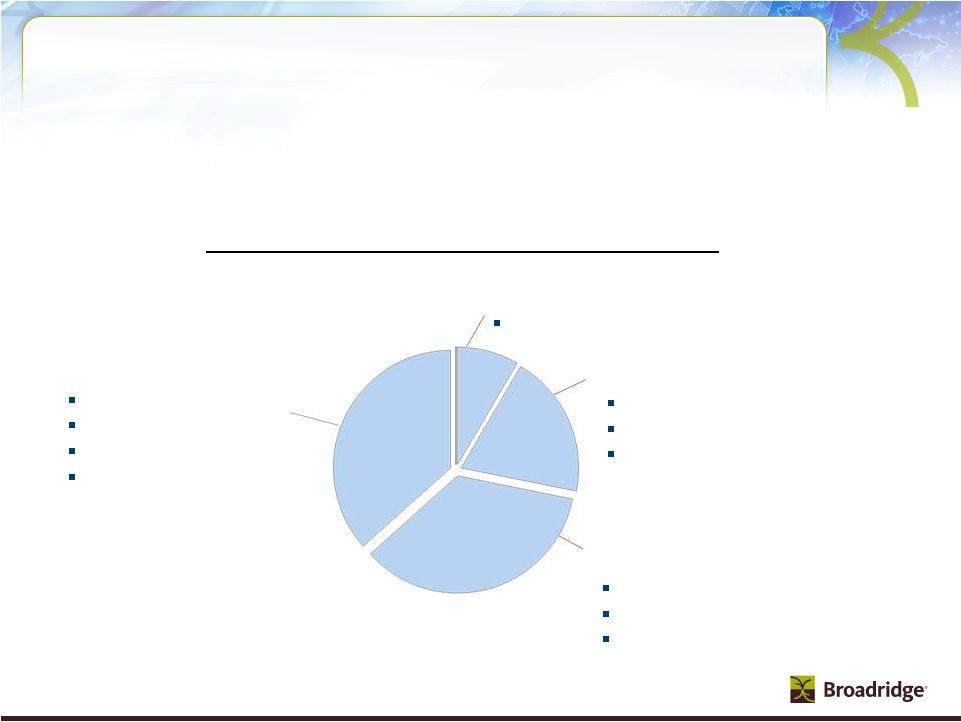
 10
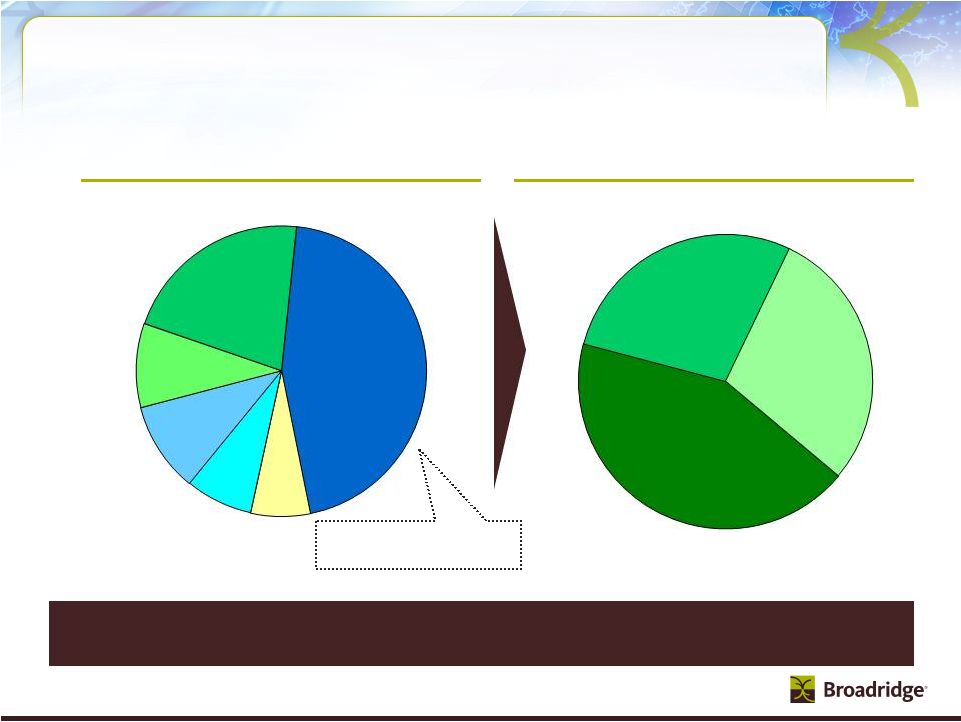
ICS Product and Client Revenue Overview
ICS is highly resilient due to our deep customer relationships with our
Bank/Broker-Dealer clients
Increase in electronic
distribution reduces postage
revenue and increases profits
FY11 Product Revenues
FY11 Client Revenues
(Based on who pays BR as agent)
Bank/Broker
-
Dealer
(43%)
Mutual Fund
(28%)
Corporate
Issuer
(29%)
Distribution
$704M
(45%)
Other
$103M (7%)
Fulfillment
$117M (8%)
Transaction
Reporting
$156M (10%)
Interims
$146M (9%)
Proxy
$334M (21%)
We have a strong and diverse product
offering…
…and we have deep and longstanding
client relationships
Primarily
Postage |
 11
ICS-Bank/Broker-Dealer
What We Do:
Regulatory communications
–
Beneficial proxy and interims for equities
–
Beneficial mutual fund compliance
communications
Customer communications
–
Transaction statements, trade confirmations
and other reporting
Global and emerging products
–
Advisor services
–
Global proxy and communications
–
Tax reporting and outsourcing
–
Securities class actions
Competitive Advantages:
Indispensible data hub with established
relationships with majority of BBDs
Strong market position and innovative
leadership
–
First/only certified voting results
–
First e-delivery, phone, web and mobile voting
platform
Proprietary systems, network and
databases
–
ProxyEdge®
–
institutional voting and record
keeping platform
–
Preference and consent database
Unmatched scale with highest level data
security (ISO 27001) |
 12
What We Do:
Mutual Fund trade processing in the
defined contribution/trust space
(Matrix)
Data aggregation and analytics
(Access Data)
Marketing/Regulatory
communications including content
(NewRiver)
Registered proxy and solicitation
Competitive Advantages:
Long-standing relationships across
industry
Serve every mutual fund and majority of
banks/broker-dealers
Unique data capabilities
Proprietary platform to allow mutual funds to
understand their clients
Innovative business applications that address
unique industry issues such as compliance
and distribution payments
Largest electronic repository for mutual fund
regulatory data
Industry-leading ICS products with
unmatched scale
Leverage to create cost-effective products for
mutual funds
ICS-Mutual Funds |
 13
What We Do:
Beneficial proxy service
Registered shareholder communications
–
Registered proxy
–
Interim communications
Transfer agency (TA)
–
Stock share registry, ownership
transfers and dividend calculation
Enhanced issuer solutions
–
Shareholder analytics
–
Virtual shareholder meetings
–
Shareholder forums
–
Global proxy services
ICS-Issuers
Competitive Advantages:
Competitive Advantages:
Market
Position
–
only
full
service
provider
of
Unmatched
Scale
–
able
to
leverage
one
billion
Unmatched
Data
–
unique
dataset
of
investors
Thought
Leadership
–
unmatched
expertise
to
shareholder communications to all types of
shareholders
plus shareholder communications annually
as well as record-keeping, corporate actions and other shareholder account
servicing and positions allows
Issuers to more effectively reach
their shareholders innovate the
proxy process and help guide
Issuers through a complex regulatory
environment
|
 14
Securities Processing Solutions (SPS) |
 15
Sources: Tower Group, Chartis, Aite, IM2, Broadridge internal estimates
Technology and Operations spend adds
~$14B to our SPS addressable market
Securities and investment firms’
overall technology and operations
spend is over $100 billion and growing at 5%
$1.2B
$2.8B
~$5.0B
Adjacent markets
Middle-office
Buy-side services
Derivatives processing
Fixed Income market
data and analytics
~$5.2B
North American BPO
Middle-
and back-office
Data center services
Select corporate functions
US Brokerage Processing
Core equities and fixed income
Global Processing
Core equities and fixed income
Global BPO
Reconciliations
Total addressable market ~ $14B fee revenue |
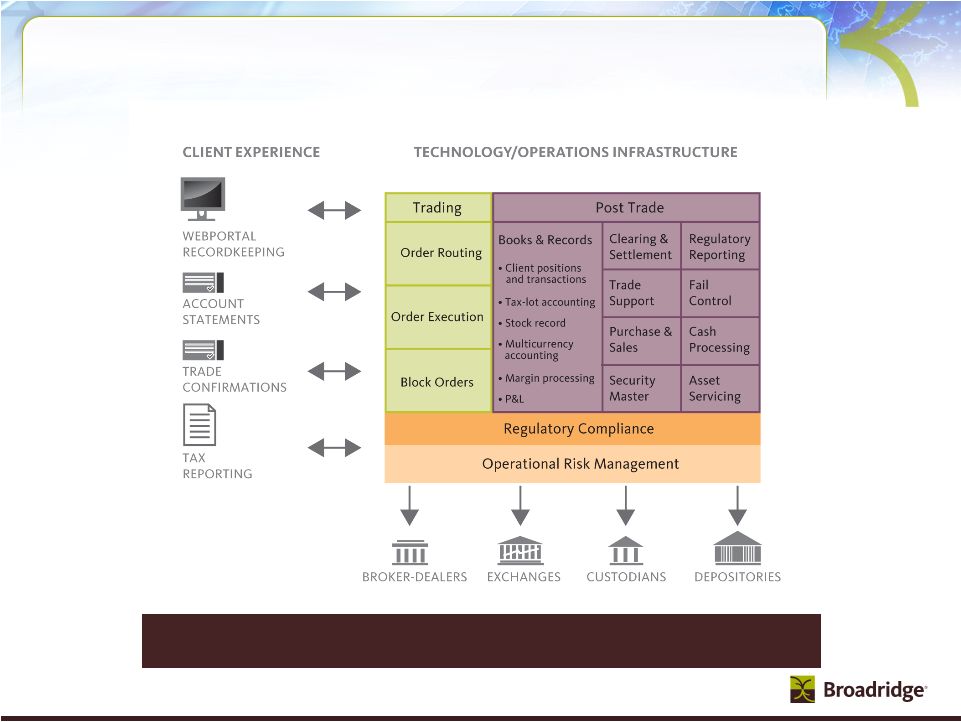 16
Broadridge global processing behind the scenes
Broadridge simplifies complex processes |
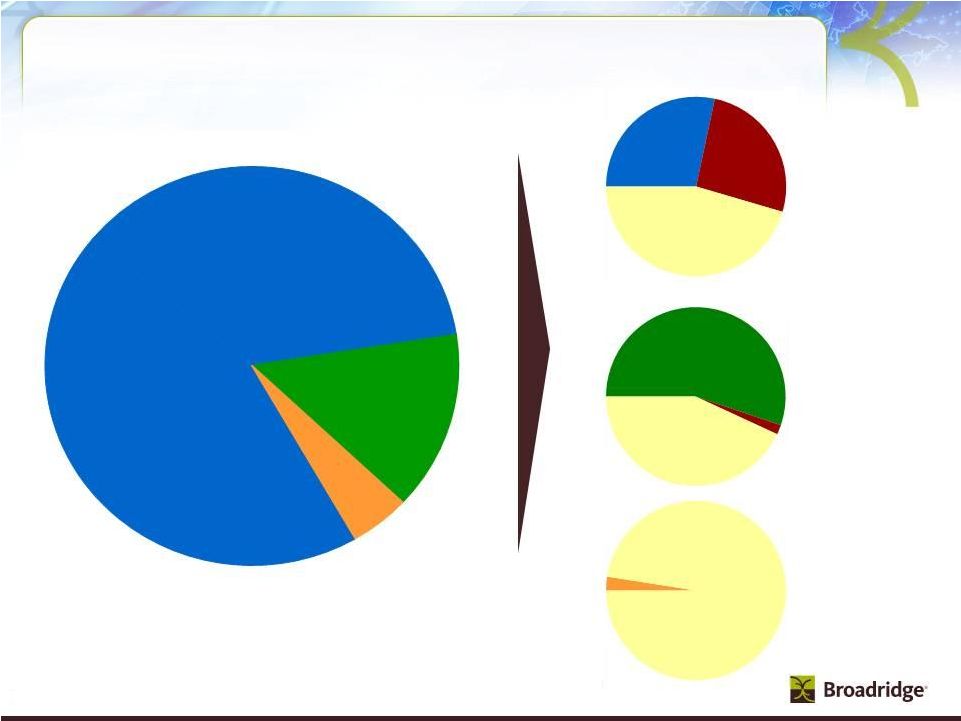 Securities
Processing North America Market Share Overview
1
1. All market share information is based on management’s estimates
and is part of much larger market. No attempt has been made to
size such market M
A
R
K
E
T
S
H
A
R
E
Equity
(~75%)
Transactions, $239M
Non-transactions, $211M
Fixed Income (~15%)
Transactions, $56M
Non-transactions, $30M
Outsourcing
(~10%)
$58M
FY11 Product Revenues
Broadridge
~30%
Competitors
~20%
In-house
~50%
Broadridge
~6%
Untapped
Market
~94%
(>$1 Billion)
In-house
~43%
Competitors
~2%
Equity Processing Client Volume
U.S. $ Fixed Income Client Volume
Operations Outsourcing
Broadridge
~55%
17 |
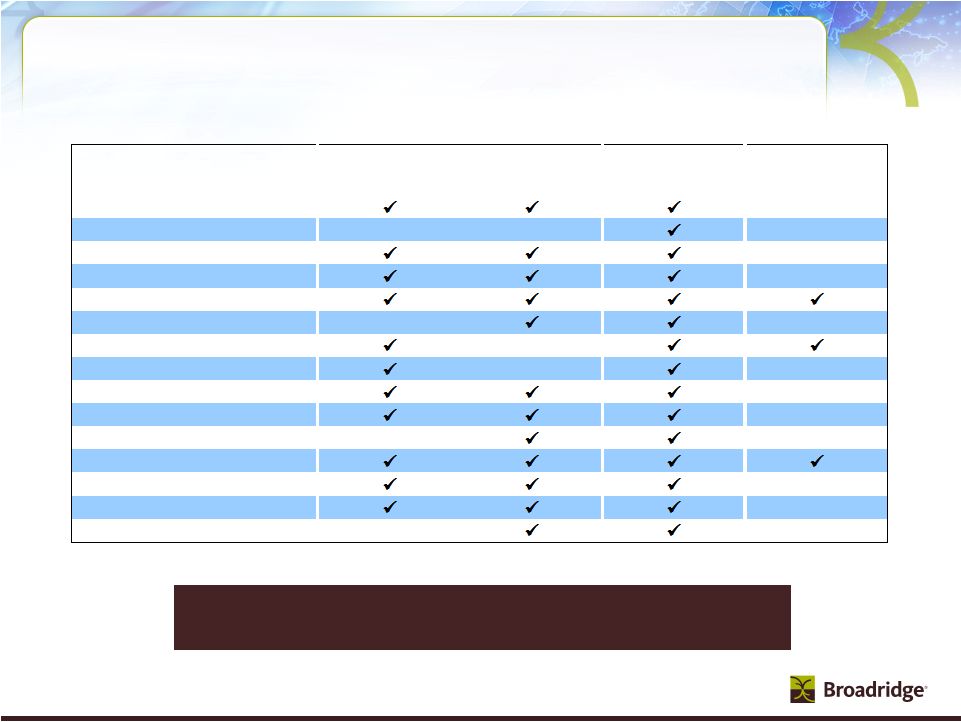  18
SPS Top 15 Clients for FY11
SPS client relationships are stable in volatile
market
Note: The above schedule is an alphabetical listing of the top 15 SPS clients which
represent ~70% of SPS revenues as of June 30, 2011. Top
Equity Processing
Fixed Income
Clients
Retail
Institutional
Processing
Outsourcing
Alliance Bernstein
Bank of America/Merrill Lynch
Barclays Capital Services
BMO Nesbitt Burns
CIBC World Markets
Deutsche Bank
E*Trade Group
Edward Jones
Jefferies & Company
JP Morgan Chase
Mizuho Securities USA
Penson
Royal Bank of Canada
Scotia Capital
UBS Securities |
 19
SPS-Technology and Operations
What We Do:
Best-of-breed processing solutions
–
Leading global platform
–
Broad asset class coverage
Broad suite of add-on or point solutions
–
Desk top applications used by brokers
and traders
–
Workflow and reconciliation applications
–
Data aggregation and warehousing tools
Industry-leading global business process
outsourcing (BPO) solutions
Unique global technology platform
provides processing access to over 50
countries
Breadth of asset classes on single
“platform”
Leading market position and scale
Flexible business model that can be
tailored to unique client needs
Trusted brand
Competitive Advantages: |
 20
Financial Overview |
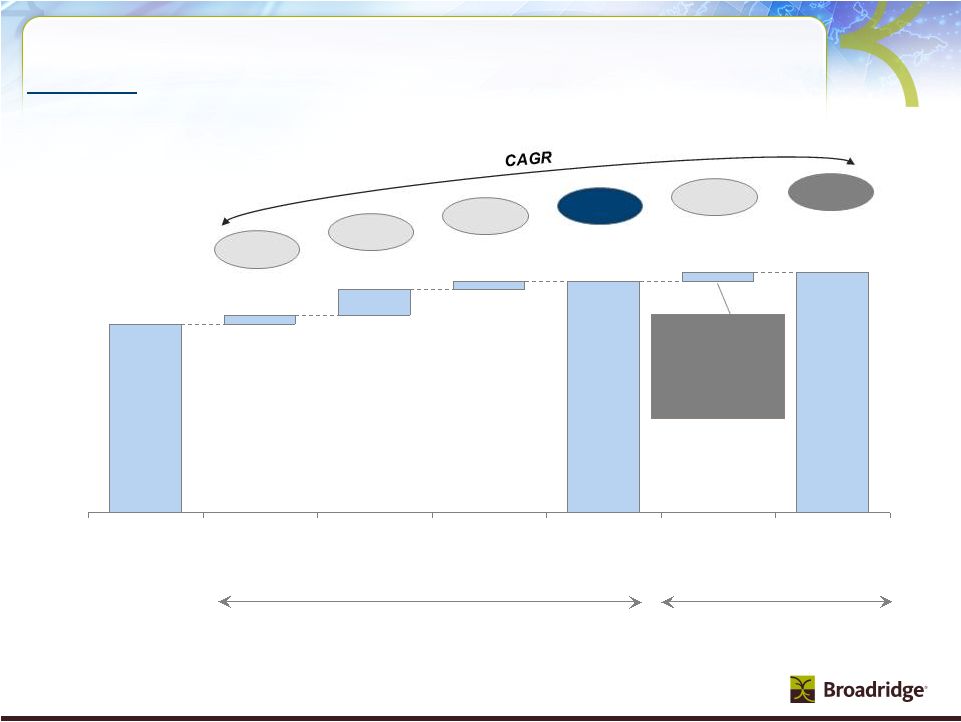 21
~$200-300M
~$70-130M
~$2,200M
FY11
~$70–130M
FY14
estimate incl.
event-driven
~$2,600–2,900M
Event-driven
FY14
estimate
~$70M
~$2,500–2,800M
Potential upside
+1–2%
=5–8%
+3–4%
+1–2%
+~1%
=6–9%
Recurring revenue
Return of
mutual fund
activity
should provide
additional
opportunity
Note: New closed sales offset by increased e-deliveries. Numbers may not add up
due to rounding. Total expected annual growth of
5–8%
through FY14 from recurring revenue
Market
growth
Net new
business
Tuck-in
acquisitions |
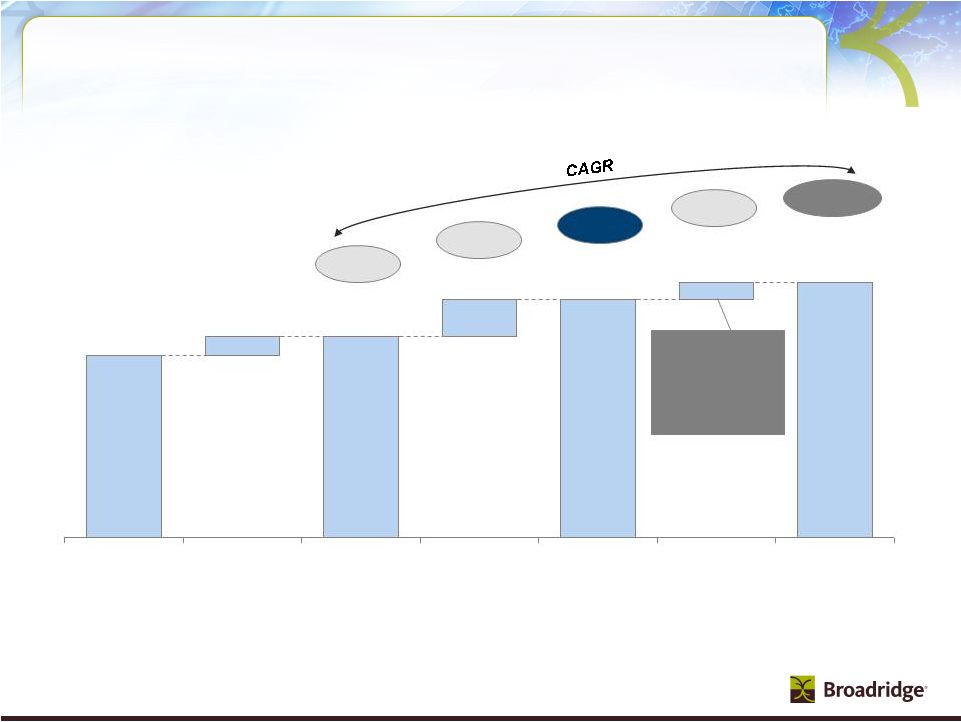 22
13.1%
Key initiatives
17.6-18.9%
Event-driven
250–280bps
FY14
estimate
(recurring)
90–150bps
FY14
estimate
(recurring +
key initiatives)
13.9–14.9%
Economies
of scale
(core plus
acquisitions)
80–180bps
FY11
(Non-GAAP)
16.7–17.4%
FY14 estimate
(recurring +
key initiatives
+ event-driven)
Total EBIT margin improvement of ~400bps
by FY14 before event-driven revenue
3–4%
+6%
=9–10%
+2–3%
=11–13%
Return of
mutual fund
activity
should provide
additional
opportunity |
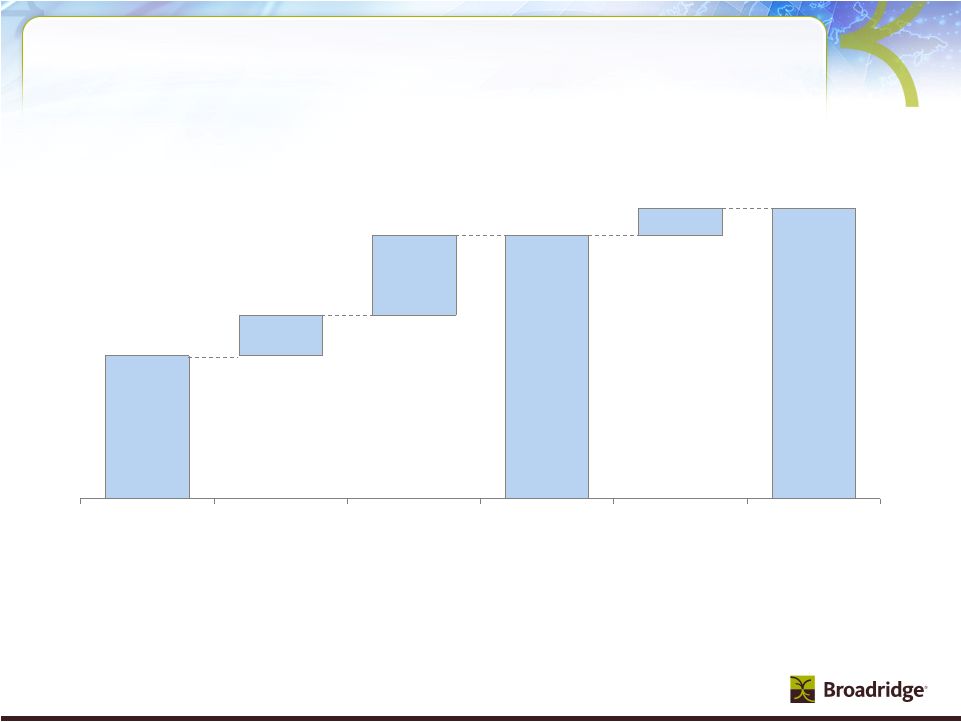 23
By FY14 cash generation planned to expand
to $270-315M, plus $20–40M event-driven
$290-355M
Event-driven
$20–40M
FY14
FCF estimate
(Non-GAAP)
$270-315M
Core
operations
(recurring
revenue)
$82-127M
Key
initiatives and
restructuring
~$45M
FY11
FCF
(Non-GAAP)
~$143M
FY14 FCF
estimate (Non-
GAAP) incl.
event-driven |
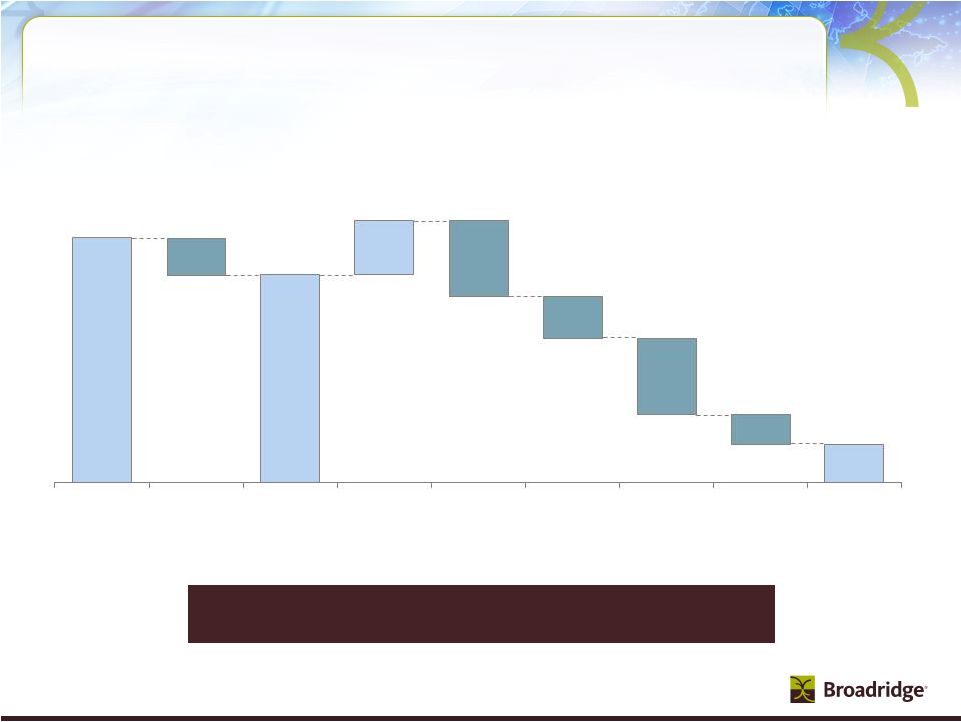 24
Since spin-off, we have reduced “spin debt”
and returned capital
Change
in cash
198
Debt
reduction
155
Tuck-in
acquisitions
395
Dividends
213
Buy-backs
392
Freed-up
capital
281
Free Cash
Flow
(Non-GAAP)
1,072
Capital
expenditures
& software
purchases
191
Cash flow
from
operations
(GAAP)
1,263
Use of cash FY07–11, $M
Focus on prudent capital stewardship
1. Gross buy-backs of $509 less proceeds from stock option exercises of
$115 2. FY11 ending cash of $241 less beginning cash of $43
1
2 |
 25
Our financial strategy is a key part of our
value creation strategy
35% dividend payout, but expect no less than 64 cents
per share annually subject to Board approval
Organic growth with limited financial risk
–
Avoid significant balance sheet risk
–
Invest in projects delivering at least 20% IRR
Tuck-in acquisitions with clear growth profile and returns
–
Accretive to growth, margins, and earnings
–
>20% IRR in conservative business case
Long-term investment-grade debt rating
–
Adjusted Debt/EBITDAR ratio
1
target is 2:1
Excess cash used opportunistically to offset dilution and
reduce share count through buybacks
1. Adjusted Debt/EBITDAR ratio calculated as (Debt + 5x Rent Expense) / (EBITDA +
Rent Expense) |
 26
Appendix |
 27
Revenue Growth Drivers
Historical CAGR
Actual
2Q
2Q YTD
Forecast
(FY05-FY10)
FY11
FY12
FY12
FY12
6%
(2)%
Total Revenue Growth
8%
11%
8-9%
4%
3%
Closed Sales
4%
3%
4-5%
(2)%
(1)%
Client
Losses
(1)%
(1)%
(1)%
2%
2%
Net New Business
3%
2%
3-4%
3%
1%
Internal Growth
(a)
1%
2%
~1%
0%
4%
Acquisitions
5%
5%
~3%
5%
7%
Total Recurring
9%
9%
7-8%
1%
(6)%
Event-Driven
(b)
(1)%
(1)%
0%
0%
(4)%
Distribution
(c)
1%
2%
~1%
0%
1%
FX/Other
(1)%
1%
0%
13.1%
EBIT Margin
5.8%
6.2%
~14%
(a) Internal Growth includes SPS Equity & Fixed Income Trades, ICS Equity
& Mutual Fund Stock Record Growth, Transaction Reporting and Time & Materials
(b) Event-Driven includes ICS Proxy Contest/Specials, Mutual Fund Proxy and
Marketing Communications Fulfillment (c) Distribution includes
pass-through fees from Matrix (Recurring)
(Non-GAAP) |
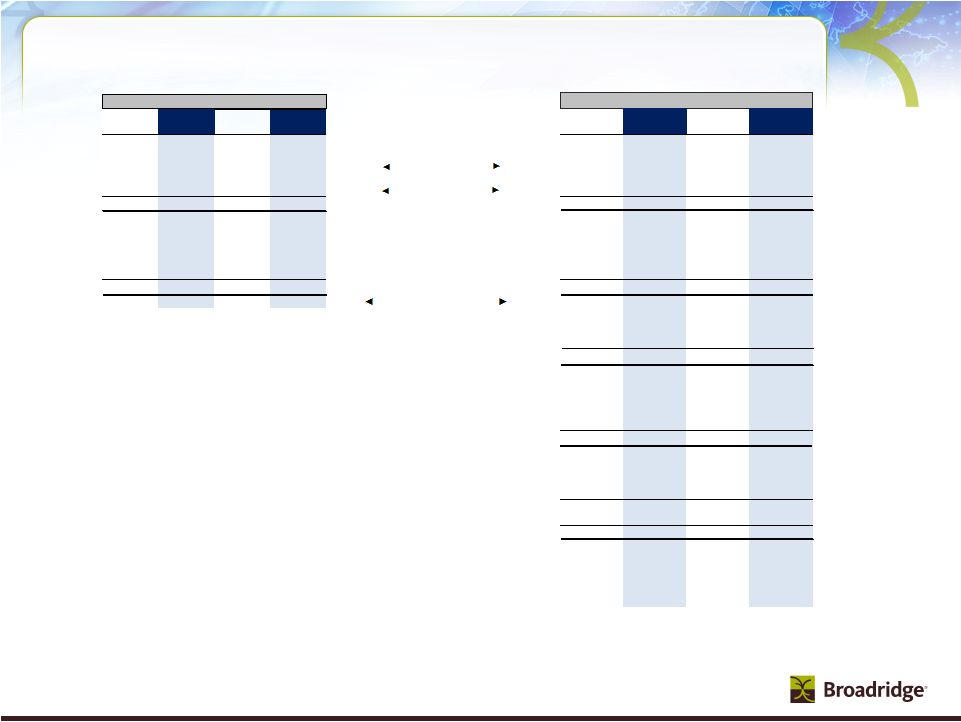 28
Revenue
Earnings
FY11
FY12
FY11
FY12
FY11
FY12
FY11
FY12
Q2
Q2
YTD Q2
YTD Q2
($ in millions)
Q2
Q2
YTD Q2
YTD Q2
$294
$317
$574
$630
ICS
$3
$11
$9
$19
-25%
8%
-18%
10%
Growth % / Margin %
0.9%
3.3%
1.6%
3.0%
$146
$161
$288
$319
SPS
$19
$20
$40
$48
9%
10%
9%
11%
Growth % / Margin %
13.2%
12.5%
14.0%
15.0%
$440
$478
$861
$949
Total Segments
$22
$31
$49
$67
-16%
9%
-11%
10%
Margin %
5.0%
6.4%
5.7%
7.1%
$0
$0
$0
$0
Other
(a)
($5)
($6)
($10)
($13)
$2
$2
$2
$7
FX
(b)
$2
$3
$3
$5
$442
$480
$864
$956
Total Broadridge (Non-GAAP)
(a)
$19
$28
$42
$59
-16%
8%
-11%
11%
Growth % / Margin %
4.2%
5.8%
4.8%
6.2%
Interest & Other
($2)
($4)
($4)
($6)
Total EBT (Non-GAAP)
(a)
$17
$24
$37
$53
Margin %
3.7%
5.0%
4.3%
5.6%
Income taxes
(a)
($6)
($9)
($14)
($19)
Tax Rate
35.8%
35.8%
36.1%
36.1%
Total Net Earnings (Non-GAAP)
(a)
$11
$15
$24
$34
Margin %
2.4%
3.2%
2.8%
3.6%
IBM Migration costs
$0
($2)
$0
($4)
Penson OTTI charge
$0
($6)
$0
($6)
Non-GAAP Items (Net of Taxes)
$0
($8)
$0
($10)
Total Net Earnings (GAAP)
$11
$7
$24
$24
Margin %
2.4%
1.4%
2.8%
Broadridge 2Q and YTD from Continuing Operations
2.5%
(a)
Diluted Shares
128
127
129
127
Diluted EPS (Non-GAAP)
(a)
$0.08
$0.12
$0.19
$0.27
Diluted EPS (GAAP)
$0.08
$0.05
$0.18
$0.19
(b) Includes impacts of FX P&L and FX Transaction Activity.
(a) FY12 Q2 excludes the IBM Migration costs of $4M (after tax $2M, or $0.02 EPS
impact) and Penson OTTI charge of $10M (after tax $6M, or $0.05 EPS impact). FY12 YTD Q2
excludes
the
IBM
Migration
costs
of
$7M
(after
tax
$4M,
or
$0.03
EPS
impact)
and
Penson
OTTI
charge
of
$10M
(after
tax
$6M,
or
$0.05
EPS
impact). |
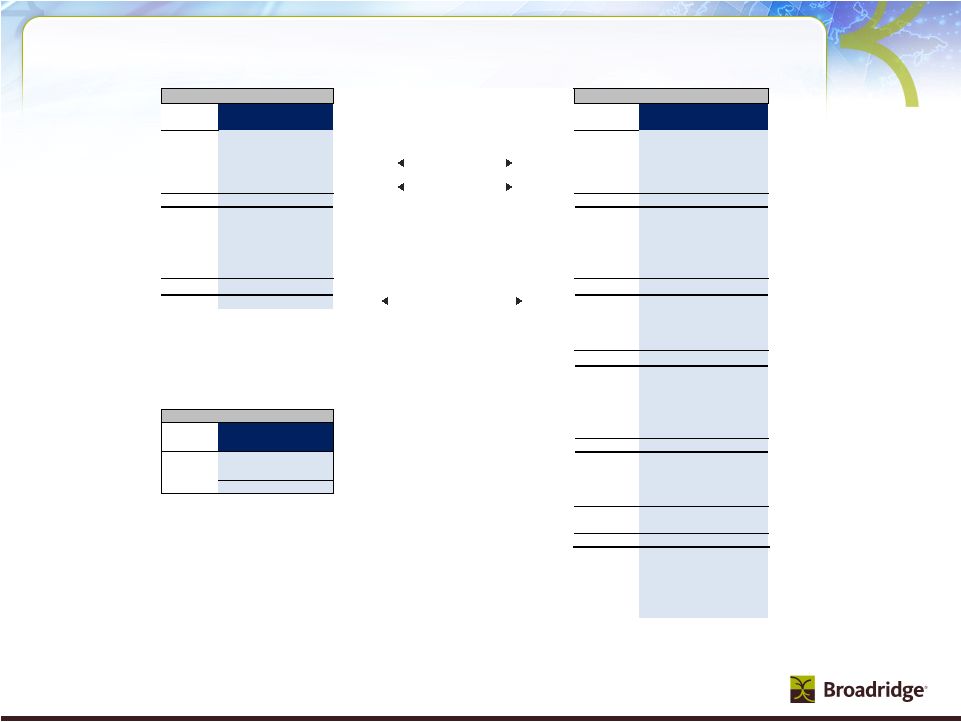 Broadridge FY12
Guidance from Continuing Operations Revenue
Earnings
FY11
FY12 Range
FY11
FY12 Range
Actual
Low
High
($ in millions)
Actual
Low
High
$1,559
$1,677
$1,688
ICS
$213
$247
$257
-7%
7%
8%
Growth % / Margin %
13.7%
14.7%
15.2%
$594
$656
$672
SPS
$87
$96
$112
11%
10%
13%
Growth % / Margin %
14.7%
14.7%
16.6%
$2,153
$2,333
$2,360
Total Segments
$301
$343
$369
-2%
8%
10%
Margin %
14.0%
14.7%
15.6%
$0
$0
$0
Other
(a)
($25)
($30)
($36)
$14
$9
$12
FX
(b)
$9
$6
$8
$2,167
$2,342
$2,372
Total Broadridge (Non-GAAP)
(a)
$285
$319
$341
-2%
8%
9%
Growth % / Margin %
13.1%
13.6%
14.4%
Interest & Other
($8)
($14)
($14)
Total EBT (Non-GAAP)
(a)
$276
$305
$327
Margin %
12.7%
13.0%
13.8%
Income taxes
(a)
($100)
($113)
($121)
Recurring Closed Sales
Tax Rate
36.3%
37.0%
37.0%
FY12 Range
Segments
Low
High
Total Net Earnings (Non-GAAP)
(a)
$176
$192
$206
ICS
$65
$85
Margin %
8.1%
8.2%
8.7%
SPS
$45
$65
Total
$110
$150
IBM Migration costs
($4)
($21)
($21)
Penson OTTI charge
-
($6)
($6)
Non-GAAP Items (Net of Taxes)
($4)
($27)
($27)
Total Net Earnings (GAAP)
$172
$165
$179
Margin %
7.9%
7.1%
7.5%
(a)
Diluted Shares
128
128
128
Diluted EPS (Non-GAAP)
(a)
$1.37
$1.50
$1.60
Diluted EPS (GAAP)
$1.34
$1.29
$1.39
(b) Includes impacts of FX P&L and FX Transaction Activity.
* Guidance does not take into consideration the effect of any future acquisitions,
additional debt and/or share repurchases in excess of the repurchases needed
to achieve our 128 million diluted weighted-average outstanding shares guidance.
(a) FY11 excludes the IBM Migration costs of $6M, after-tax $4M, or $0.03 EPS
impact. FY12 excludes the IBM Migration costs of $33M (after tax $21M, or
$0.16 EPS impact) and Penson OTTI charge of $10M (after tax $6M, or $0.05 EPS impact).
29 |
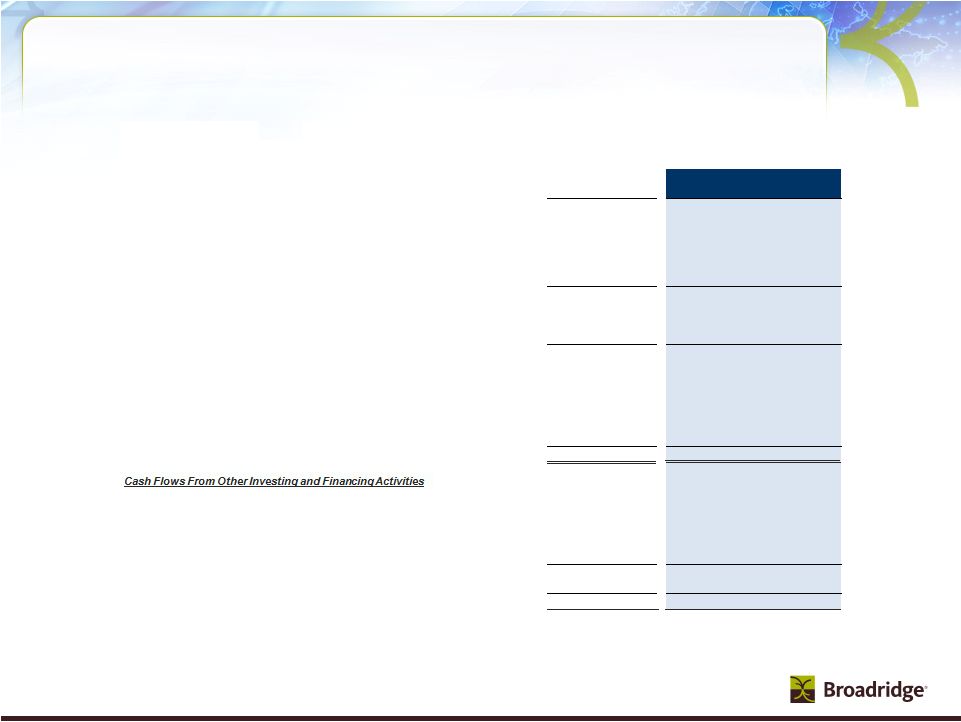 Free Cash Flow (Non-GAAP)
Unaudited
($ in millions)
Six Months Ended
December 2011
Low
High
Free Cash Flow
(Non-GAAP)
:
Net earnings from continuing operations (GAAP)
24
$
165
$
179
$
Depreciation and amortization (includes other LT
assets) 44
95
100
Stock-based compensation expense
13
31
31
Other
(7)
2
10
Subtotal
74
293
320
Working capital changes
52
(15)
(15)
Long-term assets & liabilities changes
(b)
(30)
(55)
(45)
Net cash flow provided by continuing operating activities
95
223
260
Cash Flows From Investing Activities
IBM / ITO data center investment
(6)
(15)
(10)
Penson
(7)
(7)
(7)
Capital expenditures & software purchases
(16)
(65)
(55)
Free cash flow (Non-GAAP)
(c)
67
$
136
$
188
$
Acquisitions
(72)
(73)
(73)
Stock repurchases net of options proceeds
(1)
(1)
(1)
Proceeds from borrowing net of debt repayments
70
-
-
Dividends paid
(58)
Cash Flow –
YTD FY12 Results and FY12 Forecast
(a)
Guidance does not take into consideration the effect of any future acquisitions,
additional debt and/or share repurchases in excess of the repurchases needed to achieve our
128 million
diluted
weighted-average shares outstanding guidance.
(b)
Includes IBM Migration costs of $(12)M and ~$(33)M for YTD Q2FY12 actual and FY12
guidance, respectively. (c)
FY12 range presented in this table includes the impact of ~$(73)M due to IBM
Migration costs. When the IBM Migration costs are excluded from the FY12 range, free cash
flow would be ~$210M to ~$260M, with the mid-point of ~$235M.
(78)
(78)
Other
(8)
(5)
5
Net change in cash and cash equivalents
(3)
(21)
41
Cash and cash equivalents, at the beginning of year
242
242
242
Cash and cash equivalents, at the end of period
238
$
221
$
283
$
FY12 Range
(a)
30 |
 31
Revenues and Closed Sales FY05-FY12
($ in millions)
FY05-10
Forecast
Event-Driven Fee Revenues
(a)
FY05
FY06
FY07
FY08
FY09
FY10
CAGR
FY11
FY12
Mutual Fund Proxy
51
$
61
$
79
$
92
$
55
$
150
$
24%
39
$
30
$
Mutual Fund Supplemental
39
$
43
$
51
$
49
$
58
$
48
$
4%
44
$
50
$
Contest/ Specials/ Other Communications
38
$
49
$
73
$
59
$
67
$
59
$
9%
52
$
50
$
Total Event-Driven Fee Revenues
128
$
153
$
203
$
200
$
180
$
257
$
15%
135
$
130
$
Growth
20%
33%
-1%
-10%
43%
-47%
Recurring Distribution Revenues
(b)
496
$
562
$
593
$
580
$
567
$
564
$
3%
573
$
~$615
Growth
13%
6%
-2%
-2%
-1%
2%
ED Distribution Revenues
(b)
153
$
169
$
228
$
228
$
190
$
217
$
7%
131
$
~$130
Growth
10%
35%
0%
-17%
14%
-39%
Total Distribution Revenues
649
$
730
$
821
$
808
$
757
$
781
$
4%
704
$
~$745
Growth
12%
12%
-2%
-6%
3%
-10%
(a) Includes reclassification of Pre-sale Fulfillment from event-driven revenues to
recurring revenues. (b) Includes reclassification of Pre-sale Fulfillment
related distribution revenues and Matrix pass-through administrative services from event-driven revenues to recurring revenues.
($ in millions)
FY05-10
Forecast
FY11-12
Recurring Fee Revenues
FY05
FY06
FY07
FY08
FY09
FY10
CAGR
FY11
FY12
Growth Rates
ICS
444
$
513
$
519
$
558
$
583
$
610
$
7%
650
$
$706-715
9-10%
Growth
16%
1%
8%
4%
5%
7%
SPS
459
$
458
$
509
$
515
$
537
$
513
$
2%
522
$
$543-556
4-6%
Growth
0%
11%
1%
4%
-4%
2%
Segment Recurring Fee Revenues
903
$
971
$
1,028
$
1,073
$
1,120
$
1,123
$
4%
1,172
$
$1,249-1,271
7-8%
Growth
7%
6%
4%
4%
0%
4%
Acquisitions
0
$
18
$
28
$
28
$
33
$
45
$
NM*
141
$
~$210
~50%
Total Recurring Fee Revenues
903
$
988
$
1,056
$
1,101
$
1,153
$
1,168
$
5%
1,313
$
$1,460-1,486
11-13%
9%
7%
4%
5%
1%
12%
Event-Driven
128
$
153
$
203
$
200
$
180
$
257
$
15%
135
$
~$130
~(4)%
Growth
20%
33%
-1%
-10%
43%
-47%
Distribution
649
$
730
$
821
$
808
$
757
$
781
$
4%
704
$
~$745
~6%
Growth
12%
12%
-2%
-6%
3%
-10%
Other/FX
(25)
$
(19)
$
(12)
$
22
$
(17)
$
4
$
NM*
14
$
~$10
NM*
Total BR Revenues
1,656
$
1,853
$
2,068
$
2,131
$
2,072
$
2,209
$
6%
2,167
$
$2,342-2,372
8-9%
Growth
12%
12%
3%
-3%
7%
-2%
Recurring Closed Sales
77
$
92
$
63
$
82
$
95
$
119
$
9%
113
$
$110-150
Growth
19%
-32%
30%
16%
25%
-5%
*NM= Not Meaningful
(cumulative) |
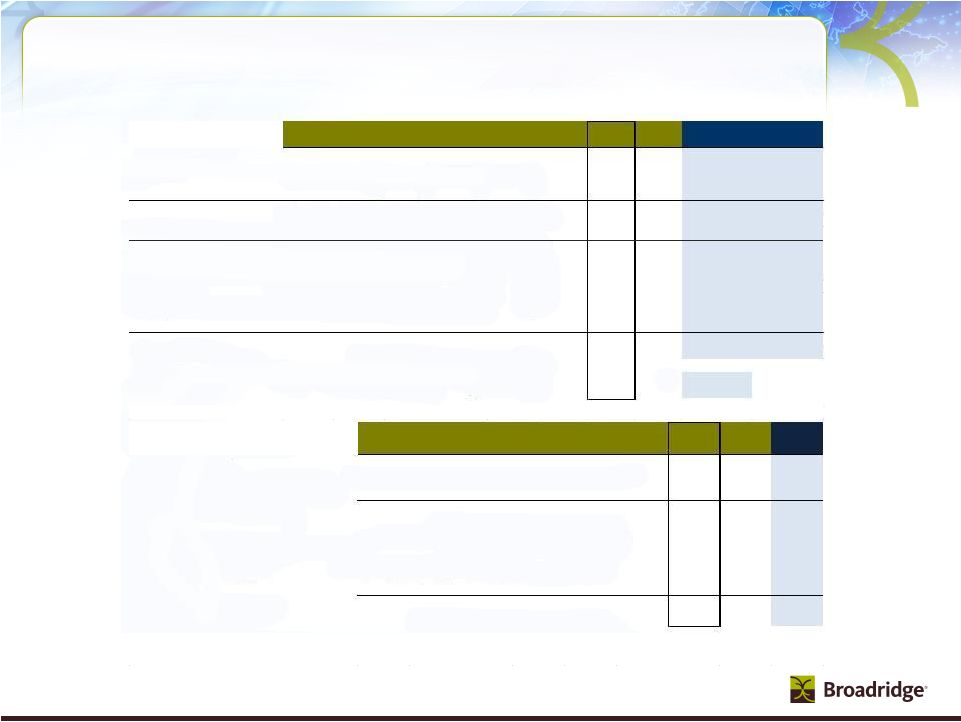
 32
Reconciliation of Non-GAAP to GAAP Measures
(a)
Guidance does not take into consideration the effect of any future acquisitions,
additional debt and/or share repurchases in excess of the repurchases needed to achieve our
128 million diluted weighted-average shares outstanding guidance.
(b)
Includes IBM Migration costs of $(12)M and ~$(33)M for YTD Q2FY12 actual and FY12
guidance, respectively. (c)
FY12 range presented in this table includes the impact of ~$(73)M due to IBM
Migration costs. When the IBM Migration costs are excluded from the FY12 range, free cash
flow would be ~$210M to ~$260M, with the mid-point of ~$235M.
EBIT Reconciliation
2Q11
2Q12
YTD11
YTD12
FY11
FY12 Range
($ in millions)
Actual
Actual
Actual
Actual
Actual
Low
High
EBIT from continuing operations (Non-GAAP / excluding IBM Migration costs and Penson OTTI
charge) $19
$28
$42
$59
$285
$319
$341
Margin %
4.2%
5.8%
4.8%
6.2%
13.1%
13.6%
14.4%
Interest & Other
($2)
($4)
($4)
($6)
($8)
($14)
($14)
Total EBT from continuing operations (Non-GAAP / excluding IBM Migration costs and Penson OTTI
charge) $17
$24
$37
$53
$276
$305
$327
Margin %
3.7%
5.0%
4.3%
5.6%
12.7%
13.0%
13.8%
IBM Migration costs
-
($4)
-
($7)
($6)
($33)
($33)
Penson OTTI charge
-
($10)
-
($10)
$0
($10)
($10)
Total EBT (GAAP)
$17
$11
$37
$36
$270
$263
$285
Margin %
3.7%
2.2%
4.3%
3.8%
12.5%
11.2%
12.0%
EPS Reconciliation
2Q11
2Q12
YTD11
YTD12
FY11
FY12 Range
($ in millions)
Actual
Actual
Actual
Actual
Actual
Low
High
Diluted EPS from continuing operations (Non-GAAP)
$0.08
$0.12
$0.18
$0.27
$1.37
$1.50
$1.60
IBM Migration costs
-
(0.02)
-
(0.03)
(0.03)
(0.16)
(0.16)
Penson OTTI charge
-
(0.05)
-
(0.05)
-
(0.05)
(0.05)
Diluted EPS (GAAP)
$0.08
$0.05
$0.18
$0.19
$1.34
$1.29
$1.39
Free Cash Flow Reconciliation FY07-FY11
($ in millions)
Cash Flow from Operations (GAAP)
1,263
$
Capital expenditures & software purchases
191
$
Free Cash Flow (Non-GAAP)
1,072
$
Free Cash Flow Reconciliation
Unaudited
($ in millions)
Six Months Ended
December 2011
Low
High
Free Cash Flow
(Non-GAAP)
:
Net earnings from continuing operations (GAAP)
24
$
165
$
179
$
Depreciation and amortization (includes other LT
assets) 44
95
100
Stock-based compensation expense
13
31
31
Other
(7)
2
10
Subtotal
74
293
320
Working capital changes
52
(15)
(15)
Long-term assets & liabilities changes (b)
(30)
(55)
(45)
Net cash flow provided by continuing operating activities
95
223
260
Cash Flows From Investing Activities
IBM / ITO data center investment
(6)
(15)
(10)
Penson
(7)
(7)
(7)
Capital expenditures & software purchases
(16)
(65)
(55)
Free cash flow (Non-GAAP) (c)
67
$
136
$
188
$
FY12 Range
(a) |
 33
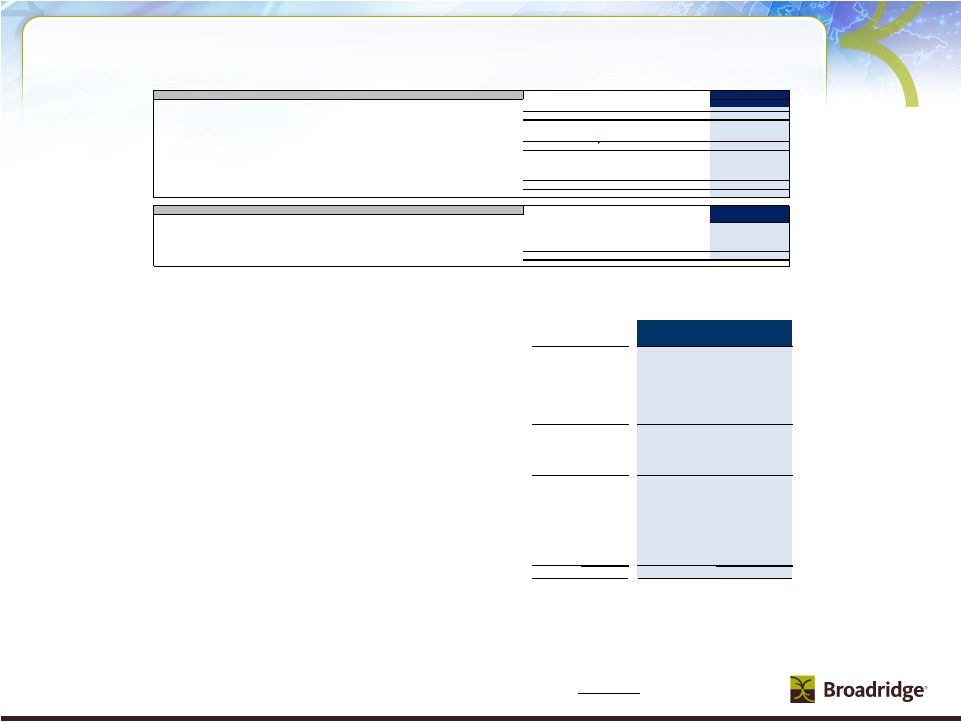
ICS Key Segment Revenue Stats
$ in millions
RC= Recurring
ED= Event-Driven
Key
Revenue
Drivers
Fee Revenues
FY09
FY10
FY11
Type
Proxy
Equities
272.5
$
276.5
$
279.5
$
RC
Stock Record Position Growth
-2%
-1%
0%
Pieces
288.0
293.2
283.8
2.50
Mutual Funds
55.0
$
149.7
$
39.0
$
ED
Pieces
73.5
204.2
51.4
Contests/Specials
26.9
$
20.6
$
15.0
$
ED
Pieces
30.8
26.0
15.8
Total Proxy
354.4
$
446.8
$
333.5
$
Total Pieces
392.3
523.4
351.0
Notice and Access Opt-in %
50%
54%
58%
Suppression %
50%
52%
53%
Interims
Mutual Funds (Annual/Semi-Annual Reports/Annual Prospectuses)
78.1
$
88.8
$
102.1
$
RC
Position Growth
3%
6%
9%
Pieces
440.5
476.0
525.3
Mutual Funds (Supplemental Prospectuses) & Other
58.0
$
47.8
$
44.0
$
ED
Pieces
349.6
266.2
253.2
Total Interims
136.1
$
136.6
$
146.1
$
Total Pieces
790.1
742.2
778.5
Transaction
Transaction Reporting/Customer Communications
132.0
$
142.8
$
155.9
$
RC
Reporting
Fulfillment
Fulfillment
(a)
109.5
$
109.5
$
116.8
$
RC
Other
Other -
Recurring
(b)
2.3
$
15.0
$
65.9
$
RC
Communications
Other -
Event-Driven
(c)
39.9
$
38.3
$
37.0
$
ED
Total Other
42.2
$
53.3
$
102.9
$
Total Fee Revenues
774.2
$
889.0
$
855.2
$
Total Distribution Revenues
(d)
756.8
$
780.6
$
704.2
$
Total
Revenues
as
reported
-
GAAP
1,531.0
$
1,669.6
$
1,559.4
$
FY12 Ranges
Low
High
Total RC Fees
594.4
$
632.6
$
720.2
$
804
$
813
$
Total ED Fees
179.8
$
256.4
$
135.0
$
130
$
130
$
FY12 Ranges
Low
High
Sales
1%
3%
2%
3%
4%
Losses
0%
-1%
0%
-1%
-1%
Net New Business
1%
2%
2%
2%
3%
Internal growth
0%
0%
0%
1%
1%
Recurring (Excluding Acquisitions)
1%
2%
2%
3%
4%
Acquisitions
0%
1%
3%
2%
2%
Total Recurring
1%
3%
5%
5%
6%
Event-Driven
-1%
5%
-7%
0%
0%
Distribution
-3%
1%
-5%
2%
2%
TOTAL
-3%
9%
-7%
7%
8%
(a) Consolidated Pre-sale and Post-sale Fulfillment and reclassified
Pre-sale from event-driven to recurring revenues. (b) Other Recurring
Fee Revenue includes Matrix, NewRiver, StockTrans, Access Data, Forefield and Tax Reporting.
(c) Other event-driven
includes
14.4M
pieces
for
FY09,
10.5M
pieces
for
FY10
and
8.3M
pieces
for
FY11,
primarily
related
to
corporate
actions.
(d) Total Distribution revenues primarily include pass-through revenues related
to the physical mailing of Proxy and Interims, as well as Matrix administrative services.
Note: Certain prior period amounts have been reclassified to conform with current
period presentation |
 34
SPS and Outsourcing Key Segment Revenue
Stats
$ in millions
All Revenues are Recurring
FY09
FY10
FY11
Equity
Transaction-Based
Equity Trades
258.5
$
237.8
$
238.8
$
Internal Trade Growth
6%
-2%
3%
Trade Volume (Average Trades per Day in '000)
1,602
1,542
1,572
Non-Transaction
Other Equity Services
193.6
$
195.4
$
211.0
$
Total Equity
452.1
$
433.3
$
449.8
$
Fixed Income
Transaction-Based
Fixed Income Trades
52.3
$
48.0
$
56.2
$
Internal Trade Growth
11%
-6%
13%
Trade Volume (Average Trades per Day in '000)
287
283
324
Non-Transaction
Other Fixed Income Services
29.4
$
29.5
$
29.9
$
Total Fixed Income
81.7
$
77.5
$
86.1
$
Outsourcing
Outsourcing
25.1
$
25.0
$
57.7
$
# of Clients
6
9
11
Total
Net
Revenue
as
reported
-
GAAP
558.9
$
535.9
$
593.6
$
Sales
6%
6%
4%
6%
6%
Losses
-4%
-4%
-3%
-1%
-1%
Key
Net New Business
2%
2%
1%
5%
5%
Revenue
Transaction & Non-transaction
5%
-2%
3%
1%
4%
Drivers
Concessions
-3%
-4%
-2%
-2%
-2%
Internal growth
2%
-6%
1%
-1%
2%
Acquisitions
1%
0%
9%
6%
6%
TOTAL
5%
-4%
11%
10%
13%
FY12 Ranges
Low
High |
 35
Broadridge ICS Definitions |