Attached files
| file | filename |
|---|---|
| 8-K - 8-K - MONTPELIER RE HOLDINGS LTD | a12-6371_28k.htm |
Exhibit 99.1
|
|
Investor Update Fourth Quarter 2011 Investor Presentation March 2012 |
|
|
Forward Looking Statements & Safe Harbor Application of the Safe Harbor of the Private Securities Litigation Reform Act of 1995: This presentation contains, and Montpelier Re may from time to time make, written or oral “forward-looking” statements within the meaning of the United States federal securities laws, pursuant to the safe harbor provisions of the Private Securities Litigation Reform Act of 1995, that are not historical facts, including statements about our beliefs and expectations. All forward-looking statements are based upon current plans, estimates and projections. Forward-looking statements rely on a number of assumptions concerning future events and are subject to a number of uncertainties and various risk factors, many of which are outside the Company’s control, that could cause actual results to differ materially from such statements. See “Risk Factors” contained in our Annual Report on Form 10-K for the fiscal year ended December 31, 2011, as filed with the Securities and Exchange Commission. In particular, statements using words such as “may,” “should,” “estimate,” “expect,” “anticipate,” “intend,” “believe,” “predict,” “potential,” or words of similar importance generally involve forward-looking statements. Important events and uncertainties that could cause our actual results, future dividends on, or repurchases of, Common Shares or Preferred Shares to differ include, but are not necessarily limited to: market conditions affecting the prices of our Common Shares or Preferred Shares; the possibility of severe or unanticipated losses from natural or man-made catastrophes, including those that may result from changes in climate conditions, including, but not limited to, global temperatures and expected sea levels; the effectiveness of our loss limitation methods; our dependence on principal employees; our ability to execute the business plans of the Company and its subsidiaries effectively; increases in our general and administrative expenses due to new business ventures, which expenses may not be recoverable through additional profits; the cyclical nature of the insurance and reinsurance business; the levels of new and renewal business achieved; opportunities to increase writings in our core property and specialty insurance and reinsurance lines of business and in specific areas of the casualty reinsurance market and our ability to capitalize on those opportunities; the sensitivity of our business to financial strength ratings established by independent rating agencies; the inherent uncertainty of our risk management process, which is subject to, among other things, industry loss estimates and estimates generated by modeling techniques; the accuracy of written premium estimates reported by cedants and brokers on pro-rata contracts and certain excess-of-loss contracts where a deposit or minimum premium is not specified in the contract; the inherent uncertainties of establishing reserves for loss and loss adjustment expenses, particularly on longer-tail classes of business such as casualty; unanticipated adjustments to premium estimates; changes in the availability, cost or quality of reinsurance or retrocessional coverage; changes in general economic and financial market conditions; changes in and the impact of governmental legislation or regulation, including changes in tax laws in the jurisdictions where we conduct business; our ability to assimilate effectively the additional regulatory issues created by our entry into new markets; the amount and timing of reinsurance recoverables and reimbursements we actually receive from our reinsurers; the overall level of competition, and the related demand and supply dynamics in our markets relating to growing capital levels in our industry; declining demand due to increased retentions by cedants and other factors; the impact of terrorist activities on the economy; rating agency policies and practices; unexpected developments concerning the small number of insurance and reinsurance brokers upon whom we rely for a large portion of revenues; our dependence as a holding company upon dividends or distributions from our operating subsidiaries; and the impact of foreign currency fluctuations. Montpelier undertakes no obligation to publicly update or revise any forward-looking statements, whether as a result of new information, future events or otherwise. Readers are cautioned not to place undue reliance on these forward-looking statements, which speak only as of the dates on which they are made. 2 |
|
|
Highlights We are a recognized global leader with a specialty focus on property catastrophe and short-tail reinsurance 3 Focused approach: leading provider of short-tail reinsurance and other specialty lines Cutting-edge Cat modeling: proprietary CATM pricing and risk management tools provide competitive advantage Experienced management team: average of 25 years market experience Conservative, high quality balance sheet: strong track record of conservative reserving Active capital management: opportunistic deployment of capital to pursue improving pricing prospects Focus on growing book value per share: 13.3% annualized growth in book value per share since December 2005 |
|
|
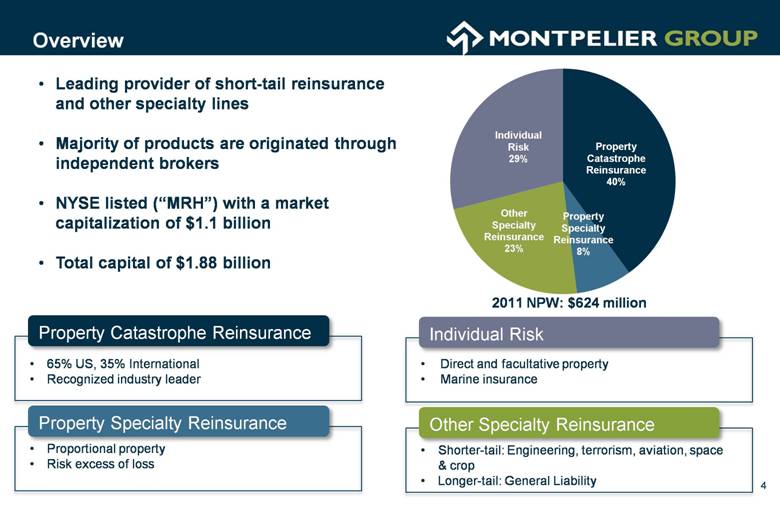
2011 NPW: $624 million Leading provider of short-tail reinsurance and other specialty lines Majority of products are originated through independent brokers NYSE listed (“MRH”) with a market capitalization of $1.1 billion Total capital of $1.88 billion 4 65% US, 35% International Recognized industry leader Property Catastrophe Reinsurance Proportional property Risk excess of loss Property Specialty Reinsurance Direct and facultative property Marine insurance Individual Risk Shorter-tail: Engineering, terrorism, aviation, space & crop Longer-tail: General Liability Other Specialty Reinsurance Overview |
|
|
Competitive Positioning Focused on short-tail reinsurance, the most attractively priced segment of the market 5 Source: Company filings, SNL as of 12/31/11. Note: Size of bubbles representative and indicative of Common Equity. 5 |
|
|
6 Original operating platform formed in late 2001 Catastrophe center of excellence Team of 20 underwriters & risk analysts Strong broker and cedant relationships Operations in UK, Switzerland and U.S. Established market player Strong broker and cedant relationships Benefits from Lloyd’s rating and licenses Sharpened Underwriting Focus |
|
|
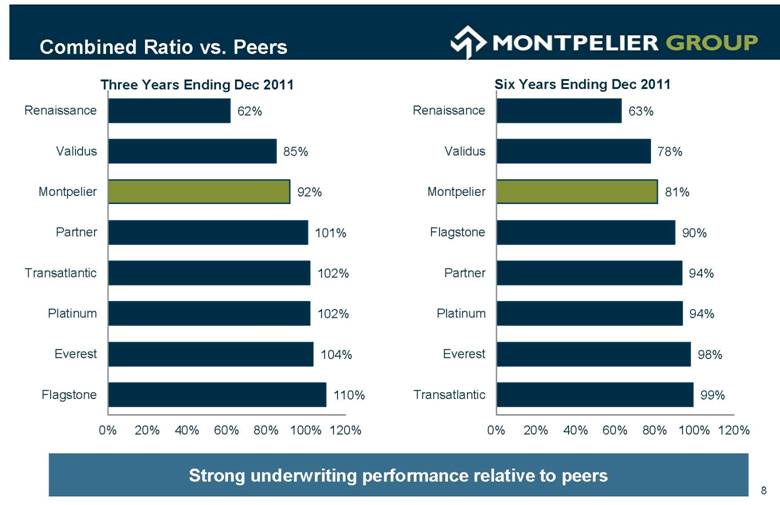
Historical Underwriting Performance Strong underwriting track record 7 Net Premiums Written and GAAP Combined Ratio MRH 6-yr. Avg. Combined Ratio: 81% Peer 6-yr Avg. Combined ratio: 87% Selected Peer Group: Platinum, Validus, Partner, Everest, Renaissance, Transatlantic, Flagstone |
|
|
Combined Ratio vs. Peers Three Years Ending Dec 2011 8 Six Years Ending Dec 2011 Strong underwriting performance relative to peers |
|
|
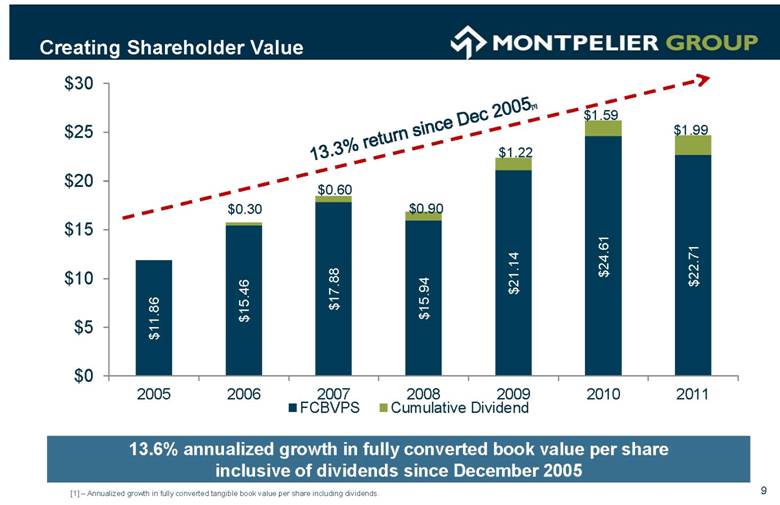
13.6% annualized growth in fully converted book value per share inclusive of dividends since December 2005 9 Creating Shareholder Value 13.3% return since Dec 2005[1] [1] – Annualized growth in fully converted tangible book value per share including dividends. |
|
|
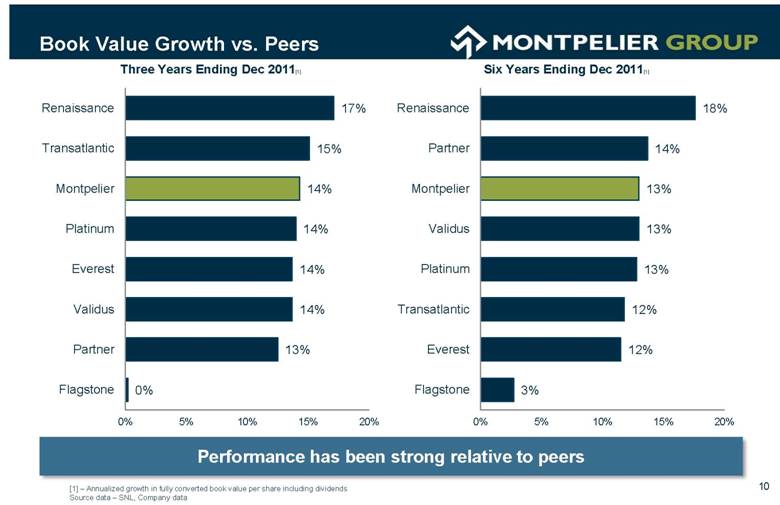
Book Value Growth vs. Peers [1] – Annualized growth in fully converted book value per share including dividends Source data – SNL, Company data Three Years Ending Dec 2011[1] Performance has been strong relative to peers 10 Six Years Ending Dec 2011[1] |
|
|
Strong and transparent balance sheet Strong Transparent Balance Sheet Low reserve, investment and financial leverage Conservative reserving track record Limited exposure to longer-tail reserve volatility Low reinsurance recoverables High quality, low duration investment portfolio No intangible assets 11 |
|
|
Stable Capital Base ($ in millions) Stable and flexible capital base, balanced capital structure 12 Total Underwriting Capital at January 1, 2012 of $2,044 million |
|
|
Reserving Track Record Favorable Prior Year Reserve Development ($m) Prudent reserving track record 13 Annual review of reserve adequacy is performed by an independent actuarial firm |
|
|
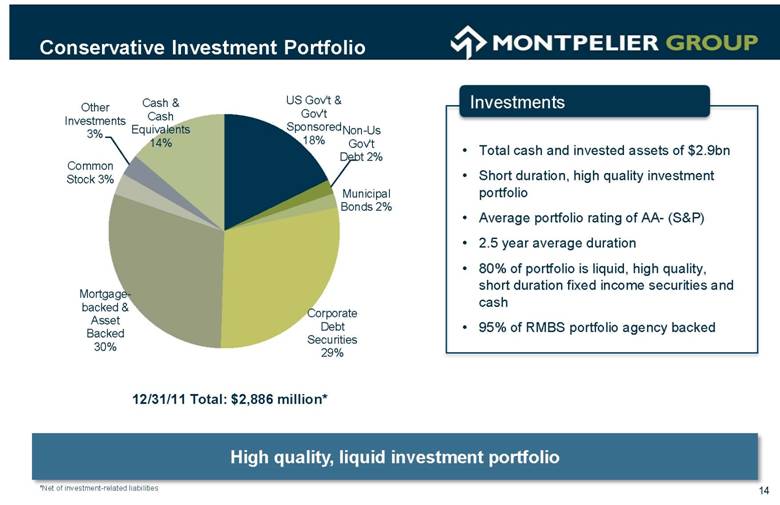
Conservative Investment Portfolio High quality, liquid investment portfolio 12/31/11 Total: $2,886 million* 14 Investments Total cash and invested assets of $2.9bn Short duration, high quality investment portfolio Average portfolio rating of AA- (S&P) 2.5 year average duration 80% of portfolio is liquid, high quality, short duration fixed income securities and cash 95% of RMBS portfolio agency backed *Net of investment-related liabilities |
|
|
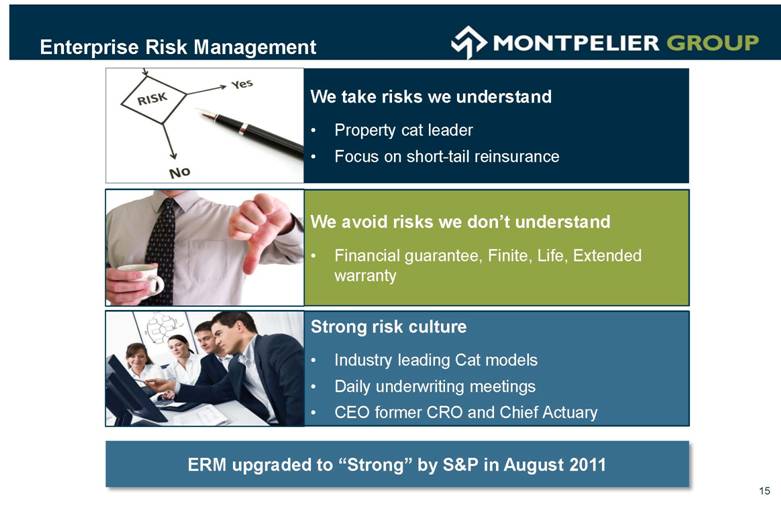
Enterprise Risk Management 15 We take risks we understand Property cat leader Focus on short-tail reinsurance We avoid risks we don’t understand Financial guarantee, Finite, Life, Extended warranty Strong risk culture Industry leading Cat models Daily underwriting meetings CEO former CRO and Chief Actuary ERM upgraded to “Strong” by S&P in August 2011 |
|
|
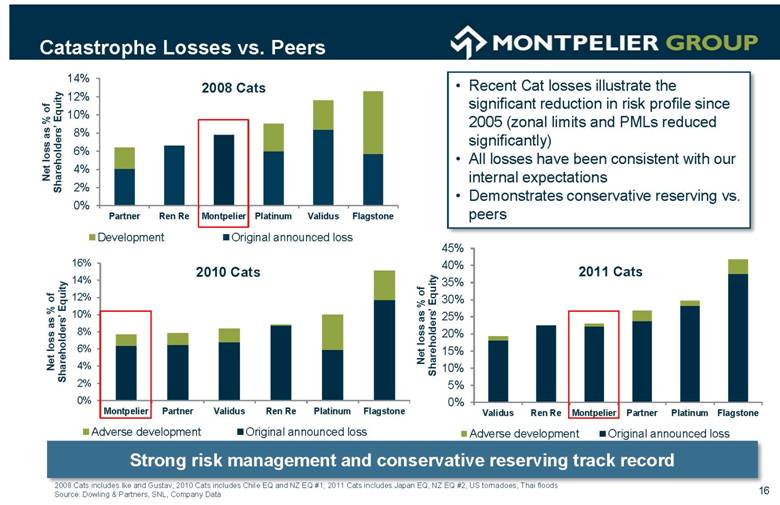
2008 Cats Recent Cat losses illustrate the significant reduction in risk profile since 2005 (zonal limits and PMLs reduced significantly) All losses have been consistent with our internal expectations Demonstrates conservative reserving vs. peers 2008 Cats includes Ike and Gustav; 2010 Cats includes Chile EQ and NZ EQ #1; 2011 Cats includes Japan EQ, NZ EQ #2, US tornadoes, Thai floods Source: Dowling & Partners, SNL, Company Data 16 Adequate Excellent Strong Adequate Adequate n/a 2010 Cats 2011 Cats Catastrophe Losses vs. Peers Strong risk management and conservative reserving track record |
|
|
Net Impact from Single Event Losses by Return Period 17 ($ in millions) A “100-year” return period can also be referred to as the 1.0% occurrence exceedance probability (“OEP”) meaning there is a 1.0% chance in any given year that this level will be exceeded. A “250-year” return period can also be referred to as the 0.4% OEP meaning there is a 0.4% chance in any given year that this level will be exceeded. Enhanced Cat Exposure Disclosure in 2012 |
|
|
Net Reinsurance Treaty Limits by Zone U.S. Hurricane U.S. Earthquake European Windstorm Other 18 ($ in millions) (1) “New Madrid” includes Missouri, Tennessee, Arkansas, Illinois, Kentucky, Indiana, Ohio and Michigan; Enhanced Cat Exposure Disclosure in 2012 |
|
|
Reaction to New Cat Exposure Disclosure Barclays, Jay Gelb - “MRH provided new disclosures of its property reinsurance treaty exposure by catastrophe zone, which shows the company's total exposure to large catastrophes is manageable. We commend MRH for this enhanced disclosure and recommend other reinsurers and insurers provide similar data to offer investors a better sense of individual companies' exposure to major catastrophe events.” VJ Dowling - “Regarding the company’s risk profile, we applaud management on its new cat exposure details = we believe the disclosure, particularly net zonal limits, is significantly improved from the prior % market share loss data & should help investors better understand the company’s risk profile going forward (particularly as we get more history).” Stern Agee, Dan Farrell - “Along with the quarter results, the company included a detailed disclosure showing the net impact from single event losses by return period along with net reinsurance treaty limits by zone. ..We believe the detailed disclosure will provide investors with increased confidence in the company's risk and exposure management.” Responding to analyst and investor feedback 19 |
|
|
Well Positioned for 2012 and Beyond Sharper Underwriting focus Enhanced Competitive Profile In 2011 we undertook a number of important strategic initiatives to position us well for 2012 and beyond 20 Sale of non-core business (MUSIC) in September 2011 Acquisitions of renewal rights (Torus) in August 2011 Increased Capital Flexibility Expansion of third party underwriting partnerships $150m of preferred securities raised in May 2011 Chris Schaper joined as President of Montpelier Bermuda |
|
|
Key Takeaways Well positioned for value creation: Focused strategy Strong competitive position Cutting-edge Cat pricing and portfolio optimization tools Strong risk management Strong conservative, high quality balance sheet Excellent capital adequacy and capital flexibility Improved Cat exposure disclosures Underweight long-tail lines Well positioned to outperform peers over next 1 - 3 years 21 |
|
|
Appendix |
|
|
Appendix – Summary Consolidated Balance Sheets 23 ($ millions, except per share amounts) Please see the December 31, 2011 Financial Supplement on www.montpelierre.bm for more details, including non-GAAP Financial Measures |
|
|
Appendix – Summary Consolidated Income Statements 24 ($ millions, except per share amounts) Please see the December 31, 2011 Financial Supplement on www.montpelierre.bm for more details, including non-GAAP Financial Measures |
|
|
Appendix – Consolidated Investment Portfolio 25 ($ millions) Please see the December 31, 2011 Financial Supplement on www.montpelierre.bm for more details, including non-GAAP Financial Measures |
|
|
Please visit our website for more information about our company, products and team members: www.montpelierre.bm Street Address: Montpelier House, 94 Pitts Bay Road Pembroke, Bermuda Mailing Address: PO Box HM 2079 Hamilton, Bermuda, HMHX Contact Name: William (Bill) Pollett, Chief Strategy and Development Officer,Treasurer Telephone: +1-441-299-7576 Email: bill.pollett@montpelierre.bm |