Attached files
| file | filename |
|---|---|
| 8-K - OVERSEAS SHIPHOLDING GROUP INC | earn8k4q.htm |
| EX-99 - OVERSEAS SHIPHOLDING GROUP INC | earn8k4qex991.htm |
Exhibit 99.2

Fourth Quarter Fiscal 2011 Earnings
Conference Call
Conference Call
February 28, 2012

page 2
Forward-Looking Statements
This presentation contains forward-looking statements regarding the Company's prospects, including the outlook
for tanker and articulated tug barge markets, changing oil trading patterns, anticipated levels and timing of
newbuilding and scrapping, prospects for certain strategic alliances and investments, estimated TCE rates
achieved for the first quarter of 2012 and for the second, third and fourth quarters of 2012, projected scheduled
drydock and off hire days for each quarter of 2012, timely delivery of newbuildings in accordance with
contractual terms, projected locked-in charter revenue and locked-in time charter days for 2012 through 2015
and thereafter, estimated revenue and expense items, levels of equity income and capital expenditures for 2012,
the profitability in 2012 of certain business units and OSG’s LNG and FSO joint ventures, OSG’s ability to
access capital markets, raise additional debt financing, sell assets, enter joint ventures, securitize charter
revenue, and achieve its liquidity goals, OSG’s projected compliance with financial covenants in 2012, OSG’s
ability to reduce charter rates on certain chartered-in vessels, to further reduce general and administrative
expense and to achieve fuel cost savings across OSG’s fleet, prospects of OSG’s strategy of being a market
leader in the segments in which it competes, the projected growth of the Jones Act and world tanker fleets, and
the forecast of world economic activity and oil demand. These statements are based on certain assumptions
made by OSG management based on its experience and perception of historical trends, current conditions,
expected future developments and other factors it believes are appropriate in the circumstances. Forward-
looking statements are subject to a number of risks, uncertainties and assumptions, many of which are beyond
the control of OSG, which may cause actual results to differ materially from those implied or expressed by the
forward-looking statements. Factors, risks and uncertainties that could cause actual results to differ from the
expectations reflected in these forward-looking statements are described in the Company’s Annual Report for
2010 on Form 10-K and those risks discussed in the other reports OSG files with the Securities and Exchange
Commission.

page 3
Financial Highlights
< Fiscal 2011 results reflected trough markets in Crude and Products
• TCE revenues $790M, down 7% vs. 2010
• Reported net loss $193M
< Fourth quarter results were dragged down by continued weak Crude
freight rates, which offset contributions from Products and U.S. Flag
segments
freight rates, which offset contributions from Products and U.S. Flag
segments
• TCE revenues were $190M, a 4% increase from $183M in 4Q2010
• Reported net loss of $50M or $1.65 per diluted share
< U.S. Flag results continued to improve throughout 2011
• 2011 operating income of $45M vs. $3M in 2010 1
< G&A in 2011 was $83 million, a 42% reduction from $144 million in 2008
1 Before direct and allocated General and Administrative expense.

page 4
OSG Management is Focused on Reducing Costs,
Improving Liquidity and Providing Capital for Growth
Improving Liquidity and Providing Capital for Growth
< As we begin the year,
• We have more than adequate cash and availability to operate the Company throughout 2012
• We expect cash flow from operations to cover most or all of our requirements in 2012
• We expect to remain in full compliance with our financial covenants throughout 2012
< Management is now pursuing a range of options to enhance financial flexibility and
increase liquidity, including but not limited to:
increase liquidity, including but not limited to:
• Over $600 million in potential new secured debt on existing unencumbered assets
• Selective vessel sales
• Joint venturing of existing assets
• Incremental credit availability from existing and new banks
• Securitization of long-term charter revenue
• U.S. tax leases for selected U.S. flag assets
• Public issuance from shelf registration to the extent markets become attractive
< Our liquidity goals are achievable with any of a number of combinations of the above - we
will strike the optimal balance
will strike the optimal balance
< The incremental liquidity raised will see us into the future and provide capital for growth

page 5
How are we managing OSG through this downturn?
< We continue to reduce shoreside G&A and control costs at sea
• Reduced G&A expense by $17M in 2011 and additional steady state savings will be achieved
• Vessel operating expenses are well contained and we continue to maintain high quality standards
• Fuel cost savings initiative is bearing fruit - material cost savings expected
< We continue to improve the economics of our chartered-in vessel portfolio by
redelivering and repricing higher cost charters-in
redelivering and repricing higher cost charters-in
• In 2012 we will redeliver 11.9 VLCCs, Suezmax and Aframax tankers 1
• Finalized charter rates reductions on four chartered-in product carriers
• Current weak charter markets should enable us to replace more expensive charters-in with
profitable charters-in in all our International segments
profitable charters-in in all our International segments
< We are intensely focused on commercially outperforming the market
• Fleet of 37 MRs positions us well in this market
< We expect to drive increased distributions from our LNG and FSO joint ventures
< Our forward capital commitments are minimal
• Our Products and U.S. Flag newbuilding programs are now complete
• Only 2 Aframaxes now remain on order - $53M in remaining payments thru 2013 delivery
1 Based on OSG’s share in such time charters. Includes certain chartered-in vessels not included in Fleet List.

page 6
Update on Title XI Applications
< OSG filed the initial application for $241.8 million, 25-
year financing of our two Jones Act shuttle tankers in
2010
year financing of our two Jones Act shuttle tankers in
2010
< Two years later, MARAD was indicating a reduction to a
$200 million facility (before an estimated $16 million in
fees), with a shorter term structure and onerous sinking
fund features
$200 million facility (before an estimated $16 million in
fees), with a shorter term structure and onerous sinking
fund features
< We withdrew our Title XI application for these vessels
earlier this month when it became apparent that it would
not be approved on the original terms as submitted
earlier this month when it became apparent that it would
not be approved on the original terms as submitted
< We have a number of options already underway for our
two shuttle tankers, both of which are debt-free and on
long-term charters to Petrobras
two shuttle tankers, both of which are debt-free and on
long-term charters to Petrobras
< Because of the requirement to redeposit the proceeds
into our Capital Construction Fund, the Title XI financing
for the ATBs is less attractive than the other options
available to us and we are therefore unlikely to pursue it
into our Capital Construction Fund, the Title XI financing
for the ATBs is less attractive than the other options
available to us and we are therefore unlikely to pursue it
Shuttle Tankers
ATBs

page 7
< So far in 2012, Crude spot rates
have picked up from depths
reached in the last 6 months of
2011
have picked up from depths
reached in the last 6 months of
2011
< We believe the International
tanker markets bottomed out in
the second half of 2011
tanker markets bottomed out in
the second half of 2011
2012 Outlook
1 Estimated spot TCEs achieved in 1Q2012 through February 17, 2012 as reported in OSG’s 4Q2011 earnings press release dated February 28, 2012.
< We expect somewhat better rates in our International markets in 2012, and
our substantial operating leverage to International Crude and Products
markets will make us a major beneficiary of a market upturn
our substantial operating leverage to International Crude and Products
markets will make us a major beneficiary of a market upturn
< Jones Act fundamentals remain strong with upward pressure on rates

page 8
2012 Outlook - International Crude
Higher Utilization as More Longer-Haul Crudes Move Both West and East
Higher Utilization as More Longer-Haul Crudes Move Both West and East
< Increase in long-haul crude oil movements to the West
• Middle East to U.S. Gulf Coast crude movements from startup of 325 kbpd Motiva refinery expansion
in Port Arthur, Texas
in Port Arthur, Texas
< Significant increase in refining capacity and refining runs in Asia
• New refining capacity of 500 kbpd in China and 300 kbpd in India
• Rebound in 2012 Japanese refinery runs vs. 2011 post-earthquake/tsunami
< Seaborne movement to fully meet increases in China’s 2012 oil demand levels
• In 2011, Chinese demand was partially met by an increase in Russian crudes via new ESOP pipeline -
no additional pipeline crude movements forecast in 2012
no additional pipeline crude movements forecast in 2012
< Reduction in light sweet / heavy sour crude price differentials (Brent-Dubai spread)
• Provides economic incentive for Asian refineries to run more longer-haul West African crudes over
shorter-haul Middle East crudes
shorter-haul Middle East crudes
< Potential Wildcards
• Increase in strategic reserves in Asia, especially in China from completion of Phase 2 SPR program
with 8 sites and combined storage capacity of 200 million barrels
with 8 sites and combined storage capacity of 200 million barrels
• Iran sanctions may result in longer-haul movements and increase in Iranian floating storage

page 9
2012 Outlook - International Products
Positive Outlook for Products Trade in 2012, Especially in Atlantic Basin
Positive Outlook for Products Trade in 2012, Especially in Atlantic Basin
< Forecast increase in product exports from U.S. Gulf Coast
• Start-up of incremental and upgrade refining capacity to increase products available for export
• Increase in product demand in Latin America combined with Hovensa refinery closure reduces
product supply in Latin America and results in increasing exports from Gulf Coast into Caribbean
and Latin America areas
product supply in Latin America and results in increasing exports from Gulf Coast into Caribbean
and Latin America areas
• Continued diesel exports into Europe
< Refinery shutdowns in Atlantic Basin removes about 500 kbpd of clean product
supply on U.S. East Coast
supply on U.S. East Coast
• Gasoline requirements on U.S. East Coast to be sourced from incremental product movements
from Europe, Canada, Russia and Asia
from Europe, Canada, Russia and Asia
< Increase in Avjet deficit position in Europe and Latin America
• Increase in product movements primarily from Asia
< Continued and growing clean product deficit position in Africa
• Increase in product movements primarily from Asia
< Result: Rising rates as growth in tonne-mile demand in 2012 exceeds increase in
supply
supply

page 10
2012 Outlook - U.S. Flag
Jones Act Market Continues to Tighten
Jones Act Market Continues to Tighten
< Jones Act fleet expected to experience modest growth through 2015
• Current fleet of 55 vessels reflects 10 retirements in 2011
• 5 vessels on order, with 2 mandatory retirements
< All vessels are currently employed - spot rates and utilization are rising and
period inquiry is increasing
period inquiry is increasing
< Motiva start-up increases products availability in U.S. Gulf - opportunity for
additional Jones Act movements, especially into Florida
additional Jones Act movements, especially into Florida
• Product imports into Florida of 150 kbpd in 2011, mostly from Hovensa refinery
in St. Croix - refinery now in permanent shutdown in early February
in St. Croix - refinery now in permanent shutdown in early February
< Recent U.S. East Coast refinery closures creates potential for upcoast
Jones Act movements
Jones Act movements

page 11
In Summary
< Management remains committed to managing the Company conservatively
and in controlling costs vigilantly
and in controlling costs vigilantly
< We expect some improvement in our International markets, as reflected in
rates year-to-date in 2012
rates year-to-date in 2012
• We have substantial operating leverage and will benefit greatly from an upturn
< We expect solid contributions from our U.S. Flag business and our LNG
and FSO joint ventures this year
and FSO joint ventures this year
< We have ample liquidity available to us and expect to remain in full
compliance with all of our financial covenants this year
compliance with all of our financial covenants this year
< Our remaining capital commitments are minimal, and our refinancing
requirements are manageable
requirements are manageable
< We are pursuing a wide array of options to strengthen liquidity and provide
capital for growth and are confident about our ability to execute on them
capital for growth and are confident about our ability to execute on them

page *
Financial Review
Myles Itkin, CFO
page 13
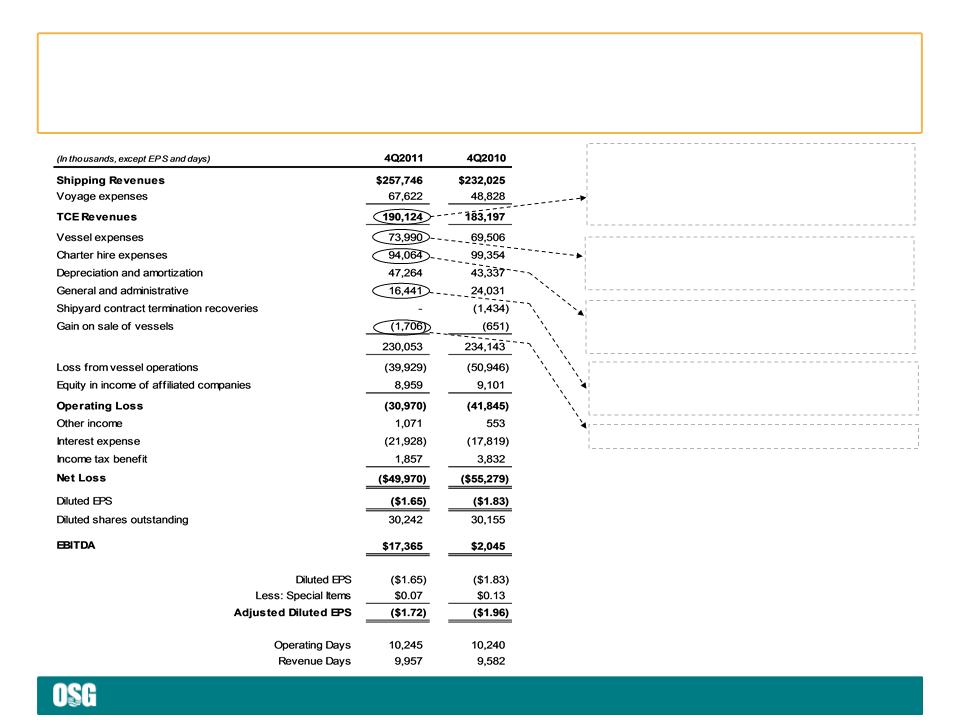
Financial Review - Income Statement
Reflects impact of 375-day increase in revenue days
quarter-over-quarter due to growth in U.S. Flag Product
Carriers, MRs and Suezmaxes as well as the return to
service of two LR1s that were undergoing repairs for most
of the 2010 period
quarter-over-quarter due to growth in U.S. Flag Product
Carriers, MRs and Suezmaxes as well as the return to
service of two LR1s that were undergoing repairs for most
of the 2010 period
Reflects gain on sale of OSG 400 and two tugs
Reflects 325 fewer charter-in days in the current period as
well as a $5,000 per day reduction in daily time charter-in
rates for one VLCC and one Aframax
well as a $5,000 per day reduction in daily time charter-in
rates for one VLCC and one Aframax
Reflects reductions in headcount and $6M in incentive
compensation payable as well as other cost cutting
measures
compensation payable as well as other cost cutting
measures
Reflects growth in U.S. Flag operating fleet and return to
service of OSG 209 and OSG 214 from layup as well as
current year deliveries in Int’l Products fleet
service of OSG 209 and OSG 214 from layup as well as
current year deliveries in Int’l Products fleet
page 14
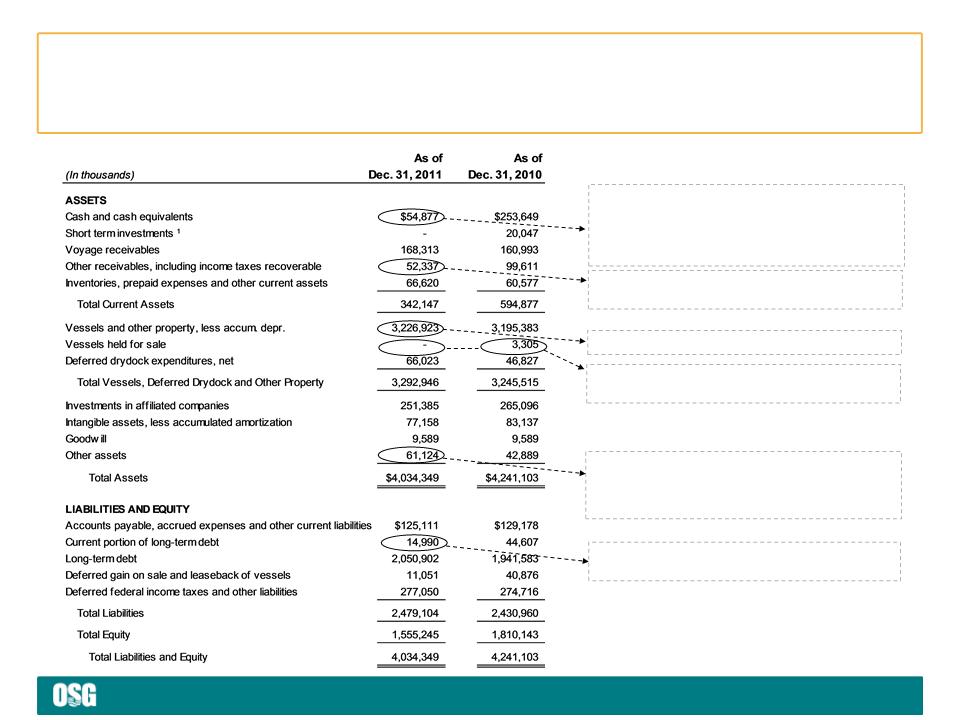
Financial Review - Balance Sheet
Reflects $183M drawn under revolving credit facility
and CEXIM facility, offset by $194M in expenditures for
vessels & other fixed assets, $105M in debt
repayments and $47M in dividends paid to
shareholders
and CEXIM facility, offset by $194M in expenditures for
vessels & other fixed assets, $105M in debt
repayments and $47M in dividends paid to
shareholders
Overseas New Orleans delivered to buyers during
1Q2011
1Q2011
Decrease reflects $41M tax refund received in January
2011
2011
1 Short term investments consists of time deposits with maturities greater than 3 months
Includes CIP of $240M for 4 vessels
Includes deferred costs associated with forward start
facility (and other investments designed to offset the
mark-to-market movement in unfunded pension
obligations)
facility (and other investments designed to offset the
mark-to-market movement in unfunded pension
obligations)
Reflects December 2011 prepayments of principal
otherwise due in 2012 and 2013
otherwise due in 2012 and 2013
page 15
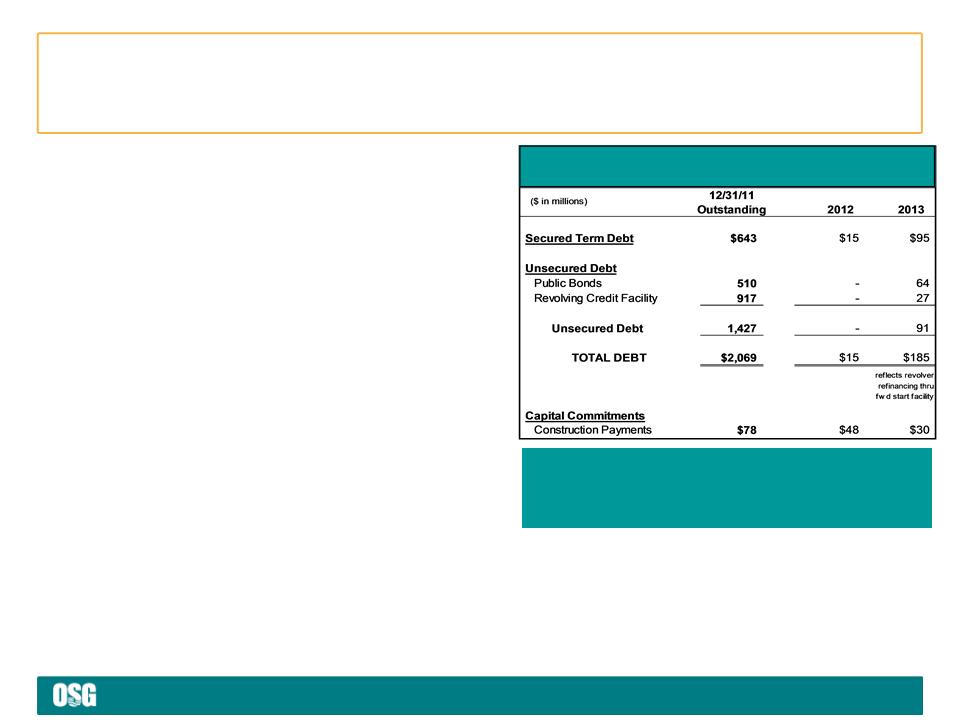
< Strong liquidity profile
• Cash and availability under
unsecured revolving credit facility
totals $0.8B 1
unsecured revolving credit facility
totals $0.8B 1
• Liquidity-adjusted debt 2 to capital =
56.2%
56.2%
• Manageable debt and refinancing
obligations over next two years
obligations over next two years
• Future construction commitments of
$78M
$78M
< Large unsecured asset base
• 72% of Vessel NBV is unsecured
Financial Flexibility
Ample Liquidity and Minimal Capital Commitments
Ample Liquidity and Minimal Capital Commitments
|
Covenants on Revolving Credit Facility
(matures in Feb. 2013) 3
|
||
|
Covenant 4Q2011 Capacity
|
||
|
Maximum Leverage 4
< 60% |
46%
|
$1.5B add’l debt
|
|
Minimum Tangible Net Worth
³ $1.2B
|
$2.3B
|
$1.1B in losses
|
|
Minimum
Unencumbered Assets 5
³ 150%
|
205%
|
$0.6B new secured
debt on $0.8B of vessels |
All figures as of December 31, 2011. 1 Availability under unsecured revolving credit facility is before a $150 million reduction that occurred in February 2012. 2 Long-term debt
reduced by Cash and Equivalents. 3 Preliminary figures. 4 Funded indebtedness to total capitalization. 5 Unencumbered tangible assets to unsecured debt; capacity
assumes 70% advance ratio.
reduced by Cash and Equivalents. 3 Preliminary figures. 4 Funded indebtedness to total capitalization. 5 Unencumbered tangible assets to unsecured debt; capacity
assumes 70% advance ratio.
Debt Repayment and Capital Commitments

page 16
2012 Guidance
< Estimated vessel expenses $300M to $315M
< Time and bareboat charter hire expenses $350M to $360M
< Depreciation and amortization $195M to $205M
< G&A $80M to $87M
< Equity income of affiliated companies $25M to $30M
< Interest expense $87M to $95M
< Capital expenditures
– Drydock costs $40M for full year (on 33 vessels)
(Q1 $14M; Q2 $15M; Q3 $3M; Q4 $8M)
– Newbuild progress payments, vessel $56M for full year
improvements and capitalized interest (Q1 $27M; Q2 $10M; Q3 $7M; Q4 $12M)

page *
Appendix
page 18
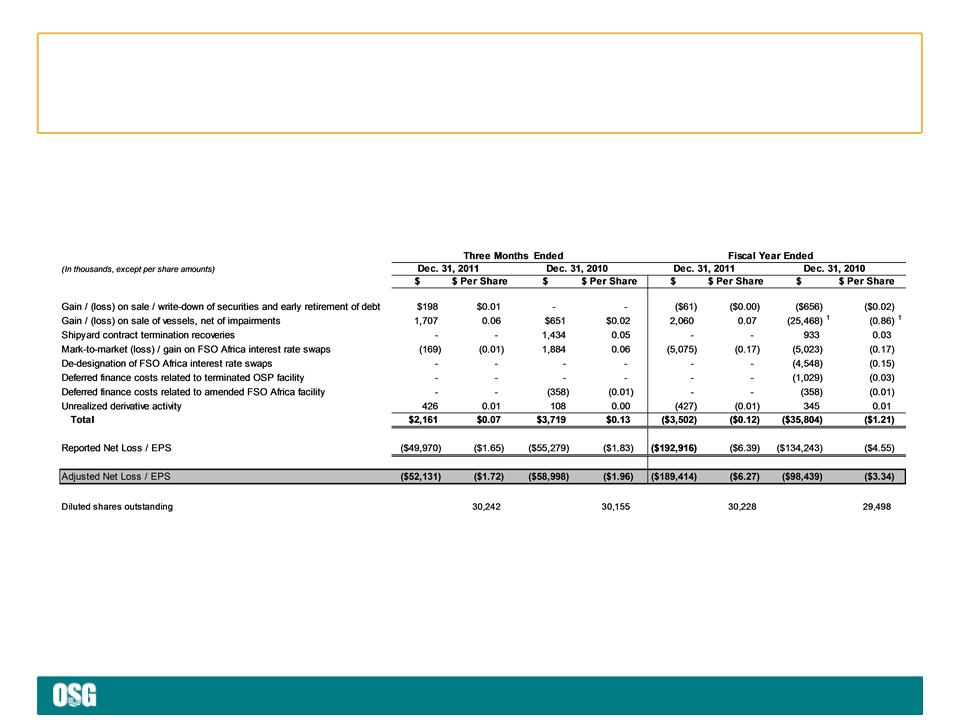
Reconciling Items
Special Items Affecting Net Loss
Set forth below are significant items of income and expense that affected the Company’s results for the three months and fiscal years ended
December 31, 2011 and 2010, all of which are typically excluded by securities analysts in their published estimates of the Company’s financial
results.
December 31, 2011 and 2010, all of which are typically excluded by securities analysts in their published estimates of the Company’s financial
results.
1 The U.S. Flag asset impairment charges have been tax effected from the pre-tax charge of $28.6 million.

page 19
Reconciling Items (cont’d)
EBITDA
EBITDA represents operating earnings before interest expense and income taxes, plus other income/(expense) and depreciation and
amortization expense. EBITDA is presented to provide investors with meaningful additional information that management uses to monitor ongoing
operating results and evaluate trends over comparative periods. EBITDA should not be considered a substitute for net income / (loss) or cash
flow from operating activities prepared in accordance with accounting principles generally accepted in the United States or as a measure of
profitability or liquidity. While EBITDA is frequently used as a measure of operating results and performance, it is not necessarily comparable to
other similarly titled captions of other companies due to differences in methods of calculation.
TCE Revenues

page 20
Fleet Composition - As of February 24, 2012
|
|
Owned
|
Chartered-in
|
Total
|
Newbuild
|
Total
|
|
VLCC
|
11
|
4
|
15
|
-
|
15
|
|
FSO
|
2
|
-
|
2
|
-
|
2
|
|
Suezmax
|
-
|
3
|
3
|
-
|
3
|
|
Aframax
|
6
|
3
|
9
|
2
|
11
|
|
Panamax
|
9
|
-
|
9
|
-
|
9
|
|
Lightering
|
2
|
4
|
6
|
-
|
6
|
|
Total Crude
|
30
|
14
|
44
|
2
|
46
|
|
LR1
|
4
|
2
|
6
|
-
|
6
|
|
MR *
|
17
|
22
|
39
|
-
|
39
|
|
Total Products
|
21
|
24
|
45
|
-
|
45
|
|
Product Carrier
|
2
|
10
|
12
|
-
|
12
|
|
Clean ATB
|
7
|
-
|
7
|
-
|
7
|
|
Lightering ATB
|
3
|
-
|
3
|
-
|
3
|
|
Total U.S. Flag
|
12
|
10
|
22
|
-
|
22
|
|
Total Gas
|
4
|
-
|
4
|
-
|
4
|
|
TOTAL
|
67
|
48
|
115
|
2
|
117
|
* Products MR operating fleet Includes 2 owned U.S. Flag MRs that trade internationally, a car carrier and a chemical tanker.
page 21
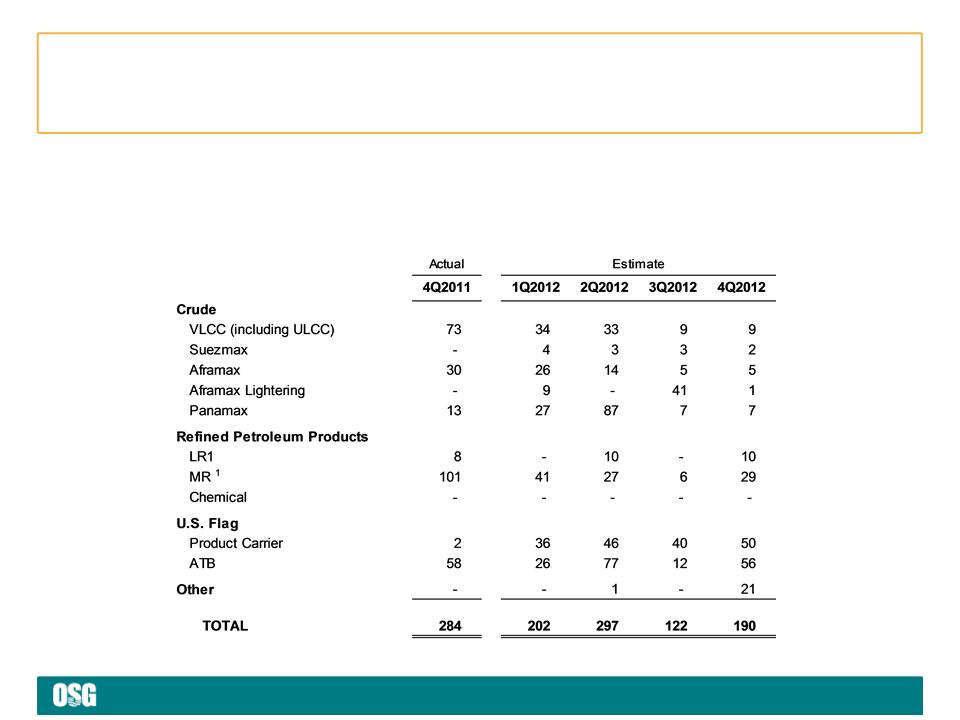
Off Hire Schedule
Off Hire and Scheduled Drydock
In addition to regular inspections by OSG personnel, all vessels are subject to periodic drydock, special survey and other scheduled or known
maintenance and repairs. The table below sets forth, by vessel class, actual days off hire for the fourth quarter of 2011 and anticipated days off
hire for the four quarters of 2012 for the above-mentioned events.
maintenance and repairs. The table below sets forth, by vessel class, actual days off hire for the fourth quarter of 2011 and anticipated days off
hire for the four quarters of 2012 for the above-mentioned events.

page 22
Charter Hire Expense by Segment
For the Quarter Ended December 31, 2011
($ in thousands)
Note: Vessels chartered-in for less than one year are not on the Company’s fleet list.
page 23
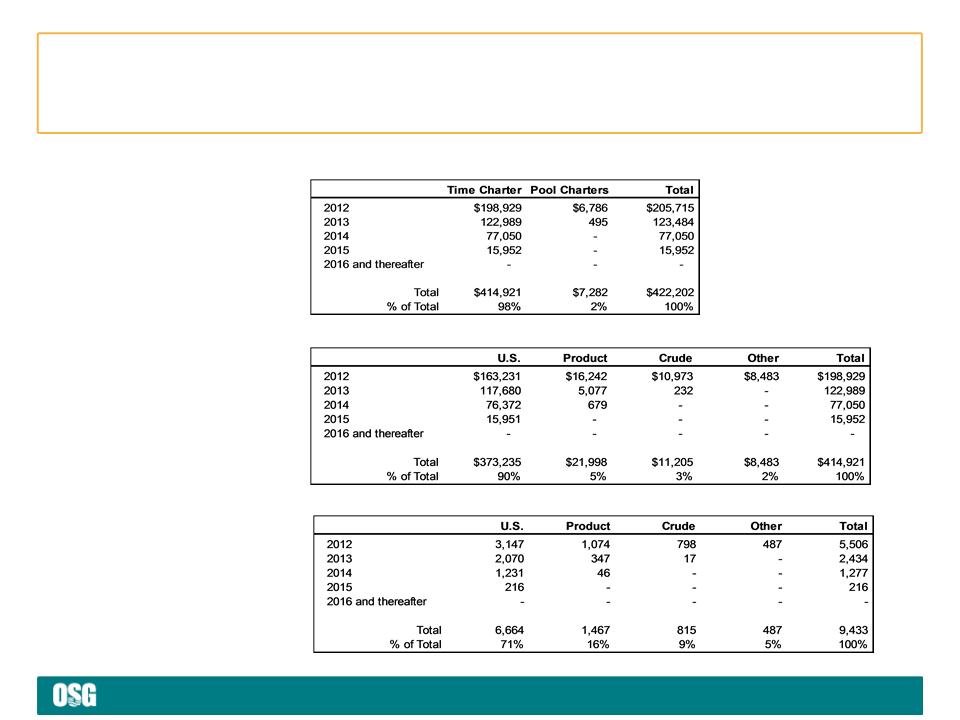
Future Revenue $/Days by Segment
As of December 31, 2011
As of December 31, 2011
Locked-in Time Charter
Days by Segment
Days by Segment
Locked-in Time Charter
Revenue by Segment
Revenue by Segment
($ in 000)
Locked-in
Charter Revenue
Charter Revenue
($ in 000)
Note: Locked-in time charter days for 2012 are as of 12/31/11 and will differ from a more current date used in Appendices 3 and 4 in the quarterly
earnings press release.
earnings press release.

page *
www.osg.com