Attached files
| file | filename |
|---|---|
| 8-K - FORM 8-K - NORTH VALLEY BANCORP | nvb_8k.htm |
Exhibit 99.189

NASDAQ: NOVB WEST COAST FINANCIAL SERVICES CONFERENCE NORTH VALLEY BANCORP MICHAEL CUSHMAN, CEO & PRESIDENT

This presentation contains certain forward - looking statements that are subject to risks and uncertainties that could cause actual results to differ materially from those stated herein . For a discussion of factors that could cause actual results to differ, please refer to the Company’s periodic reports filed with the Securities and Exchange Commission, including its annual report on Form 10 - K for the year ended December 31 , 2011 (and in particular, the discussion of risk factors within that report) which should be considered when evaluating the business prospects of the Company . DISCLAIMER DISCLOSURE 2
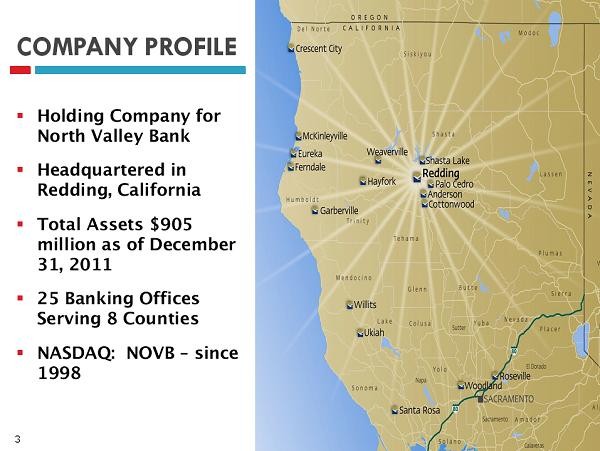
▪ Holding Company for North Valley Bank ▪ Headquartered in Redding, California ▪ Total Assets $905 million as of December 31, 2011 ▪ 25 Banking Offices Serving 8 Counties ▪ NASDAQ: NOVB – since 1998 COMPANY PROFILE 3

▪ Net Income of $3,047,000 ▪ Diluted EPS of $0.45 ▪ Profitable Each Q uarter T hroughout 2011 ▪ Raised $40 million in Capital in 2010 ▪ No TARP/SBLF ▪ $4.3 Valuation Allowance on DTA ▪ Grew Capital Ratios – Total RBC 20.3% at Bank 2011 OVERVIEW 4
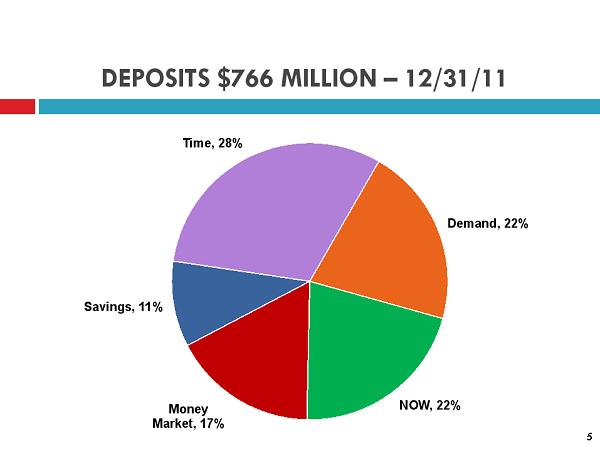
DEPOSITS $766 MILLION – 12/31/11 Demand, 22% NOW, 22% Money Market, 17% Savings, 11% Time, 28% 5
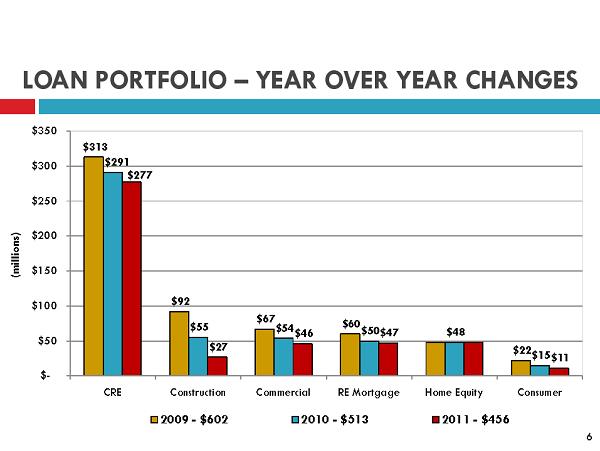
LOAN PORTFOLIO – YEAR OVER YEAR CHANGES $313 $92 $67 $60 $22 $291 $55 $54 $50 $48 $15 $277 $27 $46 $47 $11 $ - $50 $100 $150 $200 $250 $300 $350 CRE Construction Commercial RE Mortgage Home Equity Consumer (millions) 2009 - $602 2010 - $513 2011 - $456 6
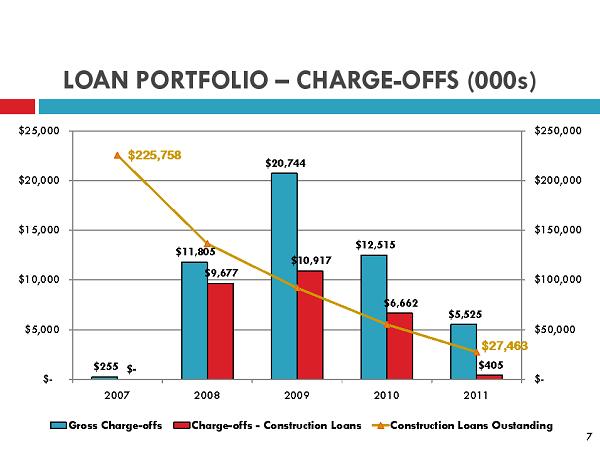
LOAN PORTFOLIO – CHARGE - OFFS (000s) $255 $11,805 $20,744 $12,515 $5,525 $ - $9,677 $10,917 $6,662 $405 $225,758 $27,463 $ - $50,000 $100,000 $150,000 $200,000 $250,000 $ - $5,000 $10,000 $15,000 $20,000 $25,000 2007 2008 2009 2010 2011 Gross Charge - offs Charge - offs - Construction Loans Construction Loans Oustanding 7

CLASSIFIED ASSET/NPA TRENDS (000’s) $103,171 $90,718 $94,267 $83,672 $74,083 $67,502 $59,742 $54,836 $48,493 $45,849 $37,813 $41,450 $33,030 $38,517 $ - $20,000 $40,000 $60,000 $80,000 $100,000 $120,000 Jun - 10 Sep - 10 Dec - 10 Mar - 11 Jun - 11 Sep - 11 Dec - 11 Classified Assets NPAs 8
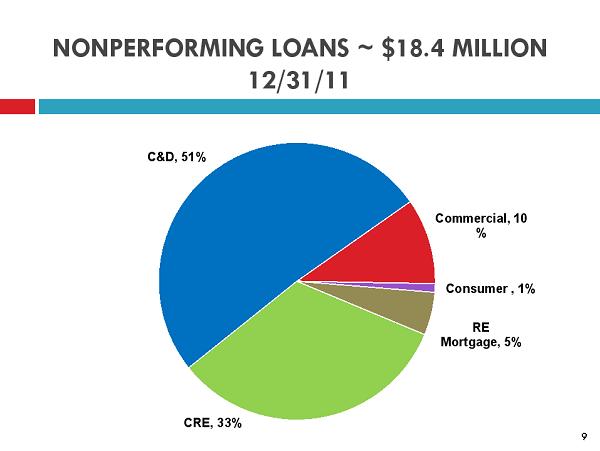
NONPERFORMING LOANS ~ $18.4 MILLION 12/31/11 Commercial, 10 % Consumer , 1% RE Mortgage, 5% CRE, 33% C&D, 51% 9

OREO ~ $20.1 MILLION 12/31/11 Residential Construction, 22 % Comml Land, 2% CRE, 15% Residential Property, 12% Residential Land, 49% 10

NORTH VALLEY BANK CAPITAL RATIOS 20.3% 19.0% 12.5% 10.0% 6.0% 5.0% 0.0% 5.0% 10.0% 15.0% 20.0% 25.0% Total RBC Ratio Tier 1 RBC Ratio Leverage Ratio 12/31/2011 Regulatory Guidance 11
▪ Loan Production ▪ Reduce NPAs ▪ Capital Deployment Strategies 2012 PLAN 12
NORT
H VALLEY BANCORP Thank You…