Attached files
| file | filename |
|---|---|
| 8-K - 8-K - HCC INSURANCE HOLDINGS INC/DE/ | a12-6390_18k.htm |
Exhibit 99.1
|
|
33rd Annual Raymond James Institutional Investors Conference March 5, 2012 |
|
|
See Notice About This Presentation Notice About This Presentation ABOUT FORWARD-LOOKING STATEMENTS: This presentation contains certain “forward-looking statements” within the meaning of Section 27A of the Securities Act of 1933 and Section 21E of the Securities Exchange Act of 1934, which are intended to be covered by the safe harbors created by those laws. These forward-looking statements include information about possible or assumed future results of our operations. All statements, other than statements of historical facts, included in this presentation that address activities, events or developments that we expect or anticipate may occur in the future, including such things as growth of our business and operations, business strategy, competitive strengths, goals, plans, future capital expenditures and references to future successes, may be considered forward-looking statements. Also, when we use the words such as “anticipate”, “believe”, “estimate”, “expect”, “intend”, “plan”, “probably” or similar expressions, we are making forward-looking statements. Many risks and uncertainties may have an impact on the matters addressed in these forward-looking statements, which could affect our future financial results and performance. These could cause our results or performance to differ materially from those we express in our forward-looking statements. Although we believe that the assumptions underlying our forward-looking statements are reasonable, any of these assumptions, and therefore also the forward-looking statements based on these assumptions, could themselves prove to be inaccurate. In light of the significant uncertainties inherent in the forward-looking statements that are included in this presentation, our inclusion of this information is not a representation by us or any other person that our objectives and plans will be achieved. Our forward-looking statements speak only at the date made, and we will not update these forward-looking statements unless the securities laws require us to do so. In light of these risks, uncertainties and assumptions, any forward-looking events discussed in this presentation may not occur. PRESENTATION FORMATTING: Certain figures included in this publication have been rounded for presentation and are provided for comparative purposes only. Our periodic reports filed with the Securities and Exchange Commission contain more detailed information, including specific figures. 2 |
|
|
See Notice About This Presentation HCC Overview Specialty insurer since 1974 (NYSE: HCC) headquartered in Houston, TX Non-correlated specialty insurance products underwritten in approximately 180 countries Five underwriting segments: U.S. Property & Casualty, Professional Liability, Accident & Health, U.S. Surety & Credit and International Financial Strength Ratings of “AA (Very Strong)” by Standard & Poor’s, “AA (Very Strong)” by Fitch Ratings, “A1 (Good Security)” by Moody’s, and “A+ (Superior)” by A.M. Best Company Assets of $9.6 billion, shareholders’ equity of $3.3 billion and market capitalization of $2.9 billion as of December 31, 2011 3 |
|
|
See Notice About This Presentation Characteristics That Make HCC Unique Specialty Insurance businesses with strong long-term fundamentals and market leadership Diversified underwriting portfolio with historically low correlation Consistent track record of growth and strong underwriting performance Lowest expense ratio amongst industry peers1 Disciplined balance sheet and risk management practices High quality investment portfolio Broadly experienced team 4 1 As of 12/31/11. Peer group defined as AFG, AGII, CB, MKL, NAVG, ORI, RLI, TRV and WRB. |
|
|
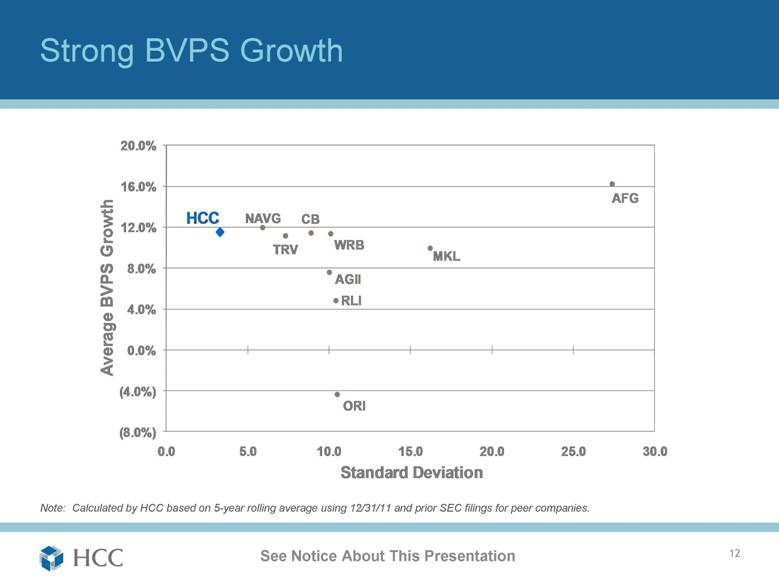
See Notice About This Presentation 2011 Operating Highlights Combined ratio excluding cats of 85.4%; 90.8% with cats Accident year combined ratio excluding cats of 85.6%; 91.0% with cats Expense ratio of 25.0% Operating ROE of 8.1%1; ROE of 7.7% Catastrophe losses in 2011 limited to 2.3% of shareholders’ equity2 Book value per share growth of 10.3% to $31.62 as of December 31, 2011 Five-year compounded BVPS growth of 11.5%3 5 1 Annualized operating return on equity is a non-GAAP financial measure. See GAAP reconciliation on slide 20. 2 After reinsurance and reinstatement premium, and net of 35% tax benefit. As a percentage of 12/31/10 shareholders’ equity. 3 As of 12/31/11. |
|
|
See Notice About This Presentation Segment Overview ($ in millions) 6 Total 2011 GWP: $ 541 $ 563 $ 802 $ 226 $ 517 $ 2,649 2011 NWP: $ 367 $ 412 $ 802 $ 209 $ 392 $ 2,182 Key Lines: Aviation Small Account E&O Public Risk Contingency Disability Title Mortgage Reinsurance Residual Value EPLI Technical Property Primary and Excess Casualty Brown Water Marine U.S. D&O International D&O Large Account E&O Fiduciary Fidelity Bankers Blanket Bonds EPLI Medical Stop-loss ST Domestic and International Medical HMO Reinsurance Medical Excess Contract Surety Commercial Surety Bail Bonds Credit Energy Property Treaty Liability Surety Credit Property (D&F) Ocean Marine A&H HCC U.S. Property & Casualty Professional Liability U.S. Surety & Credit International Accident & Health |
|
|
Segment Comparison 2011 ($ in millions) U.S. Property & Casualty U.S. Surety & Credit 2011 2011 Net Earned Loss Net Earned Loss Premium Ratio Premium Ratio Aviation $ 113 64 % Surety $ 165 21 % E&O 74 71 Credit 46 40 Public Risk 50 80 U.S. Surety & Credit $ 211 25 % Other 96 38 U.S. Property & Casualty $ 333 60 % Professional Liability International 2011 2011 Net Earned Loss Net Earned Loss Premium Ratio Premium Ratio U.S. D&O $ 359 90 % Energy $ 67 36 % International D&O 52 8 Property Treaty 91 80 Liability 81 34 Professional Liability $ 411 80 % Surety & Credit 74 57 Other 56 121 International $ 369 63 % Accident & Health Total 2011 2011 Net Earned Loss Net Earned Loss Premium Ratio Premium Ratio Medical Stop-loss $ 704 74 % Total $ 2,127 66 % Other 99 62 Accident & Health $ 803 73 % See Notice About This Presentation |
|
|
See Notice About This Presentation Consistent Growth 8 CAGR (2006-2011): 3.5% Gross Written Premium ($ in millions) $2,236 $2,451 $2,499 $2,560 $2,579 $2,649 $0 $1,000 $2,000 $3,000 $4,000 2006 2007 2008 2009 2010 2011 |
|
|
Consistent Growth 9 See Notice About This Presentation Net Written Premium ($ in millions) CAGR (2006-2011): 3.8% $1,813 $1,986 $2,061 $2,046 $2,026 $2,182 $0 $1,000 $2,000 $3,000 $4,000 2006 2007 2008 2009 2010 2011 |
|
|
Strong Underwriting Performance 10 See Notice About This Presentation GAAP Underwriting Ratios 1 Peer group defined as AFG, AGII, CB, MKL, NAVG, ORI, RLI, TRV and WRB. Five-year peer average calculated by HCC as simple mean using SEC filings for peer companies. 1 59.6% 60.4% 59.7% 59.4% 65.8% 61.0% 23.9% 24.7% 24.3% 25.2% 25.0% 24.6% 83.5% 85.1% 84.0% 84.6% 90.8% 85.6% 94.7% 59.2% 35.5% 2007 2008 2009 2010 2011 5 year HCC average 5 year peer average Loss Ratio Expense Ratio |
|
|
See Notice About This Presentation Strong Underwriting Performance 11 HCC AGII MKL NAVG ORI WRB AFG RLI CB TRV Note: Calculated by HCC using 12/31/11 SEC filings for peer companies. Peer Group Comparison – 2011 Combined Ratios 90.8% 93.4% 95.3% 101.9% 102.0% 119.9% 104.7% 115.8% 112.8% 78.4% 96.3% 105.1% 98.3% 102.6% 108.3% 119.9% 95.9% 104.4% 91.0% 120.2% GAAP AY GAAP AY GAAP AY GAAP AY GAAP AY GAAP AY GAAP AY GAAP AY GAAP AY GAAP AY Loss Ratio Net Development Expense Ratio |
|
|
Strong BVPS Growth 20.0% 16.0% AFG HCC NAVG CB 12.0% TRV WRB MKL 8.0% AGII RLI 4.0% Average BVPS Growth 0.0% (4.0%) ORI (8.0%) 0.0 5.0 10.0 15.0 20.0 25.0 30.0 Standard Deviation Note: Calculated by HCC based on 5-year rolling average using 12/31/11 and prior SEC filings for peer companies. See Notice About This Presentation |
|
|
See Notice About This Presentation Effective Catastrophe Management 13 1 1/1/12 PML excludes reinstatement premiums and is based on estimates from RMS Cat Model Version 11.0.1411.2 and internal PML estimates for lines not modeled in RMS. After-tax Net Probable Maximum Loss (PML)1 for a single event managed to 5% of Shareholders’ Equity After-tax Net PML as % of Shareholders’ Equity 2.1% 2.9% 1.9% 2.5% 1 in 100 1 in 250 CA Earthquake GOM Wind |
|
|
Single Event Limit below 5% of Shareholders’ Equity See Notice About This Presentation Catastrophe Exposure Management ($ in millions) 14 1 Represents pretax recorded losses from date of event through 12/31/11. Net losses are net of reinsurance and include reinstatement premiums. 2 Gross loss and beginning of year shareholders’ equity are not available. 3 Represents after-tax net losses as a percentage of beginning of year shareholders’ equity. Year Key Catastrophes Gross 1 Net 1 % of SE 3 2011 Japan earthquake/tsunami, New Zealand earthquakes, United States tornados and Hurricane Irene, and Denmark storms and Thailand floods $175 $118 2% 2010 Chile and New Zealand earthquakes and Deepwater Horizon rig disaster 70 20 - 2008 Hurricanes Gustav and Ike 84 7 - 2005 Hurricanes Katrina, Rita and Wilma 383 55 3% 2004 Hurricanes Charley, Frances, Ivan and Jeanne 73 22 1% 2001 9/11 terrorist attack 119 35 4% 1994 Northridge earthquake 5 1 - 1992 Hurricane Andrew 2 NA 1 NA |
|
|
See Notice About This Presentation Investment Portfolio at December 31, 2011 ($ in millions) 15 1 Available for sale fixed income securities at fair value and held to maturity fixed income securities at cost. 2 Excludes realized and unrealized investment gains and losses. Average Rating AA Average Duration 5.0 years Average Life 7.6 years Average Yield2 3.9% Average Tax Equivalent Yield2 4.8% Average Duration 4.9 years Fixed Income Securities1 $ 5,880 Short-term and Other Investments 170 Total Investments $ 6,050 Fixed Income Securities Total Investments |
|
|
See Notice About This Presentation Investment Analysis at December 31, 2011 ($ in millions) 16 1 % of fair value of fixed income securities. Category Cost Fair Value % of Fixed Income Securities 1 Municipal Bonds - Special Purpose Rev. 1,741 $ 1,864 $ 32% Residential Mortgage-Backed Securities 1,036 1,100 19% Municipal Bonds - General Obligations 1,000 1,085 18% Corporate 928 958 16% U.S. Government and Agencies 292 303 5% Foreign Government 270 281 5% Commercial Mortgage-Backed Securities 245 256 4% Asset-Backed Securities 35 35 1% Total Fixed Income Investments 5,547 $ 5,882 $ 100% |
|
|
See Notice About This Presentation Quality Reinsurance Security ($ in millions) 17 1 A.M. Best ratings are as of 2/17/12. 2 Includes paid losses recoverable, outstanding losses recoverable, incurred but not reported losses recoverable and ceded unearned premium. 3 Net recoverables is gross recoverables less total credits (includes letters of credit, cash deposits and other payables). 4 Includes letters of credit, cash deposits and other payables. Reinsurers as of 12/31/11 Reinsurer A.M. Best rating1 Gross recoverable2 Net recoverable3 Transatlantic Re A $ 165 $ 147 ACE P&C A+ 90 89 Hannover Ruck. A 105 85 Axis Re A 89 78 Arch Re A+ 52 49 Swiss Re America A+ 46 36 Everest Re A+ 38 28 Highly rated reinsurance partners Reserve for uncollectible reinsurance of $2 million at 12/31/11 on over $1 billion of recoverables 38% of gross recoverables at 12/31/11 were collateralized or had available offsets from reinsurers4 Recoverables Declining as % of Equity 82% 80% 57% 39% 40% 34% 31% 32% 20% 40% 60% 80% 100% 2004 2005 2006 2007 2008 2009 2010 2011 |
|
|
See Notice About This Presentation Total Value Creation 18 1 Calculated by HCC using 12/31/11 and prior SEC filings for peer companies. Peers reflects average for peer companies. Compounded Annual Return on Tangible Book Value per Share, Including Dividends1 1 Year 3 Year 5 Year 10 Year 10.7% 7.1% 16.6% 15.4% 17.1% 10.5% 18.7% 13.6% HCC Peers HCC Peers HCC Peers HCC Peers |
|
|
See Notice About This Presentation HCC’s Value Proposition 19 Non-correlated portfolio of products Maintains double-digit margin in very competitive market High quality investment portfolio Strong operating cash flow Experienced management team |
|
|
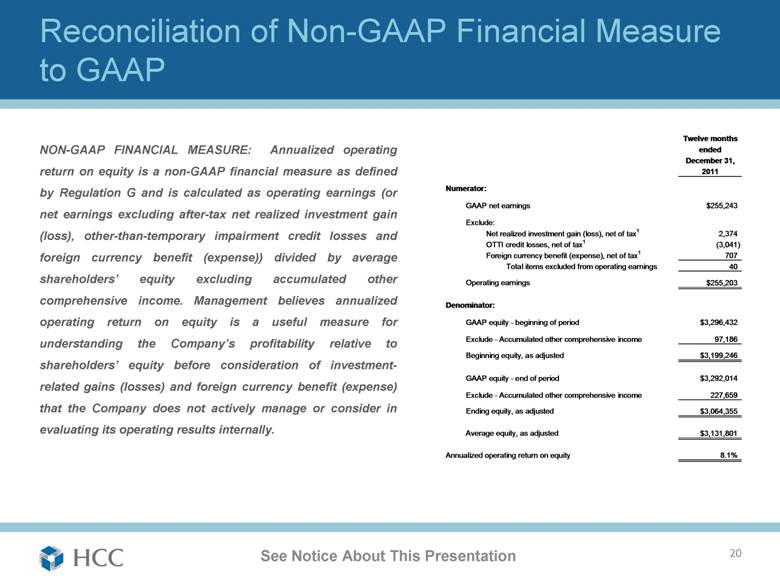
Reconciliation of Non-GAAP Financial Measure to GAAP Twelve months NON-GAAP FINANCIAL MEASURE: Annualized operating ended December 31, return on equity is a non-GAAP financial measure as defined 2011 by Regulation G and is calculated as operating earnings (or Numerator: GAAP net earnings $255,243 net earnings excluding after-tax net realized investment gain Exclude: (loss), other-than-temporary impairment credit losses and Net realized investment gain (loss), net of tax1 2,374 OTTI credit losses, net of tax1 (3,041) foreign currency benefit (expense)) divided by average Foreign currency benefit (expense), net of tax1 707 Total items excluded from operating earnings 40 shareholders’ equity excluding accumulated other Operating earnings $255,203 comprehensive income. Management believes annualized Denominator: operating return on equity is a useful measure for GAAP equity - beginning of period $3,296,432 understanding the Company’s profitability relative to Exclude - Accumulated other comprehensive income 97,186 Beginning equity, as adjusted $3,199,246 shareholders’ equity before consideration of investment- GAAP equity - end of period $3,292,014 related gains (losses) and foreign currency benefit (expense) Exclude - Accumulated other comprehensive income 227,659 that the Company does not actively manage or consider in Ending equity, as adjusted $3,064,355 evaluating its operating results internally. Average equity, as adjusted $3,131,801 Annualized operating return on equity 8.1% See Notice About This Presentation |