Attached files
| file | filename |
|---|---|
| 8-K - EXELIS INC. 8-K - Exelis Inc. | a50190208.htm |
| EX-99.1 - EXHIBIT 99.1 - Exelis Inc. | a50190208_ex99-1.htm |
Exhibit 99.2
2011 Year in Review & Fiscal 2012 Guidance David Melcher Chief Executive Officer and President Peter Milligan Senior Vice President and Chief Financial Officer March 2, 2012
SAFE HARBOR STATEMENT Safe Harbor Statement under the Private Securities Litigation Reform Act of 1995 (the “Act”): Certain material presented herein includes forward-looking statements intended to qualify for the safe harbor from liability established by the Private Securities Litigation Reform Act of 1995. These forward-looking statements include, but are not limited to, statements about the separation of the Company from ITT Corporation, the terms and the effect of the separation, the nature and impact of such a separation, capitalization of the Company, future strategic plans and other statements that describe the Company’s business strategy, outlook, objectives, plans, intentions or goals, and any discussion of future operating or financial performance. Whenever used, words such as “anticipate,” “estimate,” “expect,” “project,” “intend,” “plan,” “believe,” “target” and other terms of similar meaning are intended to identify such forward-looking statements. Forward-looking statements are uncertain and to some extent unpredictable, and involve known and unknown risks, uncertainties and other important factors that could cause actual results to differ materially from those expressed or implied in, or reasonably inferred from, such forward-looking statements. Factors that could cause results to differ materially from those anticipated include, but are not limited to: The Company undertakes no obligation to update any forward-looking statements, whether as a result of new information, future events or otherwise, except as required by law. In addition, forward-looking statements are subject to certain risks and uncertainties that could cause actual results to differ materially from the Company’s historical experience and our present expectations or projections. These risks and uncertainties include, but are not limited to, those described in Exelis Inc.’s Registration Statement on Form 10, and those described from time to time in our future reports filed with the Securities and Exchange Commission. Our dependence on the defense industry and the business risks peculiar to that industry, including changing priorities or reductions in the U.S. Government or international defense budgets; Government regulations and compliance therewith, including changes to the Department of Defense procurement process; Our international operations, including sales to foreign customers; Competition, industry capacity and production rates; Misconduct of our employees, subcontractors, agents and business partners; The level of returns on postretirement benefit plan assets and potential employee benefit plan contributions and other employment and pension matters; Changes in interest rates and other factors that affect earnings and cash flows; The mix of our contracts and programs, our performance, and our ability to control costs; Governmental investigations; Our level of indebtedness and our ability to make payments on or service our indebtedness; Subcontractor performance; Economic and capital markets conditions; The availability and pricing of raw materials and components; Ability to retain and recruit qualified personnel; Protection of intellectual property rights; Changes in technology; Contingencies related to actual or alleged environmental contamination, claims and concerns; Security breaches and other disruptions to our information technology and operations; and Unanticipated changes in our tax provisions or exposure to additional income tax liabilities. In addition, there are risks and uncertainties relating to the separation including whether those transactions will result in any tax liability, the operational and financial profile of the Company or any of its businesses after giving effect to the separation, and the ability of the Company to operate as an independent entity.
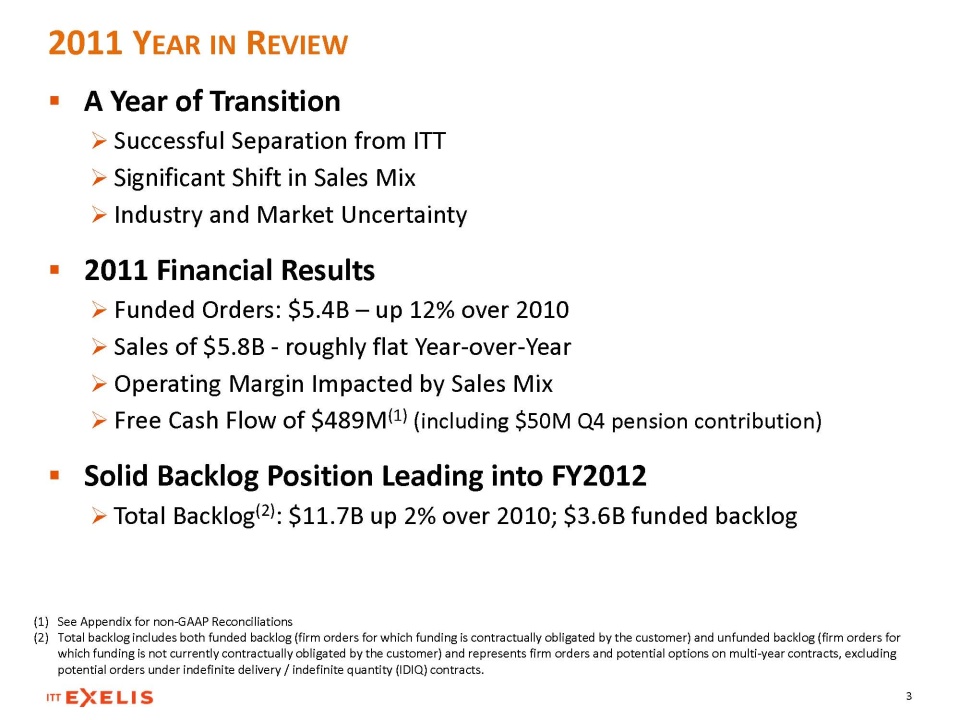
2011 YEAR IN REVIEW A Year of Transition Successful Separation from ITT Significant Shift in Sales Mix Industry and Market Uncertainty 2011 Financial Results Funded Orders: $5.4B – up 12% over 2010 Sales of $5.8B - roughly flat Year-over-Year Operating Margin Impacted by Sales Mix Free Cash Flow of $489M(1) (including $50M Q4 pension contribution) Solid Backlog Position Leading into FY2012 Total Backlog(2): $11.7B up 2% over 2010; $3.6B funded backlog(1)See Appendix for non-GAAP Reconciliations (2)Total backlog includes both funded backlog (firm orders for which funding is contractually obligated by the customer) and unfunded backlog (firm orders for which funding is not currently contractually obligated by the customer) and represents firm orders and potential options on multi-year contracts, excluding potential orders under indefinite delivery / indefinite quantity (IDIQ) contracts.
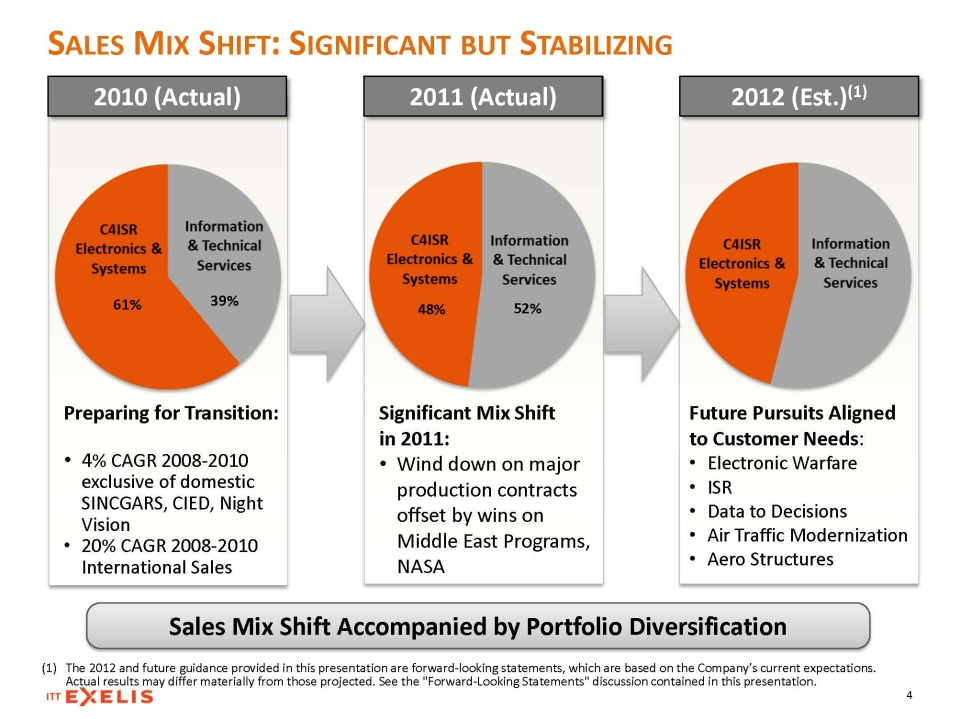
SALES MIX SHIFT: SIGNIFICANT BUT STABILIZING 2010 (Actual) 2011 (Actual) 2012 (Est.)(1) 61% 52% 39% 48% Sales Mix Shift Accompanied by Portfolio Diversification Significant Mix Shift in 2011: Wind down on major production contracts offset by wins on Middle East Programs, NASA Future Pursuits Aligned to Customer Needs: Electronic Warfare ISR Data to Decisions Air Traffic Modernization Aero Structures Preparing for Transition: 4% CAGR 2008-2010 exclusive of domestic SINCGARS, CIED, Night Vision 20% CAGR 2008-2010 International Sales (1)The 2012 and future guidance provided in this presentation are forward-looking statements, which are based on the Company’s current expectations. Actual results may differ materially from those projected. See the "Forward-Looking Statements" discussion contained in this presentation.
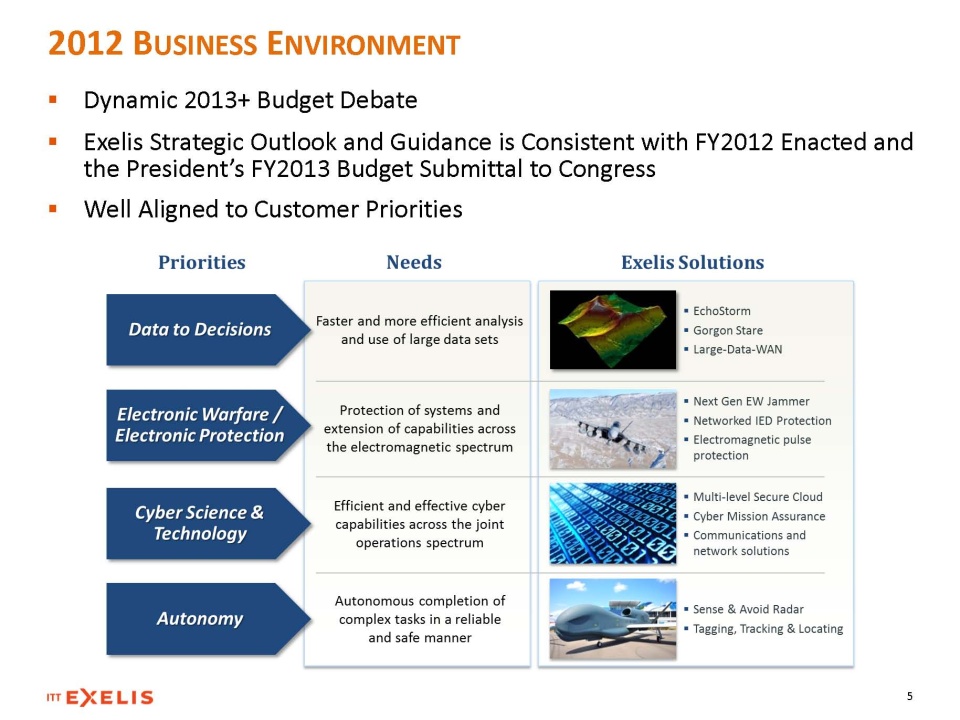
Dynamic 2013+ Budget Debate Exelis Strategic Outlook and Guidance is Consistent with FY2012 Enacted and the President’s FY2013 Budget Submittal to Congress Well Aligned to Customer Priorities
EXELIS VISION: LASER FOCUS ON SHAREHOLDER AND CUSTOMER VALUE Diversified portfolio with attractive positions in enduring markets, aligned to customer priorities Continue to focus on international, civilian government and commercial markets Proactively managing Exelis portfolio to address market conditions Large fielded base and platform-agnostic solutions contribute to future sales ISR, networked communications, cyber warfare and security, unmanned aircraft, electronic warfare and integrated logistics support Driving productivity, operational excellence and cost efficiency to deliver ready-now, affordable solutions to our customers Strong cash generation and attractive dividend
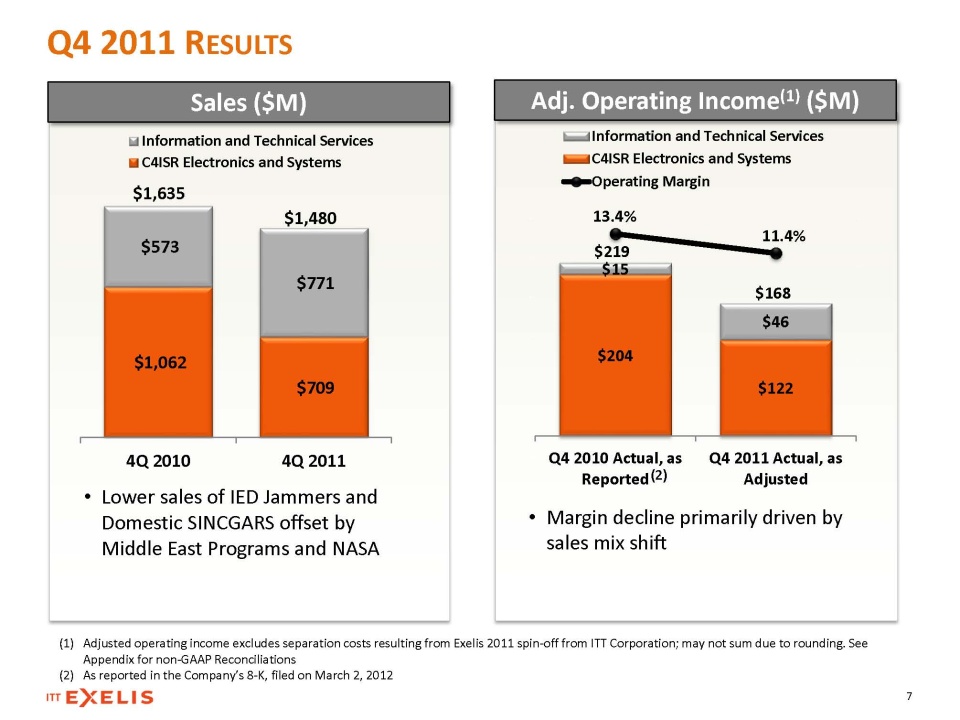
Q4 2011 RESULTS 7 (1)Adjusted operating income excludes separation costs resulting from Exelis 2011 spin-off from ITT Corporation; may not sum due to rounding. See Appendix for non-GAAP Reconciliations (2)As reported in the Company’s 8-K, filed on March 2, 2012 Sales ($M) Lower sales of IED Jammers and Domestic SINCGARS offset by Middle East Programs and NASA Margin decline primarily driven by sales mix shift $1,062 $709 $573 $771 4Q 20104Q 2011Information and Technical ServicesC4ISR Electronics and Systems$1,635 $1,480 $219 $168 (2)
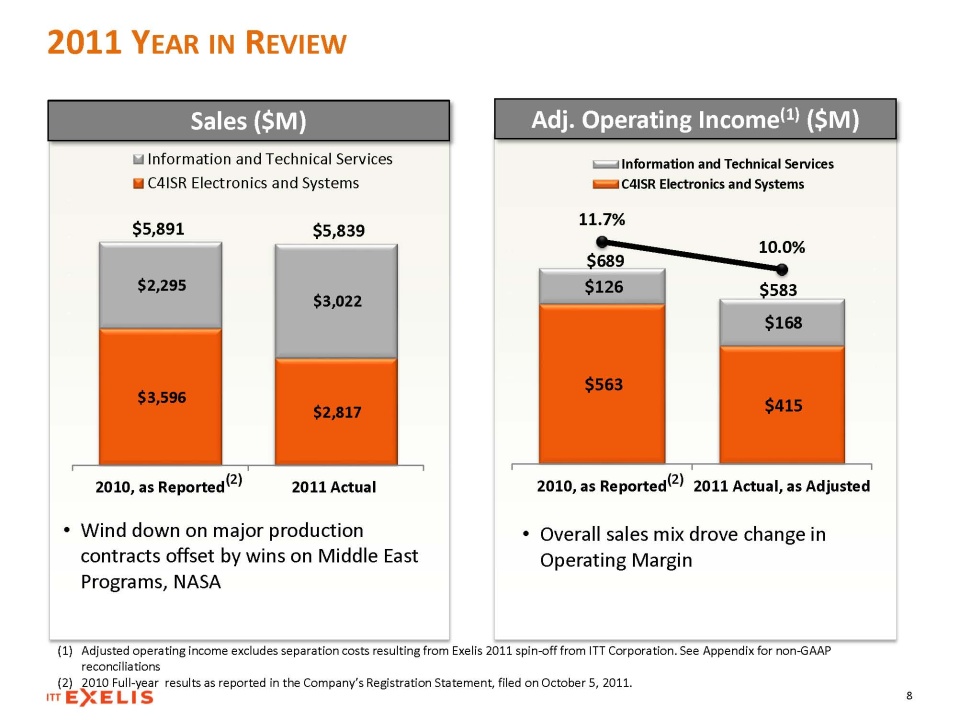
2011 YEAR IN REVIEW Sales ($M) Wind down on major production contracts offset by wins on Middle East Programs, NASA Overall sales mix drove change in Operating Margin (1)Adjusted operating income excludes separation costs resulting from Exelis 2011 spin-off from ITT Corporation. See Appendix for non-GAAP reconciliations (2)2010 Full-year results as reported in the Company’s Registration Statement, filed on October 5, 2011.
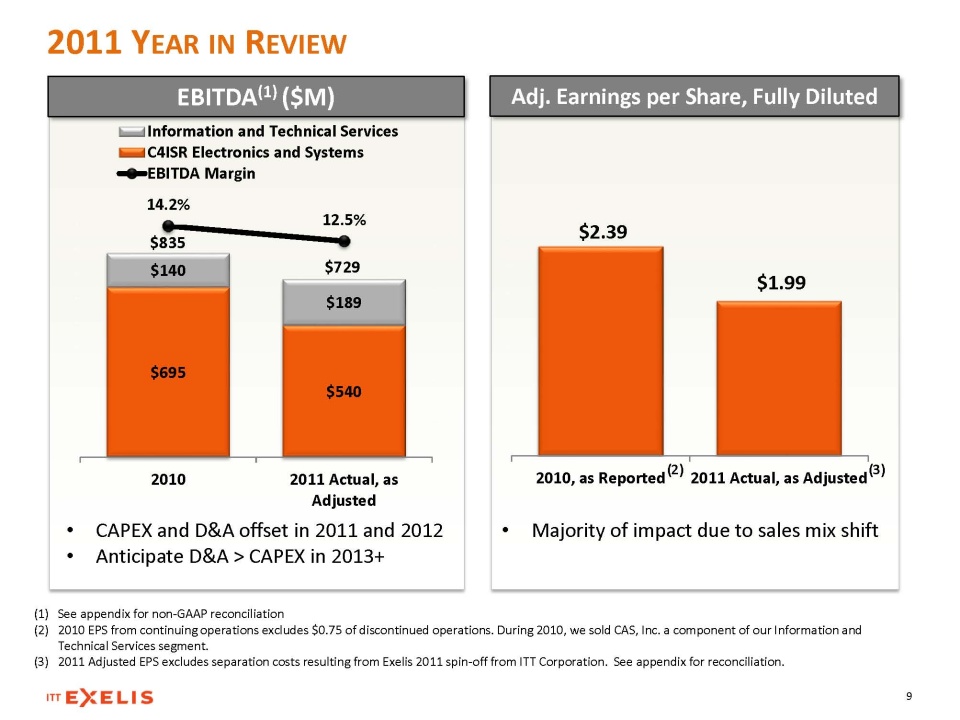
2011 YEAR IN REVIEW (1)See appendix for non-GAAP reconciliation (2)2010 EPS from continuing operations excludes $0.75 of discontinued operations. During 2010, we sold CAS, Inc. a component of our Information and Technical Services segment. (3)2011 Adjusted EPS excludes separation costs resulting from Exelis 2011 spin-off from ITT Corporation. See appendix for reconciliation. (3) $695 $540 $140 $189 14.2% 12.5% -13.0% -8.0% -3.0% 2.0% 7.0% 12.0%$(50.0) $50.0 $150.0 $250.0 $350.0 $450.0 $550.0 $650.0 $750.0 $850.0 $950.0 2010 2011 Actual, as Adjusted Information and Technical Services C4ISR Electronics and Systems EBITDA Margin $729 $835 (2)
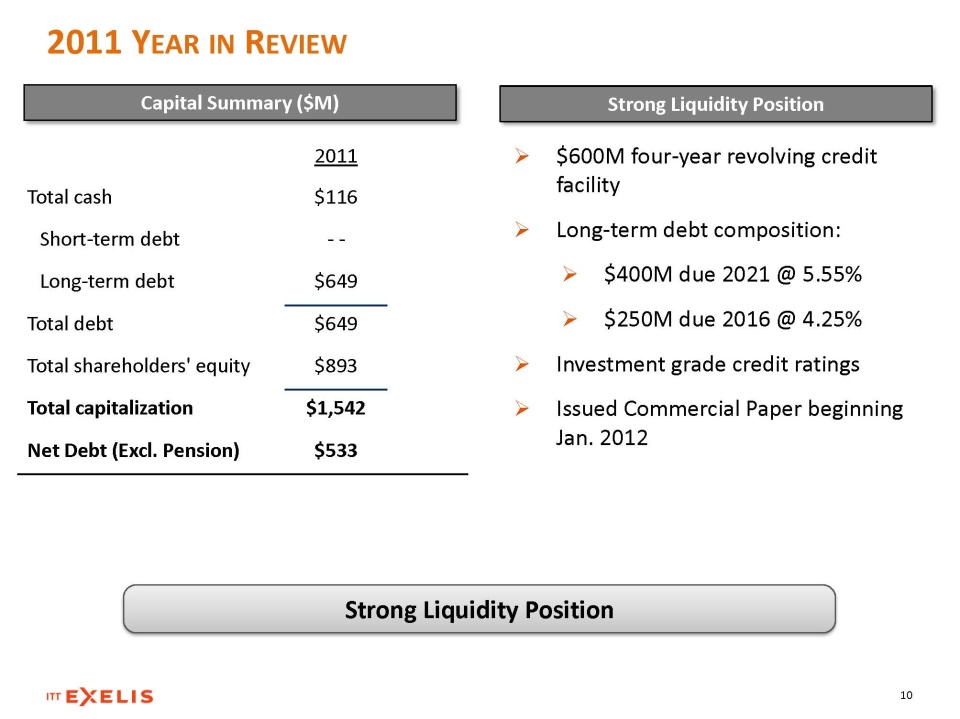
2011 YEAR IN REVIEW 10 Strong Liquidity Position 2011 Total cash Short-term debt Long-term debt Total debt Total shareholders' equity Total capitalization Net Debt (Excl. Pension) $116 - - $649 $649 $893 $1,542 $533 Capital Summary ($M) Strong Liquidity Position $600M four-year revolving credit facility Long-term debt composition: $400M due 2021 @ 5.55% $250M due 2016 @ 4.25% Investment grade credit ratings Issued Commercial Paper beginning Jan. 2012
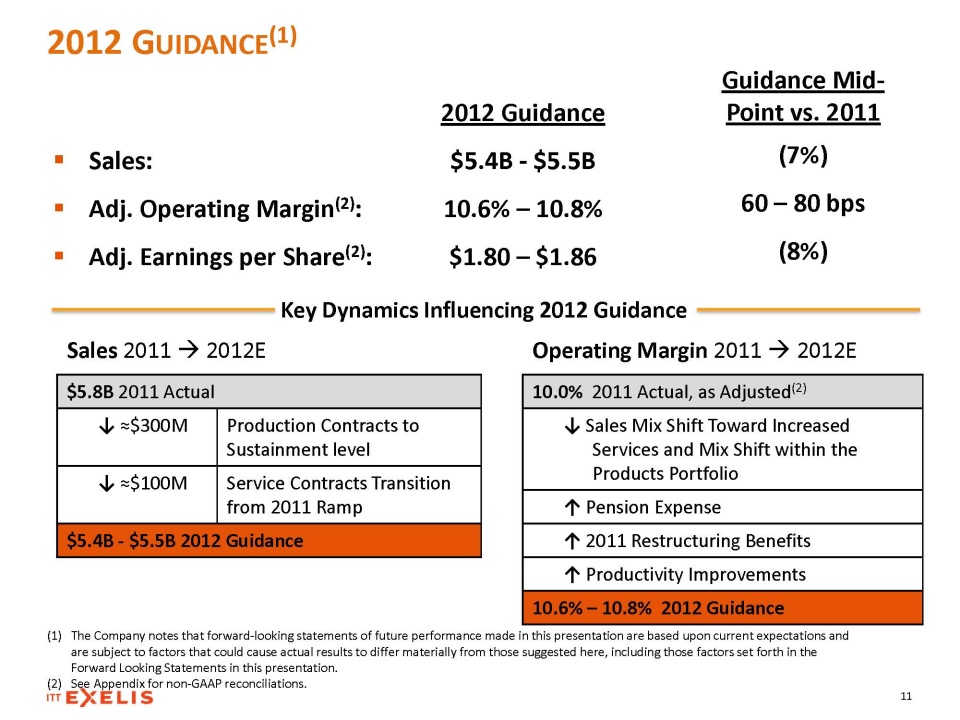
2012 GUIDANCE(1) 11 Sales: Adj. Operating Margin(2): Adj. Earnings per Share(2): 2012 Guidance $5.4B - $5.5B 10.6% – 10.8% $1.80 – $1.86 Guidance Mid-Point vs. 2011 (7%) 60 – 80 bps (8%) 10.0% 2011 Actual, as Adjusted(2) Sales Mix Shift Toward Increased Services and Mix Shift within the Products Portfolio Pension Expense 2011 Restructuring Benefits Productivity Improvements 10.6% – 10.8% 2012 Guidance Sales 2011 2012E Operating Margin 2011 2012E $5.8B 2011 Actual $300M Production Contracts to Sustainment level $100M Service Contracts Transition from 2011 Ramp $5.4B - $5.5B 2012 Guidance (1)The Company notes that forward-looking statements of future performance made in this presentation are based upon current expectations and are subject to factors that could cause actual results to differ materially from those suggested here, including those factors set forth in the Forward Looking Statements in this presentation. (2)See Appendix for non-GAAP reconciliations. Key Dynamics Influencing 2012 Guidance
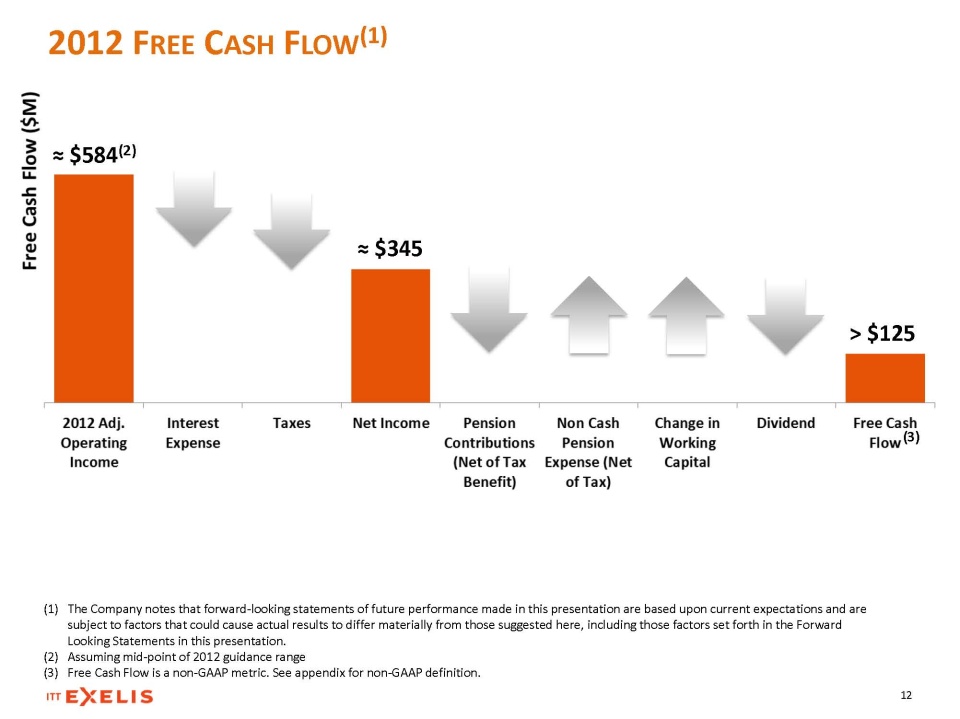
2012 FREE CASH FLOW(1) 12 $584(2) $345 $125 (1)The Company notes that forward-looking statements of future performance made in this presentation are based upon current expectations and are subject to factors that could cause actual results to differ materially from those suggested here, including those factors set forth in the Forward Looking Statements in this presentation. (2)Assuming mid-point of 2012 guidance range (3)Free Cash Flow is a non-GAAP metric. See appendix for non-GAAP definition. (3)
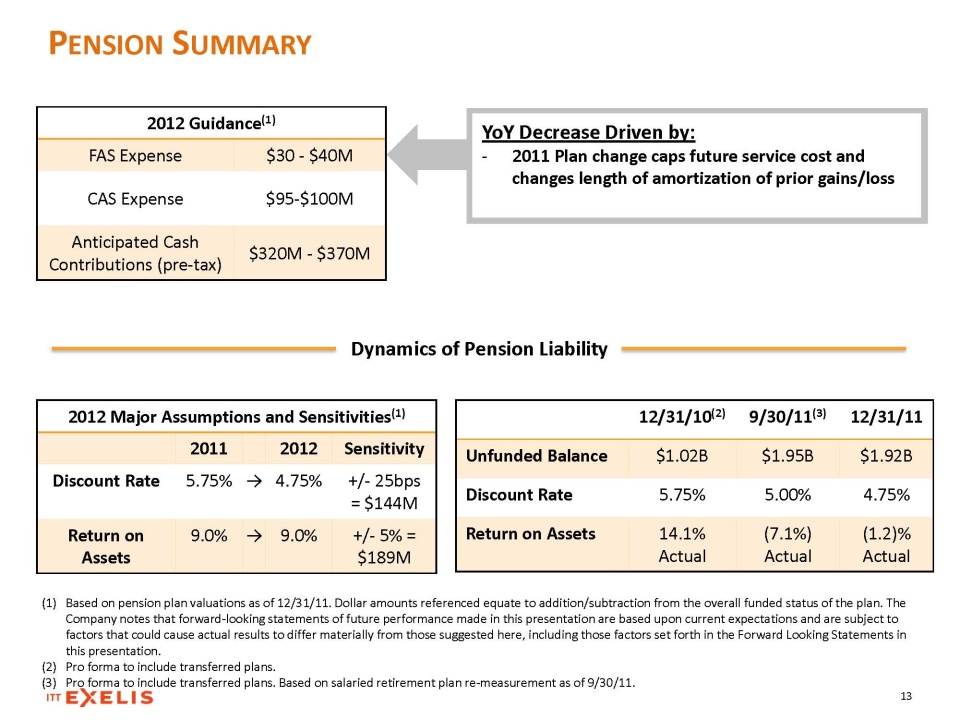
PENSION SUMMARY 13 2012 Major Assumptions and Sensitivities(1)2011 2012 Sensitivity Discount Rate 5.75% ? 4.75% +/- 25bps = $144M Return on Assets 9.0% ? 9.0% +/- 5% = $189M 12/31/10(2) 9/30/11(3) 12/31/11 Unfunded Balance $1.02B $1.95B $1.92B Discount Rate 5.75% 5.00% 4.75% Return on Assets 14.1% Actual (7.1%)Actual (1.2)% Actual 2012 Guidance(1)FAS Expense $30 - $40M CAS Expense $95-$100M Anticipated Cash Contributions (pre-tax) $320M - $370M YoY Decrease Driven by: -2011 Plan change caps future service cost and changes length of amortization of prior gains/loss Dynamics of Pension Liability(1)Based on pension plan valuations as of 12/31/11. Dollar amounts referenced equate to addition/subtraction from the overall funded status of the plan. The Company notes that forward-looking statements of future performance made in this presentation are based upon current expectations and are subject to factors that could cause actual results to differ materially from those suggested here, including those factors set forth in the Forward Looking Statements in this presentation. (2)Pro forma to include transferred plans.(3)Pro forma to include transferred plans. Based on salaried retirement plan re-measurement as of 9/30/11.
EXELIS FINANCIAL HIGHLIGHTS Diversified sales base with balanced outlook given budget uncertainty Highly variable and controllable cost structure Attractive dividend 14 Actively Managing Cash Flow Requirements to Enable Investment and Shareholder Return

Appendix
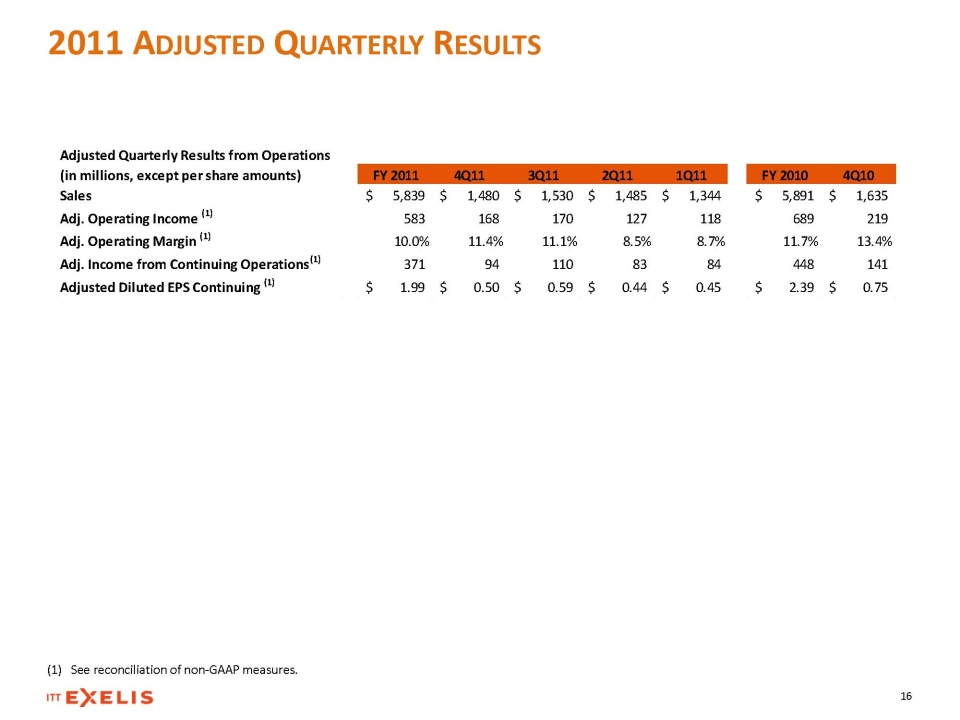
2011 ADJUSTED QUARTERLY RESULTS (1)See reconciliation of non-GAAP measures.
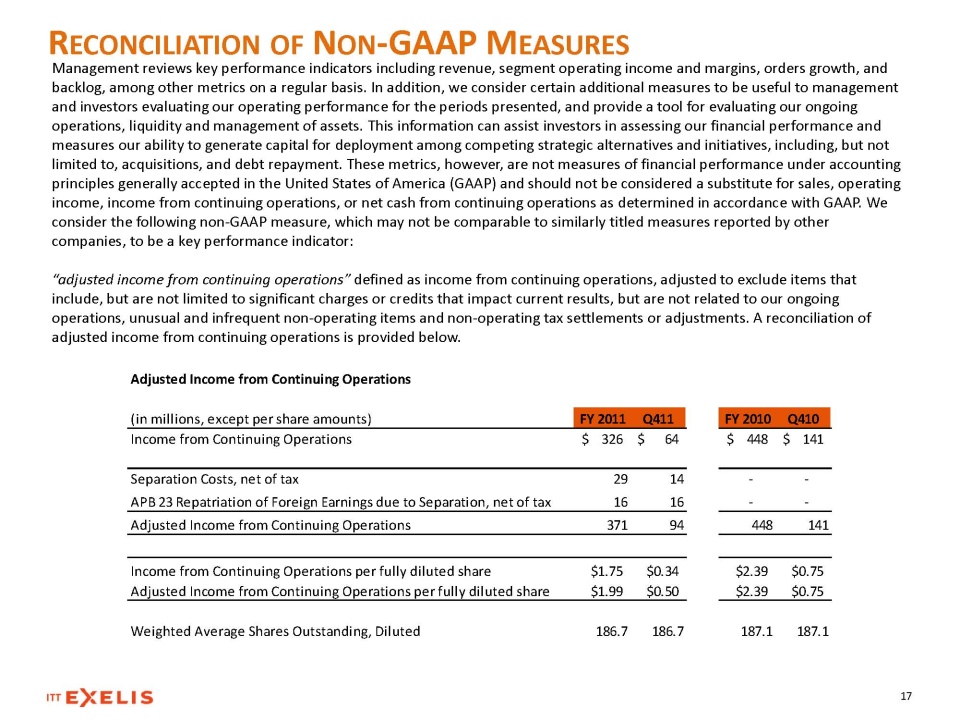
RECONCILIATION OF NON-GAAP MEASURES Management reviews key performance indicators including revenue, segment operating income and margins, orders growth, and backlog, among other metrics on a regular basis. In addition, we consider certain additional measures to be useful to management and investors evaluating our operating performance for the periods presented, and provide a tool for evaluating our ongoing operations, liquidity and management of assets. This information can assist investors in assessing our financial performance and measures our ability to generate capital for deployment among competing strategic alternatives and initiatives, including, but not limited to, acquisitions, and debt repayment. These metrics, however, are not measures of financial performance under accounting principles generally accepted in the United States of America (GAAP) and should not be considered a substitute for sales, operating income, income from continuing operations, or net cash from continuing operations as determined in accordance with GAAP. We consider the following non-GAAP measure, which may not be comparable to similarly titled measures reported by other companies, to be a key performance indicator: “adjusted income from continuing operations” defined as income from continuing operations, adjusted to exclude items that include, but are not limited to significant charges or credits that impact current results, but are not related to our ongoing operations, unusual and infrequent non-operating items and non-operating tax settlements or adjustments. A reconciliation of adjusted income from continuing operations is provided below. Adjusted Income from Continuing Operations(in millions, except per share amounts)FY 2011Q411FY 2010Q410Income from Continuing Operations326$ 64$ 448$ 141$ Separation Costs, net of tax2914- - APB 23 Repatriation of Foreign Earnings due to Separation, net of tax1616- - Adjusted Income from Continuing Operations37194448141Income from Continuing Operations per fully diluted share$1.75$0.34$2.39$0.75Adjusted Income from Continuing Operations per fully diluted share$1.99$0.50$2.39$0.75Weighted Average Shares Outstanding, Diluted186.7186.7187.1187.1
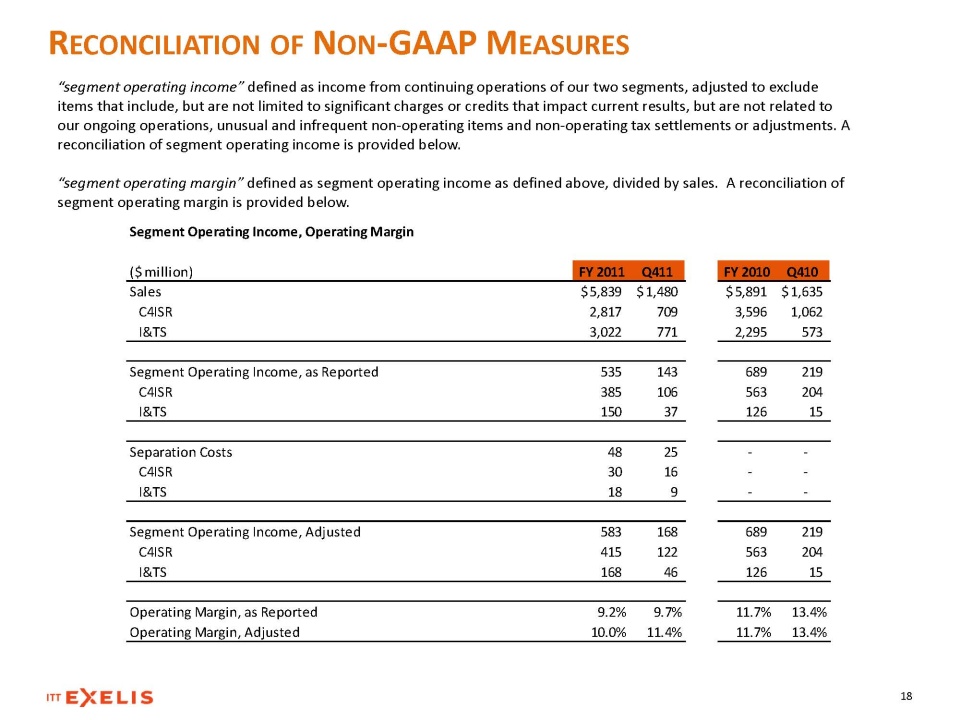
RECONCILIATION OF NON-GAAP MEASURES 18 “segment operating income” defined as income from continuing operations of our two segments, adjusted to exclude items that include, but are not limited to significant charges or credits that impact current results, but are not related to our ongoing operations, unusual and infrequent non-operating items and non-operating tax settlements or adjustments. A reconciliation of segment operating income is provided below. “segment operating margin” defined as segment operating income as defined above, divided by sales. A reconciliation of segment operating margin is provided below. Segment Operating Income, Operating Margin($ million)FY 2011Q411FY 2010Q410Sales5,839$ 1,480$ 5,891$ 1,635$ C4ISR2,817 709 3,596 1,062 I&TS3,022 771 2,295 573 Segment Operating Income, as Reported535 143 689 219 C4ISR385 106 563 204 I&TS150 37 126 15 Separation Costs48 25 - - C4ISR30 16 - - I&TS18 9 - - Segment Operating Income, Adjusted583 168 689 219 C4ISR415 122 563 204 I&TS168 46 126 15 Operating Margin, as Reported9.2%9.7%11.7%13.4%Operating Margin, Adjusted10.0%11.4%11.7%13.4%
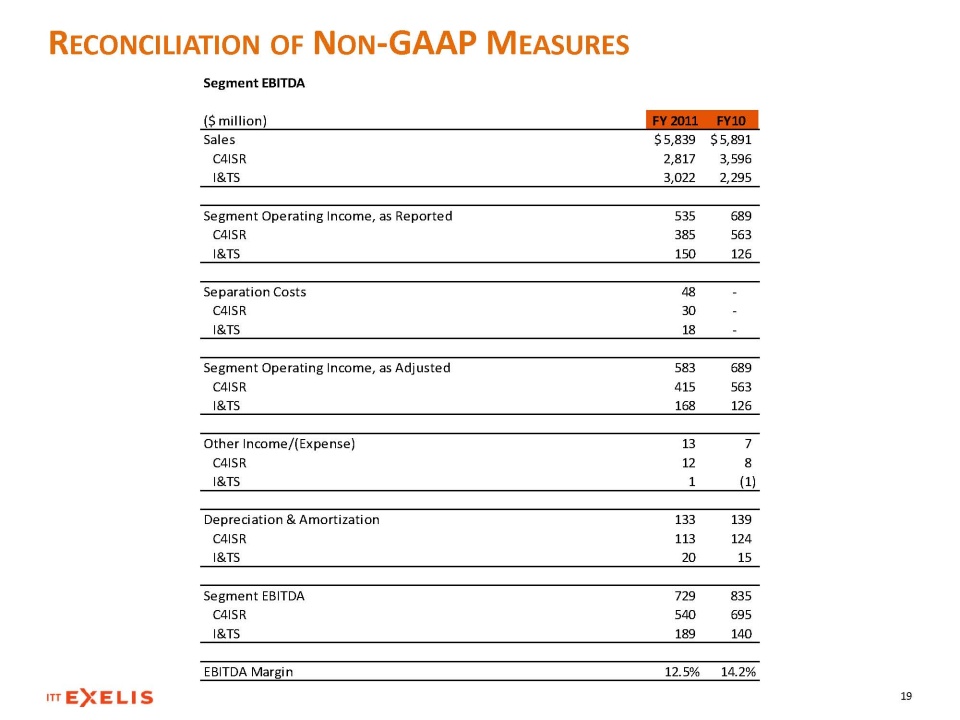
RECONCILIATION OF NON-GAAP MEASURES 19 Segment EBITDA($ million)FY 2011FY10Sales5,839$ 5,891$ C4ISR2,817 3,596 I&TS3,022 2,295 Segment Operating Income, as Reported535 689 C4ISR385 563 I&TS150 126 Separation Costs48 - C4ISR30 - I&TS18 - Segment Operating Income, as Adjusted583 689 C4ISR415 563 I&TS168 126 Other Income/(Expense)13 7 C4ISR12 8 I&TS1 (1) Depreciation & Amortization133 139 C4ISR113 124 I&TS20 15 Segment EBITDA729 835 C4ISR540 695 I&TS189 140 EBITDA Margin12.5%14.2%
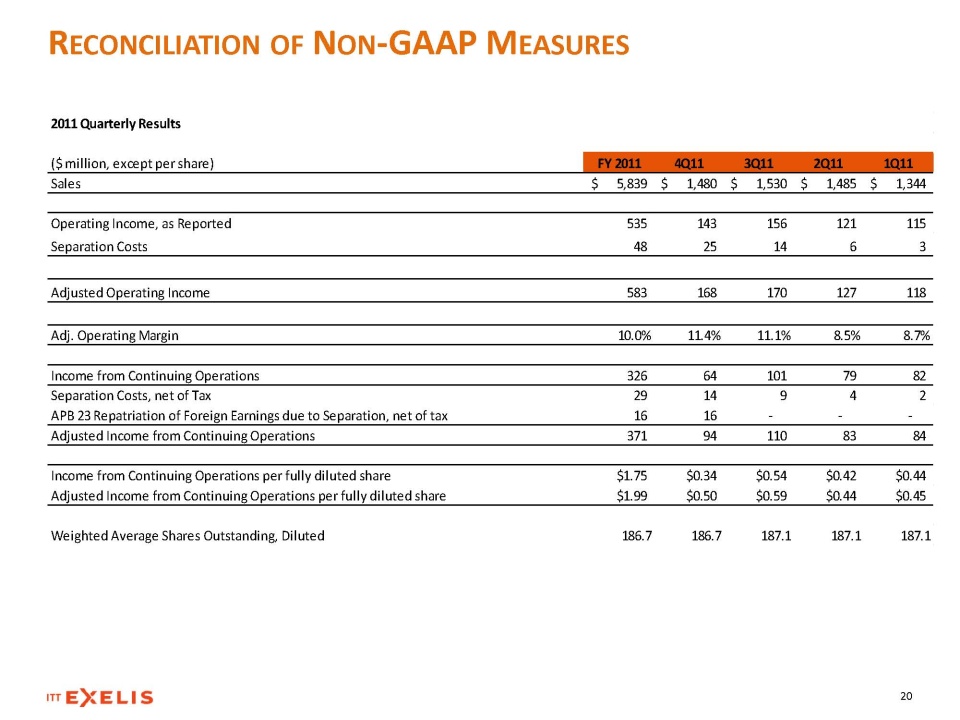
RECONCILIATION OF NON-GAAP MEASURES 2011 Quarterly Results($ million, except per share)FY 20114Q113Q112Q111Q11Sales5,839$ 1,480$ 1,530$ 1,485$ 1,344$ Operating Income, as Reported535 143 156 121 115 Separation Costs48 25 14 6 3 Adjusted Operating Income583 168 170 127 118 Adj. Operating Margin10.0%11.4%11.1%8.5%8.7%Income from Continuing Operations326 64 101 79 82 Separation Costs, net of Tax29 14 9 4 2 APB 23 Repatriation of Foreign Earnings due to Separation, net of tax16 16 - - - Adjusted Income from Continuing Operations371 94 110 83 84 Income from Continuing Operations per fully diluted share$1.75$0.34$0.54$0.42$0.44Adjusted Income from Continuing Operations per fully diluted share$1.99$0.50$0.59$0.44$0.45Weighted Average Shares Outstanding, Diluted186.7186.7187.1187.1187.1
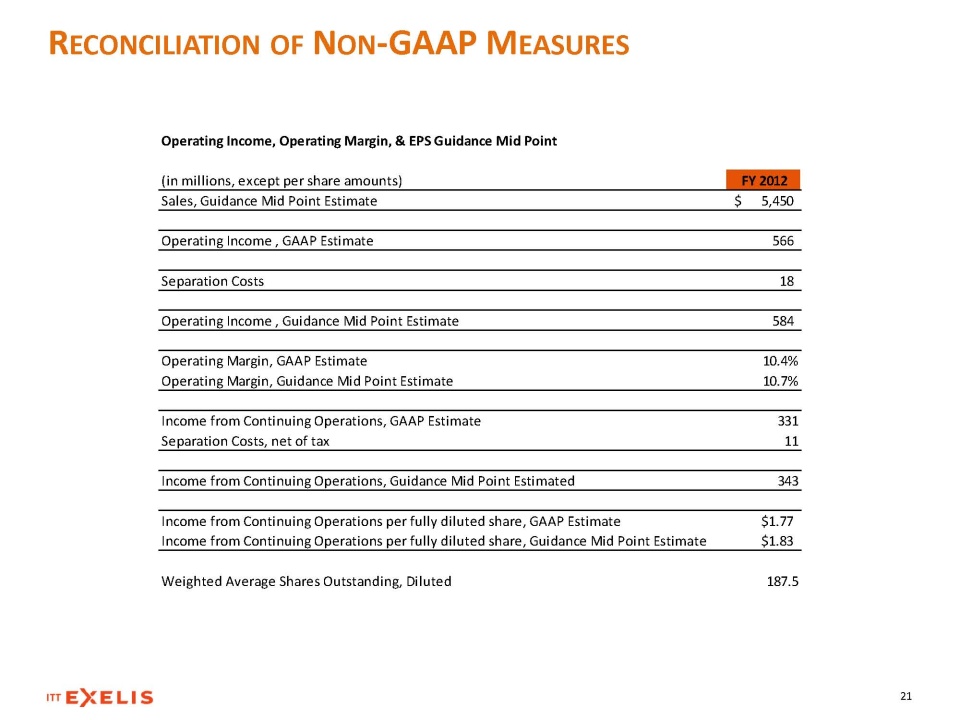
RECONCILIATION OF NON-GAAP MEASURES Operating Income, Operating Margin, & EPS Guidance Mid Point(in millions, except per share amounts)FY 2012Sales, Guidance Mid Point Estimate5,450$ Operating Income , GAAP Estimate566 Separation Costs18 Operating Income , Guidance Mid Point Estimate584 Operating Margin, GAAP Estimate10.4%Operating Margin, Guidance Mid Point Estimate10.7%Income from Continuing Operations, GAAP Estimate331Separation Costs, net of tax11Income from Continuing Operations, Guidance Mid Point Estimated 343Income from Continuing Operations per fully diluted share, GAAP Estimate$1.77Income from Continuing Operations per fully diluted share, Guidance Mid Point Estimate$1.83Weighted Average Shares Outstanding, Diluted187.5
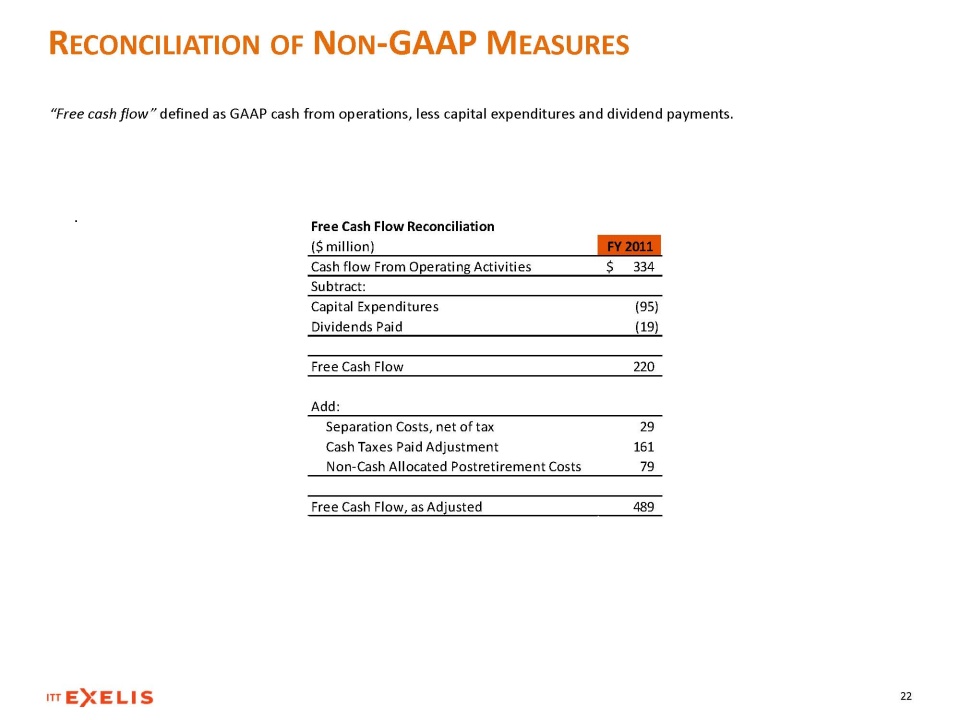
RECONCILIATION OF NON-GAAP MEASURES “Free cash flow” defined as GAAP cash from operations, less capital expenditures and dividend payments. Free Cash Flow Reconciliation($ million)FY 2011Cash flow From Operating Activities334$ Subtract: Capital Expenditures(95) Dividends Paid(19) Free Cash Flow220 Add: Separation Costs, net of tax29 Cash Taxes Paid Adjustment161 Non-Cash Allocated Postretirement Costs79 Free Cash Flow, as Adjusted489