Attached files
| file | filename |
|---|---|
| 8-K - CURRENT REPORT OF MATERIAL EVENTS OR CORPORATE CHANGES - COMERICA INC /NEW/ | a12-6268_18k.htm |
Exhibit 99.1
|
|
Comerica Incorporated Conference Presentation March 2012 |

|
|
Safe Harbor Statement Any statements in this presentation that are not historical facts are forward-looking statements as defined in the Private Securities Litigation Reform Act of 1995. Words such as “anticipates,” “believes,” “feels,” “expects,” “estimates,” “seeks,” “strives,” “plans,” “intends,” “outlook,” “forecast,” “position,” “target,” “mission,” “assume,” “achievable,” “potential,” “strategy,” “goal,” “aspiration,” “opportunity,” “initiative,” “outcome,” “continue,” “remain,” “maintain,” “on course,” “trend,” “objective,” “looks forward” and variations of such words and similar expressions, or future or conditional verbs such as “will,” “would,” “should,” “could,” “might,” “can,” “may” or similar expressions, as they relate to Comerica or its management, are intended to identify forward-looking statements. These forward-looking statements are predicated on the beliefs and assumptions of Comerica’s management based on information known to Comerica’s management as of the date of this presentation and do not purport to speak as of any other date. Forward-looking statements may include descriptions of plans and objectives of Comerica’s management for future or past operations, products or services, and forecasts of Comerica’s revenue, earnings or other measures of economic performance, including statements of profitability, business segments and subsidiaries, estimates of credit trends and global stability. Such statements reflect the view of Comerica’s management as of this date with respect to future events and are subject to risks and uncertainties. Should one or more of these risks materialize or should underlying beliefs or assumptions prove incorrect, Comerica’s actual results could differ materially from those discussed. Factors that could cause or contribute to such differences are changes in general economic, political or industry conditions; changes in monetary and fiscal policies, including the interest rate policies of the Federal Reserve Board; volatility and disruptions in global capital and credit markets; changes in Comerica’s credit rating; the interdependence of financial service companies; changes in regulation or oversight; unfavorable developments concerning credit quality; the acquisition of Sterling Bancshares, Inc., or any future acquisitions; the effects of more stringent capital or liquidity requirements; declines or other changes in the businesses or industries of Comerica’s customers; the implementation of Comerica’s strategies and business models, including the implementation of revenue enhancements and efficiency improvements; Comerica’s ability to utilize technology to efficiently and effectively develop, market and deliver new products and services; operational difficulties, failure of technology infrastructure or information security incidents; changes in the financial markets, including fluctuations in interest rates and their impact on deposit pricing; competitive product and pricing pressures among financial institutions within Comerica’s markets; changes in customer behavior; management’s ability to maintain and expand customer relationships; management’s ability to retain key officers and employees; the impact of legal and regulatory proceedings; the effectiveness of methods of reducing risk exposures; the effects of terrorist activities and other hostilities; the effects of catastrophic events including, but not limited to, hurricanes, tornadoes, earthquakes, fires, droughts and floods; changes in accounting standards and the critical nature of Comerica’s accounting policies. Comerica cautions that the foregoing list of factors is not exclusive. For discussion of factors that may cause actual results to differ from expectations, please refer to our filings with the Securities and Exchange Commission. In particular, please refer to “Item 1A. Risk Factors” beginning on page 12 of Comerica’s Annual Report on Form 10-K for the year ended December 31, 2011. Forward-looking statements speak only as of the date they are made. Comerica does not undertake to update forward-looking statements to reflect facts, circumstances, assumptions or events that occur after the date the forward-looking statements are made. For any forward-looking statements made in this presentation or in any documents, Comerica claims the protection of the safe harbor for forward-looking statements contained in the Private Securities Litigation Reform Act of 1995. |
|
|
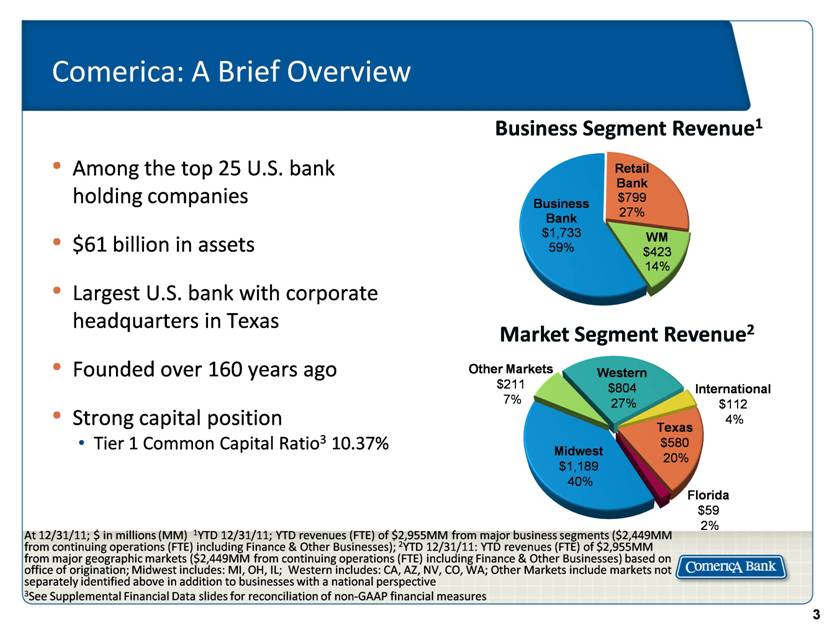
Comerica: A Brief Overview Among the top 25 U.S. bank holding companies $61 billion in assets Largest U.S. bank with corporate headquarters in Texas Founded over 160 years ago Strong capital position Tier 1 Common Capital Ratio3 10.37% Business Segment Revenue1 Market Segment Revenue2 International $112 4% Florida $59 2% At 12/31/11; $ in millions (MM) 1YTD 12/31/11; YTD revenues (FTE) of $2,955MM from major business segments ($2,449MM from continuing operations (FTE) including Finance & Other Businesses); 2YTD 12/31/11: YTD revenues (FTE) of $2,955MM from major geographic markets ($2,449MM from continuing operations (FTE) including Finance & Other Businesses) based on office of origination; Midwest includes: MI, OH, IL; Western includes: CA, AZ, NV, CO, WA; Other Markets include markets not separately identified above in addition to businesses with a national perspective 3See Supplemental Financial Data slides for reconciliation of non-GAAP financial measures Midwest $1,189 40% Other Markets $211 7% Western $804 27% Texas $580 20% |
|
|
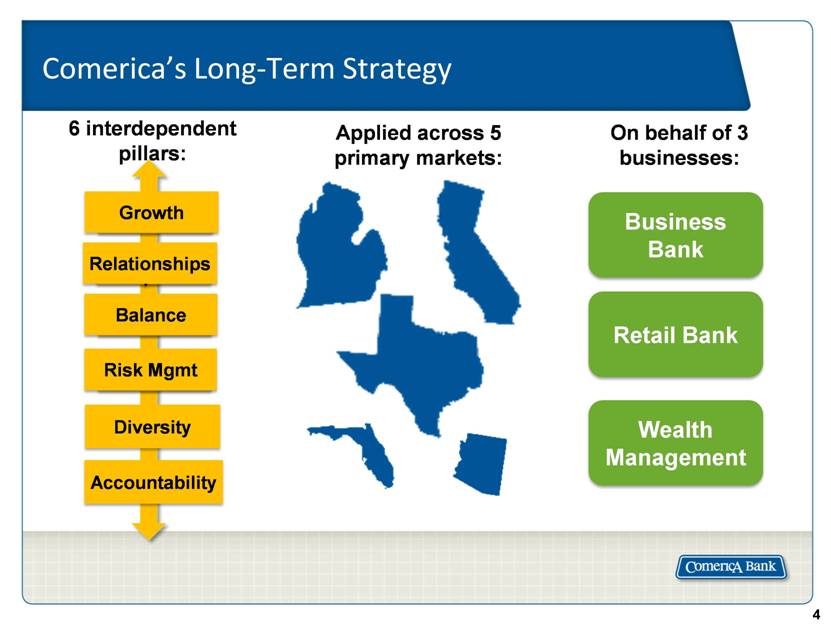
Comerica’s Long-Term Strategy Applied across 5 primary markets: 6 interdependent pillars: Business Bank Retail Bank Wealth Management On behalf of 3 businesses: |
|
|
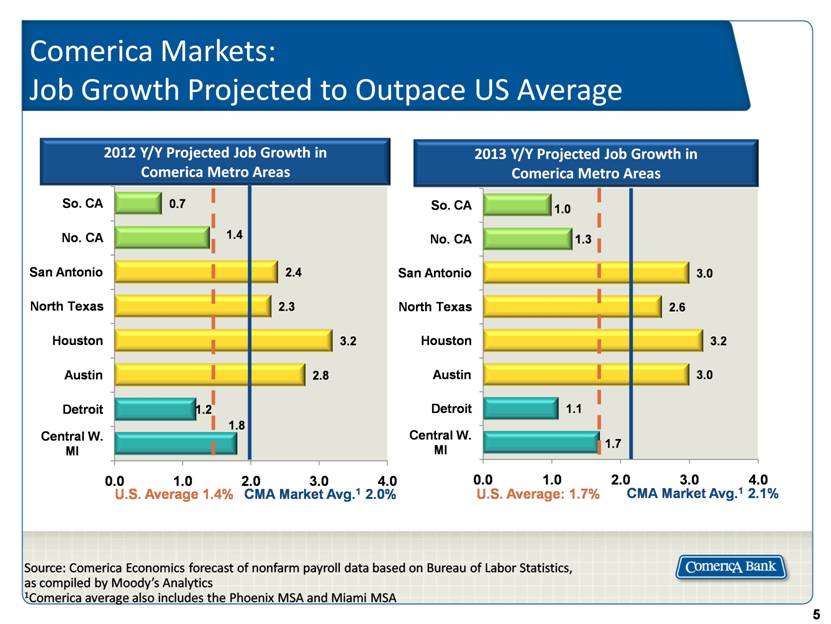
Comerica Markets: Job Growth Projected to Outpace US Average U.S. Average 1.4% CMA Market Avg.1 2.0% U.S. Average: 1.7% CMA Market Avg.1 2.1% 2013 Y/Y Projected Job Growth in Comerica Metro Areas 2012 Y/Y Projected Job Growth in Comerica Metro Areas Source: Comerica Economics forecast of nonfarm payroll data based on Bureau of Labor Statistics, as compiled by Moody’s Analytics 1Comerica average also includes the Phoenix MSA and Miami MSA |
|
|
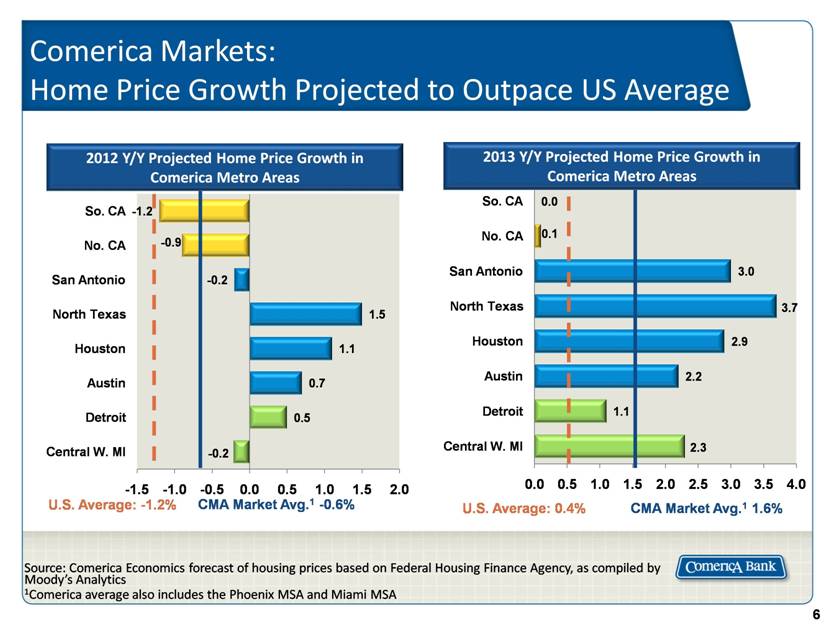
Comerica Markets: Home Price Growth Projected to Outpace US Average U.S. Average: -1.2% CMA Market Avg.1 -0.6% U.S. Average: 0.4% CMA Market Avg.1 1.6% 2013 Y/Y Projected Home Price Growth in Comerica Metro Areas 2012 Y/Y Projected Home Price Growth in Comerica Metro Areas Source: Comerica Economics forecast of housing prices based on Federal Housing Finance Agency, as compiled by Moody’s Analytics 1Comerica average also includes the Phoenix MSA and Miami MSA |
|
|
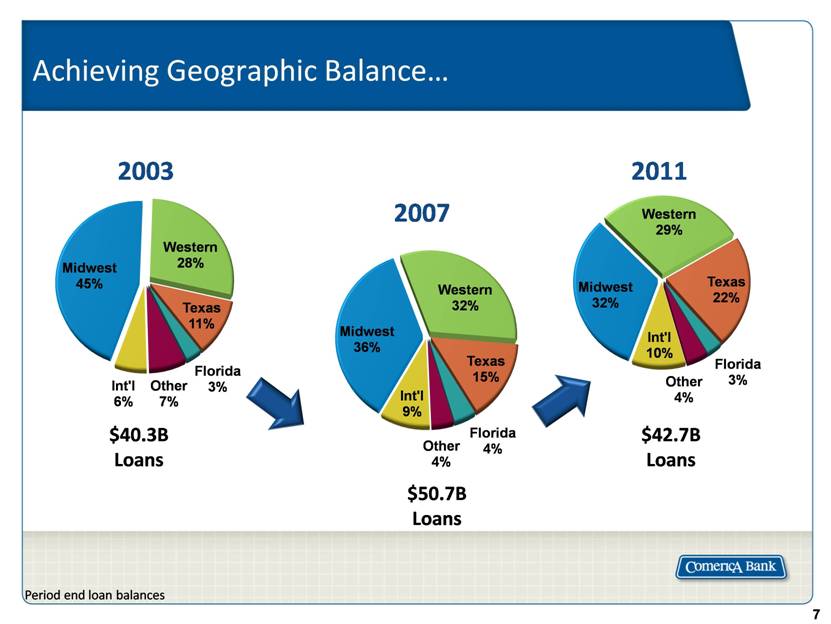
Achieving Geographic Balance 2003 2011 2007 Period end loan balances $40.3B Loans $50.7B Loans $42.7B Loans |
|
|
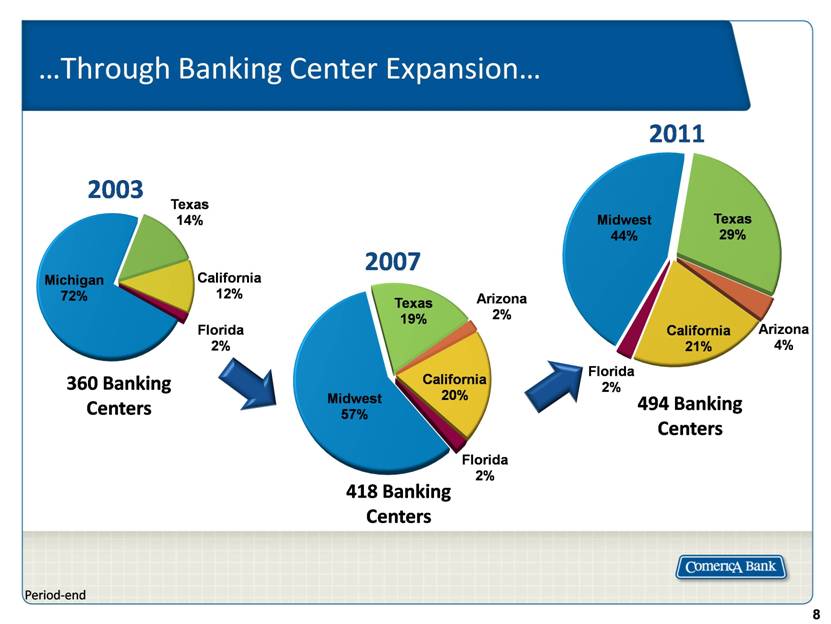
Through Banking Center Expansion 360 Banking Centers 494 Banking Centers 418 Banking Centers 2003 2011 2007 Period-end |
|
|
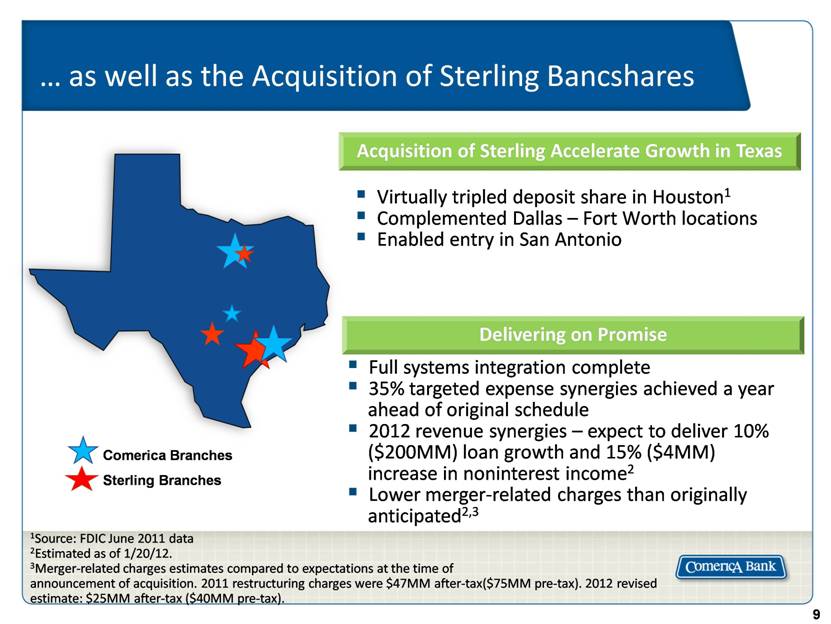
as well as the Acquisition of Sterling Bancshares Virtually tripled deposit share in Houston1 Complemented Dallas – Fort Worth locations Enabled entry in San Antonio 1Source: FDIC June 2011 data 2Estimated as of 1/20/12. 3Merger-related charges estimates compared to expectations at the time of announcement of acquisition. 2011 restructuring charges were $47MM after-tax($75MM pre-tax). 2012 revised estimate: $25MM after-tax ($40MM pre-tax). Acquisition of Sterling Accelerate Growth in Texas Delivering on Promise Full systems integration complete 35% targeted expense synergies achieved a year ahead of original schedule 2012 revenue synergies – expect to deliver 10% ($200MM) loan growth and 15% ($4MM) increase in noninterest income2 Lower merger-related charges than originally anticipated2,3 Comerica Branches Sterling Branches |
|
|
C&I Loan Growth 1Source: Federal Reserve H.8 as of 2/15/12 23Q11 includes $393MM commercial loans from the acquisition of Sterling Bancshares on July 28, 2011 Average Quarterly C&I Loan Growth1 Reflects decline and rebound in National Dealer due to supply disruption 4.8% Sterling January and February average loan trends: Mortgage Banker moderates, as expected National Dealer growth continues Commercial Real Estate decline slows Energy and Global Corporate continue to increase Commercial Loan Growth (Period-end, $B) |

|
|
Mortgage Banker Finance: Refinance Activity Drives Variability in Balances 40+ years experience with reputation for consistent, reliable approach Provide short-term warehouse financing: bridge time from origination of residential loans until sale into secondary market Extensive backroom provides collateral monitoring and customer service Establish full banking relationships; over 90% of customers have 3 or more product types at 12/31/11 Excellent credit quality throughout downturn Average Loans ($ MMs) +66% Average Deposits ($ MMs) |

|
|
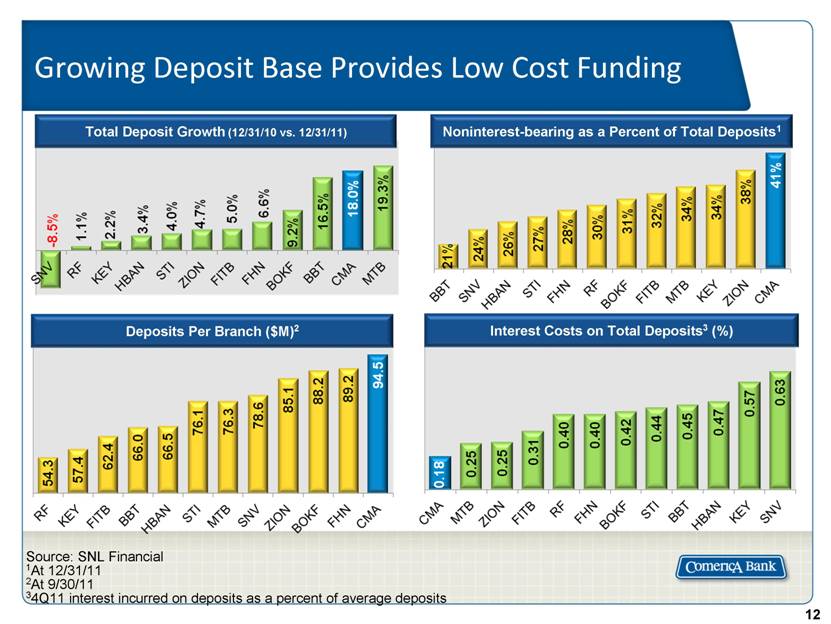
Growing Deposit Base Provides Low Cost Funding Noninterest-bearing as a Percent of Total Deposits1 Total Deposit Growth (12/31/10 vs. 12/31/11) Interest Costs on Total Deposits3 (%) Deposits Per Branch ($M)2 Source: SNL Financial 1At 12/31/11 2At 9/30/11 34Q11 interest incurred on deposits as a percent of average deposits |
|
|
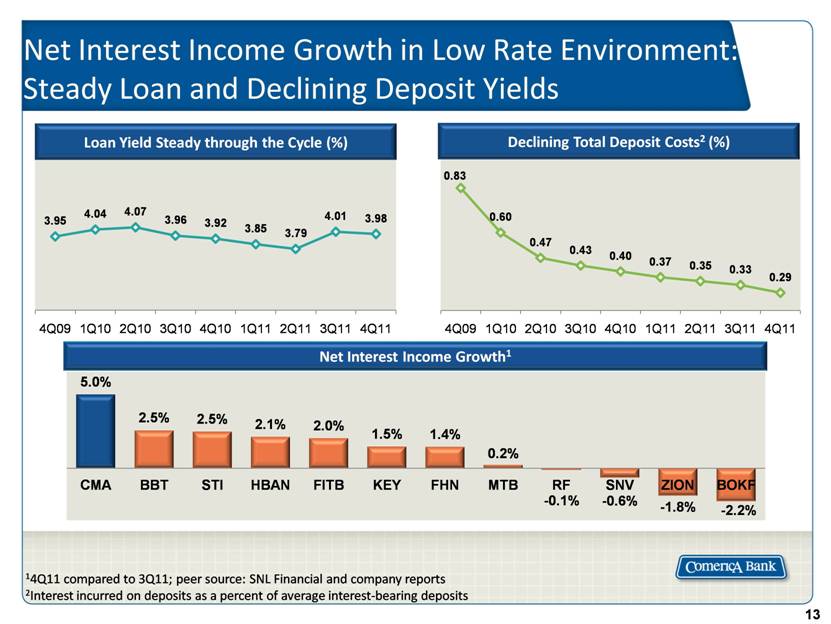
Net Interest Income Growth in Low Rate Environment: Steady Loan and Declining Deposit Yields 1 1 14Q11 compared to 3Q11; peer source: SNL Financial and company reports 2Interest incurred on deposits as a percent of average interest-bearing deposits Net Interest Income Growth1 Loan Yield Steady through the Cycle (%) Declining Total Deposit Costs2 (%) |
|
|
Approx. 80% of loans are floating rate of which approximately 70% are LIBOR based Rate floors are minimal (< 10% of total loans) Securities are primarily low risk and liquid, with an avg. life of approx. 3 years Nonaccrual loans – relatively minor impact Earning Assets2 Deposits/Borrowings Interest Rate Sensitivity Balance sheet is well positioned for rising rates1 Sensitivity is to short-term interest rates Assets Funding Funding predominantly from core deposits Approx. 40% of deposits are noninterest-bearing – provide more value in a higher rate environment Wholesale funding options remain accessible Floating Rate Loans - LIBOR 46% Floating Rate Loans - PRIME 18% Excess Liquidity 7% Fixed Rate Loans 13% Securities 16% Substantially Floating Substantially Fixed Substantially Managed Rates Customer C.D.s 12% Noninterest-bearing Deposits 34% Non-specific Maturity Deposits 42% Medium- and Long-term Debt 11% Other Wholesale Funds 1% Balance Sheet Positioned for Growth At 12/31/11 1For analysis and underlying assumptions, see caption "Interest Rate Risk" starting on page F-36 of our 2011 Form 10-K 2Loan percentages are estimated based on historical average loan mix data. |

|
|
Cross-sell Opportunity: Stronger, More Profitable Relationships Strengthened program to monitor and incent relationship managers to develop loan and fee income opportunities More than 40% of Business Bank relationships have 3 or more products Develop, identify and provide products that customers desire At 12/31/11 |

|
|
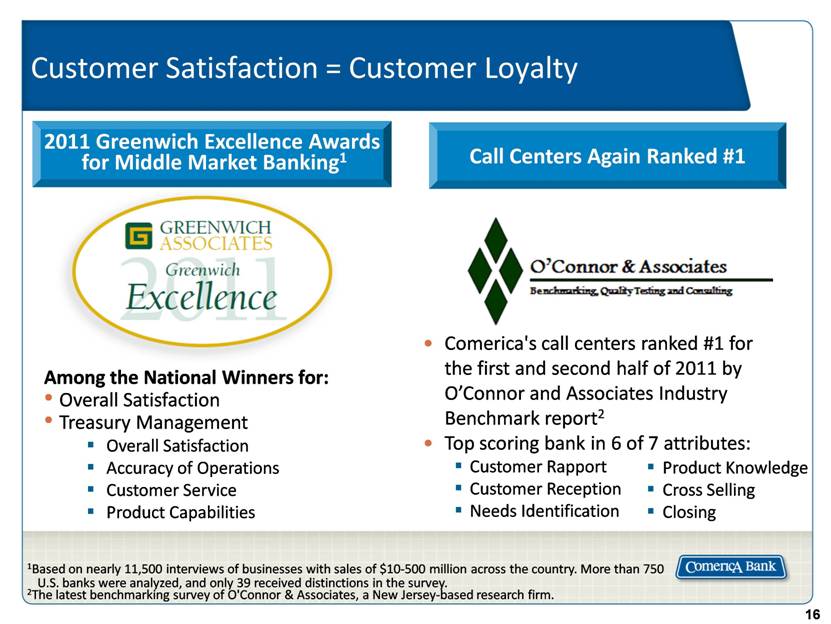
Customer Satisfaction = Customer Loyalty 1Based on nearly 11,500 interviews of businesses with sales of $10-500 million across the country. More than 750 U.S. banks were analyzed, and only 39 received distinctions in the survey. 2The latest benchmarking survey of O'Connor & Associates, a New Jersey-based research firm. Among the National Winners for: Overall Satisfaction Treasury Management Overall Satisfaction Accuracy of Operations Customer Service Product Capabilities 2011 Greenwich Excellence Awards for Middle Market Banking1 Comerica's call centers ranked #1 for the first and second half of 2011 by O’Connor and Associates Industry Benchmark report2 Top scoring bank in 6 of 7 attributes: Customer Rapport Customer Reception Needs Identification Call Centers Again Ranked #1 Product Knowledge Cross Selling Closing |
|
|
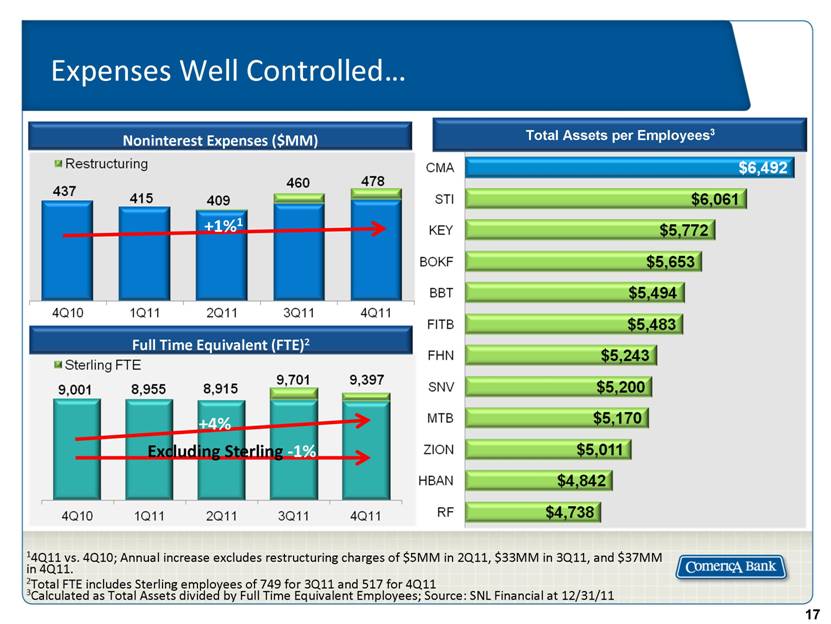
Expenses Well Controlled 14Q11 vs. 4Q10; Annual increase excludes restructuring charges of $5MM in 2Q11, $33MM in 3Q11, and $37MM in 4Q11. 2Total FTE includes Sterling employees of 749 for 3Q11 and 517 for 4Q11 3Calculated as Total Assets divided by Full Time Equivalent Employees; Source: SNL Financial at 12/31/11 Noninterest Expenses ($MM) +1%1 +4% Excluding Sterling -1% Total Assets per Employees3 Full Time Equivalent (FTE)2 |
|
|
Aiding in Efficiency Ratio and ROA Improvement <60% Efficiency Ratio Return on Average Assets (ROA) Outlook as of 3/6/12 20 year average: 1.19% 2007 2008 2009 2010 2011 Long-Term Target |

|
|
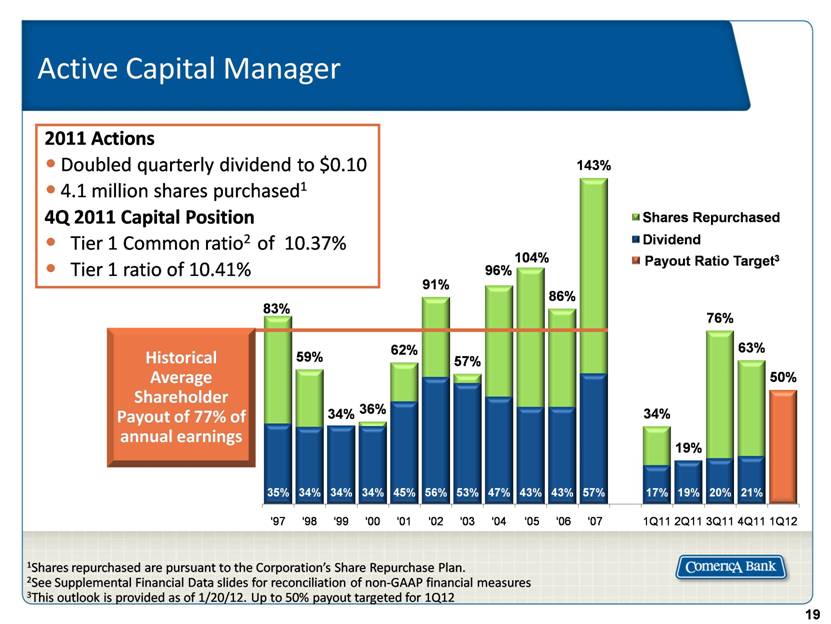
Active Capital Manager Historical Average Shareholder Payout of 77% of annual earnings 1Shares repurchased are pursuant to the Corporation’s Share Repurchase Plan. 2See Supplemental Financial Data slides for reconciliation of non-GAAP financial measures 3This outlook is provided as of 1/20/12. Up to 50% payout targeted for 1Q12 2011 Actions Doubled quarterly dividend to $0.10 4.1 million shares purchased1 4Q 2011 Capital Position Tier 1 Common ratio2 of 10.37% Tier 1 ratio of 10.41% Payout Ratio Target3 |
|
|
Common Equity Peer Avg.: 10.4% Approaching shareholder payout from a position of strength Source: SNL Financial and company reports; At 12/31/11 1Calculated by taking tangible common equity as a percentage of total assets. Common Equity as a % of Total Assets 1 Tangible Common Equity Peer Avg.: 7.6% |

|
|
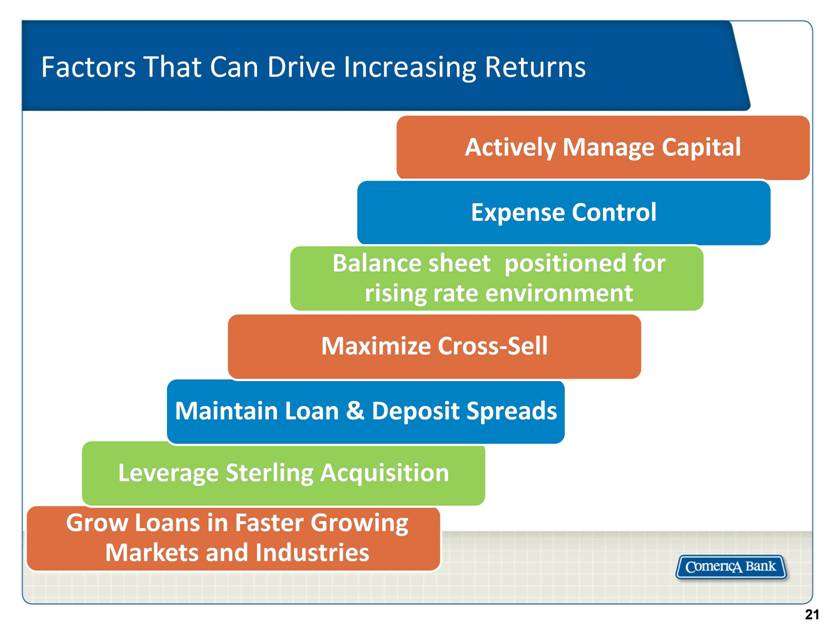
Factors That Can Drive Increasing Returns Grow Loans in Faster Growing Markets and Industries Leverage Sterling Acquisition Maintain Loan & Deposit Spreads Maximize Cross-Sell Balance sheet positioned for rising rate environment |
|
|
Appendix |

|
|
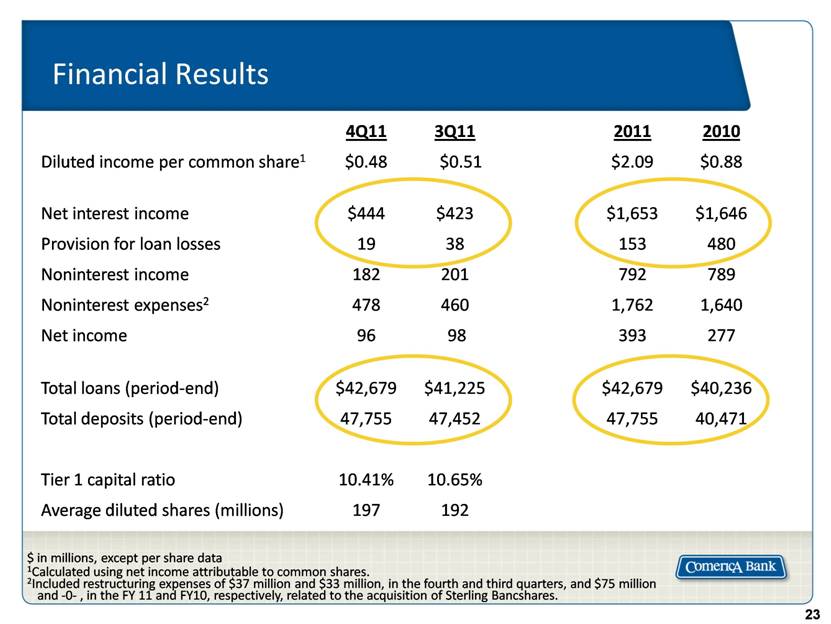
Financial Results 4Q11 3Q11 2011 2010 Diluted income per common share1 $0.48 $0.51 $2.09 $0.88 Net interest income $444 $423 $1,653 $1,646 Provision for loan losses 19 38 153 480 Noninterest income 182 201 792 789 Noninterest expenses2 478 460 1,762 1,640 Net income 96 98 393 277 Total loans (period-end) $42,679 $41,225 $42,679 $40,236 Total deposits (period-end) 47,755 47,452 47,755 40,471 Tier 1 capital ratio 10.41% 10.65% Average diluted shares (millions) 197 192 $ in millions, except per share data 1Calculated using net income attributable to common shares. 2Included restructuring expenses of $37 million and $33 million, in the fourth and third quarters, and $75 million and -0- , in the FY 11 and FY10, respectively, related to the acquisition of Sterling Bancshares. |
|
|
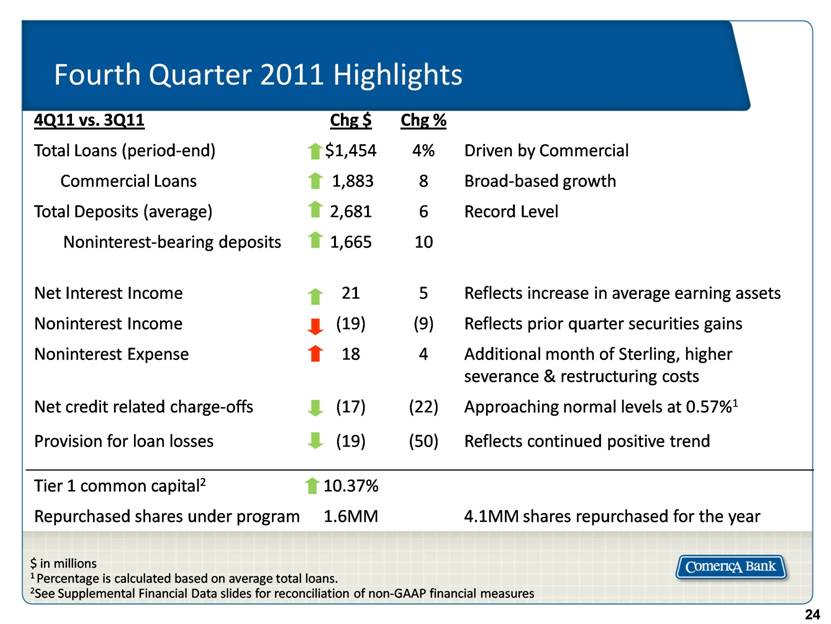
Fourth Quarter 2011 Highlights 4Q11 vs. 3Q11 Chg $ Chg % Total Loans (period-end) $1,454 4% Driven by Commercial Commercial Loans 1,883 8 Broad-based growth Total Deposits (average) 2,681 6 Record Level Noninterest-bearing deposits 1,665 10 Net Interest Income 21 5 Reflects increase in average earning assets Noninterest Income (19) (9) Reflects prior quarter securities gains Noninterest Expense 18 4 Additional month of Sterling, higher severance & restructuring costs Net credit related charge-offs (17) (22) Approaching normal levels at 0.57%1 Provision for loan losses (19) (50) Reflects continued positive trend Tier 1 common capital2 10.37% Repurchased shares under program 1.6MM 4.1MM shares repurchased for the year $ in millions 1 Percentage is calculated based on average total loans. 2See Supplemental Financial Data slides for reconciliation of non-GAAP financial measures |
|
|
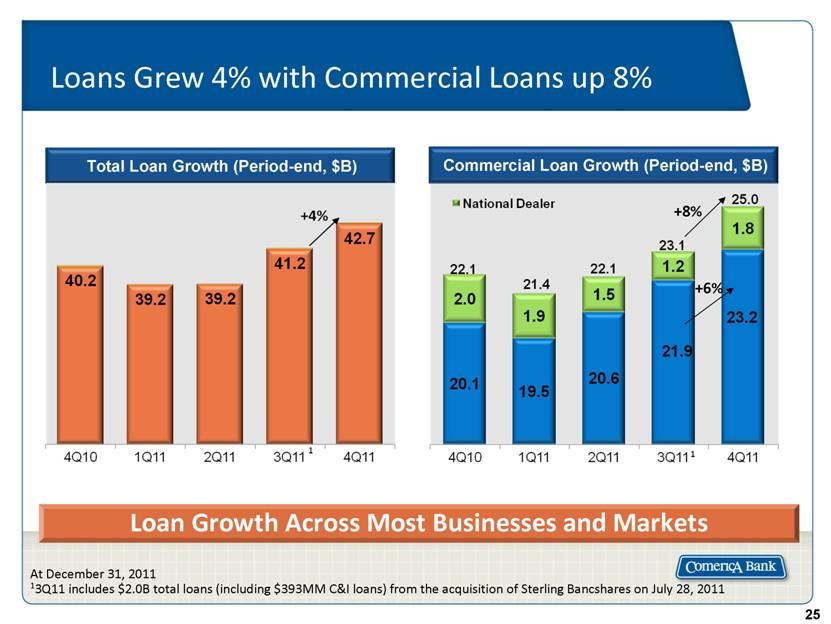
Total Loan Growth (Period-end, $B) Commercial Loan Growth (Period-end, $B) Loans Grew 4% with Commercial Loans up 8% Loan Growth Across Most Businesses and Markets At December 31, 2011 13Q11 includes $2.0B total loans (including $393MM C&I loans) from the acquisition of Sterling Bancshares on July 28, 2011 +6% +8% |
|
|
Loan Commitments and Utilization Increase Commitments and Outstandings ($ in MM) Analysis of 4Q11 v. 3Q11 3Q11 includes Comerica legacy and Sterling Energy portfolio from date of acquisition; Average utilization of commercial commitments as a percentage of total commercial commitments at period end Line utilization up 2 percentage points to 48%, highest level since 2Q09 Commitments increased $1.9B (4%) to $46.9B, highest level since 3Q09 Increased commitments in almost every line of business Loan pipeline remained strong |

|
|
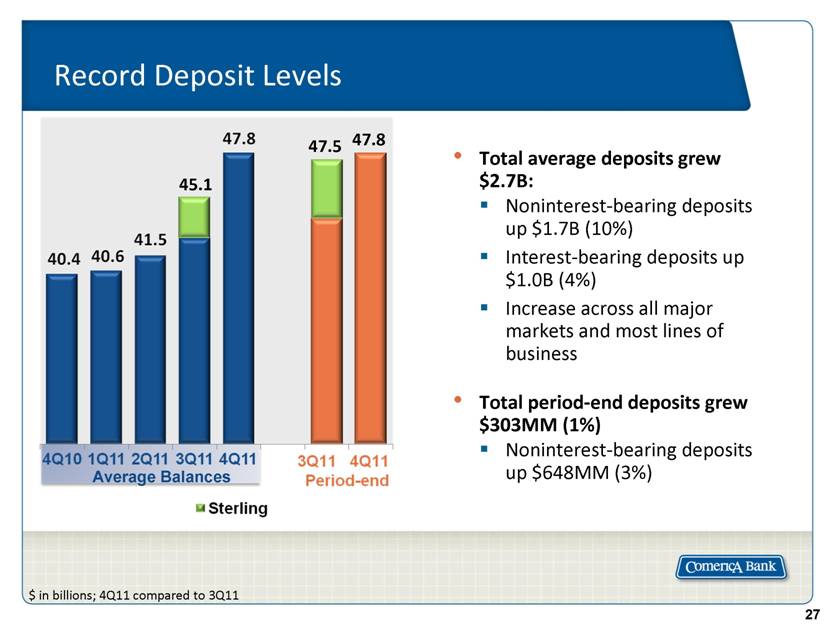
Record Deposit Levels $ in billions; 4Q11 compared to 3Q11 Total average deposits grew $2.7B: Noninterest-bearing deposits up $1.7B (10%) Interest-bearing deposits up $1.0B (4%) Increase across all major markets and most lines of business Total period-end deposits grew $303MM (1%) Noninterest-bearing deposits up $648MM (3%) 47.5 45.1 Average Balances 47.8 |
|
|
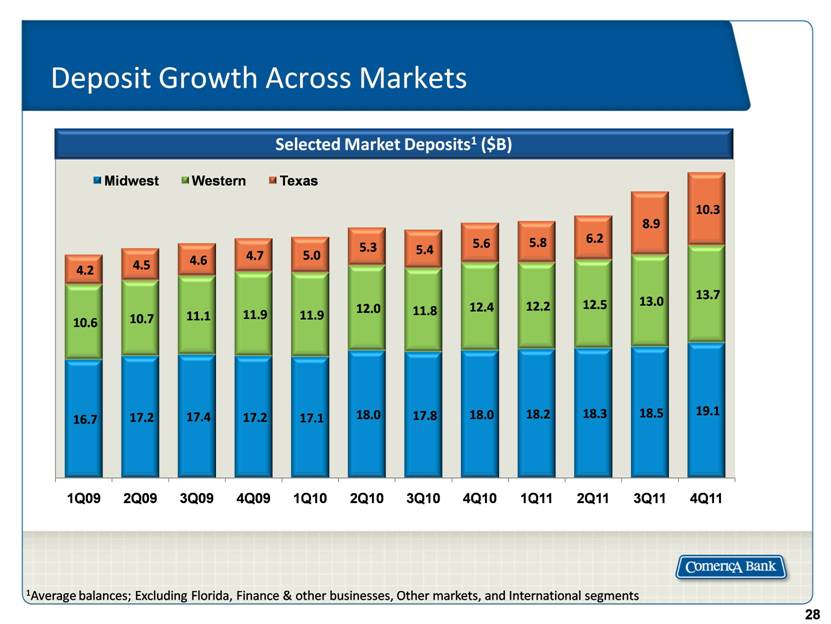
Deposit Growth Across Markets 1Average balances; Excluding Florida, Finance & other businesses, Other markets, and International segments Selected Market Deposits1 ($B) |
|
|
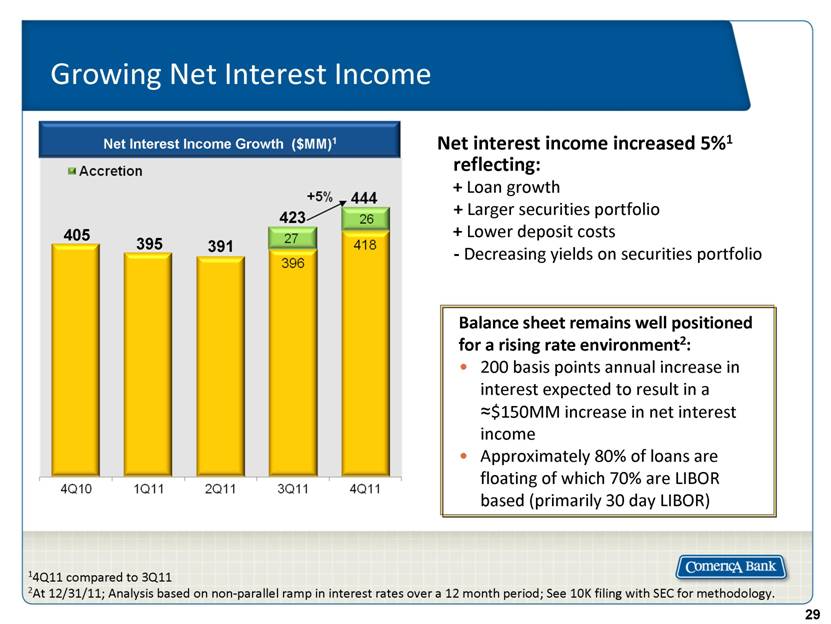
Growing Net Interest Income 14Q11 compared to 3Q11 2At 12/31/11; Analysis based on non-parallel ramp in interest rates over a 12 month period; See 10K filing with SEC for methodology. Net interest income increased 5%1 reflecting: + Loan growth + Larger securities portfolio + Lower deposit costs - Decreasing yields on securities portfolio Balance sheet remains well positioned for a rising rate environment2: 200 basis points annual increase in interest expected to result in a »$150MM increase in net interest income Approximately 80% of loans are floating of which 70% are LIBOR based (primarily 30 day LIBOR) Net Interest Income Growth ($MM)1 423 391 395 405 |
|
|
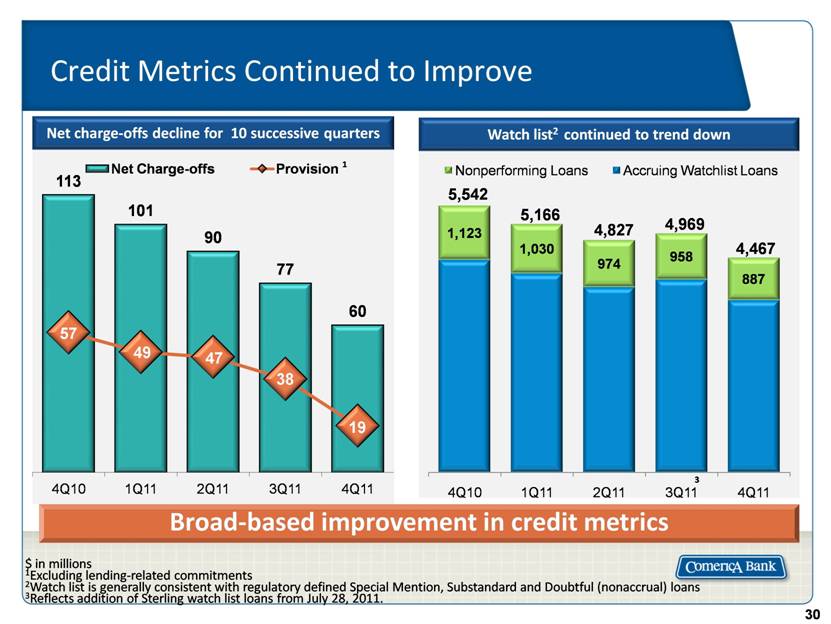
Credit Metrics Continued to Improve $ in millions 1Excluding lending-related commitments 2Watch list is generally consistent with regulatory defined Special Mention, Substandard and Doubtful (nonaccrual) loans 3Reflects addition of Sterling watch list loans from July 28, 2011. 1 Broad-based improvement in credit metrics Net charge-offs decline for 10 successive quarters Watch list2 continued to trend down |
|
|
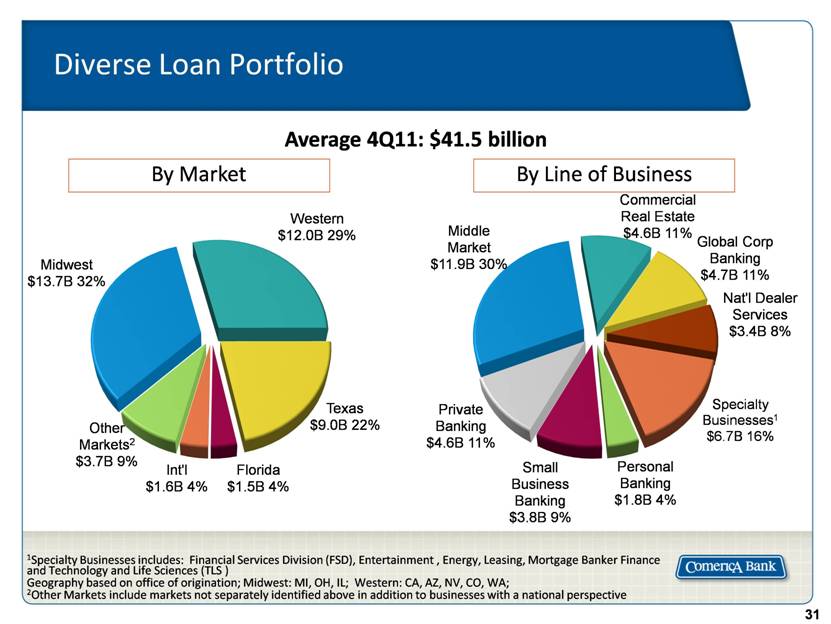
Diverse Loan Portfolio 1Specialty Businesses includes: Financial Services Division (FSD), Entertainment , Energy, Leasing, Mortgage Banker Finance and Technology and Life Sciences (TLS ) Geography based on office of origination; Midwest: MI, OH, IL; Western: CA, AZ, NV, CO, WA; 2Other Markets include markets not separately identified above in addition to businesses with a national perspective Average 4Q11: $41.5 billion By Market By Line of Business |
|
|
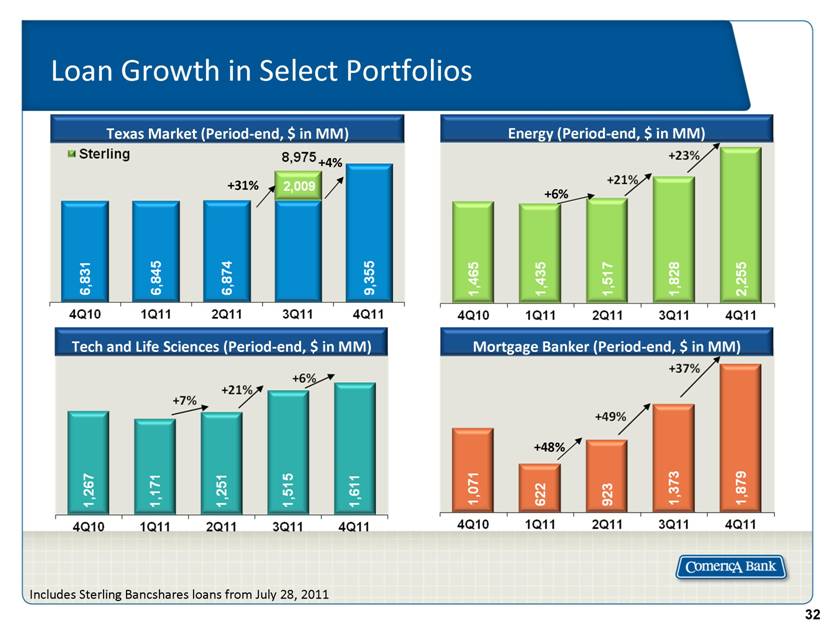
Loan Growth in Select Portfolios Includes Sterling Bancshares loans from July 28, 2011 +6% +48% Mortgage Banker (Period-end, $ in MM) Energy (Period-end, $ in MM) Tech and Life Sciences (Period-end, $ in MM) Texas Market (Period-end, $ in MM) +31% +4% |
|
|
Shared National Credit Relationships Approx. 860 borrowers Majority of relationships include ancillary business Comerica is agent for approximately 17% Adhere to same credit underwriting standards as rest of loan book Credit quality mirrors total portfolio December 31, 2011: $8.4 billion Shared National Credit (SNC): Facilities greater than $20 million shared by three or more federally supervised financial institutions which are reviewed by regulatory authorities at the agent bank level. Period-end outstandings as of December 31, 2011 |

|
|
National Dealer Services Line of Business Detroit 3 26% at 12/11 vs. 41% at 12/05 Geographic Dispersion Western 59% Florida 7% Midwest 20% Texas 7% 1 Franchise distribution based on December 31, 2011 period-end (PE) outstandings 2 “Other” includes obligations where a primary franchise is indeterminable (rental car and leasing companies, heavy truck, recreational vehicles, and non-floor plan loans) 65 years of Floor plan lending, with over 20 years on a national basis Top tier strategy Majority are “Mega Dealer” (five or more dealerships in group) Excellent credit quality Robust monitoring of company inventory and performance Average PE Floor Plan PE Non-Floor Plan Loan Balances ($ in Billions) |

|
|
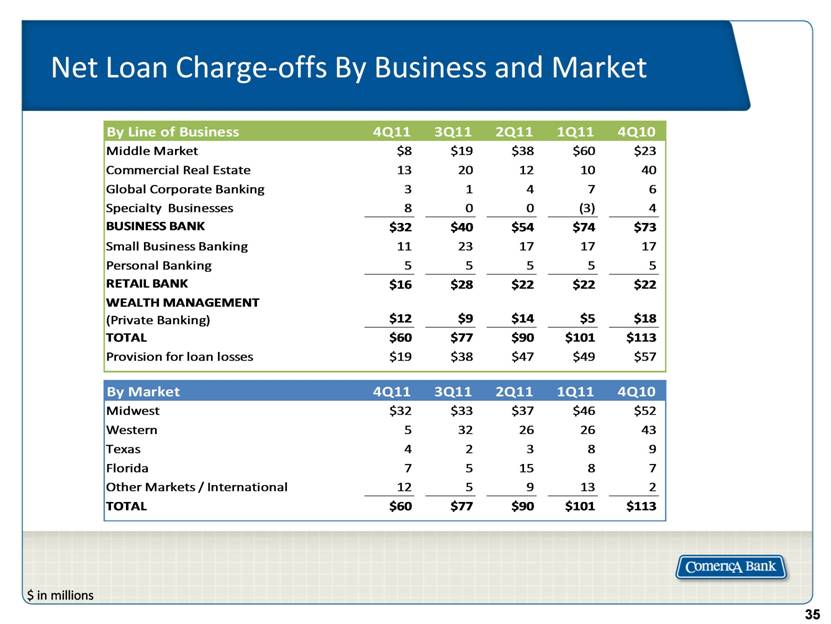
Net Loan Charge-offs By Business and Market $ in millions |
|
|
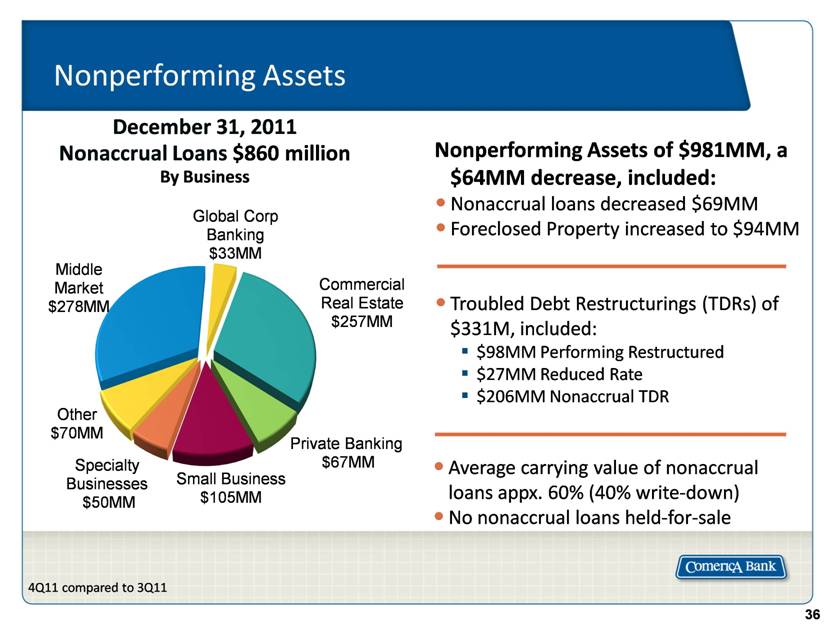
Average carrying value of nonaccrual loans appx. 60% (40% write-down) No nonaccrual loans held-for-sale 4Q11 compared to 3Q11 Nonperforming Assets Nonperforming Assets of $981MM, a $64MM decrease, included: Nonaccrual loans decreased $69MM Foreclosed Property increased to $94MM Troubled Debt Restructurings (TDRs) of $331M, included: $98MM Performing Restructured $27MM Reduced Rate $206MM Nonaccrual TDR December 31, 2011 Nonaccrual Loans $860 million By Business |
|
|
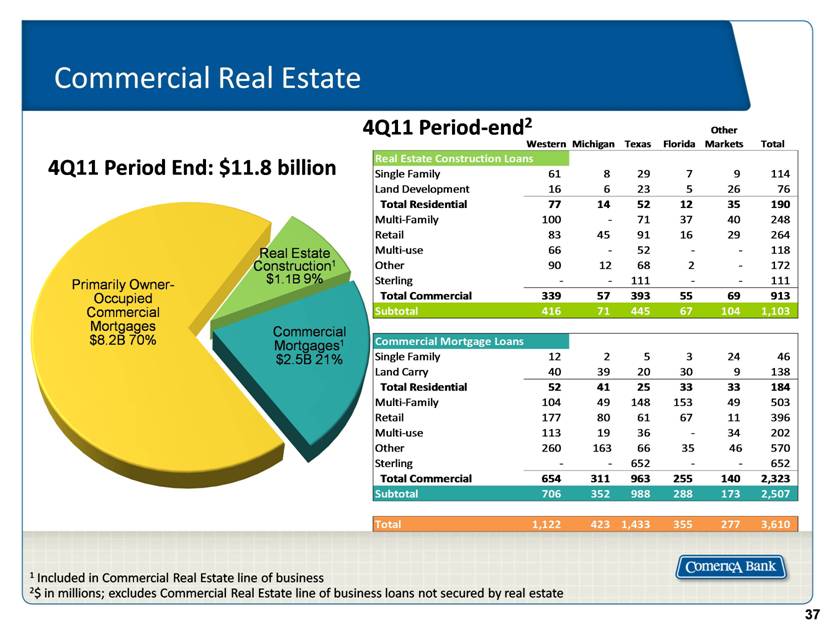
Commercial Real Estate 1 Included in Commercial Real Estate line of business 2$ in millions; excludes Commercial Real Estate line of business loans not secured by real estate 4Q11 Period End: $11.8 billion Primarily Owner-Occupied Commercial Mortgages $8.2B 70% Real Estate Construction1 $1.1B 9% Commercial Mortgages1 $2.5B 21% 4Q11 Period-end2 |
|
|
Investment Securities Portfolio Consists primarily of AAA mortgage-backed Freddie Mac and Fannie Mae government agency securities (MBS) Total average MBS portfolio of $9.4B Net unrealized pre-tax gain $222MM Yield of 2.74% Duration of 2.7 years Balance at period end 12/31/11 $9.5B Target: Mortgage-backed Securities » $9B Average $ in millions (MM) |

|
|
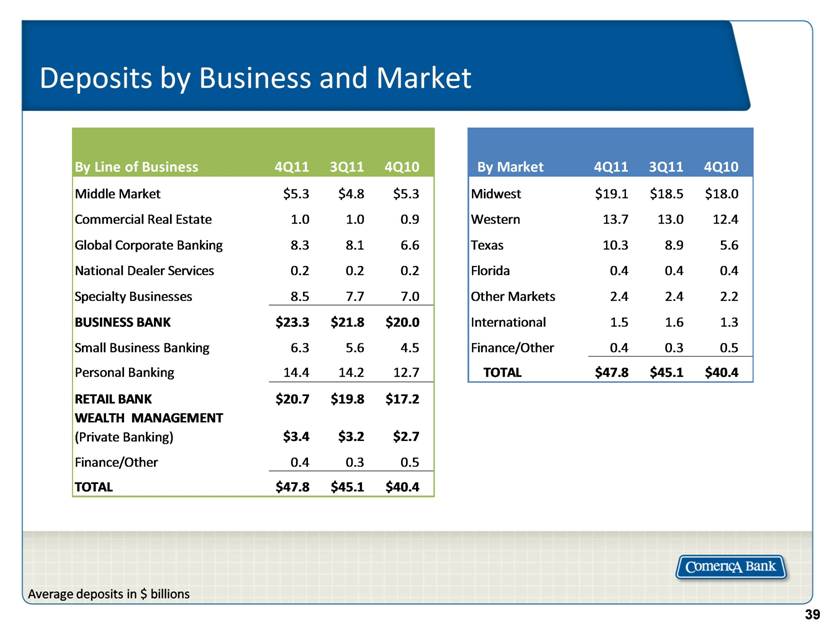
Deposits by Business and Market Average deposits in $ billions |
|
|
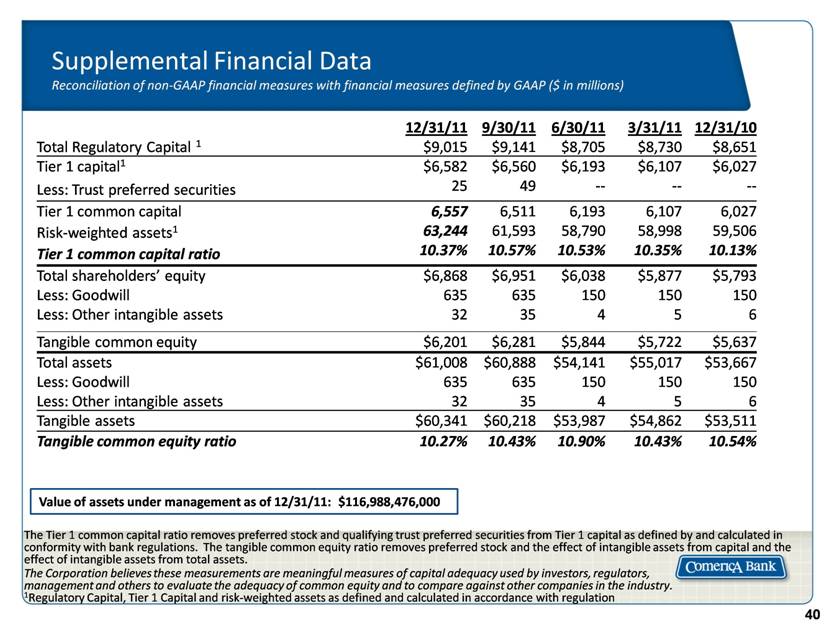
Supplemental Financial Data Reconciliation of non-GAAP financial measures with financial measures defined by GAAP ($ in millions) 12/31/11 9/30/11 6/30/11 3/31/11 12/31/10 Total Regulatory Capital 1 $9,015 $9,141 $8,705 $8,730 $8,651 Tier 1 capital1 Less: Trust preferred securities $6,582 25 $6,560 49 $6,193 -- $6,107 -- $6,027 -- Tier 1 common capital Risk-weighted assets1 Tier 1 common capital ratio 6,557 63,244 10.37% 6,511 61,593 10.57% 6,193 58,790 10.53% 6,107 58,998 10.35% 6,027 59,506 10.13% Total shareholders’ equity Less: Goodwill Less: Other intangible assets $6,868 635 32 $6,951 635 35 $6,038 150 4 $5,877 150 5 $5,793 150 6 Tangible common equity $6,201 $6,281 $5,844 $5,722 $5,637 Total assets Less: Goodwill Less: Other intangible assets $61,008 635 32 $60,888 635 35 $54,141 150 4 $55,017 150 5 $53,667 150 6 Tangible assets $60,341 $60,218 $53,987 $54,862 $53,511 Tangible common equity ratio 10.27% 10.43% 10.90% 10.43% 10.54% The Tier 1 common capital ratio removes preferred stock and qualifying trust preferred securities from Tier 1 capital as defined by and calculated in conformity with bank regulations. The tangible common equity ratio removes preferred stock and the effect of intangible assets from capital and the effect of intangible assets from total assets. The Corporation believes these measurements are meaningful measures of capital adequacy used by investors, regulators, management and others to evaluate the adequacy of common equity and to compare against other companies in the industry. 1Regulatory Capital, Tier 1 Capital and risk-weighted assets as defined and calculated in accordance with regulation Value of assets under management as of 12/31/11: $116,988,476,000 |
|
|
[LOGO] |