Attached files
Table of Contents
UNITED STATES
SECURITIES AND EXCHANGE COMMISSION
Washington D.C. 20549
FORM 10-K
(Mark One)
| x | ANNUAL REPORT PURSUANT TO SECTION 13 OR 15(d) OF THE SECURITIES EXCHANGE ACT OF 1934 |
For the fiscal year ended December 31, 2011
OR
| ¨ | TRANSITION REPORT PURSUANT TO SECTION 13 OR 15(d) OF THE SECURITIES EXCHANGE ACT OF 1934 |
For the transition period from to
Commission file number 0-33377
MCG CAPITAL CORPORATION
(Exact name of registrant as specified in its charter)
| Delaware | 54-1889518 | |
| (State or other jurisdiction of incorporation or organization) |
(I.R.S. Employer Identification No.) | |
| 1100 Wilson Boulevard, Suite 3000, Arlington, VA | 22209 | |
| (Address of principal executive offices) | (Zip Code) | |
(703) 247-7500
(Registrant’s telephone number, including area code)
| Securities registered pursuant to Section 12(b) of the Act: | ||
| Title of each class |
Name of each exchange on which registered | |
| Common Stock, par value $0.01 per share | The NASDAQ Global Select Market | |
Securities registered pursuant to Section 12(g) of the Act: None
Indicate by check mark if the registrant is a well-known seasoned issuer, as defined in Rule 405 of the Securities Act. Yes ¨ No x
Indicate by check mark if the registrant is not required to file reports pursuant to Section 13 or Section 15(d) of the Act. Yes ¨ No x
Indicate by check mark whether the registrant (1) has filed all reports required to be filed by Section 13 or 15(d) of the Securities Exchange Act of 1934 during the preceding 12 months (or for such shorter period that the registrant was required to file such reports), and (2) has been subject to such filing requirements for the past 90 days. Yes x No ¨
Indicate by check mark whether the registrant has submitted electronically and posted on its corporate Web site, if any, every Interactive Data File required to be submitted and posted pursuant to Rule 405 of Regulation S-T during the preceding 12 months (or for such shorter period that the registrant was required to submit and post such files). Yes ¨ No ¨
Indicate by check mark if disclosure of delinquent filers pursuant to Item 405 of Regulation S-K is not contained herein, and will not be contained, to the best of registrant’s knowledge, in definitive proxy or information statements incorporated by reference in Part III of this Form 10-K or any amendment to this Form 10-K. ¨
Indicate by check mark whether the registrant is a large accelerated filer, an accelerated filer, a non-accelerated filer, or a smaller reporting company. See the definitions of “large accelerated filer,” “accelerated filer” and “smaller reporting company” in Rule 12b-2 of the Exchange Act. (Check one):
| Large accelerated filer | ¨ | Accelerated filer | x | |||
| Non-accelerated filer | ¨ (Do not check if a smaller reporting company) | Smaller reporting company | ¨ | |||
Indicate by check mark whether the registrant is a shell company (as defined in Rule 12b-2 of the Act). Yes ¨ No x
The aggregate market value of the Registrant’s voting shares of common stock held by non-affiliates of the Registrant on June 30, 2011, was $426,239,573, based on $6.08 per share, the last reported sale price of the shares of common stock on the NASDAQ Global Select Market. For purposes of this computation, shares held by certain stockholders and by directors and executive officers of the Registrant have been excluded. Such exclusion of shares held by such persons is not intended, nor shall it be deemed, to be an admission that such persons are affiliates of the Registrant. There were 76,997,119 shares of the Registrant’s common stock outstanding as of February 24, 2012.
Documents Incorporated by Reference
Portions of the Registrant’s definitive Proxy Statement relating to its 2012 Annual Meeting of Stockholders, to be filed pursuant to Regulation 14A with the Securities and Exchange Commission, are incorporated by reference into Part III of this Annual Report on Form 10-K as indicated herein.
Table of Contents
Table of Contents
| ITEM 1. | BUSINESS |
General
We are a solutions-focused commercial finance company that provides capital and advisory services to middle-market companies throughout the United States. Our investment objective is to achieve current income and capital gains.
We are an internally managed, non-diversified, closed-end investment company that has elected to be regulated as a business development company, or BDC, under the Investment Company Act of 1940, as amended, or the 1940 Act. As a BDC, we are required to meet various regulatory tests, which include investing at least 70% of our total assets in private or thinly traded public U.S.-based companies and meeting a 200% asset coverage ratio of total net assets to total senior securities.
For federal income tax purposes, we have elected to be treated as a regulated investment company, or RIC, under Subchapter M of the Internal Revenue Code. In order to continue to qualify as a RIC for federal income tax purposes and obtain favorable RIC tax treatment, we must meet certain requirements, including certain minimum distribution requirements.
Corporate Structure
We conduct some of our activities through wholly owned, special-purpose financing subsidiaries. These subsidiaries are bankruptcy remote, special-purpose entities to which we transfer certain loans. Each financing subsidiary, in turn, transfers the loans to a Delaware statutory trust. For accounting purposes, the transfers of the loans to the Delaware statutory trusts are structured as on-balance sheet securitizations. We also use wholly owned subsidiaries, all of which are structured as Delaware corporations and limited liability companies, to hold the assets of one or more of our portfolio companies. Some of these subsidiaries have wholly owned subsidiaries, all of which are Delaware corporations that hold the assets of certain of our portfolio companies.
We also make investments in qualifying small businesses through Solutions Capital I, L.P., or Solutions Capital, our wholly owned subsidiary licensed by the United States Small Business Administration, or the SBA, to operate as a small business investment company, or SBIC, under the Small Business Investment Act of 1958, as amended, or the SBIC Act. As a SBIC, Solutions Capital is subject to a variety of regulations concerning, among other things, the size and nature of the companies in which it may invest and the structure of those investments.
Company Background
We were incorporated in Delaware in 1998. On March 18, 1998, we changed our name from MCG, Inc. to MCG Credit Corporation and, on June 14, 2001, we changed our name from MCG Credit Corporation to MCG Capital Corporation. Our principal executive offices are located at 1100 Wilson Boulevard, Suite 3000, Arlington, VA 22209 and our telephone number is (703) 247-7500.
In this Annual Report on Form 10-K, the terms “Company,” “MCG,” “we,” “us” and “our” refer to MCG Capital Corporation and its wholly owned subsidiaries (including its affiliated securitization trusts) unless the context otherwise requires.
We are subject to the informational requirements of the Securities Exchange Act of 1934, as amended, or the Exchange Act, and, accordingly, file reports, proxy statements and other information with the Securities Exchange Commission, or the SEC. Such reports, proxy statements and other information can be read and copied at the public reference facilities maintained by the SEC at the Public Reference Room, 100 F Street, N.E., Washington, D.C. 20549. Information regarding the operation of the Public Reference Room may be obtained by calling the SEC at 1-800-SEC-0330. The SEC maintains a web site (www.sec.gov) that contains reports, proxy and information statements and other information regarding issuers that file electronically with the SEC.
Our Internet address is www.mcgcapital.com. We are not including the information contained on our website as a part of, or incorporating it by reference into, this Annual Report on Form 10-K. We make available free of charge on our website our Annual Reports on Form 10-K, Quarterly Reports on Form 10-Q, Current Reports on Form 8-K and amendments to those reports filed or furnished pursuant to Section 13(a) or 15(d) of the Exchange Act, as soon as reasonably practicable after we electronically file such material with, or furnish it to, the SEC.
1
Table of Contents
Our logo, trademarks and service marks are the property of MCG. Other trademarks or service marks appearing in this Annual Report on Form 10-K are the property of their respective holders.
Significant Developments in 2011
In 2011, we continued to execute on our previously stated strategic plan to, among other initiatives, convert lower-yielding equity investments and unencumbered cash into yield-oriented new investment opportunities. We successfully monetized equity investments in 15 control and other equity positions generating cash proceeds of $64.3 million. Our liquidity position, together with the generation of distributable net operating income, or DNOI, of $0.53 per share, enabled our board or directors to declare dividend distributions of $0.66 per share in 2011.
Notwithstanding the success of our 2011 monetization efforts and the solid performance of the majority of our investment portfolio, continued valuation adjustments to our largest control investment, Broadview Networks Holdings, Inc., or Broadview, and valuation adjustments to certain other legacy investments resulted in a reported loss of $93.1 million for 2011. These losses, together with our limited access to debt and equity markets, have currently restricted our origination liquidity sources to our existing SBIC facility and unencumbered cash.
On October 31, 2011, Richard W. Neu, Chairman of our board of directors, was elected as chief executive officer, succeeding Steven F. Tunney, Sr. who resigned in order to pursue other interests. Additionally, B. Hagen Saville, previously our Executive Vice President of Business Development and a member of our board of directors, was appointed President and Chief Operating Officer.
Outlook
Under the direction of Messrs. Neu and Saville, MCG took a fresh look at how to prudently and expeditiously return the Company to its roots as a strong middle market debt lender. As part of that undertaking, every aspect of the Company was examined under the assumption that our legacy equity positions wind down over the course of 2012 and with the fundamental goal of simplifying operations.
This transition is consistent with the desire to create a company with less credit and leverage risk yet one that has a sustainable and predictable level of NOI and dividend generation. The transition also addresses the potential impact of an expected reduction, over the next several years, of the size of our investment portfolio as our existing secondary market funding facilities contractually wind down.
We are substantially complete with our process review. Relative to our fourth quarter annualized general and administrative costs, excluding costs related to the resignation of Mr. Tunney, we have identified non-compensation cost reduction opportunities of approximately $4.5 million to $5.5 million per annum which, when fully implemented, we believe will target a non-compensation cost structure of approximately $5.5 million to $6.5 million. We expect these cost reductions to be embedded in our non-compensation general and administrative costs by no later than the end of the first quarter of 2013, which is when the lease on our current headquarters facility expires.
In addition to our process review, and taking into consideration the anticipated wind down of our legacy equity positions and current secondary market funding facilities, we undertook a comprehensive review of our current work force and structure. This review encompassed a benchmark review against internally managed peers together with a skill assessment of our current personnel. It was undertaken with the intended fundamental principle of allowing no degradation to the Company’s existing risk management profile.
As a result of this review, we would anticipate our current work force of 37 employees will transition to a level of 20 to 25 by year end 2012. This reduction in force is intended to generate a targeted future base compensation and benefits level of approximately $4.0 million to $5.0 million beginning in 2013.
As we enter 2013 and begin to realize the expected benefits of the initiatives discussed above, we are forecasting NOI of approximately $0.50 per share to $0.60 per share. In effect, the anticipated cost savings of approximately $8.5 million to $10.5 million, together with the earnings benefits from projected monetizations and proposed conversions of legacy equity investments to debt instruments, are intended to provide a substantial offset to the earnings reduction attributable to the significant deleveraging of our balance sheet.
In arriving at this forecast, a number of assumptions are required which, if incorrect, could materially change the results of our forecast, including potential monetizations and proposed conversions. However, we have assumed no incremental debt or equity issuances as we clearly recognize that the primary path to future debt and equity support from investors, at economic levels, is through the stabilization of our investment portfolio.
2
Table of Contents
With respect to 2012, we are anticipating to incur non-recurring costs of approximately $0.10 per share to $0.15 per share, primarily associated with expected severance costs, the previously announced amendment of our SunTrust Warehouse facility, the early retirement of our private placement notes and other transitional costs. Excluding these costs, we are forecasting NOI of approximately $0.40 per share to $0.50 per share.
Recognizing the one time nature of the 2012 transitory costs, our strong liquidity position, and the importance of dividends to our investor base, we have committed to a dividend declaration level of $0.14 per share for the next two quarters. Accordingly, we will pay a $0.17 per share dividend in May 2012 followed by a $0.14 per share dividend in both July and October 2012. Such payments are expected to include a return of capital.
Lastly, as previously announced on January 17, 2012, we are authorized to repurchase shares of our common stock, up to $35 million, in open market transactions, including through block purchases, depending on prevailing market conditions and other factors. As of March 1, 2012, no shares have been repurchased.
MCG’s Investment Portfolio
Our investment portfolio is composed primarily of middle-market companies in which we have made up to $75 million of debt and equity investments. Typically, these middle-market companies have $20 million to $200 million in annual revenue and $3 million to $25 million in earnings before interest, taxes, depreciation and amortization, or EBITDA. Generally, our portfolio companies use our capital investments to finance acquisitions, recapitalizations and buyouts, as well as for organic growth and working capital. We identify and source new portfolio companies through multiple channels, including private equity sponsors, investment bankers, brokers, fund-less sponsors, institutional syndication partners, owner operators, and other club lenders (“club lenders” are organizations that facilitate peer-to-peer loans). We generally invest in some combination of senior debt, second lien debt, secured and unsecured subordinated debt and equity.
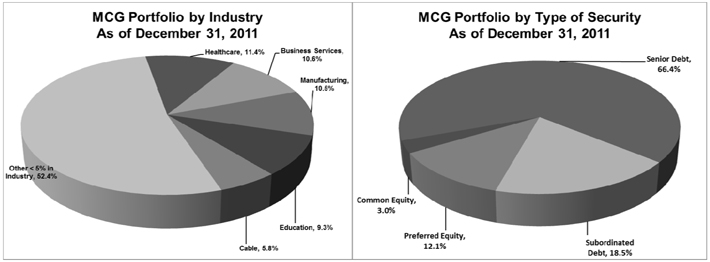
As of December 31, 2011, we had debt and equity investments in 60 portfolio companies with a combined fair value of over $741 million. As shown in the following chart, over 80% of the fair value of our portfolio as of December 31, 2011 was invested in senior and subordinated debt, while the remainder of our portfolio was invested in preferred and common equity securities. Our diversified investment portfolio spans 29 industries. Approximately 53% of our portfolio is composed of investments in industries that comprise less than 5% of the fair value of our portfolio. See Portfolio Composition and Investment Activity in our Management’s Discussion and Analysis of Financial Condition and Results of Operations for additional detail about our investment portfolio, including a detailed listing of the industries represented in our investment portfolio.
Most of the loans in our portfolio were originated directly with our portfolio companies; however, we have also participated in loan syndications or other transactions. Our debt instruments bear contractual interest rates ranging from 2.5% to 17.5%, a portion of which may be deferred. As of December 31, 2011, approximately 88.2% of the fair value of our loan portfolio had variable interest rates, based on a LIBOR benchmark or prime rate, and 11.8% of the fair value of our loan portfolio had fixed interest rates. As of December 31, 2011, approximately 79.2% of the fair value of our loan portfolio had LIBOR floors between 1.0% and 3.0% on a LIBOR-based index or prime floors between 1.75% and 6.0%. At origination, our loans generally have four- to eight-year stated maturities. Borrowers typically pay an origination fee based on a percent of the total commitment and a fee on undrawn commitments.
3
Table of Contents
From time to time, we make equity investments in companies in which we have also made debt investments. Our equity investments include preferred stock, common stock and warrants and, in many cases, include the right to board representation. We may invest across the capital structure of our portfolio companies using a combination of debt and equity investments to meet our portfolio companies’ needs and achieve favorable risk-adjusted returns.
The following table summarizes the fair value and revenue contributions of our ten largest investments. As of December 31, 2011, these ten investments comprised 40.8% of the fair value of our portfolio and contributed 34.7% of our total revenues during 2011.
| (dollars in thousands) |
As of December 31, 2011 | Year ended December 31, 2011 | ||||||||||||||||
| Company |
Industry | Fair Value | % of Portfolio |
Revenues | % of Total Revenues |
|||||||||||||
| Orbitel Holdings, LLC |
Cable | $ | 37,602 | 5.1 | % | $ | 2,870 | 3.4 | % | |||||||||
| GSDM Holdings, Corp. |
Healthcare | 34,653 | 4.7 | 4,062 | 4.7 | |||||||||||||
| RadioPharmacy Investors, LLC |
Healthcare | 34,457 | 4.6 | 5,264 | 6.1 | |||||||||||||
| NDSSI Holdings, LLC |
Electronics | 31,966 | 4.3 | 4,372 | 5.1 | |||||||||||||
| Stratford School Holdings, Inc. |
Education | 30,690 | 4.1 | 1,584 | 1.9 | |||||||||||||
| Capstone Logistics, LLC |
Logistics | 29,816 | 4.0 | 3,270 | 3.8 | |||||||||||||
| Coastal Sunbelt Holding, Inc. |
Food Services | 28,842 | 3.9 | 3,466 | 4.0 | |||||||||||||
| G&L Investment Holdings, LLC |
Insurance | 24,987 | 3.4 | 2,906 | 3.4 | |||||||||||||
| Education Management, Inc. |
Education | 24,963 | 3.4 | 1,492 | 1.8 | |||||||||||||
| Jenzabar, Inc. |
Technology | 24,690 | 3.3 | 413 | 0.5 | |||||||||||||
|
|
|
|
|
|
|
|
|
|||||||||||
| Total—ten largest investments |
302,666 | 40.8 | 29,699 | 34.7 | ||||||||||||||
| Other portfolio companies |
438,500 | 59.2 | 55,997 | 65.3 | ||||||||||||||
|
|
|
|
|
|
|
|
|
|||||||||||
| Total investment portfolio |
$ | 741,166 | 100.0 | % | $ | 85,696 | 100.0 | % | ||||||||||
|
|
|
|
|
|
|
|
|
|||||||||||
As of December 31, 2011, our control companies comprised 16.1% of the fair value of our portfolio and contributed 14.1% of our total revenues during 2011.
Competition
Our primary competitors in providing financing to middle-market companies include public and private funds, commercial and investment banks, commercial financing companies, and, to the extent they provide an alternative form of financing, private equity funds. Additionally, because competition for investment opportunities generally has increased among alternative investment vehicles, such as hedge funds, those entities have begun to invest in areas they have not traditionally invested, including investments in middle-market companies. Some of our existing and potential competitors are substantially larger and have considerably greater financial, technical and marketing resources than we do. For example, some competitors may have a lower cost of funds and access to funding sources that are not available to us. In addition, some of our competitors may have higher risk tolerances or different risk assessments, which could allow them to consider a wider variety of investments and establish more relationships and build their market shares.
We do not seek to compete primarily based on the interest rates we offer, and we believe that some of our competitors make loans with interest rates that are comparable to, or lower than, the rates we offer. We generally compete by using our knowledge of our portfolio companies’ business needs, derived from the research, analyses, and interaction by our professional staff with our portfolio companies, to offer the appropriate product-mix coupled with a range of corporate finance services and information that enhances our portfolio companies’ business prospects.
Life Cycle of Debt and Equity Originations
The key aspects of our portfolio origination, servicing and monitoring process are set forth below.
INVESTMENT OBJECTIVE AND STRATEGIES
Our investment objective is to achieve current income and capital gains. The primary goal of our investment process is to increase our earnings and net asset value, or NAV, by investing in debt and equity securities of middle-market companies. We earn interest, dividends and fees on our investments, and we may report unrealized appreciation and depreciation as the fair value of our investments increases or decreases. We realize capital gains or losses when the investment is eventually monetized.
4
Table of Contents
When we originate debt and equity investments, we strive to achieve favorable risk-adjusted rates of return in the form of current income and capital gains, while maintaining credit and investment quality in our portfolio. Before making investments, we apply well established credit processes to assess investment risk and we structure and price our investments accordingly. We have developed proprietary analytics, data and knowledge to support our business activities. We designed our investment process to achieve the following strategic objectives:
| • | generate favorable risk-adjusted rates of return by delivering capital and strategic insight to increase our portfolio companies’ enterprise value; |
| • | maintain sound credit and investment discipline and pricing practices, regardless of market conditions, to avoid adverse investment selection; and |
| • | manage risk by utilizing an integrated team approach to business development, underwriting and investment servicing. |
We maintain a flexible approach to funding that permits us to adjust price, maturity and other transaction terms to accommodate the needs of our portfolio companies.
ORGANIZATION OF MCG’S INVESTMENT PROFESSIONALS
Our organization includes experienced professionals with the ability to originate, underwrite, finance, syndicate, monitor and exit investments that generate attractive returns. The following bullets describe the key functional teams that are responsible for our investment processes:
| • | Deal Teams—Our deal teams are responsible for identifying and performing a financial and risk analysis of potential investment opportunities. After an investment is approved and funded, the deal teams have continuing ongoing responsibility for monitoring the performance of their respective investments. Under the general direction of our President and Chief Operating Officer, our deal teams are led by one of our Managing Directors or Deal Sponsors and also include one or more financial analysts and a member of our in-house legal staff. |
| • | Credit Committee—The prospective investment is presented to MCG’s credit committee for review and approval. The credit committee includes our Chief Executive Officer, our President and Chief Operating Officer, and all of our Managing Directors. |
| • | Investment and Valuation Committee of the Board of Directors—The investment and valuation committee is responsible for reviewing all investments over $20.0 million and it has the discretion to review and approve other investments. Subsequent to the review and funding of an investment, the investment and valuation committee makes recommendations that are used by our board of directors for its quarterly determination of the fair value of our investment portfolio. |
The following sections provide additional information on how these teams support the investment process. In addition to the teams described above, we also have an infrastructure of professionals that provide accounting, finance, human resources, investor relations, legal, and other services that support our investment professionals and provide other corporate, compliance and governance functions.
BUSINESS DEVELOPMENT
MCG and its predecessors have been active investors in middle-market companies since 1990. We believe our experience in middle-market investing is a meaningful competitive advantage that we use to operate our business.
Our deal teams identify and source new investments through multiple channels, including private equity sponsors, investment bankers, brokers, fund-less sponsors, institutional syndication partners, other club lenders and owner-operators. The deal teams also market to prospective portfolio companies identified through various data services, customized Internet searches and relationships with investment bankers, accountants, lawyers and other professionals.
Once we identify a prospective portfolio company, we review the company’s financial reports, business plan, corporate activities and other relevant information that we gather from third-party databases, industry reports and publications. We focus on a company’s fundamental performance against industry conditions and operational benchmarks. We work with our current and prospective portfolio companies to understand their business, as well
5
Table of Contents
as the costs and benefits of their corporate development initiatives, opportunities, competition and acceptable risks and returns. This analysis allows us to support our portfolio companies’ corporate development decisions, even in some cases where short-term financial ratios or other metrics may decline temporarily.
RISK ANALYSIS
After we identify a prospective investment, we review the company’s history, organization and product lines. In addition, we analyze the prospective portfolio company’s industry, competition and market share, obsolescence and substitution risk, markets served, legal and regulatory environment and technology. In particular, we analyze:
| • | Industry Risks—maturity, cyclicality and seasonality associated with the industries in which we invest, as well as the proportion of our portfolio that is invested in specific industries and individual portfolio companies; |
| • | Competitive Risks—strengths and weaknesses of prospective portfolio companies relative to their competitors’ pricing, product quality, customer loyalty, substitution and switching costs, brand positioning and capitalization. We also assess the defensibility of a prospect’s market position and its opportunity for increasing market share; |
| • | Management Risks—track records, industry experience, the prospective portfolio companies’ respective business plans and management incentives; |
| • | Regulatory Risks—new and evolving regulations applicable to the BDC industry and industries in which the prospective portfolio companies operate; |
| • | Customer Concentration and Market Risks—sustainability, stability and opportunities for the growth of the prospective portfolio companies’ customer bases, including the number and size of its customers, attrition rates and dependence on one or a limited number of customers; and |
| • | Technology Risks—impact of technological advances in the industries and portfolio companies in which we may invest. |
We also assess other attributes that may have a significant impact on the risk of a potential transaction. Quantitative attributes that we evaluate include industry-specific comparisons, such as cash flow margins, product and cash flow diversification, revenue growth rates, cost structure and other operating benchmarks that are derived from historical and projected financial statements. Qualitative attributes we evaluate may include management skill and depth, industry risk, substitution risk, sensitivity to economic cycles, cyclicality, geographic diversification, facilities infrastructure, administration requirements and product quality and ranking.
To assess the risk of a potential investment and to quantify the underlying value of the prospective portfolio company, we employ a series of valuation techniques. We primarily derive enterprise valuations through analyses of comparative public and private market transactions and other data. We also look to comparable public companies to benchmark the value of the enterprise using public market data. We generally base enterprise value on current and projected market conditions. Using these methods provides us with multiple views of the value of the enterprise and allows us to calculate certain metrics that we use in both risk assessment and product pricing, such as loan-to-value ratios for our debt investments.
UNDERWRITING AND RISK MANAGEMENT
Our underwriting process, which focuses on investment risk analysis, is initiated during the business development process. Our underwriting process includes standard due diligence on a prospective portfolio company’s financial performance, as well as customized analyses of a prospective portfolio company’s operations, systems, accounting policies, human resources and competitive, legal and regulatory environments.
In addition to gaining an in-depth understanding of prospective portfolio companies, our research and due diligence process evaluates industry-wide operational, strategic and valuation issues. We also assess emerging trends and competitive threats to the portfolio company, as well as the industry in which it operates. The knowledge and insight we obtain through our research are valuable to our portfolio companies who may draw on our industry expertise to refine their strategic plans, identify acquisition opportunities and set appropriate financial and operational goals.
As part of our evaluation, the deal team prepares an investment memorandum for presentation to our credit committee. When the dollar amount of the proposed investment exceeds certain pre-defined thresholds, or includes a significant investment in equity, the investment memorandum is also submitted to our investment and valuation committee of our board of directors for review and approval. The investment memorandum generally consists of:
| • | a business description; |
6
Table of Contents
| • | historical financial analyses, projections and scenario modeling; |
| • | a risk evaluation specific to the prospective portfolio company’s business and industry, considering the anticipated use of proceeds of our investment; |
| • | an enterprise valuation to assess the underlying value of the prospective portfolio company, both as an ongoing operation and its value relative to comparable public and private companies; |
| • | a description of the capital structure and the investment risk and return characteristics; and |
| • | reviews by third-party experts. |
INVESTMENT STRUCTURE
We evaluate our portfolio companies’ needs and utilize our product mix to structure investments that meet their capital requirements and business plans and protect our capital, with an expectation toward generating risk-adjusted returns through current income on our loans and equity investments and capital gains on our equity investments. We structure our debt investments to mitigate risk by requiring appropriate financial and collateral coverage thresholds. When structuring our debt investments, we evaluate key components, including payment priority, collateral or asset value, and financial support from guarantors and other credit enhancements. Since our investments typically include loans and our loans are typically cash-flow loans, rather than asset-backed loans, we factor the enterprise value of the prospective portfolio company’s assets into our credit decisions. For the majority of our loans, we receive a security interest in our portfolio companies’ tangible and intangible assets, which entitles us to a preferred position on payments in the event of liquidation. In addition, our loan covenants generally include affirmative covenants that require the portfolio company to provide periodic financial information, notification of material events and compliance with laws, as well as restrictive covenants that prevent the portfolio company from taking a range of significant actions, such as incurring additional indebtedness or making acquisitions without our consent. We also generally include covenants requiring the portfolio company to maintain or achieve specified financial ratios, such as cash flow leverage, interest charge coverage, total charge coverage, and, in certain cases, covenants requiring the portfolio company to maintain certain operational benchmarks.
We generally invest in some combination of the following securities:
| • | Senior Debt—We provide cash flow based senior debt in the form of amortizing term loans, bullet maturity term loans, and revolving credit facilities. Senior debt ranks senior in priority of payment to other debt and equity, and benefits from a first priority collateral interest in the assets of the borrower. As such, most other creditors rank junior to our investments in these securities in the event of insolvency. Due to its lower risk profile and often more restrictive covenants as compared to other debt, senior secured debt generally earns a lower return. |
| • | Second-Lien Debt—We provide second-lien term loans on a sole-source or participant basis where assets or enterprise-value based borrowing capacity is not readily available within typical senior debt leverage constraints. Second-lien debt ranks senior in priority of payment to subordinated debt and equity but subordinated to senior debt. Second-lien debt benefits from a collateral interest in the assets of the borrower subordinated to senior debt in a liquidation. As such, senior creditors rank senior to second-lien creditors in the event of insolvency with respect to pursuing remedies against the collateral of the portfolio company. Due to its higher risk profile and often less restrictive covenants as compared to senior debt, second-lien debt generally earns a higher return than senior debt. |
| • | Secured and Unsecured Subordinated Debt—We invest in secured and unsecured subordinated debt, which may be structured with a combination of current interest, deferred interest or equity-linked components. Subordinated debt ranks subordinate in priority of payment to senior and second lien debt. Our subordinated debt may not have a collateral interest in the borrower or may have a collateral interest subordinated to the senior and second lien debt. As such, senior and second lien creditors rank senior to us in the event of insolvency. Due to its higher risk profile and often less restrictive covenants as compared to other loans, subordinated debt generally earns a higher return than other debt. |
7
Table of Contents
| • | Equity—We may from time-to-time invest in minority equity positions with private equity partners or on our own. In the past we have invested in control equity positions, including $46.3 million (fair value) of control equity positions that remained in our portfolio as of December 31, 2011. In addition, we may receive warrants to purchase preferred or common stock of a portfolio company related to our debt investments in such portfolio company. |
To protect our investments and maximize our returns, we negotiate the structure of each debt and equity security in our investment portfolio. Our contracts with those portfolio companies generally include many terms governing interest rate, repayment terms, prepayment penalties, financial covenants, operating covenants, ownership and corporate governance parameters, dilution parameters, liquidation preferences, voting rights, and put or call rights. In some cases, our loan agreements also allow for increases in the spread to the base index rate, if the portfolio company’s financial or operational performance deteriorates or shows negative variances from its business plan and, in some cases, allow for decreases in the spread if financial or operational performance improves or exceeds the portfolio company’s plan.
We use the following core products to execute our strategy:
| • | Unitranche—We provide unitranche debt that blends characteristics of both senior and subordinated financing, generally in a first-lien position. |
| • | One-Stop Solution—Our “one-stop” solution enables our portfolio companies to satisfy multiple financing needs from a single capital provider with an efficient diligence, structuring, negotiating and closing process. In a typical “one-stop” transaction, we provide a combination of senior and subordinated debt to the portfolio company and, in certain cases, also acquire an equity interest in the portfolio company. The overall transaction size and product mix are based upon our portfolio company’s needs. In some cases our “one-stop” solution results in a product mix that meets our portfolio company’s needs, but which, we believe, does not optimize the use of our capital. In those cases, we may sell portions of some of the securities to achieve a more optimal mix. |
| • | Institutional Subordinated Debt—We provide institutional subordinated debt in the form of junior, yielding capital, as a sole or club investor in the larger end of our target market. Typically, these loans are payable in full at maturity and generally provide attractive yields. Our institutional subordinated debt portfolio companies generally are larger businesses supported by institutional equity capital that reduces the risk profile of these investments. |
| • | Control Investments—Historically, we have made control investments for which we have taken a majority ownership position and, in most cases, control the board of directors of a portfolio company. We did not make any control investments in new portfolio companies during 2011 and we do not expect to make control investments in new portfolio companies for the foreseeable future. |
| • | Other Investments and Services—To help balance our portfolio, we also make other investments, such as investments in broadly syndicated loans. In addition to capital, we also offer managerial assistance to our portfolio companies. Typically, this assistance involves strategic advice, evaluation of business plans, financial modeling assistance and industry research and insights. We believe that providing assistance to our portfolio companies enables us to maximize our value proposition for our portfolio companies, which, in turn, helps maximize our investment returns. |
INVESTMENT APPROVAL PROCESS
The credit process for each investment opportunity begins with our deal sponsors, who are responsible for originating transactions, as well as for investment performance, including credit risk, throughout the life cycle of an investment. Deal sponsors provide an initial credit screen based on our investment policies, described herein, and then bring the best opportunities to our credit committee in a “pipeline meeting.” For pipeline meetings, the deal sponsor prepares a report that summarizes the transaction and includes financial statements, credit ratios and pricing, background information on the principals, equity investors and industry dynamics. The credit committee determines whether the investment should be pursued, giving consideration to the risk return profile, industry concentrations and general economic outlook for the sector in which the business operates. In these meetings the credit committee also offers the deal sponsor insight into key issues that must be resolved before a potential investment is funded.
Objectives are determined and due diligence is conducted. On-site due diligence, including general ledger reviews, proofs of cash, material contract reviews, background checks, reviews of customer and vendor concentrations, and confirmation of historical results are performed by our personnel and, in certain situations, by third-party service providers. We believe in using our own in-house expertise when applying our consistent standards for due diligence.
8
Table of Contents
All of our investments are approved by our credit committee. In addition, investments of over $20 million must also be approved by the investment and valuation committee of our board of directors, of which a super majority of the members are independent directors.
INVESTMENT FUNDING
We fund our investments using cash that we receive in exchange for a combination of debt and equity instruments that we issue from time to time. Throughout 2011, our debt obligations included secured obligations that included provisions that restricted the types of investments that could be used as collateral in the facility. In 2011, our debt obligations also included unsecured obligations that we subsequently repaid in full in January 2012. See the Liquidity and Capital Resources—Borrowings section of our Management’s Discussion and Analysis of Financial Condition and Results of Operations for additional information about these secured and unsecured debt obligations. As a BDC, we are not permitted to incur indebtedness unless immediately after such borrowing we meet a coverage ratio of total assets to total senior securities, which include all of our borrowings (excluding borrowings made by our SBIC) and any preferred stock we may issue in the future, of at least 200%.
INVESTMENT MONITORING AND RESTRUCTURING
We monitor the status and financial performance of each company in our portfolio in order to evaluate overall portfolio quality. We are proactive with companies that are underperforming and, in many instances, have added better covenant protection and rights over time.
When our attempts to collect past due principal and/or interest on a loan are unsuccessful, we will perform an analysis to determine the appropriate course of action. In some cases, we may consider restructuring the investment to better reflect the current financial performance of the portfolio company. Such a restructuring may, among other things, involve deferring principal and interest payments, adjusting interest rates or warrant positions, imposing additional fees, amending financial or operating covenants or converting debt to equity. In connection with a restructuring, we generally receive compensation from the portfolio company for any increased risk. During the process of monitoring a loan in default, we will send a notice of non-compliance outlining the specific defaults that have occurred and preserving our contractual remedies, and initiate a review of the collateral, if any. When a restructuring is not the most appropriate course of action, we generally pursue remedies available to us that minimize potential losses, including initiating foreclosure and/or liquidation proceedings.
When one of our loans becomes more than 90 days past due, or if we otherwise do not expect the portfolio company to be able to service its debt and other obligations, we will, as a general matter, place the loan on non-accrual status and generally will cease recognizing interest income on that loan until all principal and interest has been brought current through payment or due to a restructuring such that the interest income is deemed to be collectible. However, we may make exceptions to this policy if the loan has sufficient collateral value and is in the process of collection. If the fair value of a loan is below cost, we may cease recognizing paid-in-kind interest and/or the accretion of a discount on the debt investment until such time that the fair value equals or exceeds cost.
INVESTMENT POLICIES
Our investment policies provide that we will not:
| • | act as an underwriter of securities of other issuers, except to the extent that we may be deemed an “underwriter” of securities (i) purchased by us that must be registered under the Securities Act of 1933, as amended, before they may be offered or sold to the public, or (ii) in connection with offerings of securities by our portfolio companies; |
| • | sell securities short in an uncovered position; |
| • | write or buy uncovered put or call options, except to the extent of options, warrants or conversion privileges in connection with our loans or other investments, and rights to require the issuers of such investments or their affiliates to repurchase them under certain circumstances; |
| • | engage in the purchase or sale of commodities or commodity contracts, including futures contracts, except for the purpose of hedging in the ordinary course of business or where necessary in working out distressed loan or investment situations; or |
9
Table of Contents
| • | acquire more than 3% of the voting stock of, or invest more than 5% of our total assets in any securities issued by, any other investment company, except if we acquire them as part of a merger, consolidation or acquisition of assets or if they result from a sale of a portfolio company, or otherwise as permitted under the 1940 Act. |
All of the above policies and the investment and lending guidelines set by our board of directors or any committees, including our investment objective to achieve current income and capital gains, are not “fundamental” as defined under the 1940 Act. Therefore, our board may change them without notice to, or approval by, our stockholders. However, any change may require the consent of our lenders.
Other than the restrictions pertaining to the issuance of senior securities under the 1940 Act, the percentage restrictions on investments generally apply on the effective date of the transaction. A subsequent change in a percentage resulting from market fluctuations or any cause other than an action by us will not require us to dispose of portfolio securities or to take other action to satisfy the percentage restriction.
We intend to conduct our business so as to retain our status as a BDC. To retain our status as a BDC, we may not acquire any assets, other than non-investment assets necessary and appropriate to our operations as a BDC, if after giving effect to such acquisition the value of our “qualifying assets” is less than 70% of the value of our total assets.
Investment Adviser
We have no investment adviser and are internally managed by our executive officers under the supervision of the board of directors. Our investment decisions are made by our officers, directors and senior investment professionals who serve on our credit and investment and valuation committees. None of our executive officers or other employees has the unilateral authority to approve any investment.
Regulation
INVESTMENT COMPANY ACT OF 1940
As a BDC, we are regulated under the 1940 Act. The BDC structure provides stockholders the ability to retain the liquidity of a publicly traded stock, while sharing in the possible benefits, if any, of investing in primarily privately owned companies.
In part, the 1940 Act requires us to be organized in the United States for the purpose of investing in, or lending to, primarily private companies and making managerial assistance available to them. As a BDC we may use capital provided by public stockholders and from other sources to invest in long-term, private investments in businesses.
We may not, however, change the nature of our business so as to cease to be, or withdraw our election as, a BDC unless authorized by vote of a majority of our outstanding voting securities. The 1940 Act defines a majority of the outstanding voting securities as the lesser of:
| i) | 67% or more of such company’s shares present at a meeting if more than 50% of the outstanding shares of such company are present or represented by proxy; or |
| ii) | more than 50% of the outstanding shares of such company. |
We currently do not anticipate any substantial change in the nature of our business.
Qualifying Assets
A BDC must have been organized and have its principal place of business in the United States and must be operated for the purpose of making investments in the types of securities described in (1), (2) or (3) below. Thus, under the 1940 Act, we may not acquire any asset other than assets of the type listed in Section 55(a) of the 1940 Act, which are referred to as qualifying assets, unless, at the time the acquisition is made, qualifying assets represent at least 70% of the company’s total assets. The principal categories of qualifying assets relevant to our business are the following:
| 1) | Securities purchased in transactions not involving any public offering from the issuer of such securities, which issuer (subject to certain limited exceptions): |
| a) | is an eligible portfolio company, or from any person who is, or has been during the preceding 13 months, an affiliated person of an eligible portfolio company, or from any other person, subject to such rules as may be prescribed by the SEC. An eligible portfolio company is defined in the 1940 Act as any issuer that: |
| i) | is organized under the laws of, and has its principal place of business in, the United States; |
10
Table of Contents
| ii) | is not an investment company (other than a small business investment company wholly owned by us) or a company that would be an investment company but for certain exclusions under the 1940 Act; and |
| iii) | does not have any class of securities listed on a national securities exchange; |
| b) | is a company that meets the requirements of (a)(i) and (ii) above, but is not an eligible portfolio company because it has issued a class of securities on a national securities exchange, if: |
| i) | at the time of the purchase, we own at least 50% of the (x) greatest number of equity securities of such issuer and securities convertible into or exchangeable for such securities; and (y) the greatest amount of debt securities of such issuer, held by us at any point in time during the period when such issuer was an eligible portfolio company; and |
| ii) | we are one of the 20 largest holders of record of such issuer’s outstanding voting securities; or |
| c) | is a company that meets the requirements of (a)(i) and (ii) above, but is not an eligible portfolio company because it has issued a class of securities on a national securities exchange, if the aggregate market value of such company’s outstanding voting and non-voting common equity is less than $250.0 million. |
| 2) | Securities of any eligible portfolio company that we control. |
| 3) | Securities purchased in a private transaction from a U.S. issuer that is not an investment company or from an affiliated person of the issuer, or in transactions incident thereto, if the issuer is in bankruptcy and subject to reorganization or if the issuer, immediately prior to the purchase of its securities was unable to meet its obligations as they came due without material assistance other than conventional lending or financing arrangements. |
| 4) | Securities of an eligible portfolio company purchased from any person in a private transaction if there is no ready market for such securities and we already own 60% of the outstanding equity of the eligible portfolio company. |
| 5) | Securities received in exchange for or distributed on or with respect to securities described in (1) through (4) above, or pursuant to the exercise of warrants or rights relating to such securities. |
| 6) | Cash, cash items, U.S. Government securities or high-quality debt securities maturing in one year or less from the time of investment. |
Control, as defined by the 1940 Act, is presumed to exist where a BDC beneficially owns more than 25% of the outstanding voting securities of the portfolio company. For the foreseeable future, we do not expect to add new control positions to our portfolio.
Significant Managerial Assistance
In order to count portfolio securities as qualifying assets for the purpose of the 70% test discussed above, we must either control the issuer of the securities or must offer to make available significant managerial assistance; except that, where we purchase such securities in conjunction with one or more other persons acting together, one of the other persons in the group may make available such managerial assistance. Making available significant managerial assistance means, among other things, any arrangement in which we offer to provide and, if accepted, provide significant guidance and counsel concerning the management, operations or business objectives and policies of a portfolio company through monitoring of portfolio company operations, selective participation in board and management meetings, consulting with and advising a portfolio company’s officers or other organizational or financial guidance.
Warrants and Options
Under the 1940 Act, we are subject to restrictions on the amount of warrants, options, restricted stock or rights to purchase shares of capital stock that we may have outstanding at any time. In particular, the amount of capital stock that would result from the conversion or exercise of all outstanding warrants, options or rights to purchase capital stock cannot exceed 25% of our total outstanding shares of capital stock. This amount is reduced to 20%
11
Table of Contents
of our total outstanding shares of capital stock if the amount of warrants, options or rights issued pursuant to an executive compensation plan would exceed 15% of our total outstanding shares of capital stock. We have received exemptive relief from the SEC permitting us to issue restricted stock to our employees and directors subject to the above conditions, among others.
Indebtedness and Senior Securities
We will be permitted, under specified conditions, to issue multiple classes of indebtedness and one class of stock senior to our common stock if our asset coverage, as defined in the 1940 Act, is at least equal to 200% immediately after each such issuance. In addition, we may not be permitted to declare any cash dividend or other distribution on our outstanding common shares, or purchase any such shares, unless, at the time of such declaration or purchase, we have asset coverage of at least 200% after deducting the amount of such dividend, distribution, or purchase price. We may also borrow amounts up to 5% of the value of our total assets for temporary or emergency purposes.
Capital Structure
As a BDC, we generally cannot issue and sell our common stock at a price below the current NAV per share. We may, however, sell our common stock, or warrants, options or rights to acquire our common stock, at a price below the current NAV of our common stock in a rights offering to our stockholders if: 1) our board of directors determines that such sale is in the best interests of the Company and our stockholders; 2) our stockholders approve the sale of our common stock at a price that is less than the current NAV; and 3) the price at which our common stock is to be issued and sold may not be less than a price which, in the determination of our board of directors, closely approximates the market value of such securities (less any sales load).
We may also be prohibited under the 1940 Act from participating in certain transactions with our affiliates without the prior approval of our directors who are not interested persons and, in some cases, prior approval by the SEC.
We do not intend to acquire securities issued by any investment company that exceed the limits imposed by the 1940 Act. Under these limits, we generally cannot acquire more than 3% of the voting stock of any registered investment company (as defined in the 1940 Act), invest more than 5% of the value of our total assets in the securities of one such investment company or invest more than 10% of the value of our total assets in the securities of such investment companies in the aggregate.
1940 Act Code of Ethics
We have adopted and will maintain a code of ethics that establishes procedures for personal investments and restricts certain personal securities transactions. Personnel subject to the code may invest in securities for their personal investment accounts, including securities that may be purchased or held by us, so long as such investments are made in accordance with the code’s requirements. Our Amended and Restated Code of Ethics, or 1940 Act Code of Ethics, will generally not permit investments by our employees in securities that may be purchased or held by us. We may be prohibited under the 1940 Act from conducting certain transactions with our affiliates without the prior approval of our directors who are not interested persons and, in some cases, the prior approval of the SEC.
A copy of our 1940 Act Code of Ethics is available at our website at www.mcgcapital.com. We are not including the information contained on our website as a part of, or incorporating it by reference into, this Form 10-K. In addition, you may read and copy the 1940 Act Code of Ethics at the SEC’s Public Reference Room in Washington, D.C. You may obtain information on the operation of the Public Reference Room by calling the SEC at (202) 551-8090. In addition, the 1940 Act Code of Ethics attached as an exhibit to our registration statement and is available on the EDGAR Database on the SEC’s Internet site at http://www.sec.gov. You may also obtain copies of the 1940 Act Code of Ethics, after paying a duplicating fee, by electronic request at the following e-mail address: publicinfo@sec.gov, or by writing the SEC’s Public Reference Section, 100 F Street, N.E., Washington, D.C. 20549.
PRIVACY PRINCIPLES
We are committed to maintaining the privacy of our stockholders and safeguarding their non-public personal information. The following information is provided to help you understand what personal information we collect, how we protect that information and why, in certain cases, we may share information with select other parties.
Generally, we do not receive any non-public personal information relating to our stockholders, although certain non-public personal information of our stockholders may become available to us. We do not disclose any non-public personal information about our stockholders or former stockholders, except as permitted by law or as is necessary in order to service stockholder accounts (for example, to a transfer agent).
12
Table of Contents
We restrict access to non-public personal information about our stockholders to our employees with a legitimate business need for the information. We maintain physical, electronic and procedural safeguards designed to protect the non-public personal information of our stockholders.
PROXY VOTING POLICIES AND PROCEDURES
We vote proxies relating to our portfolio securities in the best interest of our stockholders. We review on a case-by-case basis each proposal submitted to a stockholder vote to determine its impact on the portfolio securities held by us. Although we generally vote against proposals that may have a negative impact on our portfolio securities, we may vote for such a proposal if there are compelling long-term reasons to do so.
Our proxy voting decisions are discussed with our committee that is responsible for monitoring each of our investments. To ensure that our vote is not the product of a conflict of interest, we require that: (i) anyone involved in the decision-making process disclose to our General Counsel and Chief Compliance Officer any potential conflict that he or she is aware of and any contact that he or she has had with any interested party regarding a proxy vote; and (ii) employees involved in the decision-making process or vote administration are prohibited from revealing how we intend to vote on a proposal in order to reduce any attempted influence from interested parties.
EXEMPTIVE RELIEF
We have received an exemptive order of the SEC to permit us to issue restricted shares of our common stock as part of the compensation packages for certain of our employees and directors. We believe that the particular characteristics of our business, the dependence we have on key personnel to conduct our business effectively and the highly competitive environment in which we operate require the use of equity-based compensation for our personnel in the form of restricted stock. The issuance of restricted shares of our common stock requires the approval of our stockholders. In June 2006, our stockholders approved our Amended and Restated 2006 Employee Restricted Stock Plan and our Amended and Restated 2006 Non-Employee Director Restricted Stock Plan.
In October 2008, we received exemptive relief from the SEC, which effectively allows us to exclude debt issued by Solutions Capital from the calculation of our consolidated BDC asset coverage ratio.
OTHER
We will be examined periodically by the SEC for compliance with the Exchange Act and the 1940 Act.
As with other companies regulated by the 1940 Act, we must adhere to certain substantive regulatory requirements. A majority of our directors must be persons who are not interested persons, as that term is defined in the 1940 Act. We must provide and maintain a bond issued by a reputable fidelity insurance company to protect us against larceny and embezzlement. Furthermore, as a BDC, we cannot protect any director or officer against any liability to our stockholders arising from willful misfeasance, bad faith, gross negligence or reckless disregard of the duties involved in the conduct of such person’s office.
We are required to adopt and implement written policies and procedures reasonably designed to prevent violation of the federal securities laws, and to review these policies and procedures annually for their adequacy and the effectiveness of their implementation. Mr. Tod Reichert, our General Counsel and Chief Compliance Officer, is responsible for administering these policies and procedures.
COMPLIANCE WITH THE SARBANES-OXLEY ACT OF 2002 AND THE NASDAQ GLOBAL SELECT MARKET CORPORATE GOVERNANCE REGULATIONS
The Sarbanes-Oxley Act of 2002, or Sarbanes-Oxley Act, imposes a wide variety of regulatory requirements on publicly held companies and their insiders. The Sarbanes-Oxley Act requires us to review our policies and procedures to determine whether we comply with the Sarbanes-Oxley Act and the regulations promulgated thereunder.
The NASDAQ Global Select Market has also adopted various corporate governance requirements as part of its listing standards. We believe we are in compliance with such corporate governance listing standards.
13
Table of Contents
SMALL BUSINESS ADMINISTRATION REGULATIONS
In December 2004, we formed Solutions Capital and Solutions Capital G.P., LLC. In September 2007, Solutions Capital received final approval to be licensed as an SBIC. Solutions Capital has borrowed funds from the SBA against eligible investments and additional deposits to regulatory capital. As of January 2012, we had borrowed $150.0 million of SBA-guaranteed debentures under the SBIC program. SBA-guaranteed debentures are non-recourse, interest-only debentures with interest payable semi-annually and a ten-year maturity. The principal amount of SBA-guaranteed debentures is not required to be paid prior to maturity, but may be prepaid at any time without penalty.
The maximum amount of outstanding leverage available to single-license SBIC companies is $150.0 million. The limit may be increased to $225.0 million with the approval of a second SBIC license and the investment of additional regulatory capital. To access the $150.0 million, we have funded a total of $75.0 million to Solutions Capital.
SBICs are designed to stimulate the flow of private capital to eligible small businesses. Under SBA regulations, Solutions Capital is subject to regulatory requirements including making investments in SBA eligible businesses, investing at least 25% of regulatory capital in eligible “smaller” businesses, placing certain limitations on the financing terms of investments, prohibiting investing in certain industries, required capitalization thresholds, and is subject to periodic audits and examinations among other regulations. If Solutions Capital fails to comply with applicable SBA regulations, the SBA could, depending on the severity of the violation, limit or prohibit its use of debentures, declare outstanding debentures immediately due and payable, and/or limit Solutions Capital from making new investments. In addition, the SBA can revoke or suspend a license for willful or repeated violation of, or willful or repeated failure to observe, any provision of the SBIC Act or any rule or regulation promulgated thereunder. These actions by the SBA would, in turn, negatively affect us because Solutions Capital is our wholly owned subsidiary.
Eligible Small and Smaller Businesses
Under present SBA regulations, eligible small businesses include businesses that have a tangible net worth not exceeding $18 million and have average annual net income not exceeding $6 million for the two most recent fiscal years. In addition, an SBIC must devote 25% of its investment activity to “smaller” concerns as defined by the SBA. A smaller concern is one that has a tangible net worth not exceeding $6 million and has average annual net income not exceeding $2 million for the two most recent fiscal years. SBA regulations also provide alternative size standard criteria to determine eligibility, which depend on the industry in which the business is engaged and are based on such factors as the number of employees or gross sales. According to SBA regulations, SBICs may make long-term loans to small businesses and invest in the equity securities of such businesses. Once an SBIC has invested in a company, it may continue to make follow-on investments in the company, regardless of the size of the business, up and until the time a business offers its securities in a public market. Through Solutions Capital, we plan to continue to provide long-term loans to, and non-control equity investments in, qualifying small businesses.
Financing Limitations
SBA regulations also include restrictions on a “change of control” of an SBIC or transfers that would result in any person or group owning 10% or more of a class of capital stock (or its equivalent in the case of a partnership) of a licensed SBIC and require that SBICs invest idle funds in accordance with SBA regulations. In addition, our SBIC subsidiary may also be limited in its ability to make distributions to us if it does not have sufficient earnings and capital, in accordance with SBA regulations. The SBA places certain limits on the financing terms of investments by SBICs in portfolio companies such as limiting the interest rate on debt securities and loans provided to portfolio companies of the SBIC. The SBA also limits fees, prepayment terms and certain other economic arrangements that are sometimes charged in lending environments.
SBA Leverage or Debentures
SBA-guaranteed debentures are non-recourse to us, have a ten-year maturity and may be prepaid at any time without penalty. The interest rate of SBA-guaranteed debentures is fixed at the time of issuance at a market-based spread over ten-year U.S. Treasury Notes. Leverage through SBA guaranteed debentures is subject to required capitalization thresholds. Current SBA regulations limit the amount that Solutions Capital may borrow to a maximum of $150 million, which is up to twice its regulatory capital.
14
Table of Contents
Our SBIC subsidiary is subject to regulation and oversight by the SBA. Receipt of an SBIC license does not assure that our SBIC subsidiary will receive SBA-guaranteed debenture funding, which is dependent upon our SBIC subsidiary continuing to be in compliance with SBA regulations and policies. Periodically, SBA staff audits Solutions Capital to verify its compliance with SBA regulations.
The SBA, as a creditor, will have a superior claim to our SBIC subsidiary’s assets over our stockholders in the event we liquidate our SBIC subsidiary or the SBA exercises its remedies under the SBA-guaranteed debentures issued by our SBIC subsidiary upon an event of default.
CERTAIN U.S. FEDERAL INCOME TAX CONSIDERATIONS
We elected to be treated as a RIC, under Subchapter M of the Internal Revenue Code, or the Code, with the filing of our federal corporate income tax return for 2002, for which the election was effective as of January 1, 2002. As a RIC, we generally do not have to pay corporate taxes on any income we distribute to our stockholders as dividends, which allows us to reduce or eliminate our corporate-level tax liability. To continue to qualify as a RIC, we must, among other things, meet certain source-of-income and asset diversification requirements (as defined below). In addition, to qualify for RIC tax treatment we must distribute to our stockholders, for each taxable year, at least 90% of our “investment company taxable income,” which is generally our ordinary income plus the excess of our realized net short-term capital gains over our realized net long-term capital losses, which we collectively refer to as the 90% Distribution Requirement.
TAXATION AS A REGULATED INVESTMENT COMPANY
If we:
| • | qualify as a RIC, and |
| • | distribute each year to stockholders at least 90% of our investment company taxable income (which is defined in the Internal Revenue Code generally as ordinary income plus realized net short-term capital gains in excess of realized net long-term capital losses), and 90% of any ordinary pre-RIC built-in gains we recognize between January 1, 2002 and December 31, 2011, less our taxes due on those gains, |
we will be entitled to deduct and, therefore, will not be subject to U.S. federal income tax on, the portion of our income we distribute or are deemed to distribute to stockholders (other than any built-in gain recognized between January 1, 2002 and December 31, 2011). We will be subject to U.S. federal income tax at the regular corporate rate on any income not distributed (or deemed distributed) to our stockholders. We will be subject to a 4% nondeductible U.S. federal excise tax, or 4% excise tax, to the extent we do not make specified levels of distributions (actually or on a deemed basis) in a timely manner. For calendar years ended December 31, 2010 and earlier, we would have been subject to the 4% excise tax to the extent that we did not distribute (on either an actual or deemed basis): 98% of our ordinary income for each calendar year; 98% of our capital gain net income for each calendar year; and any income realized, but not distributed, in prior calendar years. As a RIC, beginning in 2011, we are subject to the 4% excise tax to the extent that we do not distribute (on either an actual or deemed basis): 98% of our ordinary income for each calendar year; 98.2% of our capital gain net income for each calendar year; and any income realized, but not distributed, in prior calendar years.
To qualify as a RIC for federal income tax purposes, we must, among other things:
| • | continue to qualify as a BDC under the 1940 Act at all times during each taxable year; |
| • | derive in each taxable year at least 90% of our gross income from (1) dividends, interest, payments with respect to certain securities, loans, gains from the sale of stock or other securities, or other income derived with respect to our business of investing in such stock or securities and (2) net income derived from an interest in a “qualified publicly traded partnership;” and |
| • | diversify our holdings so that at the end of each quarter of the taxable year: |
| • | at least 50% of the value of our assets consist of cash, cash items, U.S. government securities, securities of other RICs, and other securities, if such other securities of any one issuer do not represent more than 5% of the value of our assets or more than 10% of the outstanding voting securities of the issuer; and |
| • | no more than 25% of the value of our assets is invested in the securities, other than U.S. government securities or securities of other RICs, of (i) one issuer, (ii) two or more issuers that are |
15
Table of Contents
| controlled, as determined under applicable Internal Revenue Code rules, by us and are engaged in the same or similar or related trades or businesses or (iii) one or more “qualified publicly traded partnerships,” known as the Diversification Tests. |
We may be required to recognize taxable income in circumstances in which we do not receive cash. For example, if we hold debt obligations that are treated under applicable tax rules as having original issue discount, we must include in taxable income each year a portion of the original issue discount that accrues over the life of the obligation, regardless of whether cash representing such income is received by us in the same taxable year. We also may have to include in taxable income other amounts that we have not yet received in cash, such as payment-in-kind interest and deferred loan origination fees that are paid after origination of the loan or are paid in non-cash compensation such as warrants or stock. Because any original issue discount or other amounts accrued will be included in our investment company taxable income for the year of accrual, we may be required to make a cash distribution to our stockholders in the amount of that non-cash income in order to satisfy the 90% Distribution Requirement, even though we will not have received any cash representing such income.
If we fail to satisfy the 90% Distribution Requirement or fail to qualify as a RIC in any taxable year, we would be subject to tax in that year on all of our taxable income at regular corporate rates, regardless of whether we make any distributions to our stockholders. Distributions would not be required, and any distributions made in taxable years beginning before January 1, 2013 would be taxable to our stockholders as ordinary dividend income that, subject to certain limitations, may be eligible for the 15% maximum rate to the extent of our current and accumulated earnings and profits. Subject to certain limitations under the Code, corporate distributees would be eligible for the dividends-received deduction. Distributions in excess of our current and accumulated earnings and profits would be treated first as a return of capital to the extent of the stockholder’s tax basis, and any remaining distributions would be treated as a capital gain.
EMPLOYEES
We believe our success will depend greatly on our ability to identify, attract and retain capable employees. As of December 31, 2011, we employed 36 full-time and one part-time individual, including investment, portfolio and operations professionals, in-house counsel and administrative staff. Virtually all of these employees are located in our corporate headquarters in Arlington, Virginia. Our employees are not represented by any collective bargaining unit and we believe our relations with our employees are good.
| ITEM 1A. | RISK FACTORS. |
Investing in our common stock may be speculative and involves a high degree of risk. You should consider carefully the risks described below and all other information contained in this Annual Report on Form 10-K, including our consolidated financial statements and the related notes and the schedules and exhibits to this Annual Report on Form 10-K. The risks set forth below are not the only risks we face. If any of the following risks occur, our business, financial condition and results of operations could be materially adversely affected. In such case, our net asset value and the trading price of our common stock could decline, and you may lose all or part of your investment.
Substantially all of our portfolio investments are not publicly traded and, as a result, there is uncertainty as to the value of our portfolio investments. If our determinations regarding the fair value of our investments were materially higher than the values that we ultimately realize upon the disposition of such investments, our NAV could be affected adversely.
In accordance with the 1940 Act and accounting principles generally accepted in the United States, we carry substantially all of our portfolio investments at fair value as determined in good faith by our board of directors. Typically, there is no public market for the securities of the privately held companies in which we have invested and generally will continue to invest. As a result, we value these securities quarterly at fair value as determined in good faith by our board of directors.
Whenever possible, we value securities at market value; however, only a small percentage of our investment portfolio is traded publicly. We value the investments that are not publicly traded based on various factors during our valuation process and our investment and valuation committee reviews and approves these valuations. The types of factors that may be considered in the determination of the fair value of these investments include public and private mergers and acquisitions transactions, comparisons to publicly traded comparable companies, third-
16
Table of Contents
party assessments of valuation, discounted cash flow analyses, the nature and realizable value of any collateral, the portfolio company’s earnings and its ability to make payments, the markets in which the portfolio company does business, market-based pricing and other relevant factors. In determining fair value in good faith, we generally obtain financial and other information from portfolio companies, which may include unaudited, projected or pro forma financial information. Our board of directors also uses several independent valuation firms to aid it in determining the fair value of these investments. Because our valuations, and particularly the valuations of private securities and private companies, are inherently uncertain, they may fluctuate over short periods of time and may be based on estimates. Our determinations of fair value may differ materially from the values that would have been used if a readily available market for these investments existed and from the amounts we may realize on any disposition of such investments. If our determinations regarding the fair value of our investments were materially higher than the values that we ultimately realize upon the disposition of such investments, our NAV could be affected adversely.
Economic downturns or lingering effects of a capital market disruption and recession could impair our portfolio companies’ financial positions and operating results, which, in turn, could harm our operating results.
Many of the companies in which we have made, or may make, investments are, and may continue to be, susceptible to economic downturns or recessions. During the recession that occurred from late 2007 through mid-2009, the stock market declined. In response, the U.S. government acted to restore liquidity and stability to business, taxpayers and the financial system, but there can be no assurance these regulatory programs, stimulus initiatives and tax reductions will have a long-term beneficial impact. In addition, renewed economic pressures resulting from, among other sources, the European credit crisis, the domestic housing market, the downgrade of the U.S. credit rating, austerity measures to reduce the U.S. government budget deficit, rising unemployment, the uncertain regulatory environment and unpredictable legislative actions from Congress could result in new or incremental tightening in the credit markets, low liquidity and extreme volatility in fixed-income, credit, currency and equity markets. To the extent that recessionary conditions recur or the economy remains stagnant, the financial results of middle-market companies, like those in which we invest, may experience deterioration, which ultimately could lead to difficulty in meeting debt service requirements and an increase in defaults.
Adverse economic conditions have decreased the value of some of our loans and equity investments and lingering after-effects of these economic conditions, may further decrease such value. These conditions have contributed to, and could continue to contribute to, additional losses of value in our portfolio and decreases in our revenues, net income and net assets. If prolonged, unfavorable or uncertain economic and market conditions could affect the ability of our portfolio companies to repay our loans or engage in a liquidity event, such as a sale, merger, recapitalization or initial public offering. Therefore, the number of non-performing assets may increase and the value of one or more of our portfolio companies may decrease during such periods. Adverse economic conditions also may decrease the value of collateral securing some of our loans and the value of our equity investments.
Economic recessions or downturns could impair the ability of our portfolio companies to refinance or repay loans, which, in turn, could increase our non-performing assets, decrease the value of our portfolio, reduce our volume of new loans and have an adverse effect on our operating results.
A portfolio company’s failure to satisfy financial or operating covenants imposed by us or other lenders could lead to defaults and, potentially, an acceleration of its loans and foreclosure on its secured assets, which could trigger cross-defaults under other agreements and jeopardize our portfolio company’s ability to meet its obligations under the debt securities that we hold. We may incur expenses to the extent necessary to seek recovery upon default or to negotiate new terms with a defaulting portfolio company.
If market constraints further prevent us from obtaining additional debt or equity capital, our liquidity could be affected adversely, our business prospects could be impacted negatively, we could lose key employees and our operating results could be affected negatively.
The economic recession in the United States resulted in a reduction in the availability of debt and equity capital for the market as a whole, and financial services firms in particular. The performance of our portfolio continues to constrain us, limiting or completely preventing access to markets for debt and equity capital needed to maintain operations, continue investment originations and to grow. On September 30, 2011, we withdrew our application for a second license from the SBA to operate an additional subsidiary (Solutions Capital II, L.P.) as an SBIC until such time as the SBA has an opportunity to evaluate, among other things, the organizational impact of our recent restructuring and changes in management. We will not be able to utilize SBA leverage beyond that available
17
Table of Contents
through Solutions Capital I unless we receive a second license from the SBA. In addition, the available debt capital may be at a higher cost and/or less favorable terms and conditions. Equity capital is, and may continue to be, difficult to raise because we generally are not able to issue and sell our common stock at a price below NAV per share without stockholder approval. The prolonged inability to raise additional debt capital could further constrain our liquidity, negatively impact our business prospects, cause the departure of key employees and have an adverse impact on our operating results.
There may be circumstances where our debt investments could be subordinated to claims of other creditors or we could be subject to lender liability claims.
Even though we have structured some of our investments as senior loans, if one of our portfolio companies were to go bankrupt, depending on the facts and circumstances, including the extent to which we provided managerial assistance to that portfolio company, a bankruptcy court might re-characterize our debt investments and subordinate all, or a portion, of our claims to those of other creditors. Holders of debt instruments ranking senior to our investments typically would be entitled to receive payment in full before we receive any distributions. After repaying such senior creditors, such portfolio company may not have any remaining assets to use to repay its obligation to us. We may also be subject to lender liability claims for actions taken by us with respect to a borrower’s business or in instances in which we exercised control over the borrower. It is possible that we could become subject to a lender’s liability claim, including claims associated with significant managerial assistance that we may have provided to our portfolio companies.
Investing in middle-market companies involves a high degree of risk and our financial results may be affected adversely if one or more of our significant portfolio investments defaults on its loans or fails to perform as we expect.
Our portfolio consists primarily of debt and equity investments in privately owned middle-market companies. Investing in middle-market companies involves a number of significant risks. Typically, the debt in which we invest may be rated below investment grade by one or more rating agency. Compared to larger publicly traded companies, these middle-market companies may be in a weaker financial position and experience wider variations in their operating results, which may make them more vulnerable to economic downturns. Typically, these companies need more capital to compete; however, their access to capital is limited and their cost of capital is often higher than that of their competitors. Our portfolio companies face intense competition from larger companies with greater financial, technical and marketing resources and their success typically depends on the managerial talents and efforts of an individual or a small group of persons. Therefore, the loss of any of its key employees could affect a portfolio company’s ability to compete effectively and harm its financial condition. Further, some of these companies conduct business in regulated industries that are susceptible to regulatory changes. These factors could impair the cash flow of our portfolio companies and result in other events, such as bankruptcy. These events could limit a portfolio company’s ability to repay its obligations to us, which may have an adverse effect on the return on, or the recovery of, our investment in these businesses. Deterioration in a borrower’s financial condition and prospects may be accompanied by deterioration in the value of the loan’s collateral.
Some of these companies cannot obtain financing from public capital markets or from traditional credit sources, such as commercial banks. Accordingly, loans made to these types of companies pose a higher default risk than loans made to companies that have access to traditional credit sources. Generally, little, if any, public information is available about such companies. Therefore, we must rely on our employees’ diligence to obtain information necessary to make well informed investment decisions. If we do not uncover material information about these companies, we may not make a fully informed investment decision, which could, in turn, cause us to lose money on our investments.
If we fail to invest a sufficient portion of our assets in qualifying assets, we could lose our BDC status.
As a BDC, we may not acquire any assets other than “qualifying assets” unless, at the time of and after giving effect to such acquisition, at least 70% of our total assets are qualifying assets. Thus, we may be precluded from investing in potentially attractive investments if such investments are not qualifying assets for purposes of the 1940 Act. If we fail to invest a sufficient portion of our assets in qualifying assets, we could lose our status as a BDC, which would have a material adverse effect on our business, financial condition and results of operations. In addition, there is a risk that this restriction could prevent us from making additional investments in our existing portfolio companies, which could cause our position to be diluted. We could also be forced to sell certain of our investments to comply with the 1940 Act, which may result in us receiving significantly less than the current value of such investments.
18
Table of Contents
Portfolio company litigation could result in additional costs, the diversion of management time and resources or have an adverse impact on the fair value of one or more of our portfolio companies.
In the course of providing significant managerial assistance to certain of our portfolio companies, we may serve as directors on the boards of such companies. To the extent that litigation arises out of our investments in these companies, we may be named as a defendant in such litigation, which could result in additional costs and the diversion of management time and resources. In addition, litigation involving our portfolio companies could have an adverse impact on the fair value of one or more of our portfolio companies.
Our financial position and results of operations could be affected adversely if a significant portion of our portfolio were invested in industries that experience adverse economic or business conditions.
From time to time, we target specific industries in which to invest on a recurring basis. This practice could concentrate a significant portion of our portfolio in a specific industry. If an industry in which we have significant investment or revenue concentrations suffers from adverse business or economic conditions, as these industries have to varying degrees, a material portion of our investment portfolio could be affected adversely, which, in turn, could adversely affect our financial position and results of operations.
Our financial results could be affected adversely if a significant portfolio investment fails to perform as expected or if the value of a portfolio company decreases.
Our total investment in companies may be significant, individually or in the aggregate. As a result, if a significant investment in one or more companies fails to perform as expected, our financial results could be affected adversely and the magnitude of the loss could be more significant than if we had made smaller investments in a greater number of companies.
Broadview is a publicly traded competitive local exchange carrier, or CLEC, serving primarily business customers. As of December 31, 2011, we held preferred stock in Broadview with a $10.9 million fair value. As of December 31, 2011, our investment in Broadview represented 1.5% of the fair value of our investment portfolio. During the year ended December 31, 2011, we recorded $92.1 million of unrealized depreciation related to our Broadview investment. In June 2011, Broadview terminated its previously announced tender offer for $301.4 million of its 113/8% Senior Secured Notes, which mature in September 2012, following Broadview’s review of market conditions. In addition, Broadview had $17.1 million of borrowings outstanding under its revolving credit facility which becomes payable on June 1, 2012. We reflected these liquidity events in the fair value of our investment as of December 31, 2011. The bond market continued to be challenging during the six months ended December 31, 2011 and Broadview’s Senior Secured Notes were downgraded in 2011. If Broadview is unable to refinance these debt facilities by their respective maturity dates, the value of our portfolio investment in Broadview could decline by up to the remaining fair value and we may be required to recognize additional unrealized depreciation on this investment. Also, if Broadview’s performance deteriorates or valuation multiples contract further in future periods, we may be required to recognize additional unrealized depreciation on this investment.
We operate in a highly competitive market for investment opportunities.
A number of entities compete with us to make the types of investments that we make. We compete with public and private funds, commercial and investment banks, commercial financing companies and, to the extent they provide an alternative form of financing, private equity funds. Additionally, because competition for investment opportunities generally has increased in recent years among alternative investment vehicles, such as hedge funds, those entities have begun to invest in areas in which traditionally they have not invested. As a result of these entrants, competition for investment opportunities has intensified in recent years and may intensify further in the future. Some of our existing and potential competitors are substantially larger and have considerably greater financial, technical and marketing resources than we do. For example, some competitors may have a lower cost of funds and access to funding sources that are not available to us. In addition, some of our competitors may have higher risk tolerances or different risk assessments, which could allow them to consider a wider variety of investments and establish more relationships than we can. Furthermore, many of our competitors are not subject to the regulatory restrictions and valuation requirements that the 1940 Act imposes on us as a BDC. We cannot assure you that the competitive pressures we face will not have a material adverse effect on our business, financial condition and results of operations. Also, as a result of this existing and potentially increasing competition, we may not be able to take advantage of attractive investment opportunities from time to time. We can offer no assurance that we will be able to identify and make investments that are consistent with our investment objective.
19
Table of Contents
We do not seek to compete primarily based on the interest rates we offer. We believe that some of our competitors make loans with interest rates that are comparable to, or lower than, the rates we offer.
We may lose investment opportunities if we do not match our competitors’ pricing, terms and structure. If we match our competitors’ pricing, terms and structure, we may experience decreased net interest income and increased risk of credit loss.
We have experienced a period of capital markets disruption. This disruption has contributed to a decrease in our NAV and stock price, and could have an adverse impact on our business and operations.
The global markets continued to be characterized by substantially increased volatility, short-selling and an overall loss of investor confidence. While certain recent economic indicators have shown modest improvements in the capital markets, these indicators could worsen. In the event of renewed financial turmoil affecting the banking system and financial markets, additional consolidation of the financial services industry, or significant financial service institution failures, there could be a new or incremental tightening in the credit markets, low liquidity and extreme volatility in fixed-income, credit, currency and equity markets. In addition, the risk remains that there could be a number of follow-on effects from the credit crisis on our business.
We may be unable to monetize assets in a challenging market environment that may preclude buyers from making investments at the fair values established by our board of directors. We are susceptible to the risk of significant loss, if we are forced to discount the value of our investments in order to monetize assets to provide liquidity to fund operations, meet our liability maturities and maintain compliance with our debt covenants. In addition, if the fair value of our assets declines substantially, we may fail to maintain the BDC asset coverage ratios stipulated by the 1940 Act. Any such failure would affect our ability to issue senior securities, including borrowings, pay dividends and could cause us to breach certain covenants in our credit facilities, which could materially impair our business operations. Further asset value degradation may result from circumstances that we may be unable to control, such as a severe decline in the value of the U.S. dollar, a protracted economic downturn or an operational problem that affects third parties or us. Ongoing disruptive conditions could cause our stock price and NAV to decline, restrict our business operations and adversely impact our results of operations and financial condition.
Fluctuations in interest rates could affect our income adversely.
Because we sometimes borrow to make investments, our net income depends, in part, on the difference between the rate at which we borrow funds and the rate at which we invest these funds. Because a significant portion of our assets and liabilities may be priced using various short-term rate indices, including one-month to six-month LIBOR, commercial paper rates and the prime rate, the timing of changes in market interest rates or in the relationship between interest rate indices could affect the interest rates earned on our interest-earning assets differently than the interest rates we pay on interest-bearing liabilities. As a result, significant changes in market interest rates could have a material adverse effect on our net income. A significant portion of our variable rate loans have interest rate floors based on the LIBOR or prime rate. These floors minimize our exposure to significant decreases in interest rates.
A significant increase in market interest rates could harm our ability to attract new portfolio companies and originate new loans and investments, our non-performing assets could increase and the value of our portfolio could decrease because our floating-rate loan portfolio companies may be unable to meet higher payment obligations.
Our shares of common stock may continue to trade at discounts from NAV, which limits our ability to raise additional equity capital.
Shares of closed-end investment companies frequently trade at a market price that is less than the NAV attributable to those shares. This characteristic of closed-end investment companies is separate and distinct from the risk that our NAV per share may decline. It is not possible to predict whether our common stock will trade at, above, or below NAV. In the recent past, the stocks of BDCs as an industry, including shares of our common stock, have traded below NAV and at near historic lows as a result of concerns over liquidity, leverage restrictions and distribution requirements. When our common stock trades below its NAV per share, we generally are unable to issue additional shares of our common stock at the then-current market price without first obtaining approval for such issuance from our stockholders and our independent directors.
20
Table of Contents
We may in the future decide to issue preferred stock, which would magnify the potential for gain or loss and the risks of investing in us in the same way as our borrowings.
Because preferred stock is another form of leverage and the dividends on any preferred stock we might issue must be cumulative, preferred stock has the same risks to our common stockholders as borrowings. Payment of any such dividends and repayment of the liquidation preference of such preferred stock must take preference over any dividends or other payments to our common stockholders, and preferred stockholders are not subject to any of our expenses or losses and are not entitled to participate in any income or appreciation in excess of their stated preference. In addition, holders of any preferred stock we might issue would have the right to elect members of the board of directors and class voting rights on certain matters, including changes in fundamental investment restrictions and conversion to open-end status and, accordingly, could veto any such changes. We currently have no plans to issue preferred stock, but may in the future.
If we fail to qualify as a RIC, we will have to pay corporate-level taxes on our income and our income available for distribution would be reduced significantly or eliminated.
We have elected to be taxed for federal income tax purposes as a RIC, under Subchapter M of the Internal Revenue Code. To qualify as a RIC under the Internal Revenue Code, we must meet certain source-of-income, asset diversification and annual distribution requirements and maintain our status as a BDC, including:
| • | The annual distribution requirement for a RIC is satisfied if we distribute to our stockholders at least 90% of our ordinary income and realized net short-term capital gains in excess of realized net long-term capital losses, if any, on an annual basis. Because we may use debt financing, we are subject to an asset coverage ratio requirement under the 1940 Act and we may be subject to certain financial covenants under our debt arrangements that could, under certain circumstances, restrict us from making distributions necessary to satisfy the distribution requirement. If we are unable to obtain cash from other sources, we could fail to qualify for RIC tax treatment and, thus, become subject to corporate-level income tax. |
| • | The income source requirement will be satisfied if we obtain at least 90% of our income for each year from dividends, interest, gains from the sale of stock or securities or similar sources. |
| • | The asset diversification requirement will be satisfied if we meet certain asset diversification requirements at the end of each quarter of our taxable year. To satisfy these requirements, at least 50% of the value of our assets must consist of cash, cash equivalents, U.S. government securities, securities of other RICs, and other acceptable securities; and no more than 25% of the value of our assets can be invested in the securities, other than U.S. government securities or securities of other RICs, of one issuer, of two or more issuers that are controlled, as determined under applicable Internal Revenue Code rules, by us and that are engaged in the same or similar or related trades or businesses or of certain “qualified publicly traded partnerships.” Failure to meet these requirements may result in our having to dispose of certain investments quickly in order to prevent the loss of RIC status. Because most of our investments will be in private companies, and, therefore, will be relatively illiquid, any such dispositions could be made at disadvantageous prices and could result in substantial losses. |
If we fail to qualify as a RIC for any reason and become subject to corporate-level income tax, the resulting corporate-level taxes could substantially reduce our net assets, the amount of income available for distribution and the amount of our distributions. Such a failure would have a material adverse effect on our stockholders and us.
A failure on our part to maintain our qualification as a BDC would significantly reduce our operating flexibility.
If we were to continuously fail to qualify as a BDC, we might be subject to regulation as a registered closed-end investment company under the 1940 Act, which would significantly decrease our operating flexibility. In addition, failure to comply with the requirements imposed on BDCs by the 1940 Act could cause the SEC to bring an enforcement action against us. For additional information on the qualification requirements of a BDC, see the disclosure under the caption Item 1. Business—Regulation.
21
Table of Contents
We have substantial indebtedness and if we do not service our debt arrangements adequately, our business could be harmed materially.
Both of our two securitized financing facilities, the SunTrust Warehouse and the MCG Commercial Loan Trust 2006-1, have entered their amortization periods and all principal payments received related to the securitized collateral will be used to reduce the outstanding borrowings under these facilities. Our ability to service our debt arrangements depends largely on our financial performance and will be subject to prevailing economic conditions and competitive pressures.
Under our warehouse financing facility, or SunTrust Warehouse, which was originally funded through Three Pillars Funding LLC, an asset-backed commercial paper conduit administered by SunTrust Robinson Humphrey, Inc. but is now funded through SunTrust Bank, and our debt securitization through MCG Commercial Loan Trust 2006-1, we are subject to financial and operating covenants that restrict our business activities, including limitations that could hinder our ability to finance additional loans and investments or to make the distributions required to maintain our status as a RIC under Subchapter M of the Internal Revenue Code and impact our liquidity. In addition, these facilities include various affirmative and negative covenants, as well as certain cross-default provisions, whereby a payment default or acceleration under one of our debt facilities could, in certain circumstances, constitute a default under other debt facilities. In the event that there is a breach of one of the covenants contained in one of our debt facilities that has not been cured within any applicable cure period the lenders thereunder would have the ability, in certain circumstances, to accelerate the maturity of the indebtedness outstanding under that facility and exercise certain other remedies. In addition, our subsidiaries have sold some of our loans to trusts that serve as the vehicles for our securitization facilities, and these trusts, which are bankruptcy remote, hold legal title to these assets. However, in the event of a default on these loans held by the trusts, we could potentially bear losses to the extent that the fair value of our collateral exceeds our borrowings.
Each of our SunTrust Warehouse and our debt securitization through MCG Commercial Loan Trust 2006-1 requires us to maintain credit ratings for each loan in the collateral pools of these facilities as determined by specified international independent rating agencies. We are subject to periodic review and updates of these credit estimates by these rating agencies that could cause portions of the collateral to become disqualified as eligible assets if credit estimates deteriorate. If credit estimates deteriorate significantly, an event of default or a termination event could be triggered under these facilities, which would entitle the trustee or administrative agent to exercise available remedies, including selling the collateral securing these facilities and applying the proceeds to reduce outstanding borrowings under these facilities.
Decreases in the fair values of our portfolio company investments, which we record as unrealized depreciation, could affect certain covenants in our credit facilities. Our SunTrust Warehouse requires that we maintain a consolidated tangible net worth of not less than $375.0 million plus 50% of the proceeds from any equity issuances after February 26, 2009. In the event that our investments experience a significant amount of unrealized depreciation, we could breach one or more of the covenants in our credit facilities, pursuant to which our lenders might, among other things, require full and immediate payment. The SunTrust Warehouse and MCG Commercial Loan Trust 2006-1 are non-recourse to MCG, the parent; therefore, in the event of a breach of one or more of these covenants, the lenders under these facilities may only look to the collateral in these facilities to satisfy the respective outstanding obligations under the SunTrust Warehouse and MCG Commercial Loan Trust 2006-1.
In addition to the credit facility, Solutions Capital has issued SBA debentures that require our SBIC to generate sufficient cash flow to make required interest payments. Further, Solutions Capital I, L.P. must maintain a minimum capitalization that if impaired could materially and adversely affect our liquidity, financial condition and results of operations. Our borrowings under our SBA debentures are collateralized by the assets of Solutions Capital.
As a BDC, we are not permitted to incur indebtedness or issue senior securities, including preferred stock, unless immediately after such borrowing we have an asset coverage for total borrowings (excluding borrowings by our SBIC facility) of at least 200%. In addition, we may not be permitted to declare any cash dividend or other distribution on our outstanding common stock, or purchase any such shares, unless, at the time of such declaration or purchase, we have an asset coverage of at least 200% after deducting the amount of such dividend, distribution or purchase price. If we are unable to meet this asset coverage requirement, we may not be able to incur additional debt and may need to sell a portion of our investments to repay some debt when it is disadvantageous to do so, and we may not be able to make distributions until we are in compliance with the 200% threshold requirement.
22
Table of Contents
If we are not able to establish new credit facilities on favorable terms, our operations could be affected adversely.
Both of our two securitized financing facilities, the SunTrust Warehouse and the MCG Commercial Loan Trust 2006-1, have entered their amortization periods and all principal payments received related to the securitized collateral will be used to reduce the outstanding borrowings under these facilities. No funds from these facilities will be available to make new investments. We cannot be certain that we will be able to establish new borrowing facilities to provide capital for normal operations, including new originations. If we are unable to establish new facilities at a reasonable size, our liquidity will be reduced significantly. Even if we are able to consummate new borrowing facilities, we may not be able to do so on favorable terms. If we are unable to repay amounts outstanding under our existing facilities and they are declared in default, our operations could be affected adversely.
Historically, we have funded senior and subordinated debt to middle-market companies and purchased rated syndicated private debt in larger companies through our on-balance sheet securitization trust—Commercial Loan Trust 2006-1. This securitized trust included a five-year reinvestment period, during which the trust was permitted to use principal collections received from repayments of the underlying collateral to purchase new collateral from us. The reinvestment period ended on July 20, 2011 and all future principal collections received will be used to repay the securitized debt.
In addition to the SunTrust Warehouse and our MCG Commercial Loan Trust 2006-1 facility, Solutions Capital has issued SBA debentures that require our SBIC to generate sufficient cash flow to make required interest payments. Further, Solutions Capital must maintain a minimum capitalization that if impaired could materially and adversely affect our liquidity, financial condition and results of operations. Our borrowings under our SBA debentures are collateralized by the assets of Solutions Capital.
Our continued compliance with these requirements depends on many factors, some of which are beyond our control. Material net asset devaluation in connection with additional borrowings could result in an inability to comply with our obligation to restrict the level of indebtedness that we are able to incur in relation to the value of our assets or to maintain a minimum level of stockholders’ equity.
When we are a debt or minority equity investor in a portfolio company, we may not be in a position to have significant influence over the entity. The stockholders and management of the portfolio company may make decisions that could decrease the value of our portfolio holdings.
We make both debt and minority equity investments. For these investments, we are subject to the risk that a portfolio company may make business decisions with which we disagree, and the stockholders and management of that company may take risks or otherwise act in ways that do not serve our interests. As a result, a portfolio company may make decisions that could decrease the value of our portfolio holdings and have an adverse effect on our financial position and results of operations.
Investments in equity securities involve a substantial degree of risk.
We have purchased and may purchase in the future common stock and other equity securities, including warrants. Although equity securities historically have generated higher average total returns than debt securities over the long term, equity securities may experience more volatility in those returns than debt securities. The equity securities we acquire may fail to appreciate, decline in value or lose all value, and our ability to recover our investment will depend on our portfolio company’s success. Investments in equity securities involve a number of significant risks, including the risk of further dilution in the event of additional issuances. Investments in preferred securities involve special risks, such as the risk of deferred distributions, illiquidity and limited voting rights.
You may not receive future distributions.
In the event that our asset coverage ratio falls below 200%, we will be unable to make distributions until our asset coverage ratio improves. If we do not distribute at least 90% of our investment company taxable income annually, we will suffer adverse tax consequences, including the possible loss of our status as a RIC for the applicable period. We cannot assure you that you will receive any distributions or distributions at a particular level. From December 2001 through December 31, 2011, we declared distributions totaling $12.81 per common share. Due to the market dislocation, we suspended our distributions from the third quarter of 2008 through the first quarter of 2010. We reinstated our distribution on April 29, 2010 and have continued to declare a quarterly dividend since that time; however, there can be no assurance that distributions will continue in the future.
23
Table of Contents
Future distributions will take into account the requirements for us to distribute the majority of our taxable income to fulfill our distribution requirements as a RIC, together with an assessment of our current and forecasted gains and losses recognized or to be recognized for tax purposes, portfolio transactional events, liquidity, cash earnings and our asset coverage ratio at the time of such decision. We may not be able to achieve operating results or our business may not perform in a manner that will allow us to make any future distributions. In addition, we may not be able to make distributions at a specific level or to increase the amount of these distributions from time to time. Due to the BDC asset coverage test applicable to us as a BDC, we may be limited in our ability to make distributions.
In the future, we may choose to pay distributions with shares of our own common stock. In that case, you may be required to pay tax in excess of the cash you receive.
While currently it is not our intention to do so, we may in the future elect to distribute taxable dividends that are payable, in part, in shares of our common stock. Under an IRS revenue procedure, we may treat a distribution of our stock payable with respect to our taxable years ending on or before December 31, 2011, as a taxable dividend if, among other things, our stock is publicly traded on an established securities market and each stockholder may elect to receive his or her entire distribution in either cash or our stock subject to a limitation on the aggregate amount of cash to be distributed to all stockholders, which must be at least 10% of the aggregate declared distribution. Taxable stockholders receiving such distributions will be required to include the full amount of the distribution as ordinary income (or as a long-term capital gain to the extent such distribution is properly designated as a capital gain dividend). As a result, a U.S. stockholder may be required to pay tax with respect to such distribution in excess of any cash received. If a U.S. stockholder sells the stock it receives as a distribution in order to pay this tax, the sales proceeds may be less than the amount included in income with respect to the dividend, depending on the market price of our stock at the time of the sale. Furthermore, with respect to non-U.S. stockholders, we may be required to withhold U.S. income taxes with respect to such distribution, including in respect of all or a portion of such dividend that is payable in stock. In addition, if a significant number of our stockholders decide to sell shares of our stock in order to pay taxes owed on distributions, it may put downward pressure on the trading price of our stock.
We may have difficulty paying our required distributions if we recognize income before, or without, receiving cash representing such income.
In accordance with applicable tax laws and regulations, we include in taxable income certain amounts that we have not yet received in cash, such as contractual paid-in-kind, or PIK, interest, interest on loans that are on non-accrual status and original issue discount. PIK interest represents contractual interest added to the loan balance and due at the end of the loan term. We include increases in loan balances resulting from contractual PIK arrangements in taxable income, in advance of receiving cash payment. We may also recognize income for tax purposes for certain of our loans that are on non-accrual status for which we are not currently receiving payments. In addition, we hold debt instruments that have original issue discount, which may arise if we receive warrants in connection with the issuance of a debt instrument or in other circumstances. We are required to include in income each year a portion of the original issue discount that accrues over the life of the obligation, regardless of whether cash representing such income is received by us in the same taxable year. Since we may recognize income before, or without, receiving cash representing such income, we may have difficulty meeting the requirement to distribute at least 90% of our investment company taxable income to maintain tax benefits as a RIC. Accordingly, we may have to sell some of our investments at times we would not consider advantageous, raise additional debt or equity capital or reduce new investment originations to meet these distribution requirements. If we are not able to obtain cash from other sources, we may fail to qualify as a RIC and, thus, be subject to corporate-level income tax.
The disposition of our investments may result in contingent liabilities.
Most of our investments involve private securities. In connection with the disposition of an investment in private securities, we may be required to make representations about the business and financial affairs of the portfolio company typical of those made in connection with the sale of a business. We may also be required to indemnify the purchasers of such investment to the extent that any such representations turn out to be inaccurate or with respect to certain potential liabilities. These arrangements may result in contingent liabilities that ultimately yield funding obligations that must be satisfied through our return of certain distributions previously made to us.
24
Table of Contents
If we need to sell any of our investments, we may not be able to do so at a favorable price and, as a result, we may suffer losses.
Our investments usually are subject to contractual or legal restrictions on resale or are otherwise illiquid because there is usually no established trading market for such investments. The illiquidity of most of our investments may make it difficult for us to dispose of them at a favorable price. As a result, we may suffer losses. In addition, if we were forced to liquidate some or all of the investments in our portfolio on an expedited basis, the proceeds of such liquidation could be significantly less than the current fair value of such investments. We may be required to liquidate some or all of our portfolio to meet our debt service obligations or to maintain our qualification as a BDC and as a RIC if we do not satisfy one or more of the applicable criteria under the respective regulatory frameworks.
Our business depends on our key personnel.
We depend on the continued services of our executive officers and other key management personnel. The loss of any of our executive officers or key management personnel could result in inefficiencies in our operations and lost business opportunities, which could have a negative impact on our business. In addition, under our SunTrust Warehouse, if any of Richard W. Neu, B. Hagen Saville or Stephen J. Bacica ceases to be involved actively in the management of MCG and is not replaced by a person reasonably acceptable to SunTrust within 90 consecutive calendar days of such occurrence, we would be in default under such facility. If we lose the services of any of Messrs. Neu, Saville or Bacica and are unable to identify and hire a suitably qualified replacement(s), it could trigger a termination event under the facility and entitle the administrative agent thereunder to exercise available remedies, including selling the collateral securing this facility and applying the proceeds to reduce outstanding borrowings thereunder.
Regulations governing our operation as a BDC will affect our ability to, and the way in which we, raise additional capital.
We have issued debt securities and may issue additional debt securities, preferred stock and/or borrow money from banks or other financial institutions, which we refer to collectively as “senior securities,” up to the maximum amount permitted by the 1940 Act. Under the provisions of the 1940 Act, as a BDC, we are permitted to issue senior securities only in amounts such that our BDC asset coverage, as defined in the 1940 Act, equals at least 200% after each issuance of senior securities. If the value of our assets declines, we may be unable to satisfy this test. If that happens, we would be precluded from issuing senior securities and paying dividends and we may be required to sell a portion of our investments and, depending on the nature of our leverage, may be required to repay a portion of our indebtedness at a time when such sales may be disadvantageous. In addition, the 1940 Act prohibits us from selling shares of our common stock at a price below the current NAV unless our stockholders approve such a sale and our board of directors makes certain determinations.
Any change in the regulation of our business could have a significant adverse effect on the profitability of our operations and our cost of doing business.
Changes in the laws, regulations or interpretations of the laws and regulations that govern BDCs, RICs, SBICs or non-depository commercial lenders could have a significant adverse effect on our operations and our cost of doing business. We are subject to federal, state and local laws and regulations and are subject to judicial and administrative decisions that affect our operations. If these laws, regulations or decisions change, or if we expand our business into jurisdictions that have adopted requirements that are more stringent than those in which we currently conduct business, we may have to incur significant expenses in order to comply or we may have to restrict our operations.
Our wholly owned subsidiary is licensed by the SBA and is subject to SBA regulations.
Our wholly owned subsidiary, Solutions Capital, is licensed to operate as an SBIC and is regulated by the SBA. The SBIC license allows our SBIC subsidiary to obtain leverage by issuing SBA-guaranteed debentures, subject to the issuance of a capital commitment by the SBA and other customary procedures. The SBA regulations require, among other things, that a licensed SBIC be examined periodically, by an SBA examiner, to determine the SBIC’s compliance with the relevant SBA regulations, and be audited by an independent auditor.
Under current SBA regulations, a licensed SBIC can provide capital to those entities that have a tangible net worth not exceeding $18.0 million and an average net income after federal income taxes not exceeding $6.0 million for the two most recent fiscal years. In addition, a licensed SBIC must devote 25% of its investment activity to those entities that have a tangible net worth not exceeding $6.0 million and an average annual net
25
Table of Contents
income after federal income taxes not exceeding $2.0 million for the two most recent fiscal years. The SBA regulations also provide alternative size standard criteria to determine eligibility, which depend on the industry in which the business is engaged and are based on factors such as the number of employees and gross sales. The SBA regulations permit licensed SBICs to make long term loans to small businesses and invest in the equity securities of such businesses. The SBA also places certain limitations on the financing terms of investments by SBICs in portfolio companies and prohibits SBICs from providing funds for certain purposes or to businesses in a few prohibited industries. Compliance with SBA requirements may cause our SBIC subsidiary to forego attractive investment opportunities that are not permitted under SBA regulations.
SBA regulations currently limit the amount that a single-license SBIC subsidiary may borrow up to a maximum of $150.0 million when it has at least $75.0 million in private capital, receives a capital commitment from the SBA and has been through an examination by the SBA subsequent to licensing. As of January 2012, we have funded $75.0 million to Solutions Capital, and Solutions Capital has borrowed $150.0 million of SBA-guaranteed debentures.
The SBA prohibits, without prior SBA approval, a “change of control” of an SBIC or transfers that would result in any person (or a group of persons acting in concert) owning 10% or more of a class of capital stock of a licensed SBIC. If our SBIC subsidiary fails to comply with applicable SBA regulations, the SBA could, depending on the severity of the violation, limit or prohibit its use of debentures, declare outstanding debentures immediately due and payable, and/or limit it from making new investments. In addition, the SBA can revoke or suspend a license for willful or repeated violation of, or willful or repeated failure to observe, any provision of the SBIC Act or any rule or regulation promulgated thereunder. These actions by the SBA would, in turn, negatively affect us because our SBIC subsidiary is our wholly owned subsidiary.
Our wholly owned SBIC subsidiary may be unable to make distributions to us that will enable us to meet or maintain RIC status, which could result in the imposition of an entity-level tax.
In order for us to continue to qualify for RIC tax treatment and to minimize corporate-level taxes, we will be required to distribute substantially all of our net ordinary income and net capital gain income, including income from certain of our subsidiaries, which includes the income from our SBIC subsidiary. We will be partially dependent on our SBIC subsidiary for cash distributions to enable us to meet the RIC distribution requirements. Our SBIC subsidiary may be limited by the SBIC Act and SBA regulations governing SBICs from making certain distributions to us that may be necessary to maintain our status as a RIC. If our SBIC is unable to make sufficient distributions to us to allow us to make the required annual distributions to maintain our status as a RIC, and we are not able to obtain cash from other sources, we may fail to qualify as a RIC and, thus, be subject to corporate-level income tax.
The impact of recent financial reform legislation on us is uncertain.
In light of current conditions in the U.S. and global financial markets and the U.S. and global economy, legislators, the presidential administration and regulators have increased their focus on the regulation of the financial services industry. The Dodd-Frank Reform Act became effective on July 21, 2010, although many provisions of the Dodd-Frank Reform Act have delayed effectiveness or will not become effective until the relevant federal agencies issue new rules to implement the Dodd-Frank Reform Act. Nevertheless, the Dodd-Frank Reform Act may have a material adverse impact on the financial services industry as a whole and on our business, results of operations and financial condition. Accordingly, we cannot predict the effect the Dodd-Frank Act or its implementing regulations will have on our business, results of operations or financial condition.
Our stock price has been, and continues to be, volatile and purchasers of our common stock could incur substantial losses.
The stock market in general and the market prices for securities of financial services companies, and BDCs in particular, have experienced extreme volatility that often has been unrelated or disproportionate to the operating performance of these companies. If current levels of market volatility continue or worsen, there can be no assurance that we will not continue to experience an adverse effect, which may be material, on our ability to access capital and on our business, financial condition and results of operations.
The trading price of our common stock following an offering may fluctuate substantially. The price of the common stock that will prevail in the market after an offering may be higher or lower than the price you paid and the liquidity of our common stock may be limited, in each case depending on many factors, some of which are beyond our control and may not be related directly to our operating performance. The market price and the liquidity of the market for our shares may from time to time be affected by a number of factors, which include, but are not limited to, the following:
| • | our quarterly results of operations; |
26
Table of Contents
| • | our origination activity, including the pace of, and competition for, new investment opportunities; |
| • | price and volume fluctuations in the overall stock market from time to time; |
| • | investors’ general perception of our company, the economy and general market conditions; |
| • | actual or anticipated changes in our earnings or fluctuations in our operating results or changes in the expectations of securities analysts; |
| • | the financial performance of the specific industries in which we invest on a recurring basis, including without limitation, our investments in the communications, cable and healthcare industries; |
| • | significant transactions or capital commitments by us or our competitors; |
| • | significant volatility in the market price and trading volume of securities of BDCs or other financial services companies; |
| • | volatility resulting from trading in derivative securities related to our common stock including puts, calls or short trading positions; |
| • | potential future sales of debt securities convertible into or exchangeable or exercisable for our common stock or the conversion of such securities; |
| • | changes in laws or regulatory policies or tax guidelines with respect to BDCs or RICs; |
| • | loss of RIC status; |
| • | the inability to secure additional debt or equity capital; |
| • | announcements of strategic developments, acquisitions and other material events by us or our competitors; |
| • | litigation or regulatory actions affecting us or our portfolio companies; or |
| • | departures of key personnel. |
If any of these factors causes an adverse effect on our business, our results of operations or our financial condition, the price of our common stock could fall and investors may not be able to sell their common stock at or above their respective purchase prices.
Certain provisions of the Delaware General Corporation Law and our certificate of incorporation and bylaws could deter takeover attempts and have an adverse impact on the price of our common stock.
The Delaware General Corporation Law, our certificate of incorporation and our bylaws contain provisions that may have the effect of discouraging a third party from making an acquisition proposal for us. We have also adopted measures that may make it difficult for a third party to obtain control of us, including provisions of our certificate of incorporation dividing our board of directors into three classes with the term of one class expiring at each annual meeting of stockholders. These anti-takeover provisions may inhibit a change in control in circumstances that could give the holders of our common stock the opportunity to realize a premium over the market price of our common stock.
27
Table of Contents
| ITEM 1B. | UNRESOLVED STAFF COMMENTS. |
None.
| ITEM 2. | PROPERTIES. |
Neither we nor any of our subsidiaries own any facilities or real estate. However, during 2011 we leased 39,574 square feet of office space in Arlington, Virginia for our corporate headquarters and 6,758 square feet in Richmond, Virginia for certain administrative operations. The lease on our Arlington, Virginia office space will expire in February 2013. On December 31, 2011, the lease terminated on the office located in Richmond, Virginia and, at that time, we closed that office and relocated the administrative activities performed in that location to our corporate headquarters in Arlington, Virginia. We also leased, and sublet to third-parties, office space in California and Georgia that we no longer used. The lease on the office space located in California terminated during 2011 and we have not renewed or otherwise extended the lease.
| ITEM 3. | LEGAL PROCEEDINGS. |
From time to time, we are a party to certain legal proceedings incidental to the normal course of our business including the enforcement of our rights under contracts with our portfolio companies. While we cannot predict the outcome of these legal proceedings with certainty, we do not expect that these proceedings will have a material effect upon our financial condition or results of operations.
| ITEM 4. | MINE SAFETY DISCLOSURES |
None
28
Table of Contents
| ITEM 5. | MARKET FOR REGISTRANT’S COMMON EQUITY, RELATED STOCKHOLDER MATTERS AND ISSUER PURCHASES OF EQUITY SECURITIES. |
Market Information
Our common stock is traded on the NASDAQ Global Select Market under the symbol “MCGC.” The following table sets forth the high and low last sales prices of our common stock for the periods indicated, as reported on the NASDAQ Global Select Market:
| Years ended December 31, | ||||||||||||||||
| 2011 | 2010 | |||||||||||||||
| Quarter Ended |
High | Low | High | Low | ||||||||||||
| March 31 |
$ | 7.54 | $ | 6.02 | $ | 5.64 | $ | 4.42 | ||||||||
| June 30 |
$ | 6.88 | $ | 5.95 | $ | 6.84 | $ | 4.68 | ||||||||
| September 30 |
$ | 6.33 | $ | 3.70 | $ | 6.06 | $ | 4.69 | ||||||||
| December 31 |
$ | 5.02 | $ | 3.65 | $ | 7.36 | $ | 5.90 | ||||||||
Holders
On February 24, 2012 we had approximately 128 holders of record and approximately 21,711 beneficial holders of our common stock.
Recent Sales of Unregistered Securities and Purchases of Equity Securities
As part of our dividend reinvestment plan for our common stockholders, we may direct the plan administrator to purchase shares of our common stock on the open market to satisfy dividend reinvestment requests related to dividends that we pay on outstanding shares of our common stock. In addition, for certain employees, we may be deemed to have purchased through the net issuance of shares, a portion of the shares of restricted stock previously issued under our Third Amended and Restated 2006 Employee Restricted Stock Plan, or the 2006 Plan, for which the forfeiture provisions have lapsed to satisfy the respective employee’s income tax withholding obligations. We retire immediately all such shares of common stock that we purchase in connection with such net issuance to employees. The following table summarizes the shares of common stock that we have purchased during the three months ended December 31, 2011.
| Period/Purpose |
Total number of shares |
Average Price Paid per Share |
Total Number of Shares Purchased as Part of Publicly Announced Plans or Programs |
Maximum Number (or Approximate Dollar Value) of Shares that May Yet Be Purchased Under the Plans or Programs |
||||||||||||
| October 1 – 31, 2011 |
||||||||||||||||
| Dividend reinvestment requirements(a) |
18,373 | $ | 4.42 | (b) | n/a | n/a | ||||||||||
| Restricted stock vesting(c) |
23,697 | $ | 4.64 | (d) | n/a | n/a | ||||||||||
|
|
|
|
|
|
|
|
|
|||||||||
| Total October 1 – 31, 2011 |
42,070 | $ | 4.54 | |||||||||||||
|
|
|
|
|
|
|
|
|
|||||||||
| November 1 – 30, 2011 |
||||||||||||||||
| Restricted stock vesting(c) |
7,785 | $ | 4.41 | (d) | n/a | n/a | ||||||||||
| December 1 – 31, 2011 |
||||||||||||||||
| Restricted stock vesting(c) |
10,191 | $ | 3.99 | (d) | n/a | n/a | ||||||||||
|
|
|
|
|
|
|
|
|
|||||||||
| Total shares / weighted average price paid |
60,046 | $ | 4.43 | n/a | n/a | |||||||||||
|
|
|
|
|
|
|
|
|
|||||||||
| (a) | Represents stock purchased on the open market to satisfy dividend reinvestment requests related to the dividend we paid on October 14, 2011. |
| (b) | Represents the weighted-average purchase price per share, including commissions, for shares purchased pursuant to the terms of our dividend reinvestment plan. |
| (c) | Represents shares repurchased from our employees in connection with the net issuance of shares to satisfy employee tax withholding obligations in connection with the vesting of restricted stock. |
| (d) | Based on the weighted-average closing share prices of our common stock on the dates that the forfeiture restrictions lapsed. |
29
Table of Contents
Distribution Policy
We currently qualify as a RIC for federal income tax purposes, which generally allows us to avoid paying corporate income taxes on any income or gains that we distribute to our stockholders. Generally, we intend to distribute sufficient dividends to eliminate taxable income and may distribute more than the taxable income which would be considered a return of capital. As a RIC, we are subject to a 4% excise tax to the extent that we do not distribute on an actual or on deemed basis: (i) 98.0% of our current year ordinary income; and (ii) 98.2% of our current year net capital gain income.
We may not be able to achieve operating results that will allow us to make distributions at a specific level or to increase the amount of these distributions from time to time. In addition, we may be limited in our ability to make distributions due to the BDC asset coverage test for borrowings applicable to us as a BDC under the 1940 Act and due to provisions in our credit facilities. If we do not distribute a certain percentage of our income annually, we will suffer adverse tax consequences, including possible loss of favorable RIC tax treatment. We cannot assure stockholders that they will receive any distributions or distributions at a particular level. We may make distributions to our stockholders of certain net capital gains.
The following table summarizes our distributions declared since January 1, 2010:
| Date Declared |
Record Date |
Payment Date |
Amount |
|||||
| February 24, 2012 |
April 13, 2012 | May 15, 2012 | $ | 0.17 | ||||
| October 31, 2011 |
December 15, 2011 | January 13, 2012 | $ | 0.17 | ||||
| August 1, 2011 |
September 14, 2011 | October 14, 2011 | $ | 0.17 | ||||
| May 5, 2011 |
June 15, 2011 | July 15, 2011 | $ | 0.17 | ||||
| March 1, 2011 |
March 15, 2011 | April 15, 2011 | $ | 0.15 | ||||
| November 2, 2010 |
December 9, 2010 | January 6, 2011 | $ | 0.14 | ||||
| August 3, 2010 |
September 7, 2010 | October 4, 2010 | $ | 0.12 | ||||
| April 29, 2010 |
June 2, 2010 | July 2, 2010 | $ | 0.11 | ||||
We will make future decisions with respect to the actual level of distributions after taking into account the minimum statutorily required level of distributions, gains and losses recognized for tax purposes, portfolio transactional events, our liquidity, cash earnings and our BDC asset coverage ratio at the time of such decision. For additional information about our distributions, see the Liquidity and Capital Resources and Distributions sections of our Management’s Discussion and Analysis of Financial Condition and Results of Operations.
Equity Compensation Plan Information
Information relating to compensation plans under which our equity securities are authorized for issuance is set forth under Security Ownership of Certain Beneficial Owners and Management and Related Stockholder Matters in our definitive proxy statement for our 2012 Annual Meeting of Stockholders.
30
Table of Contents
Stock Performance Graph
The following comparative stock performance graph compares the cumulative total stockholder return (assuming reinvestment of dividends, if any) from investing $100 on December 31, 2006 through December 31, 2011, in each of: i) our common stock; ii) the Russell 2000 Index; and iii) the NASDAQ Financial 100 Index (capitalization weighted).
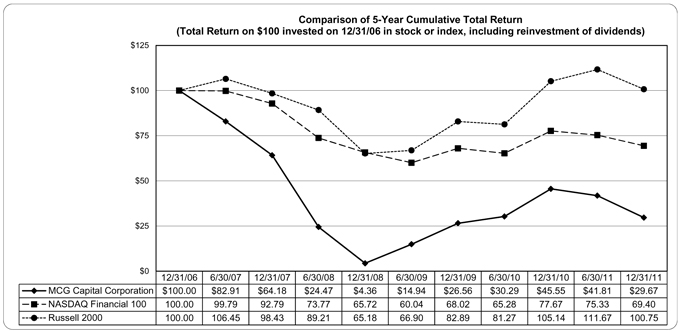
The information included under the heading Stock Performance Graph in Item 5 of this Annual Report on Form 10-K is “furnished” and not “filed,” and shall not be deemed to be “soliciting material” or subject to Regulation 14A, shall not be deemed “filed” for purposes of Section 18 of the Exchange Act, or otherwise subject to the liabilities of that section, nor shall it be deemed incorporated by reference in any filing under the Exchange Act.
31
Table of Contents
| ITEM 6. | SELECTED CONSOLIDATED FINANCIAL DATA |
The selected consolidated financial data set forth in the following table with respect to our statement of operations data for the years ended December 31, 2011, 2010 and 2009 and the balance sheet data as of December 31, 2011 and 2010 are derived from our audited financial statements included in this Annual Report on Form 10-K. The statement of operations data for the years ended December 31, 2008 and 2007 and the balance sheet data as of December 31, 2009, 2008 and 2007 are derived from our audited financial statements, which are not included herein. Historical results are not necessarily indicative of future results. See the notes below and to the consolidated financial statements for an explanation of the method used to determine the number of shares used in computing DNOI and (loss) earnings per common share basic and diluted. The selected consolidated financial data set forth below should be read in conjunction with, and is qualified in its entirety by, our audited consolidated financial statements and related notes thereto found at Item 8. Financial Statements and Supplementary Data and Item 7. Management’s Discussion and Analysis of Financial Condition and Results of Operations.
| Years ended December 31, | ||||||||||||||||||||
| (in thousands, except per share and other period-end data) |
2011 | 2010 | 2009 | 2008 | 2007 | |||||||||||||||
| Income statement data |
||||||||||||||||||||
| Revenue |
$ | 85,696 | $ | 89,569 | $ | 99,834 | $ | 135,365 | $ | 187,119 | ||||||||||
| Net operating income before net investment loss, (loss) gain on extinguishment of debt and income tax provision (benefit) |
37,658 | 40,565 | 38,188 | 56,090 | 101,918 | |||||||||||||||
| Net investment loss |
(129,873 | ) | (54,819 | ) | (94,353 | ) | (257,601 | ) | (12,887 | ) | ||||||||||
| Distributable net operating income (“DNOI”)(a) |
40,171 | 44,907 | 45,915 | 66,902 | 110,942 | |||||||||||||||
| Net (loss) income |
(93,115 | ) | (13,072 | ) | (51,059 | ) | (191,245 | ) | 86,636 | |||||||||||
| Per common share data |
||||||||||||||||||||
| Net operating income before net investment loss, (loss) gain on extinguishment of debt and income tax provision (benefit) per weighted-average common share—basic and diluted |
$ | 0.49 | $ | 0.54 | $ | 0.51 | $ | 0.78 | $ | 1.55 | ||||||||||
| DNOI per weighted-average common share—basic and diluted(a) |
$ | 0.53 | $ | 0.60 | $ | 0.61 | $ | 0.93 | $ | 1.69 | ||||||||||
| (Loss) earnings per weighted-average common share—basic and diluted |
$ | (1.22 | ) | $ | (0.17 | ) | $ | (0.68 | ) | $ | (2.65 | ) | $ | 1.32 | ||||||
| Cash dividends declared per common share |
$ | 0.66 | $ | 0.37 | $ | — | $ | 0.71 | $ | 1.76 | ||||||||||
| Selected period-end balances |
||||||||||||||||||||
| Investment portfolio balance |
||||||||||||||||||||
| Fair value |
$ | 741,166 | $ | 1,009,705 | $ | 986,346 | $ | 1,203,148 | $ | 1,545,090 | ||||||||||
| Cost |
1,017,218 | 1,245,673 | 1,154,924 | 1,470,123 | 1,564,401 | |||||||||||||||
| Total assets |
890,538 | 1,145,277 | 1,191,149 | 1,312,434 | 1,637,581 | |||||||||||||||
| Borrowings |
430,219 | 546,882 | 557,848 | 636,649 | 751,035 | |||||||||||||||
| Total stockholders’ equity |
434,952 | 578,016 | 615,683 | 658,911 | 834,689 | |||||||||||||||
| Net asset value per common share outstanding(b) |
$ | 5.65 | $ | 7.54 | $ | 8.06 | $ | 8.66 | $ | 12.73 | ||||||||||
| Other period-end data |
||||||||||||||||||||
| Average size of investment |
||||||||||||||||||||
| Fair value |
$ | 12,353 | $ | 14,221 | $ | 16,718 | $ | 17,188 | $ | 19,075 | ||||||||||
| Cost |
16,954 | 17,545 | 19,575 | 21,002 | 19,314 | |||||||||||||||
| Number of portfolio companies |
60 | 71 | 59 | 70 | 81 | |||||||||||||||
| Number of employees |
37 | 66 | 64 | 73 | 95 | |||||||||||||||
| Reconciliation of DNOI to net operating income before net investment loss, (loss) gain on extinguishment of debt and income tax provision (benefit) |
||||||||||||||||||||
| Net operating income before net investment loss, (loss) gain on extinguishment of debt and income tax provision (benefit) |
$ | 37,658 | $ | 40,565 | $ | 38,188 | $ | 56,090 | $ | 101,918 | ||||||||||
| Amortization of employee restricted stock awards(c) |
2,513 | 4,342 | 7,727 | 6,961 | 9,024 | |||||||||||||||
| Goodwill impairment |
— | — | — | 3,851 | — | |||||||||||||||
|
|
|
|
|
|
|
|
|
|
|
|||||||||||
| DNOI |
$ | 40,171 | $ | 44,907 | $ | 45,915 | $ | 66,902 | $ | 110,942 | ||||||||||
|
|
|
|
|
|
|
|
|
|
|
|||||||||||
| Weighted-average common shares outstanding—basic and diluted |
76,259 | 75,422 | 74,692 | 72,254 | 65,606 | |||||||||||||||
| Shares outstanding at end of year |
76,997 | 76,662 | 76,394 | 76,075 | 65,587 | |||||||||||||||
| (a) | DNOI is net operating income before investment (loss) gain and income tax (benefit) provision, as determined in accordance with accounting principles generally accepted in the United States, or GAAP, adjusted for amortization of employee restricted stock awards and goodwill impairment. We view DNOI and the related per share measures as useful and appropriate supplements to net operating income, net income, earnings per share and cash flows from operating activities. These measures serve as an additional measure of MCG’s operating performance exclusive of employee restricted stock amortization and goodwill impairment charges, which represents an expense, but does not require settlement in cash. DNOI does include paid-in-kind, or PIK, interest and dividend income which are generally not payable in cash on a regular basis but, rather at investment maturity or when declared. DNOI should not be considered as an alternative to net operating income, net income, earnings per share and cash flows from operating activities (each computed in accordance with GAAP). Instead, DNOI should be reviewed in connection with net operating income, net income, earnings per share and cash flows from operating activities in MCG’s consolidated financial statements, to help analyze how MCG’s business is performing. |
| (b) | Based on common shares outstanding at period-end. |
| (c) | Amortization of employee restricted stock awards for 2011 includes $432 of amortization associated with our 2011 corporate restructuring, which were reported as restructuring expense on our Consolidated Statements of Operations. Amortization of employee restricted stock awards for 2008 Includes $106 of amortization of employee restricted stock awards associated with our 2008 corporate restructuring, which were reported as general and administrative expense on our Consolidated Statements of Operations. |
32
Table of Contents
| ITEM 7. | MANAGEMENT’S DISCUSSION AND ANALYSIS OF FINANCIAL CONDITION AND RESULTS OF OPERATIONS |
The information contained in this section should be read in conjunction with the Selected Financial Data and Other Data, and our Consolidated Financial Statements and notes thereto appearing elsewhere in this Annual Report on Form 10-K.
This Annual Report on Form 10-K, including Management’s Discussion and Analysis of Financial Condition and Results of Operations, contains forward-looking statements that involve substantial risks and uncertainties. These forward-looking statements are not historical facts, but rather are based on current expectations, estimates, forecasts, projections, intentions, goals, strategies, plans, prospects and the beliefs and assumptions of our management including, without limitation: our expectations regarding our results of operations, including revenues, net operating income, distributable net operating income, net investment losses and general and administrative expenses and the factors that may affect such results; the cause of unrealized losses; the performance of our current and former portfolio companies; management’s desire to create a company with less credit and leverage risk yet one that has a sustainable and predictable level of net operating income and dividend generation; the expected reduction, over the next several years, of the size of the Company’s investment portfolio; annual non-compensation cost reduction opportunities and the timing of such cost reductions, which may never be realized; the timing of the anticipated wind down of the Company’s legacy equity positions and current secondary market facilities; the timing and level of staff reductions, as well as associated cost reductions, which may not be realized; future net operating income levels; expected cost savings, together with the earnings benefits from projected monetizations and the proposed conversions of legacy equity investments to debt instruments, and the anticipated offset to the earnings reduction attributable to the significant deleveraging of MCG’s balance sheet; future debt or equity issuances; the level of non-recurring costs, including severance costs, the amendment to the SunTrust Warehouse, the early retirement of private placement notes and other transitional costs; our belief that our experience in middle-market investing is a meaningful competitive advantage that we use to operate our business; our decisions to make dividend distributions after taking into account the minimum statutorily required level of distributions, gains and losses recognized for tax purposes, portfolio transactional events, our liquidity, cash earnings and our BDC asset coverage ratio; our belief that we will continue to be constrained by the limited access we have to debt and equity capital; our plans with regard to our second SBIC license; the reduction of investments in equity securities to less than 10% of the fair value of our portfolio over the next few years; the limitation of future investing activities principally to debt investments; our level of investments in control companies beyond those that are currently in our portfolio; our expectation regarding additional restructuring charges through 2013 and anticipated savings from our restructuring plan through December 31, 2012; the sufficiency of liquidity to meet 2012 operating requirements, as well as new origination opportunities and potential dividend distributions during the upcoming year; general market conditions; the state of the economy and other factors. Forward-looking statements can be identified by terminology such as “anticipate,” “believe,” “could,” “could increase the likelihood,” “hope,” “target,” “project,” “goals,” “potential,” “predict,” “might,” “estimate,” “expect,” “intend,” “is planned,” “may,” “should,” “will,” “will enable,” “would be expected,” “look forward,” “may provide,” “would” or similar terms, variations of such terms or the negative of those terms. These statements are not guarantees of future performance and are subject to risks, uncertainties, and other factors, some of which are beyond our control and difficult to predict. Important factors could cause our actual results to differ materially from those indicated or implied by forward-looking statements. Such factors that could cause or contribute to such differences include those risk factors discussed in Item IA of Part I of this Annual Report on Form 10-K.
Although we believe that the assumptions on which these forward-looking statements are based are reasonable, any of those assumptions could prove to be inaccurate, and as a result, the forward-looking statements based on those assumptions also could be incorrect. In light of these and other uncertainties, the inclusion of a projection or forward-looking statement in this Annual Report on Form 10-K should not be regarded as a representation by us that our plans and objectives will be achieved. You should not place undue reliance on these forward-looking statements, which apply only as of the date of this Annual Report on Form 10-K. We undertake no obligation to update any forward-looking statements for any reason, even if new information becomes available or other events occur in the future.
Description of Business
We are a solutions-focused commercial finance company providing capital and advisory services to middle-market companies throughout the United States. For our core portfolio, we make debt and equity investments primarily in companies with annual revenue of $20 million to $200 million and earnings before interest, taxes, depreciation and amortization, or EBITDA, of $3 million to $25 million, which we refer to as “middle-market”
33
Table of Contents
companies. Generally, our portfolio companies use our capital investment to finance acquisitions, recapitalizations, buyouts, organic growth and working capital. We identify and source new portfolio companies through multiple channels, including private equity sponsors, investment bankers, brokers, fund-less sponsors, institutional syndication partners, other club lenders and owner operators.
Currently, we use borrowings under Solutions Capital, our wholly owned subsidiary, licensed as a small business investment company, or SBIC, under the Small Business Investment Act of 1958, as amended, or SBIC Act, to fund unitranche, second-lien and subordinated debt investments. Historically, we have funded senior and subordinated debt to middle-market companies and purchased rated syndicated private debt in larger companies through our on-balance sheet securitization trust—Commercial Loan Trust 2006-1. This securitized trust included a five-year reinvestment period, during which the trust was permitted to use principal collections received from repayments of the underlying collateral to purchase new collateral from us. The reinvestment period ended on July 20, 2011 and all future principal collections received will be used to repay the securitized debt.
We are an internally managed, non-diversified, closed-end investment company that has elected to be regulated as a business development company, or BDC, under the Investment Company Act of 1940, as amended, or the 1940 Act. As a BDC we must meet various regulatory tests, which include investing at least 70% of our total assets in private or thinly traded public U.S.-based companies and meeting a 200% asset coverage ratio of total net assets to total senior securities excluding SBIC debt. In addition, we have elected to be treated for federal income tax purposes as a regulated investment company, or RIC, under Subchapter M of the Internal Revenue Code. In order to continue to qualify as a RIC for federal income tax purposes and obtain favorable RIC tax treatment, we must meet certain requirements, including certain minimum distribution requirements. If we satisfy these requirements, we generally will not have to pay corporate-level taxes on any income we distribute to our stockholders as distributions, allowing us to substantially reduce or eliminate our corporate-level tax liability. From time to time, our wholly owned subsidiaries may execute transactions that trigger corporate-level tax liabilities. In such cases, we recognize a tax provision in the period when it becomes more likely than not that the taxable event will occur.
Recent Developments
SIGNIFICANT DEVELOPMENTS IN 2011
In 2011, we continued to execute on our previously stated strategic plan to, among other initiatives, convert lower-yielding equity investments and unencumbered cash into yield-oriented new investment opportunities. We successfully monetized equity investments in 15 control and other equity positions generating cash proceeds of $64.3 million. Our liquidity position, together with the generation of DNOI of $0.53 per share, enabled the board to declare dividend distributions of $0.66 per share in 2011.
Notwithstanding the success of our 2011 monetization efforts and the solid performance of the majority of our investment portfolio, continued valuation adjustments to our largest control investment, Broadview, and valuation adjustments to certain other legacy investments resulted in a reported loss of $93.1 million for 2011. These losses, together with our limited access to debt and equity markets, have currently restricted our origination liquidity sources to our existing SBIC facility and unencumbered cash.
On October 31, 2011, Richard W. Neu, Chairman of our board of directors was elected as chief executive officer, succeeding Steven F. Tunney, Sr. who resigned in order to pursue other interests. Additionally, B. Hagen Saville, previously the Company’s Executive Vice President of Business Development and a member of our board of directors, was appointed President and Chief Operating Officer.
OUTLOOK
Under the direction of Messrs. Neu and Saville, MCG took a fresh look at how to prudently and expeditiously return the Company to its roots as a strong middle market debt lender. As part of that undertaking, every aspect of the Company was examined under the assumption that our legacy equity positions wind down over the course of 2012 and with the fundamental goal of simplifying operations.
This transition is consistent with the desire to create a company with less credit and leverage risk yet one that has a sustainable and predictable level of NOI and dividend generation. The transition also addresses the potential impact of an expected reduction, over the next several years, of the size of our investment portfolio as our existing secondary market funding facilities contractually wind down.
We are substantially complete with our process review. Relative to our fourth quarter annualized general and administrative costs, excluding costs related to the resignation of Mr. Tunney, we have identified non-
34
Table of Contents
compensation cost reduction opportunities of approximately $4.5 million to $5.5 million per annum which, when fully implemented, we believe will target a non-compensation cost structure of approximately $5.5 million to $6.5 million. We expect these cost reductions to be embedded in our non-compensation general and administrative costs by no later than the end of the first quarter of 2013, which is when the lease on our current headquarters facility expires.
In addition to our process review, and taking into consideration the anticipated wind down of our legacy equity positions and current secondary market funding facilities, we undertook a comprehensive review of our current work force and structure. This review encompassed a benchmark review against internally managed peers together with a skill assessment of our current personnel. It was undertaken with the intended fundamental principle of allowing no degradation to the Company’s existing risk management profile.
As a result of this review, we would anticipate our current work force of 37 employees will transition to a level of 20 to 25 by year end 2012. This reduction in force is intended to generate a targeted future base compensation and benefits level of approximately $4.0 million to $5.0 million beginning in 2013.
As we enter 2013 and begin to realize the expected benefits of the initiatives discussed above, we are forecasting NOI of approximately $0.50 per share to $0.60 per share. In effect, the anticipated cost savings of approximately $8.5 million to $10.5 million, together with the earnings benefits from projected monetizations and proposed conversions of legacy equity investments to debt instruments, are intended to provide a substantial offset to the earnings reduction attributable to the significant deleveraging of our balance sheet.
In arriving at this forecast, a number of assumptions are required which, if incorrect, could materially change the results of our forecast, including potential monetizations and proposed conversions. However, we have assumed no incremental debt or equity issuances as we clearly recognize that the primary path to future debt and equity support from investors, at economic levels, is through the stabilization of our investment portfolio.
With respect to 2012, we are anticipating to incur non-recurring costs of approximately $0.10 per share to $0.15 per share, primarily associated with expected severance costs, the previously announced amendment of our SunTrust Warehouse facility, the early retirement of our private placement notes and other transitional costs. Excluding these costs, we are forecasting NOI of approximately $0.40 per share to $0.50 per share.
Recognizing the one time nature of the 2012 transitory costs, our strong liquidity position, and the importance of dividends to our investor base, we have committed to a dividend declaration level of $0.14 per share for the next two quarters. Accordingly, we will pay a $0.17 per share dividend in May 2012 followed by a $0.14 per share dividend in both July and October 2012. Such payments are expected to include a return of capital.
Lastly, as previously announced on January 17, 2012, we are authorized to repurchase shares of our common stock, up to $35 million, in open market transactions, including through block purchases, depending on prevailing market conditions and other factors. As of March 1, 2012, no shares have been repurchased.
OVERVIEW OF RESULTS OF OPERATIONS
There were a number of indicators of modest growth in the United States’ economy during 2011. However, certain leading and lagging indicators suggest continuing volatility and economic instability. Our financial and operating results, including those of a number of our portfolio companies, continue to be affected by the weakness and volatility of certain segments of the economy.
During the year ended December 31, 2011, we reported a net loss of $93.1 million, or $1.22 per diluted share, compared to a net loss of $13.1 million, or $0.17 per diluted share, during the year ended December 31, 2010. This increase in net loss resulted primarily from a $75.1 million increase in net investment loss.
Our net operating income during the year ended December 31, 2011 was $37.7 million, or $0.49 per diluted share, compared to $40.6 million, or $0.54 per diluted share, during the year ended December 31, 2010. This $2.9 million, or 7.2%, decrease in our operating income from the comparable period in 2010 reflects a $3.9 million, or 4.3%, decrease in total revenue offset by a decrease in total operating expense by $1.0 million, or 2.0%. The decrease in total revenue primarily resulted from a $5.5 million, or 7.2%, decrease in interest income reflecting a 133 basis-point decrease in our spread to LIBOR partially offset by increases in our loan fee income and advisory fee income.
The decrease in total operating expense resulted primarily from a decrease in compensation expense by $6.5 million, or 31.7%, primarily due to a decrease in employee compensation and the timing of the recognition of certain stock-based compensation. In addition, interest expense decreased by $1.3 million, or 7.4%, due to a narrowing of the interest rate spread and a decrease in the average borrowing balance from 2010 compared to 2011. The decreases in compensation and interest expense were partially offset by $4.3 million in restructuring
35
Table of Contents
expense and a $2.5 million, or 22.1%, increase in general and administrative expense primarily due to severance costs related to the resignation of our former CEO and higher professional fees related to portfolio litigation and other corporate initiatives. In the fourth quarter of 2011, we recognized $2.7 million of expenses related to the resignation of our former chief executive officer consisting of $2.3 million recognized in general and administrative expense and $0.4 million recognized in amortization of employee restricted stock.
During the year ended December 31, 2011, we recorded net investment losses of $129.9 million, which primarily resulted from a $92.1 million decrease in the fair value of our investment in Broadview. Broadview, a public registrant, is a competitive local exchange carrier, or CLEC. We recorded $92.1 million of unrealized depreciation on our Broadview investment primarily to reflect, among other factors, continuing challenges in the bond market, a downgrade of Broadview’s corporate credit rating, delays by Broadview in refinancing its debt, as well as the near-term maturities of Broadview’s debt facilities. As of September 30, 2011, Broadview had $17.1 million of borrowings outstanding under its revolving credit facility, which becomes payable on June 1, 2012. In addition, as of September 30, 2011, Broadview had $301.4 million of outstanding senior secured notes, which will mature on September 1, 2012. If Broadview is unable to refinance these debt facilities by their respective maturity dates, the value of our portfolio investment in Broadview could decline by up to the remaining fair value at December 31, 2011, and we may be required to recognize additional unrealized depreciation on this investment. During the year ended December 31, 2011, we also recorded $28.8 million of unrealized depreciation on our investment in Jet Plastica Investors, LLC, or Jet Plastica, to reflect a decrease in that company’s operating performance.
A more detailed discussion of our results of operations for the year ended December 31, 2011 begins on page 44.
ACCESS TO CAPITAL AND LIQUIDITY
The availability of debt and equity capital continues to be constrained. We believe that we will continue to be constrained by the limited access we have to debt and equity capital. Because our stock continues to trade below net asset value, or NAV, and we do not have stockholder approval to sell equity below our NAV, we effectively lack access to the equity markets. Lenders, in general, may be reluctant to extend credit to us without such equity capital markets access.
As of December 31, 2011, we had $58.6 million of cash and cash equivalents available for general corporate purposes as well as $28.2 million of cash in restricted accounts related to our SBIC that we could use to fund new investments and $6.8 million of restricted cash held in escrow. In addition, we had $40.3 million of cash in securitization accounts, including $25.2 million in our Commercial Loan Trust 2006-1 that may only be used to make interest and principal payments on our securitized borrowings or distributions to MCG in accordance with the indenture agreement. In January 2012, we used $19.5 million of securitized cash to repay borrowings of our Commercial Loan Trust 2006-1. In addition, cash in securitization accounts included $15.1 million in our Commercial Loan Funding Trust that may only be used to make interest and principal payments on our securitized borrowings under the SunTrust Warehouse facility. In January 2012, we used $4.8 million to repay outstanding borrowings of our Commercial Loan Funding Trust, and this facility entered a 24-month amortization period with a final legal maturity in January 2014. All future principal collections by the Commercial Loan Funding Trust will be used to reduce the balance of the outstanding advances under this facility. The reinvestment period for Commercial Loan Trust 2006-1 ended on July 20, 2011 and all subsequent principal collections received will be used to repay the securitized debt.
In January 2011, the United States Small Business Administration, or SBA, increased its total commitment for potential borrowings from $130.0 million to $150.0 million. As of December 31, 2011, $128.6 million of SBA borrowings were outstanding, and in January 2012, we borrowed the remaining $21.4 million available under this facility in our wholly owned subsidiary, Solutions Capital.
In March 2011, we formed Solutions Capital II, L.P., and in May 2011, we submitted a license application to the SBA for a second SBIC license under Solutions Capital II, L.P. After discussions with the SBA, we elected to withdraw our application for a second license until the SBA has an opportunity to evaluate, among other things, the organizational impact of our recent restructuring and changes in management. We may seek to re-file our application for a second license in the future. There is no assurance that, if filed, the SBA will grant the additional license.
Portfolio Composition and Investment Activity
As of December 31, 2011, the fair value of our investment portfolio was $741.2 million, which represents a $268.5 million, or 26.6%, decrease from the $1,009.7 million fair value as of December 31, 2010. The following sections describe the composition of our investment portfolio as of December 31, 2011 and 2010 and describe key changes in our portfolio during 2011 and 2010.
36
Table of Contents
The following table summarizes the composition of our investment portfolio at fair value:
| December 31, 2011 | December 31, 2010 | |||||||||||||||
| (dollars in thousands) |
Investments at Fair Value |
Percent of Total Portfolio |
Investments at Fair Value |
Percent of Total Portfolio |
||||||||||||
| Debt investments |
||||||||||||||||
| Senior secured debt |
$ | 492,488 | 66.4 | % | $ | 555,667 | 55.0 | % | ||||||||
| Subordinated debt |
||||||||||||||||
| Secured |
124,289 | 16.8 | 190,309 | 18.9 | ||||||||||||
| Unsecured |
12,203 | 1.7 | 12,321 | 1.2 | ||||||||||||
|
|
|
|
|
|
|
|
|
|||||||||
| Total debt investments |
628,980 | 84.9 | 758,297 | 75.1 | ||||||||||||
|
|
|
|
|
|
|
|
|
|||||||||
| Equity investments |
||||||||||||||||
| Preferred equity |
89,931 | 12.1 | 218,690 | 21.7 | ||||||||||||
| Common/common equivalents equity |
22,255 | 3.0 | 32,718 | 3.2 | ||||||||||||
|
|
|
|
|
|
|
|
|
|||||||||
| Total equity investments |
112,186 | 15.1 | 251,408 | 24.9 | ||||||||||||
|
|
|
|
|
|
|
|
|
|||||||||
| Total investments |
$ | 741,166 | 100.0 | % | $ | 1,009,705 | 100.0 | % | ||||||||
|
|
|
|
|
|
|
|
|
|||||||||
Our debt instruments bear contractual interest rates ranging from 2.5% to 17.5%, a portion of which may be in the form of paid in kind interest, or PIK. As of December 31, 2011, approximately 88.2% of the fair value of our loan portfolio had variable interest rates, based on a LIBOR benchmark or the prime rate, and 11.8% of the fair value of our loan portfolio had fixed interest rates. As of December 30, 2011, approximately 79.2% of our loan portfolio, at fair value, had LIBOR floors between 1.0% and 3.0% on a LIBOR based index and prime floors between 1.75% and 6.0%. At origination, our loans generally have four- to eight-year stated maturities. Borrowers typically pay an origination fee based on a percentage of the total commitment and a fee on undrawn commitments.
37
Table of Contents
The following table summarizes our investment portfolio by industry at fair value:
| December 31, 2011 | December 31, 2010 | |||||||||||||||
| (dollars in thousands) |
Investments at Fair Value |
Percent of Total Portfolio |
Investments at Fair Value |
Percent of Total Portfolio |
||||||||||||
| Healthcare |
$ | 84,660 | 11.4 | % | $ | 76,358 | 7.6 | % | ||||||||
| Business services |
78,468 | 10.6 | 87,897 | 8.7 | ||||||||||||
| Manufacturing |
77,849 | 10.5 | 54,178 | 5.4 | ||||||||||||
| Education |
69,124 | 9.3 | 43,704 | 4.3 | ||||||||||||
| Cable |
43,122 | 5.8 | 92,467 | 9.2 | ||||||||||||
| Communications |
34,507 | 4.7 | 150,907 | 14.9 | ||||||||||||
| Logistics |
33,684 | 4.5 | 28,036 | 2.8 | ||||||||||||
| Electronics |
31,966 | 4.3 | 30,409 | 3.0 | ||||||||||||
| Publishing |
31,319 | 4.2 | 22,543 | 2.2 | ||||||||||||
| Food services |
28,842 | 3.9 | 73,407 | 7.3 | ||||||||||||
| Broadcasting |
28,185 | 3.8 | 53,996 | 5.3 | ||||||||||||
| Insurance |
24,987 | 3.4 | 24,993 | 2.5 | ||||||||||||
| Technology |
24,690 | 3.3 | 35,327 | 3.5 | ||||||||||||
| Plastic products |
21,784 | 2.9 | 33,633 | 3.3 | ||||||||||||
| Information services |
21,672 | 2.9 | 17,940 | 1.8 | ||||||||||||
| Repair services |
19,839 | 2.7 | — | — | ||||||||||||
| Auto parts |
19,778 | 2.7 | 16,959 | 1.7 | ||||||||||||
| Restaurants |
18,578 | 2.5 | 11,150 | 1.1 | ||||||||||||
| Home furnishings |
12,355 | 1.7 | 17,151 | 1.7 | ||||||||||||
| Agriculture |
9,464 | 1.3 | 8,418 | 0.8 | ||||||||||||
| Cosmetics |
8,521 | 1.2 | — | — | ||||||||||||
| Entertainment |
7,539 | 1.0 | 11,782 | 1.2 | ||||||||||||
| Diversified financial services |
2,207 | 0.3 | 12,489 | 1.2 | ||||||||||||
| Leisure activities |
— | — | 32,216 | 3.2 | ||||||||||||
| Sporting goods |
— | — | 42,886 | 4.2 | ||||||||||||
|
Other(a) |
8,026 | 1.1 | 30,859 | 3.1 | ||||||||||||
|
|
|
|
|
|
|
|
|
|||||||||
| Total |
$ | 741,166 | 100.0 | % | $ | 1,009,705 | 100.0 | % | ||||||||
|
|
|
|
|
|
|
|
|
|||||||||
| (a) | No individual industry within this category exceeds 1%. |
As of December 31, 2011, our ten largest portfolio companies represented approximately 40.8% of the total fair value of our investments. These ten companies accounted for 34.7% of our total revenue during the year ended December 31, 2011.
During the year ended December 31, 2011, we had concentrations in certain industries, including the healthcare, business services and manufacturing industries. In addition, during the year ended December 31, 2010, we had a concentration in the communications industry. The following table summarizes our fair value and revenue concentrations in each of those industries:
| Investments at fair value | Revenue for the year ended | |||||||||||||||||||||||||||||||
| As of December 31, 2011 | As of December 31, 2010 | December 31, 2011 | December 31, 2010 | |||||||||||||||||||||||||||||
| (dollars in thousands) |
Amount | % of Total Portfolio |
Amount | % of Total Portfolio |
Amount | % of Total Revenue |
Amount | % of Total Revenue |
||||||||||||||||||||||||
| Industry |
||||||||||||||||||||||||||||||||
| Healthcare |
$ | 84,660 | 11.4 | % | $ | 76,358 | 7.6 | % | $ | 10,926 | 12.7 | % | $ | 10,754 | 12.0 | % | ||||||||||||||||
| Business services |
78,468 | 10.6 | 87,897 | 8.7 | 9,967 | 11.6 | 6,233 | 7.0 | ||||||||||||||||||||||||
| Manufacturing |
77,849 | 10.5 | 54,178 | 5.4 | 5,754 | 6.7 | 657 | 0.7 | ||||||||||||||||||||||||
| Communications(a) |
34,507 | 4.7 | 150,907 | 14.9 | 2,893 | 3.4 | 3,957 | 4.4 | ||||||||||||||||||||||||
| (a) | Includes Broadview, which represented $10.9 million, or 1.5%, and $103.0 million, or 10.2%, of the fair value of our investment portfolio as of December 31, 2011 and December 31, 2010, respectively. |
38
Table of Contents
CHANGES IN INVESTMENT PORTFOLIO
During the year ended December 31, 2011, we completed $284.9 million of originations and advances, including originations to 15 new portfolio companies and originations and advances to 22 existing portfolio companies, compared to $320.3 million of originations and advances during the year ended December 31, 2010. The following table summarizes our total portfolio investment activity during the years ended December 31, 2011 and 2010:
| Years ended December 31, | ||||||||
| (in thousands) |
2011 | 2010 | ||||||
| Beginning investment portfolio |
$ | 1,009,705 | $ | 986,346 | ||||
| Originations and advances |
284,864 | 320,267 | ||||||
| Gross payments, reductions and sales of securities |
(410,240 | ) | (239,668 | ) | ||||
| Net realized (loss) gain |
(89,798 | ) | 11,756 | |||||
| Net unrealized depreciation |
(122,512 | ) | (52,111 | ) | ||||
| Reversals of unrealized depreciation (appreciation) |
82,428 | (15,279 | ) | |||||
| Origination fees and amortization of unearned income |
(13,281 | ) | (1,606 | ) | ||||
|
|
|
|
|
|||||
| Ending investment portfolio |
$ | 741,166 | $ | 1,009,705 | ||||
|
|
|
|
|
|||||
Originations and Advances
The following table shows our originations and advances during the years ended December 31, 2011 and 2010 by security type:
| Years ended December 31, | ||||||||||||||||
| 2011 | 2010 | |||||||||||||||
| (dollars in thousands) |
Amount | % of Total | Amount | % of Total | ||||||||||||
| Debt investments |
||||||||||||||||
| Senior secured debt |
$ | 236,078 | 82.9 | % | $ | 259,541 | 81.0 | % | ||||||||
| Subordinated debt |
||||||||||||||||
| Secured |
32,351 | 11.3 | 37,490 | 11.7 | ||||||||||||
| Unsecured |
1,953 | 0.7 | 13,240 | 4.2 | ||||||||||||
|
|
|
|
|
|
|
|
|
|||||||||
| Total debt investments |
270,382 | 94.9 | 310,271 | 96.9 | ||||||||||||
|
|
|
|
|
|
|
|
|
|||||||||
| Equity investments |
||||||||||||||||
| Preferred equity |
13,968 | 4.9 | 9,279 | 2.9 | ||||||||||||
| Common/common equivalents equity |
514 | 0.2 | 717 | 0.2 | ||||||||||||
|
|
|
|
|
|
|
|
|
|||||||||
| Total equity investments |
14,482 | 5.1 | 9,996 | 3.1 | ||||||||||||
|
|
|
|
|
|
|
|
|
|||||||||
| Total originations and advances |
$ | 284,864 | 100.0 | % | $ | 320,267 | 100.0 | % | ||||||||
|
|
|
|
|
|
|
|
|
|||||||||
39
Table of Contents
The following table shows our significant originations and advances.
| (in thousands) |
Year ended December 31, 2011 | |||||||||||||||
| Company |
Originations | Draws/Advances | PIK Advances/ Dividends |
Total | ||||||||||||
| Debt |
||||||||||||||||
| Education Management, Inc. |
$ | 25,000 | $ | — | $ | — | $ | 25,000 | ||||||||
| Industrial Safety Technologies, LLC |
22,747 | — | — | 22,747 | ||||||||||||
| Qualawash Holdings, LLC |
20,000 | — | — | 20,000 | ||||||||||||
| Jet Plastica Investors, LLC |
12,000 | 4,250 | 995 | 17,245 | ||||||||||||
| NPS Holding, LLC |
15,273 | 500 | — | 15,773 | ||||||||||||
| Virtual Radiologic Corp. |
14,000 | — | — | 14,000 | ||||||||||||
| West World Media, LLC |
11,250 | — | 114 | 11,364 | ||||||||||||
| Focus Brands, Inc. |
11,000 | — | — | 11,000 | ||||||||||||
| Bentley Systems, Inc. |
10,000 | — | — | 10,000 | ||||||||||||
| Sally Holdings, LLC |
10,000 | — | — | 10,000 | ||||||||||||
| Rita’s Water Ice Franchise Company, LLC |
9,375 | — | — | 9,375 | ||||||||||||
| Data Based Systems International, Inc. |
9,000 | — | 314 | 9,314 | ||||||||||||
| Capstone Logistics, LLC |
— | 8,260 | 201 | 8,461 | ||||||||||||
| BarBri, Inc. |
7,000 | — | — | 7,000 | ||||||||||||
| Chase Doors Holdings, Inc. |
— | 6,652 | — | 6,652 | ||||||||||||
| Georgia-Pacific Corporation |
6,300 | — | — | 6,300 | ||||||||||||
| Tank Intermediate Holding Corp. |
6,000 | — | — | 6,000 | ||||||||||||
| Gans Communications, LP |
6,000 | — | — | 6,000 | ||||||||||||
| Scotsman Industries, Inc. |
5,500 | — | — | 5,500 | ||||||||||||
| Visant Corporation |
5,125 | — | — | 5,125 | ||||||||||||
| Other (< $5 million) |
23,013 | 13,754 | 6,759 | 43,526 | ||||||||||||
|
|
|
|
|
|
|
|
|
|||||||||
| Total debt |
228,583 | 33,416 | 8,383 | 270,382 | ||||||||||||
|
|
|
|
|
|
|
|
|
|||||||||
| Equity (< $5 million) |
7,112 | 25 | 7,345 | 14,482 | ||||||||||||
|
|
|
|
|
|
|
|
|
|||||||||
| Total originations and advances |
$ | 235,695 | $ | 33,441 | $ | 15,728 | $ | 284,864 | ||||||||
|
|
|
|
|
|
|
|
|
|||||||||
Repayments, Sales and Other Reductions of Investment Portfolio
The following table shows our gross payments, sales and other reductions of securities during the years ended December 31, 2011 and 2010 by security type:
| Years ended December 31, | ||||||||||||||||
| 2011 | 2010 | |||||||||||||||
| (dollars in thousands) |
Amount | % of Total | Amount | % of Total | ||||||||||||
| Debt investments |
||||||||||||||||
| Senior secured debt |
$ | 256,928 | 62.6 | % | $ | 88,252 | 36.8 | % | ||||||||
| Subordinated debt |
||||||||||||||||
| Secured |
86,642 | 21.1 | 66,473 | 27.7 | ||||||||||||
| Unsecured |
2,399 | 0.6 | 31,618 | 13.2 | ||||||||||||
|
|
|
|
|
|
|
|
|
|||||||||
| Total debt investments |
345,969 | 84.3 | 186,343 | 77.7 | ||||||||||||
|
|
|
|
|
|
|
|
|
|||||||||
| Equity investments |
||||||||||||||||
| Preferred equity |
61,846 | 15.1 | 27,832 | 11.6 | ||||||||||||
| Common/common equivalents equity |
2,425 | 0.6 | 25,493 | 10.7 | ||||||||||||
|
|
|
|
|
|
|
|
|
|||||||||
| Total equity investments |
64,271 | 15.7 | 53,325 | 22.3 | ||||||||||||
|
|
|
|
|
|
|
|
|
|||||||||
| Total gross payments, sales and other reductions of securities |
$ | 410,240 | 100.0 | % | $ | 239,668 | 100.0 | % | ||||||||
|
|
|
|
|
|
|
|
|
|||||||||
40
Table of Contents
During the years ended December 31, 2011 and 2010, our gross payments, sales and other reductions of securities by transaction type included:
| Years ended December 31, | ||||||||
| (in thousands) |
2011 | 2010 | ||||||
| Principal repayments and loan sales |
$ | 269,092 | $ | 125,035 | ||||
| Scheduled principal amortization |
55,277 | 42,488 | ||||||
| Sale of equity investments |
50,771 | 49,356 | ||||||
| Collection of accrued paid-in-kind interest and dividends |
35,100 | 22,789 | ||||||
|
|
|
|
|
|||||
| Total gross payments, sales and other reductions of securities |
$ | 410,240 | $ | 239,668 | ||||
|
|
|
|
|
|||||
As shown in the following table, during the year ended December 31, 2011, we monetized all, or part of, 33 portfolio investments with proceeds totaling $343.8 million:
| Year ended December 31, 2011 | ||||||||||||||||
| (in thousands) |
Principal Repayments, Amortization, and Loan Sales |
Sale of Equity Investments |
PIK Interest and Dividend Prepayments |
Total | ||||||||||||
| Monetizations |
||||||||||||||||
| Avenue Broadband LLC |
$ | 12,864 | $ | 29,153 | $ | 9,182 | $ | 51,199 | ||||||||
| Restaurant Technologies, Inc. |
35,701 | 1,879 | 8,182 | 45,762 | ||||||||||||
| Superior Industries Investors, LLC |
19,333 | 13,528 | 8,903 | 41,764 | ||||||||||||
| Teleguam Holdings, LLC |
20,000 | — | — | 20,000 | ||||||||||||
| Savvis Communications Corporation |
14,947 | — | — | 14,947 | ||||||||||||
| Equibrand Holding Corporation |
13,080 | — | 1,348 | 14,428 | ||||||||||||
| MLM Holdings, Inc. |
14,355 | — | — | 14,355 | ||||||||||||
| The Telx Group, Inc. |
13,860 | — | — | 13,860 | ||||||||||||
| Maverick Healthcare Equity, LLC |
12,500 | — | 888 | 13,388 | ||||||||||||
| Focus Brands, Inc. |
10,909 | — | — | 10,909 | ||||||||||||
| Chase Doors Holdings, Inc. |
10,206 | — | — | 10,206 | ||||||||||||
| Massage Envy, LLC |
10,054 | — | — | 10,054 | ||||||||||||
| Interactive Data Corporation |
9,950 | — | — | 9,950 | ||||||||||||
| Visant Corporation |
6,983 | — | — | 6,983 | ||||||||||||
| Allen’s T.V. Cable Service, Inc. |
6,480 | 65 | 373 | 6,918 | ||||||||||||
| Provo Craft & Novelty, Inc. |
6,704 | — | — | 6,704 | ||||||||||||
| Georgia-Pacific Corporation |
6,283 | — | — | 6,283 | ||||||||||||
| Knology, Inc. |
6,090 | — | — | 6,090 | ||||||||||||
| Rural/Metro Operating Company, LLC |
5,985 | — | — | 5,985 | ||||||||||||
| Coastal Sunbelt Real Estate, Inc. |
2,000 | 2,171 | 1,084 | 5,255 | ||||||||||||
| Other (< $5 million) |
25,786 | 2,711 | 230 | 28,727 | ||||||||||||
|
|
|
|
|
|
|
|
|
|||||||||
| Total monetizations |
264,070 | 49,507 | 30,190 | 343,767 | ||||||||||||
| Other scheduled payments |
60,299 | 1,264 | 4,910 | 66,473 | ||||||||||||
|
|
|
|
|
|
|
|
|
|||||||||
| Total gross payments, sales and other reductions of investment portfolio |
$ | 324,369 | $ | 50,771 | $ | 35,100 | $ | 410,240 | ||||||||
|
|
|
|
|
|
|
|
|
|||||||||
The proceeds from these monetizations correlated closely with the most recently reported fair value of the associated investments.
41
Table of Contents
Asset Quality
Asset quality is generally a function of portfolio company performance and economic conditions, as well as our underwriting and ongoing management of our investment portfolio. In addition to various risk management and monitoring tools, we use the following investment rating system to characterize and monitor our expected level of returns on each investment in our portfolio:
| Investment Rating |
Summary Description | |
| 1 | Capital gain expected or realized | |
| 2 | Full return of principal and interest or dividend expected with customer performing in accordance with plan | |
| 3 | Full return of principal and interest or dividend expected, but customer requires closer monitoring | |
| 4 | Some loss of interest or dividend expected, but still expect an overall positive internal rate of return on the investment | |
| 5 | Loss of interest or dividend and some loss of principal investment expected, which would result in an overall negative internal rate of return on the investment |
The following table shows the distribution of our investments on our 1 to 5 investment rating scale at fair value as of December 31, 2011 and 2010:
| (dollars in thousands) |
December 31, 2011 | December 31, 2010 | ||||||||||||||||
| Investment |
Investments at Fair Value |
% of Total Portfolio |
Investments at Fair Value |
% of Total Portfolio |
||||||||||||||
| 1 |
$ | 283,755 | (a) | 38.3 | % | $ | 330,605 | (a) | 32.7 | % | ||||||||
| 2 |
290,583 | 39.2 | 370,694 | 36.7 | ||||||||||||||
| 3 |
142,639 | 19.2 | 173,447 | 17.2 | ||||||||||||||
| 4(b) |
11,683 | 1.6 | 112,811 | 11.2 | ||||||||||||||
| 5(c) |
12,506 | 1.7 | 22,148 | 2.2 | ||||||||||||||
|
|
|
|
|
|
|
|
|
|||||||||||
| Total |
$ | 741,166 | 100.0 | % | $ | 1,009,705 | 100.0 | % | ||||||||||
|
|
|
|
|
|
|
|
|
|||||||||||
| (a) | As of December 31, 2011 and 2010, Investment Rating “1” included $109.1 million and $112.2 million, respectively, of loans to companies in which we also hold equity securities. |
| (b) | During 2011, approximately $103.0 million of the reduction in Investment Rating 4 assets resulted from the reclassification of our investment in Broadview from Investment Rating 4 to Investment Rating 5. |
| (c) | Approximately $103.0 million of the increase in Investment Rating 5 assets resulted from the reclassification of our investment in Broadview from Investment Rating 4 to Investment Rating 5. This increase was partially offset by a $92.1 million decrease in the fair value of Broadview from December 31, 2010 to December 31, 2011. |
When one of our loans becomes more than 90 days past due, or if we otherwise do not expect the customer to be able to service its debt and other obligations, we will, as a general matter, place the loan on non-accrual status and generally will cease recognizing interest income on that loan until all principal and interest have been brought current through payment or due to a restructuring such that the interest income is deemed to be collectible. However, we may make exceptions to this policy if the loan has sufficient collateral value and is in the process of collection. If the fair value of a loan is below cost, we may cease recognizing PIK interest and/or the accretion of a discount on the debt investment until such time that the fair value equals or exceeds cost.
42
Table of Contents
The following table summarizes the cost and fair value of loans more than 90 days past due and loans on non-accrual status:
| COST BASIS | FAIR VALUE BASIS | |||||||||||||||||||||||||||||||
| December 31, 2011 | December 31, 2010 | December 31, 2011 | December 31, 2010 | |||||||||||||||||||||||||||||
| (dollars in thousands) |
Investments at Cost |
% of
Loan Portfolio |
Investments at Cost |
% of
Loan Portfolio |
Investments at Fair Value |
% of
Loan Portfolio |
Investments at Fair Value |
% of
Loan Portfolio |
||||||||||||||||||||||||
| Loans greater than 90 days past due |
||||||||||||||||||||||||||||||||
| On non-accrual status(a) |
$ | 13,963 | 2.00 | % | $ | 10,388 | 1.18 | % | $ | 9,615 | 1.53 | % | $ | 6,157 | 0.81 | % | ||||||||||||||||
| Not on non-accrual status |
— | — | — | — | — | — | — | — | ||||||||||||||||||||||||
|
|
|
|
|
|
|
|
|
|
|
|
|
|
|
|
|
|||||||||||||||||
| Total loans greater than 90 days past due(a) |
$ | 13,963 | 2.00 | % | $ | 10,388 | 1.18 | % | $ | 9,615 | 1.53 | % | $ | 6,157 | 0.81 | % | ||||||||||||||||
|
|
|
|
|
|
|
|
|
|
|
|
|
|
|
|
|
|||||||||||||||||
| Loans on non-accrual status(a) |
||||||||||||||||||||||||||||||||
| 0 to 90 days past due |
$ | 69,241 | 9.92 | % | $ | 128,989 | 14.69 | % | $ | 9,704 | 1.54 | % | $ | 19,835 | 2.62 | % | ||||||||||||||||
| Greater than 90 days past due |
13,963 | 2.00 | 10,388 | 1.18 | 9,615 | 1.53 | 6,157 | 0.81 | ||||||||||||||||||||||||
|
|
|
|
|
|
|
|
|
|
|
|
|
|
|
|
|
|||||||||||||||||
| Total loans on non-accrual status(a) |
$ | 83,204 | 11.92 | % | $ | 139,377 | 15.87 | % | $ | 19,319 | 3.07 | % | $ | 25,992 | 3.43 | % | ||||||||||||||||
|
|
|
|
|
|
|
|
|
|
|
|
|
|
|
|
|
|||||||||||||||||
| (a) | The year-over-year change in total loans on non-accrual status primarily reflects our sales of, or repayments from, Active Brands International, Inc., Vox Communications Group Holdings, LLC, PremierGarage Holdings, LLC and Intran Media, LLC, as well as the write-off of our investment in Total Sleep Holdings, Inc. during the year ended December 31, 2011. Our investments in the debt issued by these portfolio companies were on non-accrual status as of December 31, 2010. Upon the sales and write-off of these investments, we reversed the previously unrealized depreciation and recorded realized losses. |
The following table summarizes the changes in the cost and fair value of the loans on non-accrual status from December 31, 2010 through December 31, 2011:
| Year ended December 31, 2011 | ||||||||
| (In thousands) |
Cost | Fair Value | ||||||
| Non-accrual loan balance as of December 31, 2010 |
$ | 139,377 | $ | 25,992 | ||||
|
|
|
|
|
|||||
| Additional loans on non-accrual status |
||||||||
| Plastic products |
14,914 | 9,145 | ||||||
| Other Media |
9,247 | 4,235 | ||||||
|
|
|
|
|
|||||
| Total additional loans on non-accrual status |
24,161 | 13,380 | ||||||
| Advances to companies on non-accrual status |
9,543 | 9,543 | ||||||
| Loans converted to equity |
(5,904 | ) | (5,904 | ) | ||||
| Payments received on loans on non-accrual status |
(9,447 | ) | (9,447 | ) | ||||
| Change in valuation of loans on non-accrual status |
— | (9,039 | ) | |||||
| Reversal of previously recognized unrealized loss on non-accrual loans |
— | 69,320 | (a) | |||||
| Realized loss on non-accrual loans |
(74,526 | )(a) | (74,526 | )(a) | ||||
|
|
|
|
|
|||||
| Total change in non-accrual loans |
(56,173 | ) | (6,673 | ) | ||||
|
|
|
|
|
|||||
| Non-accrual loan balance as of December 31, 2011 |
$ | 83,204 | $ | 19,319 | ||||
|
|
|
|
|
|||||
| (a) | Primarily reflects the sales of or repayments from Active Brands International, Inc., PremierGarage Holdings, LLC, Intran Media, LLC and Vox Communications Group Holdings, LLC, as well as the write-off of our investment in Total Sleep Holdings, Inc. during the year ended December 31, 2011. Our investments in the debt issued by these portfolio companies were on non-accrual status as of December 31, 2010. Upon the sales and write-off of these investments, we reversed the previously unrealized depreciation and recorded realized losses. |
43
Table of Contents
RESULTS OF OPERATIONS
The following section compares our results of operations for the year ended December 31, 2011 compared to 2010.
COMPARISON OF THE YEARS ENDED DECEMBER 31, 2011 AND 2010
The following table summarizes the components of our net loss for the years ended December 31, 2011 and 2010.
| Years ended December 31, | Variance | |||||||||||||||
| (dollars in thousands) |
2011 | 2010 | $ | Percentage | ||||||||||||
| Revenue |
||||||||||||||||
| Interest and dividend income |
||||||||||||||||
| Interest income |
$ | 71,133 | $ | 76,625 | $ | (5,492 | ) | (7.2 | )% | |||||||
| Dividend income |
7,344 | 7,368 | (24 | ) | (0.3 | ) | ||||||||||
| Loan fees |
3,731 | 2,536 | 1,195 | 47.1 | ||||||||||||
|
|
|
|
|
|
|
|||||||||||
| Total interest and dividend income |
82,208 | 86,529 | (4,321 | ) | (5.0 | ) | ||||||||||
| Advisory fees and other income |
3,488 | 3,040 | 448 | 14.7 | ||||||||||||
|
|
|
|
|
|
|
|||||||||||
| Total revenue |
85,696 | 89,569 | (3,873 | ) | (4.3 | ) | ||||||||||
|
|
|
|
|
|
|
|||||||||||
| Operating expenses |
||||||||||||||||
| Interest expense |
15,634 | 16,891 | (1,257 | ) | (7.4 | ) | ||||||||||
| Employee compensation |
||||||||||||||||
| Salaries and benefits |
11,998 | 16,275 | (4,277 | ) | (26.3 | ) | ||||||||||
| Amortization of employee restricted stock |
2,081 | 4,342 | (2,261 | ) | (52.1 | ) | ||||||||||
|
|
|
|
|
|
|
|||||||||||
| Total employee compensation |
14,079 | 20,617 | (6,538 | ) | (31.7 | ) | ||||||||||
| General and administrative expense |
14,036 | 11,495 | 2,541 | 22.1 | ||||||||||||
| Restructuring expense |
4,289 | 1 | 4,288 | NM | ||||||||||||
|
|
|
|
|
|
|
|||||||||||
| Total operating expenses |
48,038 | 49,004 | (966 | ) | (2.0 | ) | ||||||||||
|
|
|
|
|
|
|
|||||||||||
| Net operating income before net investment loss, (loss) gain on extinguishment of debt and income tax provision |
37,658 | 40,565 | (2,907 | ) | (7.2 | ) | ||||||||||
| Net investment loss before income tax provision |
(129,873 | ) | (54,819 | ) | (75,054 | ) | NM | |||||||||
| (Loss) gain on extinguishment of debt before income tax provision |
(863 | ) | 2,983 | (3,846 | ) | NM | ||||||||||
| Income tax provision |
37 | 1,801 | (1,764 | ) | (97.9 | ) | ||||||||||
|
|
|
|
|
|
|
|||||||||||
| Net loss |
$ | (93,115 | ) | $ | (13,072 | ) | $ | (80,043 | ) | NM | ||||||
|
|
|
|
|
|
|
|||||||||||
NM=Not Meaningful
TOTAL REVENUE
Total revenue includes interest and dividend income and advisory fees and other income. During 2011, our total revenue was $85.7 million, which represents a $3.9 million, or 4.3%, decrease from 2010. This decline was composed primarily of a $5.5 million, or 7.2%, decrease in interest income, partially offset by a $1.2 million, or 47.1%, increase in loan fees income; and a $0.4 million, or 14.7%, increase in advisory fees and other income. The following sections describe the reasons for the variances in each major component of our revenue during the year ended December 31, 2011.
INTEREST INCOME
The level of interest income that we earn depends upon the level of interest-bearing investments outstanding during the period, as well as the weighted-average yield on these investments. During 2011, the total yield on our average debt portfolio at fair value was 10.7% compared to 11.7% during 2010. The weighted-average yield varies each period because of changes in the composition of our portfolio of debt investments, changes in stated interest rates, fee accelerations of unearned fees on paid/restructured loans and the balance of loans on non-accrual status for which we are not accruing interest.
44
Table of Contents
The following table shows the various components of the total yield on our average debt portfolio at fair value for the years ended December 31, 2011 and 2010:
| Years ended December 31, | ||||||||
| 2011 | 2010 | |||||||
| Average 90-day LIBOR |
0.3 | % | 0.3 | % | ||||
| Spread to average LIBOR on average loan portfolio |
10.7 | 12.1 | ||||||
| Impact of fee accelerations of unearned fees on paid/restructured loans |
0.3 | 0.1 | ||||||
| Impact of non-accrual loans |
(0.6 | ) | (0.8 | ) | ||||
|
|
|
|
|
|||||
| Total yield on average loan portfolio |
10.7 | % | 11.7 | % | ||||
|
|
|
|
|
|||||
During 2011 interest income was $71.1 million, compared to $76.6 million during 2010, which represented a $5.5 million, or 7.2%, decrease. This decrease reflected a $7.1 million decrease in interest income resulting from a 133 basis-point decrease in our spread to LIBOR and a $1.3 million decrease resulting from the net impact of loans that were on non-accrual status during 2011 that were accruing interest during 2010. These decreases were partially offset by a $2.0 million increase resulting from a 3.3% rise in our average loan balance and a $0.9 million increase in interest income resulting from the impact of interest rate floors.
PIK Income
Interest income includes certain amounts that we have not received in cash, such as PIK interest. PIK interest represents contractually deferred interest that is added to the principal balance of the loan and compounded if not paid on a current basis. PIK may be prepaid by either contract or the portfolio company’s choice, but generally is paid at the end of the loan term. The following table shows the PIK-related activity for 2011 and 2010, at cost:
| Years ended December 31, | ||||||||
| (in thousands) |
2011 | 2010 | ||||||
| Beginning PIK loan balance |
$ | 30,923 | $ | 33,436 | ||||
| PIK interest earned during the period |
7,794 | 12,652 | ||||||
| Interest receivable converted to PIK |
590 | 3,736 | ||||||
| Payments received from PIK loans |
(21,600 | ) | (18,819 | ) | ||||
| PIK converted to other securities |
(877 | ) | (82 | ) | ||||
| Realized loss |
(1,177 | ) | — | |||||
|
|
|
|
|
|||||
| Ending PIK loan balance |
$ | 15,653 | $ | 30,923 | ||||
|
|
|
|
|
|||||
As of December 31, 2011 and 2010, we were not accruing interest on $8.9 million and $7.4 million, respectively, of the PIK loans, at cost, shown in the preceding table.
DIVIDEND INCOME
We accrete dividends on equity investments with stated dividend rates as they are earned, to the extent that we believe the dividends will be paid ultimately and the associated portfolio company has sufficient value to support the accretion. We recognize dividends on our other equity investments when we receive the dividend payment. Our dividend income varies from period to period because of changes in the size and composition of our equity investments, the yield from the investments in our equity portfolio and the ability of the portfolio companies to declare and pay dividends.
The following table summarizes our dividend activity for 2011 and 2010:
| Years ended December 31, | ||||||||
| (in thousands) |
2011 | 2010 | ||||||
| Beginning accrued dividend balance |
$ | 90,981 | $ | 88,898 | ||||
| Dividend income earned during the period |
7,344 | 7,368 | ||||||
| Dividend collections |
(13,500 | )(a) | (3,970 | ) | ||||
| Realized loss |
(113 | ) | (1,315 | ) | ||||
|
|
|
|
|
|||||
| Ending accrued dividend balance |
$ | 84,712 | $ | 90,981 | ||||
|
|
|
|
|
|||||
| (a) | Includes $11.0 million of dividends collected through the sales of our equity investments in Avenue Broadband, LLC and Superior Industries, Inc. |
45
Table of Contents
LOAN FEES
Loan fees include origination fees on loans that we defer and amortize into interest income over the life of the loan. When repayments or restructurings with major modifications occur, we accelerate the recognition of previously unamortized loan origination fees into loan income. These accelerations have the effect of increasing current period income and may reduce future amortizable income. During 2011, our loan fees increased $1.2 million, or 47.1%, compared to 2010. This increase was primarily attributable to the acceleration of previously unamortized loan origination fees into loan income as a result of higher loan repayments during 2011.
ADVISORY FEES AND OTHER INCOME
Advisory fees and other income primarily include fees related to advisory and management services, equity structuring fees, syndication fees, prepayment fees, bank interest and other income. Generally, advisory fees and other income relate to specific transactions or services and, therefore, may vary from period to period depending on the level and types of services provided. During 2011, we earned $3.5 million of advisory fees and other income, which represented a $0.4 million, or 14.7%, increase from 2010. This increase primarily represents increases in advisory fees and prepayment penalties.
TOTAL OPERATING EXPENSES
Total operating expenses include interest, employee compensation and general and administrative expense. During 2011, we incurred $48.0 million of operating expenses, representing a $1.0 million, or 2.0%, decrease from the same period in the prior year. This decrease was composed of a $6.5 million decrease in employee compensation expense and a $1.3 million decrease in interest expense partially offset by a $4.3 million increase in restructure expense and a $2.5 million increase in general and administrative expense. The reasons for these variances are discussed in more detail below.
INTEREST EXPENSE
During 2011, we incurred $15.6 million of interest expense, which represented a $1.3 million, or 7.4%, decrease from 2010. A narrowing of the interest rate spread from 2.33% during 2010 to 2.15% during 2011 caused interest expense to decrease by $1.0 million. Interest expense also decreased $0.6 million as a result of a reduction in the average borrowing balance during 2011 compared to 2010. These decreases in interest expense were offset by a $0.3 million increase in interest expense related to amortization of deferred debt issuance costs.
EMPLOYEE COMPENSATION
Employee compensation expense includes base salaries and benefits, variable annual incentive compensation and amortization of employee stock awards. During 2011, our employee compensation expense was $14.1 million, which represented a $6.5 million, or 31.7%, decrease from 2010. Our salaries and benefits decreased by $4.3 million, or 26.3%, primarily due to a $3.2 million decrease in incentive compensation and a $1.0 million decrease in salaries, which primarily resulted from a 42% reduction in our workforce that occurred as part of the corporate restructuring that we implemented during 2011.
During 2011, we recognized $2.1 million of compensation expense related to restricted stock awards, compared to $4.3 million for 2010, which represented a $2.3 million, or 52.1%, decrease. Included in the 2011 amortization of employee restricted stock was $0.4 million of amortization expenses associated with Mr. Tunney’s resignation. The lapsing of forfeiture provisions for previously awarded restricted stock accounted for the reduction in amortization of employee restricted stock. Issuance of restricted stock under the 2009 Long-Term Incentive Plan, or LTIP, was contingent upon the closing price of MCG’s stock meeting certain price thresholds and the approval of the compensation committee of our board of directors. We achieved the final price threshold for which restricted stock could be issued during 2011, resulting in the issuance of 86,500 shares of restricted common stock and the award of $1.0 million to LTIP participants.
On August 1, 2011, our board of directors approved the MCG Capital Corporation 2011 Retention Program, or the Retention Program, for the benefit of our employees. We designed the Retention Program to provide eligible employees with certain incentives related to their past service and continuing employment with MCG. The Retention Program consisted of an aggregate of $1.3 million in cash and up to 121,250 shares of restricted common stock.
Under the Retention Program, we awarded a cash bonus to eligible employees, representing a specified percentage of each eligible employee’s respective annual cash bonus target for the fiscal year ending December 31, 2011. We will pay the incentive bonus to eligible employees in two equal installments on each of March 31, 2012 and
46
Table of Contents
September 30, 2012, subject to continued employment with MCG. Certain employees also received shares of restricted common stock under the MCG Capital Corporation 2006 Employee Restricted Stock Plan, as amended, or the 2006 Plan. The forfeiture provisions with respect to 50% of the shares of restricted common stock subject to each retention stock award will lapse on each of March 31, 2012 and September 30, 2012.
GENERAL AND ADMINISTRATIVE
During 2011, general and administrative expense was $14.0 million, which represented a $2.5 million, or 22.1%, increase from 2010. During the three months ending December 31, 2011, we recognized $2.3 million of severance and other expenses associated with Mr. Tunney’s resignation. In addition, professional fees increased $1.3 million from 2010 resulting from portfolio-related litigation and other corporate initiatives in 2011. These increases were partially offset by $0.9 million of fees paid in the second quarter of 2010 related to the contested election of directors to our board of directors at our 2010 Annual Meeting.
RESTRUCTURING
We are restructuring our business to simplify our organizational structure, refine operations and reduce annual operating expenses. On August 1, 2011, our board of directors approved a plan to reduce our workforce by 42%, including 22 current employees and 5 resignations. As of December 31, 2011, we had 37 employees. Affected employees were eligible to receive severance pay, continuation of benefits and, for employees who previously had been awarded restricted stock, additional lapsing of restrictions associated with restricted stock awards.
We estimate that the aggregate charges associated with the plan will total $4.3 million to $4.4 million. These estimated costs primarily reflect severance pay and related obligations. During 2011, we incurred $4.3 million of restructuring expenses. During 2012 and 2013, we expect to record restructuring charges of $80,000 associated with the August 2011 workforce reduction, which represent the accretion costs of severance benefits.
NET OPERATING INCOME BEFORE NET INVESTMENT LOSS, (LOSS) GAIN ON EXTINGUISHMENT OF DEBT AND INCOME TAX PROVISION (BENEFIT)
Net operating income before investment loss, (loss) gain on extinguishment of debt and income tax provision (benefit) for the year ended December 31, 2011 totaled $37.7 million, compared with $40.6 million for the year ended December 31, 2010. This increase is due to the items discussed above.
47
Table of Contents
DISTRIBUTABLE NET OPERATING INCOME
Distributable net operating income, or DNOI, is net operating income before net investment loss, (loss) gain on extinguishment of debt and income tax provision (benefit), as determined in accordance with accounting principles generally accepted in the United States, or GAAP, adjusted for amortization of employee restricted stock awards and goodwill impairment. We view DNOI and the related per share measures as useful and appropriate supplements to net operating income, net income, earnings per share and cash flows from operating activities. These measures serve as an additional measure of MCG’s operating performance exclusive of employee restricted stock amortization and goodwill impairment, which represent expenses of the company, but do not require settlement in cash. DNOI does include PIK interest and dividend income, which generally are not payable in cash on a regular basis, but rather at investment maturity or when declared. DNOI should not be considered as an alternative to net operating income, net income, earnings per share or cash flows from operating activities (each computed in accordance with GAAP). Instead, DNOI should be reviewed in connection with net operating income, net income, earnings per share and cash flows from operating activities in MCG’s consolidated financial statements, to help analyze how MCG’s business is performing.
During 2011, DNOI was $40.2 million, or $0.53 per share, compared to $44.9 million, or $0.60 per share, for 2010. The following table shows a reconciliation of our reported net operating income before net investment loss, (loss) gain on extinguishment of debt and income tax provision (benefit) to DNOI for 2011 and 2010:
| Years ended December 31, | ||||||||
| (in thousands, except per share data) |
2011 | 2010 | ||||||
| Net operating income before net investment loss, (loss) gain on extinguishment of debt and income tax provision (benefit) |
$ | 37,658 | $ | 40,565 | ||||
| Amortization of employee restricted stock awards(a) |
2,513 | 4,342 | ||||||
|
|
|
|
|
|||||
| DNOI |
$ | 40,171 | $ | 44,907 | ||||
|
|
|
|
|
|||||
| Per common share data (basic and diluted) |
||||||||
| Weighted-average common shares outstanding |
76,259 | 75,422 | ||||||
| Loss per common share |
$ | (1.22 | ) | $ | (0.17 | ) | ||
| Net operating income before net investment loss, (loss) gain on extinguishment of debt and income tax provision (benefit) per common share |
$ | 0.49 | $ | 0.54 | ||||
| DNOI per common share |
$ | 0.53 | $ | 0.60 | ||||
| (a) | Results for 2011 include $432 of amortization of employee restricted stock awards associated with our corporate restructuring. These amortization expenses are included in restructuring expense on our Consolidated Statements of Operations. |
48
Table of Contents
NET INVESTMENT LOSS BEFORE INCOME TAX PROVISION
During 2011, we incurred $129.9 million of net investment loss before income tax provision, compared to $54.8 million of losses during 2010. These amounts represent the total of net realized (loss) gains, net unrealized (depreciation) appreciation, and reversals of unrealized (depreciation) appreciation. We reverse unrealized (depreciation) appreciation at the time that we realize the gain or loss.
The following table summarizes our realized and unrealized (loss) and gain on investments and changes in our unrealized appreciation and depreciation on investments for 2011:
| Year ended December 31, 2011 | ||||||||||||||||||||
| (in thousands) |
Industry |
Type | Realized (Loss)/Gain |
Unrealized (Depreciation)/ Appreciation |
Reversal of Unrealized Depreciation/ (Appreciation) |
Net (Loss)/ Gain |
||||||||||||||
| Portfolio Company |
||||||||||||||||||||
| Broadview Networks Holdings, Inc. |
Communications | Control | $ | — | $ | (92,093 | ) | $ | — | $ | (92,093 | ) | ||||||||
| Jet Plastica Investors, LLC |
Plastic Products | Control | — | (28,774 | ) | — | (28,774 | ) | ||||||||||||
| Jenzabar, Inc. |
Technology | Non-Affiliate | — | (11,049 | ) | — | (11,049 | ) | ||||||||||||
| Intran Media, LLC |
Other Media | Control | (7,946 | ) | (6,088 | ) | 6,972 | (7,062 | ) | |||||||||||
| PremierGarage Holdings, LLC |
Home Furnishings | Control | (9,256 | ) | (5,379 | ) | 8,461 | (6,174 | ) | |||||||||||
| VOX Communications Group Holdings, LLC |
Broadcasting | Non-Affiliate | (7,688 | ) | — | 5,645 | (2,043 | ) | ||||||||||||
| Superior Industries Investors, Inc. |
Sporting Goods | Control | 1,010 | — | (2,788 | ) | (1,778 | ) | ||||||||||||
| Contract Datascan Holdings, Inc. |
Business Services | Affiliate | — | (1,358 | ) | — | (1,358 | ) | ||||||||||||
| Provo Craft & Novelty, Inc. |
Leisure Activities | Non-Affiliate | (1,152 | ) | (1,160 | ) | 1,151 | (1,161 | ) | |||||||||||
| Avenue Broadband LLC |
Cable | Control | 11,977 | (325 | ) | (11,895 | ) | (243 | ) | |||||||||||
| Total Sleep Holdings, Inc. |
Healthcare | Control | (38,081 | ) | — | 38,054 | (27 | ) | ||||||||||||
| RadioPharmacy Investors, LLC |
Healthcare | Control | — | 7,104 | — | 7,104 | ||||||||||||||
| NPS Holding Group, LLC |
Business Services | Control | — | 3,857 | — | 3,857 | ||||||||||||||
| GSDM Holdings, Corp. |
Healthcare | Non-Affiliate | — | 2,452 | — | 2,452 | ||||||||||||||
| Cruz Bay Publishing, Inc. |
Publishing | Non-Affiliate | — | 2,035 | — | 2,035 | ||||||||||||||
| Orbitel Holdings, LLC |
Cable | Control | — | 1,784 | — | 1,784 | ||||||||||||||
| Stratford School Holdings, Inc. |
Education | Affiliate | — | 1,714 | — | 1,714 | ||||||||||||||
| Restaurant Technologies, Inc. |
Food Services | Non-Affiliate | 1,750 | 1,429 | (1,842 | ) | 1,337 | |||||||||||||
| Coastal Sunbelt Real Estate, Inc. |
Real Estate Investments | Non-Affiliate | 171 | 2,693 | (1,914 | ) | 950 | |||||||||||||
| Active Brands International, Inc. |
Consumer Products | Non-Affiliate | (39,706 | ) | — | 39,829 | 123 | |||||||||||||
| GMC Television Broadcasting, LLC |
Broadcasting | Control | (1,000 | ) | 99 | 1,000 | 99 | |||||||||||||
| Other (< $1 million net gain (loss)) |
(598 | ) | 465 | 567 | 434 | |||||||||||||||
|
|
|
|
|
|
|
|
|
|||||||||||||
| Total |
$ | (90,519 | ) | $ | (122,594 | ) | $ | 83,240 | $ | (129,873 | ) | |||||||||
|
|
|
|
|
|
|
|
|
|||||||||||||
A summary of the reasons for significant changes in realized and unrealized (loss) and gain on investments and changes in unrealized appreciation and depreciation on investments for 2011 is set forth below.
| • | During 2011, we recorded a $92.1 million decrease in the fair value of our investment in Broadview. In June 2011, Broadview withdrew its tender offer for $301.4 million of its 113/8% Senior Secured Notes, due in September 2012, following Broadview’s review of market conditions. As of September 30, 2011, Broadview had $17.1 million of borrowings outstanding under its revolving credit facility, which becomes payable on June 1, 2012. In addition, as of September 30, 2011, Broadview had $301.4 million of outstanding senior secured notes, which will mature on September 1, 2012. The $92.1 million decrease in fair value that we recorded during 2011, reflects, among other factors, the impact of continuing challenges in the bond market, a downgrade of Broadview’s corporate credit rating, continuing delays by Broadview in refinancing its debt, as well as the near-term maturities of its debt. The fair value of Broadview is consistent with an independent third-party valuation review. If Broadview is unable to refinance its debt facilities by their respective maturity dates, the value of our portfolio investment in Broadview could decline by up to the remaining fair value at December 31, 2011, and we may be required to recognize additional unrealized depreciation on this investment. |
49
Table of Contents
| • | We recorded $28.8 million of unrealized depreciation on our investment in Jet Plastica, to reflect a decrease in that company’s operating performance. In addition, we also recorded unrealized depreciation on our investment in Jet Plastica to reflect an incremental investment that we made in this portfolio company during 2011, that we subsequently wrote down to zero. |
| • | In February 2012, we accepted $23.7 million for our senior preferred stock and warrant position in Jenzabar, Inc., or Jenzabar. This amount, which we believe significantly benefits our unencumbered cash position, resulted in an $11.0 million unrealized depreciation during 2011 of our investment in Jenzabar. The consideration received also settled any and all direct claims and counterclaims asserted in the litigation by and among the Company, Jenzabar and certain Jenzabar officers and directors. We will receive the balance of the payment for our position in Jenzabar in the amount of $990,000 for our subordinated preferred stock and will exchange those shares upon the final dismissal of the litigation, including the dismissal of the derivative claims. |
| • | We wrote off our remaining subordinated debt and equity investment in Total Sleep resulting in the reversal of $38.1 million of previously unrealized depreciation and the realization of a $38.1 million loss. |
| • | We received payments of $2.1 million on the sale of Active Brands’ senior debt and wrote off our subordinated debt and equity investment in that portfolio company, which resulted in the reversal of $39.8 million of previously unrealized depreciation and the realization of a $39.7 million loss. |
The remaining unrealized depreciation and appreciation shown in the above table resulted predominantly from a change in the performance of certain of our portfolio companies and the multiples used to value certain of our investments.
The following table summarizes our realized and unrealized (loss) and gain on investments and changes in our unrealized appreciation and depreciation on investments for the year ended December 31, 2010:
| (in thousands) |
Year ended December 31, 2010 | |||||||||||||||||||
| Industry |
Type | Realized (Loss)/ Gain |
Unrealized (Depreciation)/ Appreciation |
Reversal of Unrealized Depreciation/ (Appreciation) |
Net (Loss)/ Gain |
|||||||||||||||
| Portfolio Company |
||||||||||||||||||||
| Broadview Network Holdings, Inc. |
Communications | Control | $ | — | $ | (35,965 | ) | $ | — | $ | (35,965 | ) | ||||||||
| Jet Plastica Investors, LLC |
Plastic Products | Control | — | (28,048 | ) | — | (28,048 | ) | ||||||||||||
| Active Brands International, Inc. |
Consumer Products | Non-affiliate | — | (18,515 | ) | — | (18,515 | ) | ||||||||||||
| Total Sleep Holdings, Inc. |
Healthcare | Control | — | (5,271 | ) | — | (5,271 | ) | ||||||||||||
| JetBroadband Holdings, LLC |
Cable | Control | (5,943 | ) | (1,756 | ) | 3,418 | (4,281 | ) | |||||||||||
| PremierGarage Holdings, LLC |
Home Furnishings | Control | — | (4,109 | ) | — | (4,109 | ) | ||||||||||||
| Intran Media, LLC |
Other Media | Control | — | (3,223 | ) | — | (3,223 | ) | ||||||||||||
| B&H Education, Inc. |
Education | Non-affiliate | 3,678 | (72 | ) | (3,642 | ) | (36 | ) | |||||||||||
| Jenzabar, Inc. |
Technology | Non-affiliate | — | 7,319 | — | 7,319 | ||||||||||||||
| RadioPharmacy Investors, LLC |
Healthcare | Control | — | 7,150 | — | 7,150 | ||||||||||||||
| Avenue Broadband LLC |
Cable | Control | — | 6,497 | — | 6,497 | ||||||||||||||
| MCI Holdings LLC |
Healthcare | Non-affiliate | 9,531 | 3,486 | (9,663 | ) | 3,354 | |||||||||||||
| Stratford School Holdings, Inc. |
Education | Affiliate | — | 3,103 | — | 3,103 | ||||||||||||||
| GSDM Holdings, LLC |
Healthcare | Non-affiliate | — | 2,080 | — | 2,080 | ||||||||||||||
| Metropolitan Telecommunications Holding Company |
Communications | Non-affiliate | 10,157 | 3,610 | (11,756 | ) | 2,011 | |||||||||||||
| Coastal Holdings, LLC |
Real Estate Investments | Non-Affiliate | — | 1,795 | — | 1,795 | ||||||||||||||
| Teleguam Holdings , LLC |
Communications | Non-affiliate | — | 1,695 | — | 1,695 | ||||||||||||||
| Orbitel Holdings, LLC |
Cable | Control | — | 1,122 | — | 1,122 | ||||||||||||||
| Golden Knight II CLO, Ltd. |
Diversified Financial Services | Non-Affiliate | — | 1,096 | — | 1,096 | ||||||||||||||
| G&L Investment Holdings, LLC |
Insurance | Non-Affiliate | — | 1,086 | — | 1,086 | ||||||||||||||
| Sagamore Hill Broadcasting, LLC |
Broadcasting | Non-affiliate | — | 1,057 | — | 1,057 | ||||||||||||||
| Quantum Medical Holdings, LLC |
Laboratory Instruments | Non-affiliate | 1,362 | 357 | (1,074 | ) | 645 | |||||||||||||
| Home Interiors & Gifts, Inc. |
Home Furnishings | Control | (3,458 | ) | 1 | 3,645 | 188 | |||||||||||||
| WebMediaBrands Inc. |
Information Services | Non-affiliate | (1,981 | ) | — | 1,984 | 3 | |||||||||||||
| Other (< $1 million net gain (loss)) |
(1,492 | ) | 3,995 | 1,925 | 4,428 | |||||||||||||||
|
|
|
|
|
|
|
|
|
|||||||||||||
| Total |
$ | 11,854 | $ | (51,510 | ) | $ | (15,163 | ) | $ | (54,819 | ) | |||||||||
|
|
|
|
|
|
|
|
|
|||||||||||||
50
Table of Contents
During 2010, we sold our investments in MCI Holdings, LLC, JetBroadband Holdings, LLC; B&H Education, Inc.; Quantum Medical Holdings, LLC; and WebMediaBrands, Inc., as well as warrants to purchase common stock that we held in Metropolitan Telecommunications Holding Company. For each of these sales, we reversed unrealized appreciation (depreciation), that we had previously recognized and recorded a realized gain or (loss).
During 2010, we recorded $36.0 million of unrealized depreciation on our investment in Broadview, which reflected a number of inputs into our estimate of the fair value of this investment, including merger and acquisition comparables, private market transactions, public company comparables, a discounted cash flow analysis and an independent third-party valuation. In addition, we recognized unrealized depreciation on other investments in our portfolio, including Jet Plastica Investors, LLC; Active Brands International, Inc.; Total Sleep Holdings, Inc.; and PremierGarage Holdings, LLC, primarily because of a decrease in the performance of these companies and a reduction in valuation multiples. The remaining unrealized (depreciation) appreciation shown in the above table resulted predominantly from changes in the performance of certain of our portfolio companies and the multiples used to value certain of our investments.
(LOSS) GAIN ON EXTINGUISHMENT OF DEBT
We paid a $0.9 million premium when we repurchased $17.4 million of our private placement notes during 2011. In 2010, we repurchased $8.0 million of collateralized loan obligations for $4.4 million that previously had been issued by our Commercial Loan Trust 2006-1, which resulted in the recognition of a $3.6 million gain on extinguishment of debt, excluding the effect of the amortization of the acceleration of $0.1 million in deferred debt costs. Additionally, in 2010, we paid a $0.5 million premium when we repurchased $25.3 million of our private placement notes. This premium represents 2% of the principal amount to be purchased with monetization proceeds as required by our agreement with the holders of these unsecured notes.
INCOME TAX PROVISION
During 2011, we recorded a $37,000 income tax provision compared to a $1.8 million income tax provision during 2010. Approximately $1.6 million of the income tax expense accrued for the year ended December 31, 2010 was attributable to the sale of JetBroadband Holdings, LLC in July 2010. The income tax expense for 2011 and the remaining tax expense for 2010 were primarily attributable to unrealized depreciation or appreciation and flow-through taxable income on certain investments held by our subsidiaries.
NET LOSS
During 2011, we recorded a net loss of $93.1 million compared to a net loss of $13.1 million during 2010. This change is attributable to the items discussed above.
51
Table of Contents
SELECTED QUARTERLY DATA
The following tables summarize key unaudited financial information for the eight quarters ended December 31, 2011. Results for any quarter are not necessarily indicative of results for the full year or for any future quarter.
| 2011 Quarters | 2010 Quarters | |||||||||||||||||||||||||||||||
| (in thousands, except per share amounts) |
Fourth | Third | Second | First | Fourth | Third | Second | First | ||||||||||||||||||||||||
| INCOME STATEMENT DATA |
||||||||||||||||||||||||||||||||
| Revenue |
$ | 19,475 | $ | 20,710 | $ | 21,208 | $ | 24,303 | $ | 23,484 | $ | 22,571 | $ | 21,768 | $ | 21,746 | ||||||||||||||||
| Net operating income before net investment loss, (loss) gain on extinguishment of debt and income tax provision |
7,464 | 5,953 | 11,238 | 13,003 | 11,876 | 11,400 | 8,850 | 8,439 | ||||||||||||||||||||||||
| Net investment loss before income tax provision |
(56,429 | ) | (31,052 | ) | (21,448 | ) | (20,944 | ) | (29,689 | ) | (9,800 | ) | (12,966 | ) | (2,364 | ) | ||||||||||||||||
| Distributable net operating income (“DNOI”)(a) |
8,168 | 6,732 | 11,644 | 13,627 | 12,855 | 12,413 | 9,973 | 9,666 | ||||||||||||||||||||||||
| Net (loss) income |
(48,973 | ) | (25,109 | ) | (10,218 | ) | (8,815 | ) | (17,748 | ) | (529 | ) | (750 | ) | 5,955 | |||||||||||||||||
|
PER COMMON SHARE DATA |
||||||||||||||||||||||||||||||||
| Net operating income before net investment loss, (loss) gain on extinguishment of debt and income tax provision per common share—basic and diluted |
$ | 0.09 | $ | 0.08 | $ | 0.15 | $ | 0.17 | $ | 0.16 | $ | 0.15 | $ | 0.12 | $ | 0.11 | ||||||||||||||||
| DNOI per weighted-average common share—basic and diluted(a) |
$ | 0.11 | $ | 0.09 | $ | 0.15 | $ | 0.18 | $ | 0.17 | $ | 0.16 | $ | 0.13 | $ | 0.13 | ||||||||||||||||
| (Loss) earnings per weighted-average common share—basic and diluted |
$ | (0.64 | ) | $ | (0.33 | ) | $ | (0.13 | ) | $ | (0.12 | ) | $ | (0.23 | ) | $ | (0.01 | ) | $ | (0.01 | ) | $ | 0.08 | |||||||||
| Cash dividends declared per common share |
$ | 0.17 | $ | 0.17 | $ | 0.17 | $ | 0.15 | $ | 0.14 | $ | 0.12 | $ | 0.11 | $ | — | ||||||||||||||||
|
SELECTED PERIOD-END BALANCES |
||||||||||||||||||||||||||||||||
| Investment portfolio balances |
||||||||||||||||||||||||||||||||
| Fair value |
$ | 741,166 | $ | 824,173 | $ | 849,101 | $ | 954,349 | $ | 1,009,705 | $ | 924,253 | $ | 997,590 | $ | 991,032 | ||||||||||||||||
| Cost |
1,017,218 | 1,060,243 | 1,092,092 | 1,183,616 | 1,245,673 | 1,120,171 | 1,180,337 | 1,159,794 | ||||||||||||||||||||||||
| Total assets |
890,538 | 1,009,009 | 1,066,056 | 1,105,150 | 1,145,277 | 1,136,665 | 1,170,463 | 1,171,385 | ||||||||||||||||||||||||
| Borrowings |
430,219 | 490,019 | 511,210 | 527,343 | 546,882 | 508,899 | 534,278 | 534,892 | ||||||||||||||||||||||||
| Total stockholders’ equity |
434,952 | 496,481 | 534,033 | 557,093 | 587,016 | 606,078 | 614,855 | 622,897 | ||||||||||||||||||||||||
| Net asset value per common share outstanding(c) |
$ | 5.65 | $ | 6.44 | $ | 6.93 | $ | 7.23 | $ | 7.54 | $ | 7.92 | $ | 8.03 | $ | 8.16 | ||||||||||||||||
| OTHER PERIOD-END DATA |
||||||||||||||||||||||||||||||||
| Average size of investment |
||||||||||||||||||||||||||||||||
| Fair value |
$ | 12,353 | $ | 13,293 | $ | 13,267 | $ | 14,244 | $ | 14,221 | $ | 14,907 | $ | 16,908 | $ | 17,087 | ||||||||||||||||
| Cost |
16,954 | 17,101 | 17,064 | 17,666 | 17,545 | 18,067 | 20,006 | 19,996 | ||||||||||||||||||||||||
| Number of portfolio companies |
60 | 62 | 64 | 67 | 71 | 62 | 59 | 58 | ||||||||||||||||||||||||
| Number of employees |
37 | 39 | 63 | 63 | 66 | 66 | 65 | 65 | ||||||||||||||||||||||||
| RECONCILIATION OF DNOI TO NET OPERATING INCOME BEFORE INVESTMENT LOSS, (LOSS) GAIN ON EXTINGUISHMENT OF DEBT AND INCOME TAX PROVISION |
||||||||||||||||||||||||||||||||
| Net operating income before investment loss, (loss) gain on extinguishment of debt and income tax provision |
$ | 7,464 | $ | 5,953 | $ | 11,238 | $ | 13,003 | $ | 11,876 | $ | 11,400 | $ | 8,850 | $ | 8,439 | ||||||||||||||||
| Amortization of employee restricted stock awards(b) |
704 | 779 | 406 | 624 | 979 | 1,013 | 1,123 | 1,227 | ||||||||||||||||||||||||
|
|
|
|
|
|
|
|
|
|
|
|
|
|
|
|
|
|||||||||||||||||
|
DNOI(a) |
$ | 8,168 | $ | 6,732 | $ | 11,644 | $ | 13,627 | $ | 12,855 | $ | 12,413 | $ | 9,973 | $ | 9,666 | ||||||||||||||||
|
|
|
|
|
|
|
|
|
|
|
|
|
|
|
|
|
|||||||||||||||||
| WEIGHTED-AVERAGE COMMON SHARES OUTSTANDING—BASIC AND DILUTED |
76,514 | 76,404 | 76,343 | 75,765 | 75,648 | 75,486 | 75,392 | 76,339 | ||||||||||||||||||||||||
| NUMBER OF COMMON SHARES OUTSTANDING AT PERIOD-END |
76,997 | 77,035 | 77,046 | 77,065 | 76,662 | 76,542 | 76,557 | 76,338 | ||||||||||||||||||||||||
| a) | DNOI is net operating income before net investment loss, gain (loss) on extinguishment of debt and income tax provision, as determined in accordance with accounting principles generally accepted in the United States, or GAAP, adjusted for amortization of employee restricted stock awards. We view DNOI and the related per share measures as useful and appropriate supplements to net operating income, net (loss) income, earnings per share and cash flows from operating activities. These measures serve as an additional measure of MCG’s operating performance exclusive of employee restricted stock amortization, which represents an expense of the company, but does not require settlement in cash. DNOI does include paid-in-kind, or PIK, interest and dividend income, which generally are not payable in cash on a regular basis, but rather at investment maturity or when declared. DNOI should not be considered as an alternative to net operating income, net (loss) income, earnings per share and cash flows from operating activities (each computed in accordance with GAAP). Instead, DNOI should be reviewed in connection with net operating income, net (loss) income, earnings per share and cash flows from operating activities in MCG’s consolidated financial statements, to help analyze how MCG’s business is performing. |
| (b) | Results for Q3 2011 and Q4 2011 include $431 and $1, respectively, of amortization of employee restricted stock awards associated with our corporate restructuring. These amortization expenses are included in restructuring expense on our Consolidated Statements of Operations. |
| (c) | Based on common shares outstanding at period-end. |
52
Table of Contents
The following tables summarize key unaudited information about our investment portfolio for the eight quarters ended December 31, 2011. Results for any quarter are not necessarily indicative of results for the full year or for any future quarter.
| 2011 Quarters | 2010 Quarters | |||||||||||||||||||||||||||||||||||
| (in thousands, except per share amounts) |
Fourth | Third | Second | First | Fourth | Third | Second | First | ||||||||||||||||||||||||||||
| PORTFOLIO COMPANY DATA (FAIR VALUE) |
||||||||||||||||||||||||||||||||||||
| Portfolio by type |
||||||||||||||||||||||||||||||||||||
| Debt investments |
||||||||||||||||||||||||||||||||||||
| Senior secured debt |
$ | 492,488 | $ | 535,247 | $ | 535,320 | $ | 547,280 | $ | 555,667 | $ | 437,709 | $ | 419,398 | $ | 379,600 | ||||||||||||||||||||
| Subordinated debt |
||||||||||||||||||||||||||||||||||||
| Secured |
124,289 | 124,203 | 132,830 | 177,628 | 190,309 | 187,918 | 237,226 | 272,713 | ||||||||||||||||||||||||||||
| Unsecured |
12,203 | 14,411 | 14,353 | 12,588 | 12,321 | 12,241 | 40,848 | 30,760 | ||||||||||||||||||||||||||||
|
|
|
|
|
|
|
|
|
|
|
|
|
|
|
|
|
|||||||||||||||||||||
| Total debt investments |
628,980 | 673,861 | 682,503 | 737,496 | 758,297 | 637,868 | 697,472 | 683,073 | ||||||||||||||||||||||||||||
|
|
|
|
|
|
|
|
|
|
|
|
|
|
|
|
|
|||||||||||||||||||||
| Equity investments |
||||||||||||||||||||||||||||||||||||
| Preferred equity |
89,931 | 116,310 | 133,350 | 183,735 | 218,690 | 244,864 | 248,983 | 261,931 | ||||||||||||||||||||||||||||
| Common equity/equivalents |
22,255 | 34,002 | 33,248 | 33,118 | 32,718 | 41,521 | 51,135 | 46,028 | ||||||||||||||||||||||||||||
|
|
|
|
|
|
|
|
|
|
|
|
|
|
|
|
|
|||||||||||||||||||||
| Total equity investments |
112,186 | 150,312 | 166,598 | 216,853 | 251,408 | 286,385 | 300,118 | 307,959 | ||||||||||||||||||||||||||||
|
|
|
|
|
|
|
|
|
|
|
|
|
|
|
|
|
|||||||||||||||||||||
| Total portfolio |
$ | 741,166 | $ | 824,173 | $ | 849,101 | $ | 954,349 | $ | 1,009,705 | $ | 924,253 | $ | 997,590 | $ | 991,032 | ||||||||||||||||||||
|
|
|
|
|
|
|
|
|
|
|
|
|
|
|
|
|
|||||||||||||||||||||
| Percentage of total portfolio |
||||||||||||||||||||||||||||||||||||
| Debt investments |
||||||||||||||||||||||||||||||||||||
| Senior secured debt |
66.4 | % | 64.9 | % | 63.0 | % | 57.4 | % | 55.0 | % | 47.4 | % | 42.0 | % | 38.3 | % | ||||||||||||||||||||
| Subordinated debt |
||||||||||||||||||||||||||||||||||||
| Secured |
16.8 | 15.1 | 15.7 | 18.6 | 18.9 | 20.3 | 23.8 | 27.5 | ||||||||||||||||||||||||||||
| Unsecured |
1.7 | 1.8 | 1.7 | 1.3 | 1.2 | 1.3 | 4.1 | 3.1 | ||||||||||||||||||||||||||||
|
|
|
|
|
|
|
|
|
|
|
|
|
|
|
|
|
|||||||||||||||||||||
| Total debt investments |
84.9 | 81.8 | 80.4 | 77.3 | 75.1 | 69.0 | 69.9 | 68.9 | ||||||||||||||||||||||||||||
|
|
|
|
|
|
|
|
|
|
|
|
|
|
|
|
|
|||||||||||||||||||||
| Equity investments |
||||||||||||||||||||||||||||||||||||
| Preferred equity |
12.1 | 14.1 | 15.7 | 19.2 | 21.7 | 26.5 | 25.0 | 26.4 | ||||||||||||||||||||||||||||
| Common equity/equivalents |
3.0 | 4.1 | 3.9 | 3.5 | 3.2 | 4.5 | 5.1 | 4.7 | ||||||||||||||||||||||||||||
|
|
|
|
|
|
|
|
|
|
|
|
|
|
|
|
|
|||||||||||||||||||||
| Total equity investments |
15.1 | 18.2 | 19.6 | 22.7 | 24.9 | 31.0 | 30.1 | 31.1 | ||||||||||||||||||||||||||||
|
|
|
|
|
|
|
|
|
|
|
|
|
|
|
|
|
|||||||||||||||||||||
| Total portfolio |
100.0 | % | 100.0 | % | 100.0 | % | 100.0 | % | 100.0 | % | 100.0 | % | 100.0 | % | 100.0 | % | ||||||||||||||||||||
|
|
|
|
|
|
|
|
|
|
|
|
|
|
|
|
|
|||||||||||||||||||||
| YIELD ON AVERAGE LOAN PORTFOLIO AT FAIR VALUE |
||||||||||||||||||||||||||||||||||||
| Average 90-Day LIBOR |
0.5 | % | 0.3 | % | 0.3 | % | 0.3 | % | 0.3 | % | 0.4 | % | 0.4 | % | 0.3 | % | ||||||||||||||||||||
| Spread to average LIBOR on average loan portfolio |
10.1 | 10.8 | 10.7 | 11.0 | 11.5 | 12.4 | 11.9 | 12.4 | ||||||||||||||||||||||||||||
| Impact of fee accelerations of unearned fees on paid/restructured loans |
0.1 | 0.6 | 0.2 | 0.2 | — | 0.2 | 0.1 | 0.1 | ||||||||||||||||||||||||||||
| Impact of non-accrual loans |
(0.7 | ) | (0.8 | ) | (0.8 | ) | (0.3 | ) | (0.5 | ) | (1.0 | ) | (0.9 | ) | (0.8 | ) | ||||||||||||||||||||
|
|
|
|
|
|
|
|
|
|
|
|
|
|
|
|
|
|||||||||||||||||||||
| Total yield on average loan portfolio |
10.0 | % | 10.9 | % | 10.4 | % | 11.2 | % | 11.3 | % | 12.0 | % | 11.5 | % | 12.0 | % | ||||||||||||||||||||
|
|
|
|
|
|
|
|
|
|
|
|
|
|
|
|
|
|||||||||||||||||||||
| COMPOSITION OF LOAN PORTFOLIO BY INTEREST TYPE (FAIR VALUE) |
||||||||||||||||||||||||||||||||||||
| Percentage of loans with fixed interest rates |
11.8 | % | 11.4 | % | 12.5 | % | 20.6 | % | 24.5 | % | 30.7 | % | 39.3 | % | 43.9 | % | ||||||||||||||||||||
| Percentage of loans with floating interest rates |
88.2 | % | 88.6 | % | 87.5 | % | 79.4 | % | 75.5 | % | 69.3 | % | 60.7 | % | 56.1 | % | ||||||||||||||||||||
| PERCENTAGE OF TOTAL DEBT INVESTMENTS (FAIR VALUE) |
||||||||||||||||||||||||||||||||||||
| Loans on non-accrual status |
3.1 | % | 4.4 | % | 5.3 | % | 4.4 | % | 3.4 | % | 4.3 | % | 4.7 | % | 4.1 | % | ||||||||||||||||||||
| Loans greater than 90 days past due |
1.5 | % | 1.6 | % | 1.0 | % | 0.9 | % | 0.8 | % | 1.0 | % | 0.9 | % | 0.9 | % | ||||||||||||||||||||
| PERCENTAGE OF TOTAL DEBT INVESTMENTS (COST) |
||||||||||||||||||||||||||||||||||||
| Loans on non-accrual status |
11.9 | % | 11.9 | % | 13.2 | % | 13.9 | % | 15.9 | % | 18.3 | % | 15.1 | % | 12.9 | % | ||||||||||||||||||||
| Loans greater than 90 days past due |
2.0 | % | 3.2 | % | 2.8 | % | 2.0 | % | 1.2 | % | 2.0 | % | 2.4 | % | 2.9 | % | ||||||||||||||||||||
53
Table of Contents
COMPARISON OF THE YEARS ENDED DECEMBER 31, 2010 AND 2009
The following table summarizes the components of our net loss for the years ended December 31, 2010 and 2009:
| Years ended December 31, |
Variance | |||||||||||||||
| (dollars in thousands) |
2010 | 2009 | $ | Percentage | ||||||||||||
| Revenue |
||||||||||||||||
| Interest and dividend income |
||||||||||||||||
| Interest income |
$ | 76,625 | $ | 88,309 | $ | (11,684 | ) | (13.2 | )% | |||||||
| Dividend income |
7,368 | 6,149 | 1,219 | 19.8 | ||||||||||||
| Loan fees |
2,536 | 2,848 | (312 | ) | (11.0 | ) | ||||||||||
|
|
|
|
|
|
|
|||||||||||
| Total interest and dividend income |
86,529 | 97,306 | (10,777 | ) | (11.1 | ) | ||||||||||
| Advisory fees and other income |
3,040 | 2,528 | 512 | 20.3 | ||||||||||||
|
|
|
|
|
|
|
|||||||||||
| Total revenue |
89,569 | 99,834 | (10,265 | ) | (10.3 | ) | ||||||||||
|
|
|
|
|
|
|
|||||||||||
| Operating expenses |
||||||||||||||||
| Interest expense |
16,891 | 23,444 | (6,553 | ) | (28.0 | ) | ||||||||||
| Employee compensation |
||||||||||||||||
| Salaries and benefits |
16,275 | 14,825 | 1,450 | 9.8 | ||||||||||||
| Amortization of employee restricted stock |
4,342 | 7,727 | (3,385 | ) | (43.8 | ) | ||||||||||
|
|
|
|
|
|
|
|||||||||||
| Total employee compensation |
20,617 | 22,552 | (1,935 | ) | (8.6 | ) | ||||||||||
| General and administrative expense |
11,496 | 15,650 | (4,154 | ) | (26.5 | ) | ||||||||||
|
|
|
|
|
|
|
|||||||||||
| Total operating expenses |
49,004 | 61,646 | (12,642 | ) | (20.5 | ) | ||||||||||
|
|
|
|
|
|
|
|||||||||||
| Net operating income before net investment loss, gain on extinguishment of debt and income tax provision (benefit) |
40,565 | 38,188 | 2,377 | 6.2 | ||||||||||||
| Net investment loss before income tax provision (benefit) |
(54,819 | ) | (94,353 | ) | 39,534 | 41.9 | ||||||||||
| Gain on extinguishment of debt before income tax provision (benefit) |
2,983 | 5,025 | (2,042 | ) | (40.6 | ) | ||||||||||
| Income tax provision (benefit) |
1,801 | (81 | ) | 1,882 | NM | |||||||||||
|
|
|
|
|
|
|
|||||||||||
| Net loss |
$ | (13,072 | ) | $ | (51,059 | ) | $ | 37,987 | NM | |||||||
|
|
|
|
|
|
|
|||||||||||
NM=Not Meaningful
TOTAL REVENUE
During 2010, our total revenue was $89.6 million, which represents a $10.3 million, or 10.3%, decrease from 2009. This decline was composed primarily of an $11.7 million, or 13.2%, decrease in interest income and a $0.3 million, or 11.0%, decrease in loan fees. These decreases were partially offset by a $1.2 million, or 19.8%, increase in dividend income; and a $0.5 million, or 20.3%, increase in advisory fees and other income. The following sections describe the reasons for the variances in each major component of our revenue during the year ended December 31, 2010.
INTEREST INCOME
During 2010, the total yield on our average debt portfolio at fair value was 11.7% compared to 11.9% during 2009. The following table shows the various components of the total yield on our average debt portfolio at fair value for the years ended December 31, 2010 and 2009:
| Years ended December 31, | ||||||||
| 2010 | 2009 | |||||||
| Average 90-day LIBOR |
0.3 | % | 0.7 | % | ||||
| Spread to average LIBOR on average loan portfolio |
12.1 | 11.9 | ||||||
| Impact of fee accelerations of unearned fees on paid/restructured loans |
0.1 | 0.1 | ||||||
| Impact of non-accrual loans |
(0.8 | ) | (0.8 | ) | ||||
|
|
|
|
|
|||||
| Total yield on average loan portfolio |
11.7 | % | 11.9 | % | ||||
|
|
|
|
|
|||||
During 2010 interest income was $76.6 million, compared to $88.3 million during 2009, which represented an $11.7 million, or 13.2%, decrease. This decrease reflected a $10.3 million decrease resulting from a reduction in our average loan balance, a $2.7 million decrease resulting from a 35 basis point reduction in average LIBOR and
54
Table of Contents
a $3.1 million decrease in interest income resulting from the net impact of loans that were on non-accrual status during 2010 that were accruing interest during 2009. These decreases were partially offset by a $3.6 million increase in interest income resulting from a 10 basis point increase in our spread to LIBOR and a $0.8 million increase in interest income resulting from the impact of interest rate floors.
PIK Income
The following table shows the PIK-related activity for 2010 and 2009, at cost:
| Years ended December 31, | ||||||||
| (in thousands) |
2010 | 2009 | ||||||
| Beginning PIK loan balance |
$ | 33,436 | $ | 26,354 | ||||
| PIK interest earned during the period |
12,652 | 15,583 | ||||||
| Interest receivable converted to PIK |
3,736 | 3,274 | ||||||
| Payments received from PIK loans |
(18,819 | ) | (2,214 | ) | ||||
| PIK converted to other securities |
(82 | ) | (9,262 | ) | ||||
| Realized loss |
— | (299 | ) | |||||
|
|
|
|
|
|||||
| Ending PIK loan balance |
$ | 30,923 | $ | 33,436 | ||||
|
|
|
|
|
|||||
As of December 31, 2010 and 2009, we were not accruing interest on $7.4 million and $4.3 million, respectively, of the PIK loans, at cost, shown in the preceding table.
On July 30, 2010, JetBroadband Holdings, LLC sold substantially all of its assets to Shentel Cable Company, a wholly owned subsidiary of Shenandoah Telecommunications Company. Our cash proceeds in connection with the exit of this investment included $8.5 million of payments received from PIK loans. In addition, during the year ended December 31, 2010, we received a $3.8 million cash repayment of PIK from NDSSI Holdings, LLC, a $3.7 million cash repayment of PIK related to the payoff of subordinated debt from MCI Holdings LLC, a $1.1 million cash payment of PIK from The Matrixx Group, Incorporated and PIK payments totaling $1.7 million from 15 other portfolio companies.
DIVIDEND INCOME
The following table summarizes our dividend activity for 2010 and 2009:
| Years ended December 31, | ||||||||
| (in thousands) |
2010 | 2009 | ||||||
| Beginning accrued dividend balance |
$ | 88,898 | $ | 91,770 | ||||
| Dividend income earned during the period |
7,368 | 6,149 | ||||||
| Dividend collections |
(3,970 | ) | (8,414 | ) | ||||
| Accrued dividends converted to other securities |
— | (607 | ) | |||||
| Realized loss |
(1,315 | ) | — | |||||
|
|
|
|
|
|||||
| Ending accrued dividend balance |
$ | 90,981 | $ | 88,898 | ||||
|
|
|
|
|
|||||
During 2010, our dividend income was $7.4 million, which represented a $1.2 million, or 19.8%, increase from 2009. Dividend income increased as a result of Stratford School Holdings, Inc. paying a $1.9 million dividend in December 2010, which resulted in $1.5 million more dividends than we had accreted for this investment. Dividend income also increased $1.9 million primarily because of improvements in the fair values of certain equity investments and because the fair value of four existing portfolio companies improved sufficiently to support the accretion of dividends. These increases were partially offset by a decrease in dividend income of $1.5 million primarily as a result of the sale of three dividend-producing investments—Coastal Sunbelt, LLC, LMS Intellibound Investors, LLC and B&H Education, Inc. In addition, dividend income decreased $0.7 million because we ceased accreting dividends on two investments because the fair value of these investments as of December 31, 2010 did not support the accretion of additional dividends.
LOAN FEES
During 2010, our loan fees decreased $0.3 million, or 11.0% from 2009.
55
Table of Contents
ADVISORY FEES AND OTHER INCOME
During 2010, we earned $3.0 million of advisory fees and other income, which represented a $0.5 million, or 20.3%, increase from 2009. This increase was due primarily to a $0.9 million increase in advisory fees earned in conjunction with origination activity and a $0.2 million increase from interest on the average balance of cash that we maintained in our bank accounts. These increases were partially offset by a $0.6 million decrease in management fees generated from our portfolio companies.
TOTAL OPERATING EXPENSES
Total operating expenses include interest, employee compensation and general and administrative expenses. During 2010, we incurred $49.0 million of operating expenses, representing a $12.6 million, or 20.5%, decrease from the prior year. This decrease was composed of: a $6.6 million decrease in interest expense; a $4.1 million decrease in general and administrative expense; and a $1.9 million decrease in employee compensation expenses. The reasons for these variances are discussed in more detail below.
INTEREST EXPENSE
During 2010, we incurred $16.9 million of interest expense, which represented a $6.6 million, or 28.0%, decrease from 2009. The previously described reduction in average LIBOR from 0.7% in 2009 to 0.3% in 2010 resulted in a $2.1 million decrease in interest expense. In addition, a decrease in average borrowing balances resulted in a $1.8 million decrease in interest expense and our amortization of debt costs decreased $1.4 million. Furthermore, a narrowing of the interest rate spread from 2.5% during 2009 to 2.3% 2010, decreased interest expense by $1.3 million.
EMPLOYEE COMPENSATION
During 2010, our employee compensation expense was $20.6 million, which represented a $1.9 million, or 8.6%, decrease from 2009. Our salaries and benefits increased by $1.5 million, or 9.8%, primarily due to a $1.4 million increase in incentive compensation, reflecting changes in the fair value of liability awards under the LTIP. Our amortization of employee restricted stock decreased $3.4 million, or 43.8%, which represented certain awards being fully expensed in 2009 as well as fewer shares awarded during 2010. Awards under the LTIP are contingent upon the closing price of MCG’s stock meeting certain price thresholds and the approval of the compensation committee of our board of directors. We achieved two of these price thresholds in 2010, resulting in the issuance of 346,000 shares of restricted common stock and the award of $2.0 million to LTIP participants.
GENERAL AND ADMINISTRATIVE
During 2010, general and administrative expense was $11.5 million, which represented a $4.1 million, or 26.5%, decrease compared to 2009. This decrease was attributable primarily to $1.7 million of expense associated with our settlement of matters pertaining to the contested election of directors to our board of directors at our 2009 Annual Meeting, a $1.1 million decrease in insurance costs, $0.9 million of severance costs related to an executive departure incurred during the second quarter of 2009, a $0.9 million decrease in professional fees and legal expenses and $0.9 million of other smaller cost reductions in other general and administrative categories. These decreases were partially offset by $0.9 million of fees paid in the second quarter of 2010 related to the contested election of directors to our board of directors at our 2010 Annual Meeting and $0.5 million of expenses associated with implementing a new computer system.
NET OPERATING INCOME BEFORE NET INVESTMENT LOSS, GAIN ON EXTINGUISHMENT OF DEBT AND INCOME TAX PROVISION (BENEFIT)
Net operating income before investment loss, gain on extinguishment of debt and income tax provision (benefit) for the year ended December 31, 2010 totaled $40.6 million, compared with $38.2 million for the year ended December 31, 2009. This increase is due to the items discussed above.
56
Table of Contents
DISTRIBUTABLE NET OPERATING INCOME
During 2010, DNOI was $44.9 million, or $0.60 per share, compared to $45.9 million, or $0.61 per share, for 2009. The following table shows a reconciliation of our reported net operating income before net investment loss, gain on extinguishment of debt and income tax provision (benefit) to DNOI for 2010 and 2009:
| Years ended December 31, |
||||||||
| (in thousands, except per share data) |
2010 | 2009 | ||||||
| Net operating income before net investment loss, gain on extinguishment of debt and income tax provision(benefit) |
$ | 40,565 | $ | 38,188 | ||||
| Amortization of employee restricted stock awards |
4,342 | 7,727 | ||||||
|
|
|
|
|
|||||
| DNOI |
$ | 44,907 | $ | 45,915 | ||||
|
|
|
|
|
|||||
| Per common share data (basic and diluted) |
||||||||
| Weighted-average common shares outstanding |
75,422 | 74,692 | ||||||
| Loss per common share |
$ | (0.17 | ) | $ | (0.68 | ) | ||
| Net operating income before net investment loss, gain on extinguishment of debt and income tax provision (benefit) per common share |
$ | 0.54 | $ | 0.51 | ||||
| DNOI per common share |
$ | 0.60 | $ | 0.61 | ||||
NET INVESTMENT LOSS BEFORE INCOME TAX PROVISION (BENEFIT)
During 2010, we incurred $54.8 million of net investment loss before income tax provision (benefit), compared to $94.4 million of losses during 2009. The following table summarizes our realized and unrealized (loss) and gain on investments and changes in our unrealized appreciation and depreciation on investments for the year ended December 31, 2010:
| (in thousands) |
Year ended December 31, 2010 | |||||||||||||||||||
| Portfolio Company |
Industry |
Type |
Realized (Loss)/ Gain |
Unrealized (Depreciation) / Appreciation |
Reversal of Unrealized Depreciation/ (Appreciation) |
Net (Loss)/ Gain |
||||||||||||||
| Broadview Network Holdings, Inc. |
Communications | Control | $ | — | $ | (35,965 | ) | $ | — | $ | (35,965 | ) | ||||||||
| Jet Plastica Investors, LLC |
Plastic Products | Control | — | (28,048 | ) | — | (28,048 | ) | ||||||||||||
| Active Brands International, Inc. |
Consumer Products | Non-affiliate | — | (18,515 | ) | — | (18,515 | ) | ||||||||||||
| Total Sleep Holdings, Inc. |
Healthcare | Control | — | (5,271 | ) | — | (5,271 | ) | ||||||||||||
| JetBroadband Holdings, LLC |
Cable | Control | (5,943 | ) | (1,756 | ) | 3,418 | (4,281 | ) | |||||||||||
| PremierGarage Holdings, LLC |
Home Furnishings | Control | — | (4,109 | ) | — | (4,109 | ) | ||||||||||||
| Intran Media, LLC |
Other Media | Control | — | (3,223 | ) | — | (3,223 | ) | ||||||||||||
| B&H Education, Inc. |
Education | Non-affiliate | 3,678 | (72 | ) | (3,642 | ) | (36 | ) | |||||||||||
| Jenzabar, Inc. |
Technology | Non-affiliate | — | 7,319 | — | 7,319 | ||||||||||||||
| RadioPharmacy Investors, LLC |
Healthcare | Control | — | 7,150 | — | 7,150 | ||||||||||||||
| Avenue Broadband LLC |
Cable | Control | — | 6,497 | — | 6,497 | ||||||||||||||
| MCI Holdings LLC |
Healthcare | Non-affiliate | 9,531 | 3,486 | (9,663 | ) | 3,354 | |||||||||||||
| Stratford School Holdings, Inc. |
Education | Affiliate | — | 3,103 | — | 3,103 | ||||||||||||||
| GSDM Holdings, LLC |
Healthcare | Non-affiliate | — | 2,080 | — | 2,080 | ||||||||||||||
| Metropolitan Telecommunications Holding Company |
Communications | Non-affiliate | 10,157 | 3,610 | (11,756 | ) | 2,011 | |||||||||||||
| Coastal Holdings, LLC |
Real Estate Investments | Non-Affiliate | — | 1,795 | — | 1,795 | ||||||||||||||
| Teleguam Holdings , LLC |
Communications | Non-affiliate | — | 1,695 | — | 1,695 | ||||||||||||||
| Orbitel Holdings, LLC |
Cable | Control | — | 1,122 | — | 1,122 | ||||||||||||||
| Golden Knight II CLO, Ltd. |
Diversified Financial Services | Non-Affiliate | — | 1,096 | — | 1,096 | ||||||||||||||
| G&L Investment Holdings, LLC |
Insurance | Non-Affiliate | — | 1,086 | — | 1,086 | ||||||||||||||
| Sagamore Hill Broadcasting, LLC |
Broadcasting | Non-affiliate | — | 1,057 | — | 1,057 | ||||||||||||||
| Quantum Medical Holdings, LLC |
Laboratory Instruments | Non-affiliate | 1,362 | 357 | (1,074 | ) | 645 | |||||||||||||
| Home Interiors & Gifts, Inc. |
Home Furnishings | Control | (3,458 | ) | 1 | 3,645 | 188 | |||||||||||||
| WebMediaBrands Inc. |
Information Services | Non-affiliate | (1,981 | ) | — | 1,984 | 3 | |||||||||||||
| Other (< $1 million net gain (loss)) |
(1,492 | ) | 3,995 | 1,925 | 4,428 | |||||||||||||||
|
|
|
|
|
|
|
|
|
|||||||||||||
| Total |
$ | 11,854 | $ | (51,510 | ) | $ | (15,163 | ) | $ | (54,819 | ) | |||||||||
|
|
|
|
|
|
|
|
|
|||||||||||||
57
Table of Contents
During 2010, we sold our investments in MCI Holdings, LLC, JetBroadband Holdings, LLC; B&H Education, Inc.; Quantum Medical Holdings, LLC; and WebMediaBrands, Inc., as well as warrants to purchase common stock that we held in Metropolitan Telecommunications Holding Company. For each of these sales, we reversed unrealized appreciation (depreciation), that we had previously recognized and recorded a realized gain or (loss).
During 2010, we recorded $36.0 million of unrealized depreciation on our investment in Broadview, which reflects a number of inputs into our estimate of the fair value of this investment, including merger and acquisition comparables, private market transactions, public company comparables, a discounted cash flow analysis and an independent third-party valuation. In addition, we recognized unrealized depreciation on other investments in our portfolio, including Jet Plastica Investors, LLC; Active Brands International, Inc.; Total Sleep Holdings, Inc.; and PremierGarage Holdings, LLC, primarily because of a decrease in the performance of these companies and a reduction in valuation multiples. The remaining unrealized (depreciation) appreciation shown in the above table resulted predominantly from changes in the performance of certain of our portfolio companies and the multiples used to value certain of our investments.
The following table summarizes our realized and unrealized (loss) gain on investments and changes in our unrealized appreciation and depreciation on investments during 2009:
| (in thousands) |
Year ended December 31, 2009 | |||||||||||||||||||
| Portfolio Company |
Industry |
Type |
Realized (Loss)/Gain |
Unrealized Appreciation/ (Depreciation) |
Reversal of Unrealized (App reciation)/ Depreciation |
Net (Loss)/ Gain |
||||||||||||||
| Total Sleep Holdings, Inc. |
Healthcare | Control | $ | — | $ | (24,624 | ) | $ | — | $ | (24,624 | ) | ||||||||
| TNR Holdings Corp. |
Entertainment | Control | (36,716 | ) | (15,801 | ) | 36,889 | (15,628 | ) | |||||||||||
| Stratford School Holdings, Inc. |
Education | Affiliate | — | (8,219 | ) | — | (8,219 | ) | ||||||||||||
| Active Brands International, Inc. |
Consumer Products | Non-affiliate | — | (7,828 | ) | — | (7,828 | ) | ||||||||||||
| NPS Holdings Group, LLC |
Business Services | Control | (1,580 | ) | (7,272 | ) | 1,574 | (7,278 | ) | |||||||||||
| Jenzabar, Inc. |
Technology | Non-affiliate | — | (6,929 | ) | — | (6,929 | ) | ||||||||||||
| GMC Television Broadcasting, LLC |
Broadcasting | Control | — | (6,200 | ) | — | (6,200 | ) | ||||||||||||
| VOX Communications Group Holdings, LLC |
Broadcasting | Non-affiliate | — | (4,779 | ) | — | (4,779 | ) | ||||||||||||
| RadioPharmacy Investors, LLC |
Healthcare | Control | — | (3,410 | ) | — | (3,410 | ) | ||||||||||||
| Summit Business Media Intermediate Holding Company, LLC |
Information Services | Non-affiliate | — | (3,366 | ) | — | (3,366 | ) | ||||||||||||
| Cruz Bay Publishing, Inc. |
Publishing | Non-affiliate | — | (3,297 | ) | — | (3,297 | ) | ||||||||||||
| CWP/RMK Acquisition Corp. |
Home Furnishings | Non-affiliate | (10,692 | ) | (3,621 | ) | 11,509 | (2,804 | ) | |||||||||||
| Coastal Sunbelt Real Estate, Inc. |
Real Estate Investments | Non-affiliate | — | (2,706 | ) | — | (2,706 | ) | ||||||||||||
| Jet Plastica Investors, LLC |
Plastic Products | Control | — | (2,507 | ) | — | (2,507 | ) | ||||||||||||
| Intran Media, LLC |
Other Media | Control | — | (1,563 | ) | — | (1,563 | ) | ||||||||||||
| Cleartel Communications, Inc. |
Communications | Control | (150,212 | ) | (1,352 | ) | 150,136 | (1,428 | ) | |||||||||||
| Avenue Broadband LLC |
Cable | Control | — | (1,309 | ) | — | (1,309 | ) | ||||||||||||
| Construction Trailer Specialists, Inc. |
Auto Parts | Non-affiliate | — | (1,245 | ) | — | (1,245 | ) | ||||||||||||
| CEI Holdings Inc. |
Cosmetics | Non-affiliate | (3,190 | ) | (926 | ) | 3,179 | (937 | ) | |||||||||||
| Flexsol Packaging Corp. |
Plastic Products | Non-affiliate | (2,821 | ) | (847 | ) | 2,772 | (896 | ) | |||||||||||
| B&H Education, Inc. |
Education | Non-affiliate | — | 3,204 | — | 3,204 | ||||||||||||||
| PremierGarage Holdings, LLC |
Home Furnishings | Control | — | 1,497 | — | 1,497 | ||||||||||||||
| Cyrus Networks, LLC |
Business Services | Non-affiliate | — | 1,406 | 34 | 1,440 | ||||||||||||||
| Golden Knight II CLO, Ltd. |
Diversified Financial Services | Non-affiliate | — | 1,401 | — | 1,401 | ||||||||||||||
| LMS INTELLIBOUND, INC. |
Logistics | Control | 16,257 | — | (15,065 | ) | 1,192 | |||||||||||||
| GSDM Holdings LLC |
Healthcare | Non-affiliate | — | 1,052 | — | 1,052 | ||||||||||||||
| Teleguam Holdings, LLC |
Communications | Non-affiliate | — | 1,024 | — | 1,024 | ||||||||||||||
| Marietta Intermediate Holding Corporation |
Cosmetics | Non-affiliate | (1,832 | ) | — | 2,028 | 196 | |||||||||||||
| XFone, Inc. |
Communications | Affiliate | (1,969 | ) | — | 1,969 | — | |||||||||||||
| Other |
771 | 618 | 205 | 1,594 | ||||||||||||||||
|
|
|
|
|
|
|
|
|
|||||||||||||
| Total |
$ | (191,984 | ) | $ | (97,599 | ) | $ | 195,230 | $ | (94,353 | ) | |||||||||
|
|
|
|
|
|
|
|
|
|||||||||||||
During 2009, we wrote off our investment in Cleartel Communications, Inc., which resulted in the realization of a $150.2 million loss and the reversal of $150.1 million of unrealized depreciation that we had recorded in previous years. In addition, we sold our investments in TNR Holdings, Inc.; CEI Holdings, Inc.; Flexsol Packaging Corp.; XFone, Inc.; and Marietta Intermediate Holding Corporation, as well as our equity investments in CWP/RMK Acquisition Corp., and LMS INTELLIBOUND, INC. For each of these sales, we reversed unrealized appreciation (depreciation), that we had recognized in previous years and we recorded a realized gain or (loss). These changes and the remaining unrealized depreciation shown in the above table resulted predominantly from decreases in the performance of certain of the portfolio companies, and, to a lesser extent, decreases in the comparable multiples that we used to estimate the fair value of the investments.
58
Table of Contents
GAIN ON EXTINGUISHMENT OF DEBT
In 2010, we repurchased $8.0 million of collateralized loan obligations for $4.4 million that previously had been issued by our Commercial Loan Trust 2006-1. We recognized a $3.6 million gain on extinguishment of debt, excluding the effect of the amortization of the acceleration of $0.1 million in deferred debt costs during 2010. In accordance with our former agreement with noteholders of our private placement notes, we used certain of the proceeds from the monetization of unencumbered investments to repurchase $25.3 million of our private placement notes. Under the terms of the former agreement with the private placement noteholders, we were required to repurchase these notes at a 102% premium over the principal amount of these notes, which resulted in our recognition of a $0.5 million loss on the extinguishment of this debt during 2010.
In January 2009, we repurchased $7.5 million of collateralized loan obligations for $2.1 million that previously had been issued by our wholly owned subsidiary, Commercial Loan Trust 2006-1. As a result of this purchase, we recognized a $5.4 million gain on extinguishment of debt during 2009. Partially offsetting this gain was $0.4 million of premiums we paid when we repurchased $18.5 million of our Private Placement Notes.
INCOME TAX PROVISION (BENEFIT)
During 2010, we recorded a $1.8 million income tax provision compared to a $0.1 million income tax benefit during 2009. Approximately $1.6 million of the income tax expense accrued for the year ended December 31, 2010 was attributable to the sale of JetBroadband in July 2010. The remaining tax expense for 2010 and the income tax benefit for 2009 were primarily attributable to unrealized depreciation or appreciation and flow-through taxable income on certain investments held by our subsidiaries.
NET LOSS
During 2010, we recorded a net loss of $13.1 million compared to a net loss of $51.1 million during 2009. This improvement is attributable to the items discussed above.
FINANCIAL CONDITION, LIQUIDITY AND CAPITAL RESOURCES
CASH AND CASH EQUIVALENTS, CASH, SECURITIZATION ACCOUNTS, AND CASH, RESTRICTED
Our Consolidated Balance Sheets and our Consolidated Statements of Cash Flows reflect three categories of cash: cash and cash equivalents; cash, securitization accounts; and cash, restricted. Each of these categories is described more fully below:
| • | Cash and cash equivalents represents unrestricted cash, including checking accounts, interest bearing deposits collateralized by marketable debt securities and highly liquid investments with original maturities of 90 days or less. As of December 31, 2011 and 2010, we had $58.6 million and $45.0 million, respectively, in cash and cash equivalents. As of December 31, 2011, our cash and cash equivalents included $44.4 million that was held in interest-bearing accounts. |
| • | Cash, securitization accounts include principal and interest payments received on securitized loans, which, are held in designated bank accounts until monthly or quarterly disbursements are made from the securitization trusts. We are generally required to use a portion of these amounts to pay interest expense, reduce borrowings or pay other amounts in accordance with the related securitization agreements. Cash in securitization accounts has a negative impact on our earnings since the interest we pay on borrowings typically exceeds the rate of return that we are able to earn on temporary cash investments. Our objective is to maintain sufficient cash-on-hand and availability under our debt facilities to cover current funding requirements. As of December 31, 2011 and 2010, we had $40.3 million and $42.2 million, respectively, in cash, securitization accounts. |
| • | Cash, restricted includes cash held for regulatory purposes and cash held in escrow. The largest component of restricted cash was represented by cash held by Solutions Capital, our SBIC, which generally is restricted to the origination of new loans from our SBIC. As of December 31, 2011 and 2010, we had $35.0 million and $29.4 million respectively, of restricted cash. |
59
Table of Contents
During the year ended December 31, 2011, our operating activities provided $188.3 million of cash and cash equivalents, compared to $35.8 million used during the year ended December 31, 2010. The $224.1 million increase in cash provided by operating activities resulted primarily from increased monetizations which was partially offset by increased investments in portfolio companies. During the year ended December 31, 2011, our financing activities used $174.7 million of cash, compared to $26.6 million provided during the year ended December 31, 2010. This $201.3 million increase in cash used in financing activities was due primarily to a $61.0 million net increase in cash held in securitization and restricted cash accounts, a $30.9 million increase in payments of dividends, a $53.5 million increase in payments on borrowings, and a $56.0 million decrease in proceeds from our borrowings.
LIQUIDITY AND CAPITAL RESOURCES
The availability of debt and equity capital continues to be constrained. We believe that we will continue to be constrained by the limited access we have to debt and equity capital. Because our stock continues to trade below net asset value and we do not have stockholder approval to sell equity below our net asset value, we effectively lack access to the equity markets. Lenders, in general, may be reluctant to extend credit to us without such equity capital markets access.
We expect to continue to monetize our equity investments to reduce them to less than 10% of the fair value of our portfolio over the next few years. We generally expect to limit our future investing activities principally to debt investments and do not intend to make significant investments in control companies beyond those that are currently in our portfolio for the foreseeable future. To help provide sustainable stockholder value, we expect to make future distributions to stockholders based upon an assessment of the minimum statutorily required level of distributions, gains and losses recognized for tax purposes, portfolio transactional events, our liquidity, cash earnings and our BDC asset coverage ratio at the time of such decision.
As discussed in Liquidity and Capital Resources—Borrowings, the reinvestment period for the MCG Commercial Loan Funding Trust facility ended on July 20, 2011 and all future principal collections from collateral in the facility will be used to repay the securitized debt. On October 20, 2011, we used $80.2 million of securitized cash in that facility (primarily representing previous principal collections) to repay that facility.
We have incurred $4.3 million of restructuring expenses during the year ended December 31, 2011. We expect to incur approximately $80,000 of additional restructuring charges through 2013 which represents accretion costs. Excluding these severance and severance-related costs, we believe that the implementation of this restructuring plan, which included the closure of one of our offices and other reductions in our general and administrative expense, will result in approximately $6.7 million to $7.0 million of savings through December 31, 2012.
Although there can be no assurance, we believe we have sufficient liquidity to meet our operating requirements for 2012, as well as liquidity for new origination opportunities and potential dividend distributions.
60
Table of Contents
LIQUIDITY AND CAPITAL RESOURCES—BORROWINGS
As of December 31, 2011, we reported $430.2 million of borrowings on our Consolidated Balance Sheets at cost. We estimate that the fair value of these borrowings as of December 31, 2011 was approximately $412.6 million, based on market data and current interest rates. As of December 31, 2011, the weighted-average annual interest rate on all of our outstanding borrowings was 2.7%, excluding the amortization of deferred debt issuance costs. The following table summarizes our borrowing facilities and the potential borrowing capacity of those facilities and contingent borrowing eligibility of Solutions Capital, a wholly owned subsidiary, as an SBIC, under the SBIC Act.
| December 31, 2011 | December 31, 2010 | |||||||||||||||||||
| (dollars in thousands) |
Maturity Date | Total Facility/ Program |
Amount Outstanding |
Total Facility/ Program |
Amount Outstanding |
|||||||||||||||
| Private Placement Notes |
||||||||||||||||||||
| Series 2005-A |
October 2011 | $ | — | $ | — | $ | 17,434 | $ | 17,434 | |||||||||||
| Series 2007-A |
October 2012 | (a) | 8,717 | 8,717 | 8,717 | 8,717 | ||||||||||||||
|
Commercial Loan Funding Trust |
||||||||||||||||||||
| Variable Funding Note |
January 2014 | (b) | 150,000 | 55,822 | 150,000 | 100,251 | ||||||||||||||
|
Commercial Loan Trust 2006-1 |
||||||||||||||||||||
| Series 2006-1 Class A-1 Notes |
April 2018 | (c) | 63,389 | 63,389 | 106,250 | 106,250 | ||||||||||||||
| Series 2006-1 Class A-2 Notes |
April 2018 | (c) | 2,983 | 2,983 | 50,000 | — | ||||||||||||||
| Series 2006-1 Class A-3 Notes |
April 2018 | (c) | 50,711 | 50,711 | 85,000 | 85,000 | ||||||||||||||
| Series 2006-1 Class B Notes |
April 2018 | (c) | 58,750 | 58,750 | 58,750 | 58,750 | ||||||||||||||
| Series 2006-1 Class C Notes(d) |
April 2018 | (c) | 45,000 | 32,000 | 45,000 | 32,000 | ||||||||||||||
| Series 2006-1 Class D Notes(e) |
April 2018 | (c) | 46,494 | 29,247 | 47,500 | 29,880 | ||||||||||||||
|
SBIC (Maximum borrowing potential)(f) |
(g | ) | 150,000 | 128,600 | 130,000 | 108,600 | ||||||||||||||
|
|
|
|
|
|
|
|
|
|||||||||||||
| Total borrowings |
$ | 576,044 | $ | 430,219 | $ | 698,651 | $ | 546,882 | ||||||||||||
|
|
|
|
|
|
|
|
|
|||||||||||||
| (a) | In January 2012, we repaid in full and terminated the Series 2007-A private placement notes. |
| (b) | In January 2012, this facility entered a 24-month amortization period and the legal final maturity date was extended to January 2014. |
| (c) | Borrowings under the MCG Commercial Loan Trust 2006-1 facility are listed based on the contractual maturity date. The reinvestment period for this facility ended on July 20, 2011 and we will use all future principal collections from collateral in the facility to repay the securitized debt. |
| (d) | Amount outstanding excludes $5.0 million of notes that we repurchased in December 2008 for $1.6 million and $8.0 million of notes that we repurchased in April 2010 for $4.4 million. As part of the consolidation process, we eliminated the notes that MCG, the parent company, purchased. |
| (e) | Amount outstanding excludes $10.1 million of notes that we repurchased in December 2008 for $2.4 million and $7.5 million of notes that we repurchased in January 2009 for $2.1 million. As part of the consolidation process, we eliminated the notes that MCG, the parent company, purchased. |
| (f) | As of December 31, 2011, we had the potential to borrow up to $150.0 million of SBA-guaranteed debentures under the SBIC program. As of December 31, 2011, the SBA had approved and committed up to $150.0 million in borrowings to the SBIC. As of December 31, 2011, we have funded $75.0 million, which allows us to utilize the full $150.0 million borrowing potential approved and committed by the SBA under this program. In January 2012, Solutions Capital borrowed the remaining $21.4 million of the commitment. |
| (g) | As of December 31, 2011, we could originate new borrowings under the $150.0 million commitment made by the SBA through September 2015. We must repay borrowings under the SBIC program within ten years after the borrowing date, which will occur between September 2018 and September 2025. In January 2012, Solutions Capital borrowed the remaining $21.4 million of the commitment; therefore, repayment of our SBIC borrowings will occur between September 2018 and March 2022. |
Each of our credit facilities has certain collateral requirements and/or financial covenants. As of December 31, 2011, the net worth covenant of our SunTrust Warehouse required that we maintain a consolidated tangible net worth of not less than $450.0 million, plus 50% of any equity raised after February 26, 2009. However, in January 2012, the net worth covenant requirement was amended effective as of and after December 31, 2008 to be not less than $375.0 million, plus 50% of any equity raised after February 26, 2009. Under the SunTrust Warehouse covenants, we must also maintain an asset coverage ratio of at least 180%.
As of December 31, 2011, our asset coverage ratio was 244% and we had $21.4 million of unused, currently available borrowing capacity remaining in our SBIC subsidiary (subject to the SBA’s approval) that is exempt from the asset coverage ratio requirements under the SEC exemptive order issued to us in October 2008.
As of December 31, 2011, we were in compliance with all key financial covenants under each of our borrowing facilities, although there can be no assurance regarding compliance in future periods. On our website, we have provided a list of hyperlinks to each of our borrowing agreements where these covenant requirements can be reviewed. You may view this list at http://www.mcgcapital.com/. We are not including the information contained on our website as a part of, or incorporating it by reference into, this Annual Report on Form 10-K.
Our access to current and future liquidity from our borrowing facilities depends on several factors, including, but not limited to: the credit quality of our investment portfolio, including those investments used to collateralize borrowing facilities; the magnitude of our investments in individual companies and the industries in which they operate; our compliance with specific covenants in each borrowing agreement; and the specific provisions of our borrowing facilities.
61
Table of Contents
As each of our borrowing facilities matures, it is important that we have sufficient liquidity available to repay our borrowing obligations. We may obtain the liquidity for repayment of our borrowing facilities from a number of sources, including cash on-hand, the maturity or monetization of our investment portfolio, other borrowing facilities and equity issuances, and from other borrowing arrangements.
We fund all of our current debt facilities through our bankruptcy remote, special-purpose, wholly owned subsidiaries. Therefore, these subsidiaries’ assets may not be available to our creditors. In some cases, advances under our debt facilities are subject to certain collateral levels, collateral quality, leverage and other restrictive covenants. We continue to service those portfolio investments that we use as collateral in our secured borrowing facilities.
PRIVATE PLACEMENT NOTES
In October 2005, we issued $50.0 million of Series 2005-A unsecured notes with a five-year maturity. Initially, the Series 2005-A notes bore interest at 6.73% per annum, which was amended in 2009 to 9.98% per annum. In March 2011, we repaid the Series 2005-A notes in full.
In October 2007, we issued $25.0 million of Series 2007-A unsecured notes with a five-year maturity. Initially, the Series 2007-A notes bore interest at a 6.71% per annum, which was amended in 2009 to 8.96% per annum. In January 2012, we repaid the Series 2007-A notes in full.
COMMERCIAL LOAN FUNDING TRUST
As of December 31, 2011, we had a $55.8 million balance outstanding under the SunTrust Warehouse, which was originally funded through Three Pillars Funding LLC, an asset-backed commercial paper conduit administered by SunTrust Robinson Humphrey, Inc. and is now funded through SunTrust Bank. The SunTrust Warehouse is secured primarily by MCG Commercial Loan Funding Trust’s assets, including commercial loans that MCG Capital Corporation, the parent, sold to the trust. The pool of commercial loans in the trust must meet certain requirements, such as term, average life, investment rating and agency rating. The pool of commercial loans must also meet certain requirements related to portfolio performance, including required minimum portfolio yield and limitations on delinquencies and charge-offs. In January 2012, we entered into an amendment to the SunTrust Warehouse, which among other things, accelerated the scheduled termination date to January 2012 and set the final maturity of this facility to January 17, 2014.
Under the SunTrust Warehouse, we are required to comply with various covenants, reporting requirements and other customary requirements for similar revolving credit facilities, including, without limitation, covenants related to: a) limitations on the incurrence of additional indebtedness and liens; b) limitations on certain investments; c) limitations on certain restricted payments; d) maintaining a certain minimum stockholders’ equity; e) maintaining a ratio of total assets (less total liabilities and indebtedness not represented by senior securities) to total indebtedness represented by senior securities, of the Company and its subsidiaries, of not less than 1.8:1.0; and f) maintaining minimum liquidity.
In addition, under our SunTrust Warehouse, if Richard W. Neu, B. Hagen Saville or Stephen J. Bacica ceases to be involved actively in the management of MCG and is not replaced by a person reasonably acceptable to SunTrust within 90 consecutive calendar days of such occurrence, we would be in default under such facility. If we lose the services of any of Messrs. Neu, Saville or Bacica and are unable to identify and hire a suitably qualified replacement(s), it could provide SunTrust with the right to accelerate the facility and entitle the administrative agent thereunder to exercise available remedies, including selling the collateral securing this facility and applying the proceeds to reduce outstanding borrowings thereunder.
62
Table of Contents
The following table sets forth the maturity of the SunTrust Warehouse, as well as the maturity of the securitized assets and the December 31, 2011 balance of securitized cash in this borrowing facility.
| Maturities | ||||||||||||||||||||
| (in thousands) |
Total | Less than 1 year |
1-3 years | 4-5 years | After 5 years |
|||||||||||||||
| Borrowings |
$ | 55,822 | $ | 4,765 | $ | 51,057 | $ | — | $ | — | ||||||||||
|
|
|
|
|
|
|
|
|
|
|
|||||||||||
| Collateral |
||||||||||||||||||||
| Securitized investments |
125,397 | 4,349 | 58,141 | 62,907 | — | |||||||||||||||
| Cash, securitization accounts |
15,111 | 15,111 | — | — | — | |||||||||||||||
|
|
|
|
|
|
|
|
|
|
|
|||||||||||
| Total collateral |
$ | 140,508 | $ | 19,460 | $ | 58,141 | $ | 62,907 | $ | — | ||||||||||
|
|
|
|
|
|
|
|
|
|
|
|||||||||||
COMMERCIAL LOAN TRUST 2006-1
As of December 31, 2011, we had $237.1 million of securitized debt outstanding under the Commercial Loan Trust 2006-1, which matures in April 2018. We retain all of the equity in the securitization. The pool of commercial loans in the trust must meet certain requirements, such as asset mix and concentration, collateral coverage, term, agency rating, minimum coupon, minimum spread and sector diversity requirements. The securitization included a five-year reinvestment period, during which the trust was permitted to use principal collections received on the underlying collateral to purchase new collateral from us.
The following table sets forth the maturity of this facility, as well as the maturity of the securitized assets and the current balance of securitized cash in this borrowing facility.
| Maturities | ||||||||||||||||||||
| (in thousands) |
Total | Less than 1 year |
1-3 years | 4-5 years | After 5 years |
|||||||||||||||
| Borrowings(a) |
$ | 237,080 | $ | 19,501 | $ | — | $ | — | $ | 217,579 | ||||||||||
|
|
|
|
|
|
|
|
|
|
|
|||||||||||
| Collateral |
||||||||||||||||||||
| Fair value of securitized investments |
302,362 | 7,831 | 93,494 | 188,444 | 12,593 | |||||||||||||||
| Fair value of equity investments |
282 | — | — | — | 282 | (b) | ||||||||||||||
| Cash, securitization account |
25,195 | 25,195 | — | — | — | |||||||||||||||
|
|
|
|
|
|
|
|
|
|
|
|||||||||||
| Total collateral |
$ | 327,839 | $ | 33,026 | $ | 93,494 | $ | 188,444 | $ | 12,875 | ||||||||||
|
|
|
|
|
|
|
|
|
|
|
|||||||||||
| (a) | Borrowings under the MCG Commercial Loan Trust 2006-1 facility are listed based on the contractual maturity date. The reinvestment period for this facility ended on July 20, 2011 and all future principal collections from collateral in the facility will be used to repay the securitized debt. |
| (b) | Equity investments do not have a stated maturity date. |
We were able to use the cash in the securitized account, as well as proceeds from principal collections of securitized investments, to originate new loans until July 20, 2011. The reinvestment period ended on July 20, 2011 and all subsequent principal collections received will be used to repay the securitized debt. On October 20, 2011, the next payment date for this facility after the end of the reinvestment period, we used $80.2 million of securitized cash in that facility (primarily representing previous principal collections) to repay a portion of this facility. Any additional principal collections or monetization proceeds that we receive from collateral used to securitize this Commercial Loan Trust 2006-1 must be applied to the outstanding balance of that facility. Upon maturity of this facility, any remaining balance must be repaid, otherwise all or part of the associated collateral may be forfeited. As shown in the above table, repayments of principal of the collateral held by this facility are expected to permit the repayment of Commercial Loan Trust 2006-1 prior to its April 2018 maturity.
SBIC DEBENTURES
In December 2004, we formed a wholly owned subsidiary, Solutions Capital. Solutions Capital has a license from the SBA to operate as an SBIC under the SBIC Act. As of December 31, 2011, the license gave Solutions Capital the potential to borrow up to $150.0 million, which is the maximum amount of outstanding leverage available to single-license SBIC companies. The maximum amount of outstanding leverage available to SBIC companies with multiple licenses is $225.0 million on an aggregate basis.
In total, the SBA has approved and committed $150.0 million in borrowings to Solutions Capital, subject to certain capital requirements and customary procedures. We may use these funds to provide debt and equity capital to qualifying small businesses. We may use the borrowings from the SBA to fund new originations; however, we may not use these borrowings to originate debt to certain companies that are currently in our portfolio without SBA approval. In addition, we may not use these funds for MCG’s, the parent company’s, working capital.
63
Table of Contents
To realize the full $150.0 million potential borrowing for which we have received approval under this program, we needed to fund a total of $75.0 million to Solutions Capital, which we have done as of December 31, 2011. As of December 31, 2011, $128.6 million of SBA borrowings were outstanding, and in January 2012, Solutions Capital borrowed the remaining $21.4 million of the commitment.
SBICs are subject to regulation and oversight by the SBA, including requirements with respect to maintaining certain minimum financial ratios and other covenants. Receipt of an SBIC license does not assure that an SBIC will receive SBA-guaranteed debenture funding, which is dependent upon continued compliance with SBA regulations and policies. The SBA, as a creditor, will have superior claim to Solutions Capital’s assets over our stockholders in the event we liquidate Solutions Capital or the SBA exercises its remedies under the SBA-guaranteed debentures issued by Solutions Capital upon an event of default.
The following table sets forth the maturity of Solutions Capital debentures, as well as the maturity of the investments and the current balance of restricted cash in Solutions Capital as of December 31, 2011.
| Maturities | ||||||||||||||||||||
| (in thousands) |
Total | Less than 1 year |
1-3 years | 4-5 years | After 5 years |
|||||||||||||||
| Borrowings |
$ | 128,600 | $ | — | $ | — | $ | — | $ | 128,600 | ||||||||||
|
|
|
|
|
|
|
|
|
|
|
|||||||||||
| Collateral |
||||||||||||||||||||
| Fair value of debt investments |
173,070 | — | 3,720 | 157,147 | 12,203 | |||||||||||||||
| Fair value of equity investments |
9,341 | — | — | — | 9,341 | (a) | ||||||||||||||
| Cash, restricted account |
28,762 | 28,762 | — | — | — | |||||||||||||||
|
|
|
|
|
|
|
|
|
|
|
|||||||||||
| Total collateral |
$ | 211,173 | $ | 28,762 | $ | 3,720 | $ | 157,147 | $ | 21,544 | ||||||||||
|
|
|
|
|
|
|
|
|
|
|
|||||||||||
| (a) | Equity investments do not have a stated maturity date. |
As shown in the above table, the collateral in this facility exceeds the outstanding balance.
WEIGHTED-AVERAGE BORROWINGS AND COST OF FUNDS
The following table shows our weighted-average borrowings, the weighted-average interest rate on all of our borrowings, including amortization of deferred debt issuance costs and commitment fees, the average LIBOR, and the average spread to LIBOR for 2011 and 2010:
| For the year ended | ||||||||||||
| (dollars in thousands) |
December 31, 2011 | December 31, 2010 | ||||||||||
| Weighted-average borrowings |
$ | 501,116 | $ | 524,632 | ||||||||
|
|
|
|
|
|||||||||
| Average LIBOR |
0.34 | % | 0.35 | % | ||||||||
| Average spread to LIBOR, excluding amortization of deferred debt issuance costs |
2.15 | 2.33 | ||||||||||
| Impact of amortization of deferred debt issuance costs |
0.59 | 0.50 | ||||||||||
|
|
|
|
|
|||||||||
| Weighted-average cost of funds |
3.08 | % | 3.18 | % | ||||||||
|
|
|
|
|
|||||||||
LIQUIDITY AND CAPITAL RESOURCES—COMMON STOCK
We are a closed-end investment company that has elected to be regulated as a BDC under the 1940 Act. The 1940 Act prohibits us from selling shares of our common stock at a price below the current NAV of such stock, except in limited circumstances, including approval by our stockholders of such a sale and certain determinations by our board of directors.
OFF-BALANCE SHEET ARRANGEMENTS
FINANCIAL INSTRUMENTS
We are party to financial instruments with off-balance sheet risk in the normal course of business to meet the financial needs of our customers. These instruments include commitments to extend credit and involve, to varying degrees, elements of credit risk in excess of the amount recognized in the balance sheet. We attempt to limit our credit risk by conducting extensive due diligence and obtaining collateral where appropriate.
Commitments to extend credit include the unused portions of commitments that obligate us to extend credit in the form of loans, participations in loans, guarantees, letters of credit and other financial commitments. Commitments to extend credit would also include loan proceeds we are obligated to advance, such as loan draws, rotating or revolving credit arrangements, or similar transactions. Commitments generally have fixed
64
Table of Contents
expiration dates or other termination clauses and may require payment of a fee by the counterparty. Since many of the commitments are expected to expire without being drawn upon, the total commitment amounts do not necessarily represent future cash requirements.
We do not report the unused portions of these commitments on our Consolidated Balance Sheets. As of December 31, 2011, we had $22.6 million of outstanding unused loan commitments, as shown in the table below. We believe that our operations, monetizations and unrestricted cash will provide sufficient liquidity to fund, as necessary, requests to draw on these unfunded commitments. We estimate that the fair value of these commitments was $0.1 million based on the fees that we currently charge to enter into similar arrangements, taking into account the creditworthiness of the counterparties. From time to time, we provide guarantees or standby letters of credit on behalf of our portfolio companies. As of December 31, 2011, we had no outstanding guarantees or standby letters of credit.
| (in thousands) |
As of December 31, 2011 | |||||||||||||||
| Unused commitments to portfolio companies | Non-Affiliate Investments |
Affiliate Investments |
Control Investments |
Total | ||||||||||||
| Revolving credit facilities |
$ | 8,886 | $ | 6,200 | $ | 3,769 | $ | 18,855 | ||||||||
| Other |
2,027 | — | 1,750 | 3,777 | ||||||||||||
|
|
|
|
|
|
|
|
|
|||||||||
| Total unused commitments to portfolio companies |
$ | 10,913 | $ | 6,200 | $ | 5,519 | $ | 22,632 | ||||||||
|
|
|
|
|
|
|
|
|
|||||||||
CONTRACTUAL OBLIGATIONS
The following table shows our contractual obligations as of December 31, 2011:
| (in thousands) |
Payments Due by Period | |||||||||||||||||||
| Contractual Obligations(a) |
Total | Less than 1 year |
1-3 years | 4-5 years | After 5 years |
|||||||||||||||
| Borrowings |
||||||||||||||||||||
| Term securitizations(b) |
$ | 237,080 | $ | 19,501 | $ | — | $ | — | $ | 217,579 | ||||||||||
| Warehouse facility |
55,822 | 4,765 | 51,057 | — | — | |||||||||||||||
| Unsecured notes |
8,717 | 8,717 | — | — | — | |||||||||||||||
| SBIC |
128,600 | — | — | — | 128,600 | |||||||||||||||
|
|
|
|
|
|
|
|
|
|
|
|||||||||||
| Total borrowings |
430,219 | 32,983 | 51,057 | — | 346,179 | |||||||||||||||
| Interest payments on borrowings(c) |
74,177 | 11,518 | 19,370 | 16,630 | 26,659 | |||||||||||||||
| Operating leases |
2,529 | 2,137 | 392 | — | — | |||||||||||||||
| Severance obligations(d) |
5,493 | 3,779 | 1,714 | — | — | |||||||||||||||
|
|
|
|
|
|
|
|
|
|
|
|||||||||||
| Total contractual obligations |
$ | 512,418 | $ | 50,417 | $ | 72,533 | $ | 16,630 | $ | 372,838 | ||||||||||
|
|
|
|
|
|
|
|
|
|
|
|||||||||||
| (a) | Excludes the unused commitments to extend credit to our customers of $22.6 million as discussed above. |
| (b) | Borrowings under the MCG Commercial Loan Trust 2006-1 facility are listed based on the contractual maturity date. The reinvestment period for this facility ended on July 20, 2011 and all future principal collections from collateral in the facility will be used to repay the securitized debt. |
| (c) | Interest payments are based on contractual maturity and the current outstanding principal balance of our borrowings and assume no changes in interest rate benchmarks. |
| (d) | Represents remaining severance payments, benefits, deferred compensation and employer taxes that we are obligated to pay to employees who were terminated as a result of the corporate restructuring that we undertook in August 2011 and our former chief executive officer. |
DISTRIBUTIONS
We currently qualify as a RIC for federal income tax purposes, which generally allows us to avoid paying corporate income taxes on any income or gains that we distribute to our stockholders. Generally, we intend to distribute sufficient dividends to eliminate taxable income and may distribute more than the taxable income which would be considered a return of capital. As a RIC, we are subject to a 4% excise tax to the extent that we do not distribute on an actual or on deemed basis: (i) 98.0% of our current year ordinary income; and (ii) 98.2% of our current year net capital gain income.
We may not be able to achieve operating results that will allow us to make distributions at a specific level or to increase the amount of these distributions. In addition, we may be limited in our ability to make distributions due to the BDC asset coverage test for borrowings applicable to us as a BDC under the 1940 Act and due to provisions in our credit facilities and SBA regulations. If we do not distribute a certain percentage of our income annually, we will suffer adverse tax consequences, including possible loss of favorable RIC tax treatment. We cannot assure stockholders that they will receive any distributions or distributions at a particular level. We may make distributions to our stockholders of certain net capital gains. Since December 2001, we have declared distributions of $12.81 per share.
65
Table of Contents
The following table summarizes the distributions that we declared since January 1, 2009:
| Date Declared |
Record Date |
Payable Date |
Dividends per Share |
|||||
| February 24, 2012 |
April 13, 2012 | May 15, 2012 | $ | 0.17 | ||||
| October 31, 2011 |
December 15, 2011 | January 13, 2012 | $ | 0.17 | ||||
| August 1, 2011 |
September 14, 2011 | October 14, 2011 | $ | 0.17 | ||||
| May 5, 2011 |
June 15, 2011 | July 15, 2011 | $ | 0.17 | ||||
| March 1, 2011 |
March 15, 2011 | April 15, 2011 | $ | 0.15 | ||||
| November 2, 2010 |
December 9, 2010 | January 6, 2011 | $ | 0.14 | ||||
| August 3, 2010 |
September 7, 2010 | October 4, 2010 | $ | 0.12 | ||||
| April 29, 2010 |
June 2, 2010 | July 2, 2010 | $ | 0.11 | ||||
As of the end of each fiscal year, we make the determinations of the tax attributes of our distributions, including determinations of return of capital, based upon our taxable income and distributions paid for the full year, which we report to each stockholder on a Form 1099. Based on the tax attributes of the distributions that we declared for 2011, 37% were from ordinary income and 63% were a return of capital. Future distributions will take into account the requirements for us to distribute the majority of our taxable income to fulfill our distribution requirements as a RIC, together with an assessment of our current and forecasted gains and losses recognized or to be recognized for tax purposes, portfolio transactional events, liquidity, cash earnings and our asset coverage ratio at the time of such decision.
Each year, we mail statements on Form 1099-DIV to our stockholders, which identify the source of the distribution, such as paid from ordinary income, paid from net capital gains on the sale of securities and/or a return of paid-in-capital surplus, which is a nontaxable distribution. To the extent our taxable earnings fall below the total amount of our distributions for that fiscal year, a portion of those distributions may be deemed a return of capital to our stockholders for tax purposes. A portion of the distributions that we paid to stockholders during fiscal years 2011, 2008, 2006, 2005, 2004 and 2003 represented a return of capital. During the fiscal year 2009, we did not declare or pay any dividends to stockholders. During 2011 and 2010, we declared and paid distributions from ordinary income that were sufficient to meet our distribution requirements as a RIC. We will monitor 2012 taxable income in order to ensure compliance with the distribution requirements as a RIC. We determine the tax attributes of our distributions as of the end of our fiscal year based upon our taxable income for the full year and distributions paid during the full year. Therefore, a determination of tax attributes made on a quarterly basis may not be representative of the actual tax attributes of distributions for a full year.
For tax years ended on or before December 31, 2010, we were able to carryforward net capital losses that we may have incurred for a period of eight years. In December 2010, Congress enacted the Regulated Investment Company Modernization Act of 2010, which, in part, will allow us to indefinitely carryover net capital losses that we may incur after 2010. For the tax years ended December 31, 2011, 2010 and 2009, we had net capital losses of $26.0 million, $5.2 million and $54.2 million, respectively, which we will carry forward to offset future net capital gains to the extent provided by federal tax law. The net capital loss carryforward from 2010 will expire in the tax year ending December 31, 2018 and the net capital loss carryforward from 2009 will expire in the tax year ending December 31, 2017.
66
Table of Contents
The following table reconciles GAAP net loss to taxable net income for 2011 and 2010:
| (in thousands) |
Years ended December 31, | |||||||
| 2011 | 2010 | |||||||
| Net loss |
$ | (93,115 | ) | $ | (13,072 | ) | ||
| Difference between book and tax losses on investments |
52,005 | (52,865 | ) | |||||
| Net change in unrealized depreciation on investments not taxable until realized |
39,354 | 66,673 | ||||||
| Capital losses in excess of capital gains |
25,992 | 4,861 | ||||||
| Timing difference related to deductibility of long-term incentive compensation |
(5,909 | ) | 1,594 | |||||
| Taxable interest income on non-accrual loans(a) |
(1,257 | ) | 14,857 | |||||
| Dividend income accrued for GAAP purposes that is not yet taxable |
(7,344 | ) | (7,368 | ) | ||||
| Distributions from taxable subsidiaries |
2,152 | 3,529 | ||||||
| Federal tax provision |
37 | 1,801 | ||||||
| Other, net |
4,337 | 25 | ||||||
|
|
|
|
|
|||||
| Taxable income before deductions for distributions |
$ | 16,252 | $ | 20,035 | ||||
|
|
|
|
|
|||||
| (a) | Results for the year ended December 31, 2011 reflect the reversal of interest we previously recognized on non-accrual loans of portfolio investments that we monetized. In accordance with the Internal Revenue Code, we are required to recognize as taxable interest income all interest that is owed to us by portfolio companies, including interest on those debt investments that are on non-accrual status for GAAP reporting purposes. |
CRITICAL ACCOUNTING POLICIES
The consolidated financial statements are based on the selection and application of significant accounting policies, which require management to make significant estimates and assumptions. We believe that the following are some of the more critical judgment areas in the application of our accounting policies that currently affect our financial condition and results of operations.
INCOME RECOGNITION
We follow the policies described below to recognize income on our Consolidated Statement of Operations:
| • | Interest Income—We accrue interest income if we expect that ultimately we will be able to collect it. Generally, when a loan becomes more than 90 days past due, or if we otherwise believe the customer is unable to service its debt and other obligations, we will as a general matter place the loan on non-accrual status and will cease recognizing interest income on that loan until all principal and interest is current through payment or due to a restructuring such that the interest income is deemed to be collectible. However, we remain contractually entitled to this interest. We may make exceptions to this policy if the loan has sufficient collateral value and is in the process of collection. |
PIK represents contractually deferred interest that typically is added to the loan balance. Generally, PIK interest is due at the end of the loan term. We generally accrue PIK interest when collection is expected and cease accruing PIK if there is insufficient value to support the accrual or we expect the customer is unable to pay all principal and interest due.
| • | Dividend Income—We accrue dividend income on equity investments with stated income, if we expect to collect the dividends. We record dividend income on common equity investments, and gains from realized distributions, when the dividend has been declared and is required to be paid. |
| • | Loan Origination Fees—We capitalize loan origination fees, then amortize these fees into interest income over the term of the loan using the effective interest rate method. In certain loan arrangements, we receive warrants or other equity interests from the borrower as additional origination fees. Typically, borrowers granting these interests are not traded publicly. We record the financial instruments received at fair value as determined in good faith by our board of directors. In certain cases, when we record a warrant or other equity instrument that results in a loan discount, we accrete the discount into income over the term of the loan. |
| • | Advisory Fees and Other Income—We charge our portfolio companies fees for services that we provide, including advisory and management services, equity structuring, prepayments, research and other fees. These fees are based on market rates, which are documented in an agreement between MCG and the respective portfolio companies. We recognize advisory and management services fees when earned. |
67
Table of Contents
| We also recognize equity structuring fees as earned, which generally occurs when the investment transaction closes. We recognize prepayment fees upon receipt. Finally, certain of the bank accounts in which we maintain cash balances pay interest, which we recognize when the interest is earned. |
VALUATION OF INVESTMENTS
FAIR VALUE MEASUREMENTS AND DISCLOSURES
We account for our investments at fair value in accordance with Accounting Standard Codification Topic 820—Fair Value Measurements and Disclosures, or ASC 820. ASC 820 defines fair value, establishes a framework for measuring fair value, and expands disclosures about assets and liabilities measured at fair value. ASC 820 defines “fair value” as the price that would be received to sell an asset or paid to transfer a liability in an orderly transaction between market participants at the measurement date. This fair value definition focuses on exit price in the principal, or most advantageous, market and prioritizes, within a measurement of fair value, the use of market-based inputs over entity-specific inputs.
ASC 820 establishes the following three-level hierarchy, based upon the transparency of inputs to the fair value measurement of an asset or liability as of the measurement date:
| ASC 820 Fair Value |
Inputs to Fair Value Methodology | |
| Level 1 | Quoted prices in active markets for identical assets or liabilities | |
| Level 2 | Quoted prices for similar assets or liabilities; quoted markets that are not active; or other inputs that are observable or can be corroborated by observable market data for substantially the full term of the financial instrument; inputs other than quoted prices that are observable for the asset or liability; or inputs that are derived principally from, or corroborated by, observable market information | |
| Level 3 | Pricing models, discounted cash flow methodologies or similar techniques and at least one significant model assumption is unobservable or when the estimation of fair value requires significant management judgment | |
We categorize a financial instrument in the fair value hierarchy based on the lowest level of input that is significant to its fair value measurement. In the event that transfers between these levels were to occur in the future, we would recognize those transfers as of the ending balance sheet date, based on changes in the use of observable and unobservable inputs utilized to perform the valuation for the period.
Our investment portfolio is not composed of homogeneous debt and equity securities that can be valued with a small number of inputs. Instead, the majority of our investment portfolio is composed of complex debt and equity securities with unique contract terms and conditions. As such, our valuation of each investment in our portfolio is unique and complex, often factoring in numerous unique inputs, including the historical and forecasted financial and operational performance of the portfolio company, projected cash flows, market multiples, comparable market transactions, the priority of our securities compared with those of other investors, credit risk, interest rates, independent valuations and reviews and other inputs too numerous to list quantitatively herein.
DETERMINATION OF FAIR VALUE IN GOOD FAITH
As a BDC, we invest primarily in illiquid securities, including debt and equity securities of private companies. To protect our investments and maximize our returns, we negotiate the structure of each equity security and the majority of the debt securities in our investment portfolio. Our contracts with our portfolio companies generally include many terms governing interest rate, repayment terms, prepayment penalties, financial covenants, operating covenants, ownership and corporate governance parameters, dilution parameters, liquidation preferences, voting rights, and put or call rights. In some cases, our loan agreements also allow for increases in the spread to the base index rate, if the portfolio company’s financial or operational performance deteriorates or shows negative variances from its business plan and, in some cases, allow for decreases in the spread if financial or operational performance improves or exceeds the portfolio company’s plan. Generally, our investments are subject to some restrictions on resale and have no established trading market. Because of the type of investments that we make and the nature of our business, our valuation processes require analyses of numerous market, industry and company-specific factors, including: the performance of the underlying investment; the financial condition of the portfolio company; changing market events; market prices, when available; and other factors relevant to the individual security.
68
Table of Contents
There is no single approach for determining fair value in good faith. Unlike banks, we are not permitted to provide a general reserve for anticipated loan losses. As a result, for portfolio investments that do not have an active market, we must apply judgment to the specific facts and circumstances associated with each security to determine fair value.
Generally, we value securities that are traded in the over-the-counter market or on a stock exchange at the average of the prevailing bid and ask prices on the date of the relevant period end. When such market prices are not available, we use several valuation methodologies to estimate the fair value of our investment portfolio, which generally results in a range of fair values from which we derive a single estimate of the portfolio company’s fair value. To determine a portfolio company’s fair value, we analyze its historical and projected financial results, as well as key market value factors. In determining a security’s fair value, we assume we would exchange it in an orderly transaction at the measurement date. We use the following methods to determine the fair value of investments in our portfolio that are not traded actively:
| • | Majority-Owned Control Investments—Majority-owned control investments comprise 14.8% of our investment portfolio. Market quotations are not readily available for these investments; therefore, we use a combination of market and income approaches to determine their fair value. Typically, private companies are bought and sold based on multiples of EBITDA, cash flows, net income, revenues or, in limited cases, book value. Generally, we apply multiples that we observe for other comparable companies to relevant financial data for the portfolio company. Also, in a limited number of cases, we use income approaches to determine the fair value of these securities, based on our projections of the discounted future free cash flows that the portfolio company will likely generate, as well as industry derived capital costs. Our valuation approaches for majority-owned investments estimate the value were we to sell or exit the investment. These valuation approaches assume the highest and best use of the investment by market participants and consider the value of our ability to control the portfolio company’s capital structure and the timing of a potential exit. |
| • | Non-Majority-Owned Control Investments—Non-majority owned control investments comprise 1.3% of our investment portfolio. For our non-majority owned control equity investments, we use the same market and income valuation approaches used to value our majority-owned control investments. For non-majority-owned control debt investments, we estimate fair value using the market yield approach based on the expected future cash flows discounted at the loans’ effective interest rates, based on our estimate of current market rates. We may adjust discounted cash flow calculations to reflect other market conditions or the perceived credit risk of the borrower. |
| • | Non-Control Investments—Non-control investments comprise 83.9% of our investment portfolio. Quoted prices are not available for 82.1% of our non-control investments. For our non-control equity investments, we use the same market and income approaches used to value our control investments. For non-control debt investments, we estimate fair value using a market-yield approach based on the expected future cash flows discounted at the loans’ effective interest rates, based on our estimate of current market rates. We may adjust discounted cash flow calculations to reflect other market conditions or the perceived credit risk of the borrower. |
| • | Thinly Traded and Over-the-Counter Securities—Generally, we value securities that are traded in the over-the-counter market or on a stock exchange at the average of the prevailing bid and ask prices on the date of the relevant period end. However, we may apply a discount to the market value of restricted or thinly traded public securities to reflect the impact that these restrictions have on the value of these securities. We review factors including the trading volume, total securities outstanding and our percentage ownership of securities to determine whether the trading levels are active (Level 1) or inactive (Level 2). As of December 31, 2011, these securities represented 15.0% of our investment portfolio. We utilize independent pricing services with certain of our fair value estimates. The majority of our level 2 investments are senior debt investments that are secured and collateralized. To corroborate “bid/ask” quotes from independent pricing services we perform a market-yield approach to validate prices obtained or obtain other evidence. |
Our valuation analyses incorporate the impact that key events could have on the securities’ values, including public and private mergers and acquisitions, purchase transactions, public offerings, letters of intent and subsequent debt or equity sales. Our valuation analyses also include key external data, such as market changes and industry valuation benchmarks. We also use independent valuation firms to provide additional data points for our quarterly valuation analyses. Our general practice is to obtain an independent valuation or review of valuation at least once per year for each portfolio investment that had a fair value in excess of $5.0 million, unless the fair value has otherwise been derived through a sale of some or all of our investment in the portfolio company or is a new investment made within the last twelve months. In total, either we obtained a valuation or review from an independent firm, considered new investments made or used market quotes in the preceding twelve month period for 99.6% of the fair value of our investment portfolio as of December 31, 2011.
69
Table of Contents
The majority of the valuations performed by the independent valuation firms utilize proprietary models and inputs. We have used, and intend to continue to use, independent valuation firms to provide additional support for our internal analyses. Our board of directors considers our valuations, as well as the independent valuations and reviews, in its determination of the fair value of our investments. We base the fair value of our interest rate swaps on a binding broker quote, which is based on the estimated net present value of the future cash flows using a forward interest rate yield-curve in effect as of the measurement period.
Due to the uncertainty inherent in the valuation process, such fair value estimates may differ significantly from the values that would have been used had a ready market for the securities existed, and the differences could be material. In addition, changes in the market environment and other events that may occur over the life of the investments may cause the gains or losses that we ultimately realize on these investments to differ from the valuations currently assigned.
BORROWING FACILITIES
As described more fully in Liquidity and Capital Resources—Borrowings, we have outstanding borrowings from various lenders through warehouse loan facilities and the SBA. In addition, we have bankruptcy remote, special-purchase entities that issued debt collateralized by pools of loans that we transferred to the entity. We have recorded our obligation to repay all of our borrowings at cost on our Consolidated Balance Sheets. We account for loans transferred to our bankruptcy remote, special-purpose entities for use in securitization transactions in accordance with ASC 860—Transfers and Servicing.
Debt issuance costs represent fees and other direct incremental costs incurred in connection with our borrowings. We amortize these costs ratably over the contractual term of the borrowing using the effective interest method and include this amortization in interest expense on our Consolidated Statements of Operations.
From time to time, we may repurchase certain debt instruments issued by one of our bankruptcy-remote special-purpose entities from third parties at a negotiated price that may be different than the principal amount of the debt. In accordance with ASC 470—Debt, we treat these repurchases as if the debt were extinguished and report the difference between the reacquisition price and the net carrying amount of the extinguished debt as a gain on extinguishment of debt on our Consolidated Statements of Operations.
SHARE-BASED COMPENSATION
In accordance with ASC Topic 718—Compensation—Stock Compensation, or ASC 718, we recognize compensation cost related to share-based awards for which forfeiture provisions are expected to lapse over the requisite service period.
INCOME TAXES
We currently qualify as a RIC for federal income tax purposes, which generally allows us to avoid paying corporate income taxes on any income or gains that we distribute to our stockholders. Generally, we intend to distribute sufficient dividends to eliminate taxable income and may distribute more than the taxable income which would be considered a return of capital. We are subject to a 4% excise tax to the extent that we do not distribute on an actual or on deemed basis: (i) 98.0% of our current year ordinary income; and (ii) 98.2% of our current year net capital gain income.
We have certain wholly owned taxable subsidiaries, each of which holds one or more portfolio investments listed on our Consolidated Schedule of Investments. The purpose of these taxable subsidiaries is to permit us to hold portfolio companies organized as LLCs or other forms of pass-through entities and still satisfy the RIC tax requirement that at least 90% of our gross revenue for income tax purposes must consist of investment income. Absent the taxable subsidiaries, a portion of the gross income of any LLC or other pass-through entity portfolio investment would flow through directly to us for the 90% test. To the extent that such income did not consist of investment income, it could jeopardize our ability to qualify as a RIC and, therefore, cause us to incur significant federal income taxes. The income of the LLCs or other pass-through entities owned by taxable subsidiaries is taxed to the taxable subsidiaries and does not flow through to us, thereby helping us preserve our RIC status and resultant tax advantages. We do not consolidate the taxable subsidiaries for income tax purposes and they may generate income tax expense because of the taxable subsidiaries’ ownership of the portfolio companies. We reflect any such income tax expense on our Consolidated Statement of Operations.
70
Table of Contents
RECENT DEVELOPMENTS
AMENDED WAREHOUSE SALE AND SERVICING AGREEMENT
In January 2012, we entered into an amendment to the SunTrust Warehouse to accelerate the termination date of the facility to January 17, 2012. The facility entered a 24-month amortization period and the new legal final maturity date is January 17, 2014. In connection with the execution of the amendment, $4.8 million from the principal collections account in the MCG Commercial Loan Funding Trust was used to reduce the outstanding advances from the SunTrust Warehouse. After this repayment, the new balance of the outstanding advances from the SunTrust Warehouse is $51.1 million. All future principal collections will be used to further reduce the balance of the outstanding advances. The SunTrust Warehouse is non-recourse to us; therefore, in the event of a termination event or upon the legal final maturity date, the lenders under the warehouse facility may only look to the collateral to satisfy the outstanding obligations under this facility.
We also agreed to a number of modifications to the SunTrust Warehouse terms, including a decrease in the required amount of the minimum consolidated tangible net worth of the Company from $450 million plus 50% of any equity raised after February 26, 2009 to $375 million plus 50% of any equity raised after February 26, 2009. The amendment also removed certain requirements that were to be met in order for the pool of commercial loans in the Trust to be fully included in the borrowing base, such as those relating to average loan amount limit and obligor residency and industry diversity. In addition, SunTrust approved Richard W. Neu, our Chief Executive Officer, as an acceptable replacement for Steven F. Tunney in the management of the Company, and the amendment modified the key man provision to include Stephen Bacica, our Chief Financial Officer, in addition to B. Hagen Saville, our President and Chief Operating Officer, and Richard W. Neu.
We paid to SunTrust an amendment fee of $0.5 million, or 1.0% of the advances outstanding after the repayments related to the amendment. In addition, due to the reduction of the facility we will recognize in interest expense approximately $1.5 million of accelerated deferred financing fees in the first quarter of 2012. The interest rate margin on outstanding advances, which accrue interest based on the commercial paper or eurodollar rate, is 3.25%.
PAY-OFF OF PRIVATE PLACEMENT NOTES
On January 17, 2012, we repaid in full and terminated the Series 2007-A unsecured notes. In connection with the termination of the notes and pursuant to the terms of a prepayment and waiver agreement with the noteholders, we paid to the noteholders $8.7 million of principal, $0.2 million in accrued interest and $0.2 million in prepayment fees.
STOCK REPURCHASE PLAN
On January 17, 2012, our board of directors authorized a stock repurchase program of up to $35.0 million. Under the program, we are authorized to repurchase shares in open market transactions, including through block purchases, depending on prevailing market conditions and other factors. The repurchase program may be extended, modified or discontinued at any time for any reason. The program does not obligate us to acquire any specific number of shares, and all repurchases will be made in accordance with SEC Rule 10b-18, which sets certain restrictions on the method, timing, price and volume of stock repurchases. As of March 1, 2012, no shares have been repurchased.
DRAW OF SBA COMMITMENT
As of December 31, 2011, The SBA had approved and committed $150.0 million in borrowings to us through Solutions Capital. As of December 31, 2011, $128.6 million of SBA borrowings were outstanding. In January 2012, Solutions Capital borrowed the remaining $21.4 million of the commitment. The new borrowings bear an interim financing rate of 1.8%. The rate will become fixed at the time of SBA pooling, which is within nine months of funding, and is set to the then-current 10-year treasury rate plus a spread and an annual SBA charge.
71
Table of Contents
PORTFOLIO INVESTMENTS
In February 2012, we accepted $23.7 million for our senior preferred stock and warrant position in Jenzabar. This amount, which we believe significantly benefits our unencumbered cash position, resulted in an $11.0 million unrealized depreciation during 2011 of our investment in Jenzabar. The consideration received also settled any and all direct claims and counterclaims asserted in the litigation by and among the Company, Jenzabar and certain Jenzabar officers and directors. We will receive the balance of the payment for our position in Jenzabar in the amount of $990,000 for our subordinated preferred stock and will exchange those shares upon the final dismissal of the litigation, including the dismissal of the derivative claims.
RECENT ACCOUNTING PRONOUNCEMENTS
TROUBLED DEBT RESTRUCTURING
In April 2011, Financial Accounting Standards Board, or FASB, issued Accounting Standards Update 2011-02—A Creditor’s Determination of Whether a Restructuring is a Troubled Debt Restructuring, or ASU 2011-02. This standard amends previous guidance provided in Accounting Standards Codification 310-40—Receivables—Troubled Debt Restructurings by Creditors. ASU 2011-02 provides additional guidance and criteria on how companies should determine whether a restructuring or refinancing of an existing financial receivable represents a troubled debt restructuring. Companies must assess whether the restructuring or refinancing of an existing financial receivable is a troubled debt restructuring in order to determine how to account for the remaining unamortized portion of certain fees, such as origination fees, associated with the original debt investment. ASU 2011-02 is effective for the first interim period beginning on or after June 15, 2011. We adopted this standard beginning with the quarter ended September 30, 2011. Our adoption of this update did not have a material impact on our financial position or results of operations.
FAIR VALUE
In May 2011, the FASB issued Accounting Standards Update No. 2011-04—Fair Value Measurement: Amendments to Achieve Common Fair Value Measurement and Disclosure Requirements in U.S. GAAP and IFRSs, or ASU 2011-04. ASU 2011-04 clarifies the application of existing fair value measurement and disclosure requirements, changes the application of some requirements for measuring fair value and requires additional disclosure for fair value measurements. The disclosure requirements are expanded to include for fair value measurements categorized in Level 3 of the fair value hierarchy: 1) a quantitative disclosure of the unobservable inputs and assumptions used in the measurement; 2) a description of the valuation processes in place; and 3) a narrative description of the sensitivity of the fair value to changes in unobservable inputs and interrelationships between those inputs. For public entities, ASU 2011-04 is effective for interim and annual periods beginning after December 15, 2011. We will adopt this standard beginning on January 1, 2012. We do not anticipate that our implementation of this standard will have a material impact on our process for measuring fair values, our financial position or our results of operations.
| ITEM 7A. | QUANTITATIVE AND QUALITATIVE DISCLOSURES ABOUT MARKET RISK |
There were a number of indicators of modest growth in the United States’ economy during 2011. However, certain leading and lagging indicators suggest continuing risk and volatility. In the event of renewed financial turmoil affecting the banking system and financial markets, the financial position and results of operations of certain of the middle-market companies in our portfolio could be affected adversely, which ultimately could lead to difficulty in their meeting debt service requirements and an increase in defaults.
Interest rate sensitivity refers to the change in earnings that may result from changes in the level of interest rates. Our net interest income is affected by changes in various interest rates, including LIBOR, prime rates and commercial paper rates. As of December 31, 2011, approximately 88.2% of our loan portfolio, at fair value, bore interest at a spread to LIBOR or prime rate, and 11.8% at a fixed interest rate. As of December 31, 2011, approximately 79.2% of our loan portfolio, at fair value, had LIBOR floors between 1.0% and 3.0% on the LIBOR base index and prime floors between 1.75% and 6.0%. The three-month weighted-average LIBOR interest rate was 0.48% as of December 31, 2011. Thus, the LIBOR floors in these loan investments lessen the impact of such historically low LIBOR rates.
We regularly measure exposure to interest rate risk. We assess interest rate risk and we manage our interest rate exposure on an ongoing basis by comparing our interest rate sensitive assets to our interest rate sensitive
72
Table of Contents
liabilities. Based on this review, we determine whether or not any hedging transactions are necessary to mitigate exposure to changes in interest rates. We also enter into derivative transactions in connection with our financing vehicles. During the quarter ended March 31, 2009, in connection with our financing vehicle requirements, we entered into two interest rate swaps, having notional amounts of $8.7 million and $12.5 million at interest rates of 9.0% and 13.0%, respectively. These swap agreements expired in August 2011.
The following table shows a comparison of the interest rate base for our interest-bearing cash, outstanding commercial loans, at cost, and our outstanding borrowings as of December 31, 2011 and December 31, 2010:
| December 31, 2011 | December 31, 2010 | |||||||||||||||||||
| (in thousands) |
Interest Bearing Cash and Commercial Loans |
Borrowings | Interest Bearing Cash and Commercial Loans |
Borrowings | ||||||||||||||||
| Money market rate |
$ | 51,211 | $ | — | $ | 23,244 | $ | — | ||||||||||||
| Prime rate |
27,867 | — | 49,227 | — | ||||||||||||||||
| LIBOR |
||||||||||||||||||||
| 30-day |
71,794 | — | 92,787 | — | ||||||||||||||||
| 60-day |
12,500 | — | — | — | ||||||||||||||||
| 90-day |
462,293 | 237,080 | 478,896 | 311,880 | ||||||||||||||||
| 180-day |
14,038 | — | — | — | ||||||||||||||||
| Commercial paper |
— | 55,822 | — | 100,251 | ||||||||||||||||
| Fixed rate |
109,640 | 137,317 | 257,536 | 134,751 | ||||||||||||||||
|
|
|
|
|
|
|
|
|
|||||||||||||
| Total |
$ | 749,343 | $ | 430,219 | $ | 901,690 | $ | 546,882 | ||||||||||||
|
|
|
|
|
|
|
|
|
|||||||||||||
Based on our December 31, 2011 balance sheet, the following table shows the impact to net income of hypothetical base rate increases in interest rates, assuming no changes in our investment and borrowing structure. The impact to net income of hypothetical base rate decreases in interest rates is not shown in the following table because as of December 31, 2011, the quarterly average LIBOR was 0.48% and a 100-basis point decrease could not occur:
| (dollars in thousands)
Basis Point Change |
Interest Income |
Interest Expense |
Net Income (Loss) |
|||||||||
| 100 |
$ | 2,272 | $ | 2,929 | $ | (657 | ) | |||||
| 200 |
8,544 | 5,858 | 2,686 | |||||||||
| 300 |
16,537 | 8,787 | 7,750 | |||||||||
73
Table of Contents
| ITEM 8. | FINANCIAL STATEMENTS AND SUPPLEMENTARY DATA |
74
Table of Contents
REPORT OF INDEPENDENT REGISTERED PUBLIC ACCOUNTING FIRM
Board of Directors and Stockholders
MCG Capital Corporation
We have audited MCG Capital Corporation’s internal control over financial reporting as of December 31, 2011, based on criteria established in Internal Control—Integrated Framework issued by the Committee of Sponsoring Organizations of the Treadway Commission (the COSO criteria). MCG Capital Corporation’s management is responsible for maintaining effective internal control over financial reporting, and for its assessment of the effectiveness of internal control over financial reporting included in the accompanying Management’s Annual Report on Internal Control over Financial Reporting located in Item 9A. Our responsibility is to express an opinion on the company’s internal control over financial reporting based on our audit.
We conducted our audit in accordance with the standards of the Public Company Accounting Oversight Board (United States). Those standards require that we plan and perform the audit to obtain reasonable assurance about whether effective internal control over financial reporting was maintained in all material respects. Our audit included obtaining an understanding of internal control over financial reporting, assessing the risk that a material weakness exists, testing and evaluating the design and operating effectiveness of internal control based on the assessed risk, and performing such other procedures as we considered necessary in the circumstances. We believe that our audit provides a reasonable basis for our opinion.
A company’s internal control over financial reporting is a process designed to provide reasonable assurance regarding the reliability of financial reporting and the preparation of financial statements for external purposes in accordance with generally accepted accounting principles. A company’s internal control over financial reporting includes those policies and procedures that (1) pertain to the maintenance of records that, in reasonable detail, accurately and fairly reflect the transactions and dispositions of the assets of the company; (2) provide reasonable assurance that transactions are recorded as necessary to permit preparation of financial statements in accordance with generally accepted accounting principles, and that receipts and expenditures of the company are being made only in accordance with authorizations of management and directors of the company; and (3) provide reasonable assurance regarding prevention or timely detection of unauthorized acquisition, use, or disposition of the company’s assets that could have a material effect on the financial statements.
Because of its inherent limitations, internal control over financial reporting may not prevent or detect misstatements. Also, projections of any evaluation of effectiveness to future periods are subject to the risk that controls may become inadequate because of changes in conditions, or that the degree of compliance with the policies or procedures may deteriorate.
In our opinion, MCG Capital Corporation maintained, in all material respects, effective internal control over financial reporting as of December 31, 2011, based on the COSO criteria.
We also have audited, in accordance with the standards of the Public Company Accounting Oversight Board (United States), the consolidated balance sheets of MCG Capital Corporation (the Company), including the consolidated schedules of investments, as of December 31, 2011 and 2010, and the related consolidated statements of operations, changes in net assets, and cash flows for each of the three years in the period ended December 31, 2011, and the consolidated financial highlights for each of the five years in the period ended December 31, 2011. Our report dated March 1, 2012 expressed an unqualified opinion thereon.
/s/ Ernst & Young LLP
McLean, Virginia
March 1, 2012
75
Table of Contents
REPORT OF INDEPENDENT REGISTERED PUBLIC ACCOUNTING FIRM
Board of Directors and Stockholders
MCG Capital Corporation
We have audited the accompanying consolidated balance sheets of MCG Capital Corporation (the Company), including the consolidated schedules of investments, as of December 31, 2011 and 2010, and the related consolidated statements of operations, changes in net assets, and cash flows for each of the three years in the period ended December 31, 2011, and the consolidated financial highlights for each of the five years in the period ended December 31, 2011. These financial statements and financial highlights are the responsibility of the Company’s management. Our responsibility is to express an opinion on these financial statements and financial highlights based on our audits.
We conducted our audits in accordance with the standards of the Public Company Accounting Oversight Board (United States). Those standards require that we plan and perform the audit to obtain reasonable assurance about whether the financial statements and financial highlights are free of material misstatement. An audit includes examining, on a test basis, evidence supporting the amounts and disclosures in the financial statements and financial highlights. An audit also includes assessing the accounting principles used and significant estimates made by management, as well as evaluating the overall financial statement presentation. Our procedures included confirmation of securities owned as of December 31, 2011, by correspondence with the custodians, or by other appropriate auditing procedures. We believe that our audits provide a reasonable basis for our opinion.
In our opinion, the financial statements and financial highlights referred to above present fairly, in all material respects, the consolidated financial position of MCG Capital Corporation at December 31, 2011 and 2010, the consolidated results of its operations, changes in its net assets, and its cash flows for each of the three years in the period ended December 31, 2011 and its consolidated financial highlights for each of the five years in the period ended December 31, 2011, in conformity with U.S. generally accepted accounting principles.
We also have audited, in accordance with the standards of the Public Company Accounting Oversight Board (United States), MCG Capital Corporation’s internal control over financial reporting as of December 31, 2011, based on criteria established in Internal Control-Integrated Framework issued by the Committee of Sponsoring Organizations of the Treadway Commission and our report dated March 1, 2012 expressed an unqualified opinion thereon.
/s/ Ernst & Young LLP
McLean, Virginia
March 1, 2012
76
Table of Contents
CONSOLIDATED BALANCE SHEETS
| (in thousands, except per share amounts) |
December 31, 2011 |
December 31, 2010 |
||||||
| Assets |
||||||||
| Cash and cash equivalents |
$ | 58,563 | $ | 44,970 | ||||
| Cash, securitization accounts |
40,306 | 42,245 | ||||||
| Cash, restricted |
34,964 | 29,383 | ||||||
| Investments at fair value |
||||||||
| Non-affiliate investments (cost of $570,209 and $684,785, respectively) |
570,133 | 646,116 | ||||||
| Affiliate investments (cost of $40,858 and $43,721, respectively) |
51,770 | 53,300 | ||||||
| Control investments (cost of $406,151 and $517,167, respectively) |
119,263 | 310,289 | ||||||
|
|
|
|
|
|||||
| Total investments (cost of $1,017,218 and $1,245,673, respectively) |
741,166 | 1,009,705 | ||||||
| Interest receivable |
4,049 | 5,453 | ||||||
| Other assets |
11,490 | 13,521 | ||||||
|
|
|
|
|
|||||
| Total assets |
$ | 890,538 | $ | 1,145,277 | ||||
|
|
|
|
|
|||||
| Liabilities |
||||||||
| Borrowings (maturing within one year of $32,983 and $18,858, respectively) |
$ | 430,219 | $ | 546,882 | ||||
| Interest payable |
2,710 | 2,291 | ||||||
| Dividends payable |
13,092 | 10,735 | ||||||
| Other liabilities |
9,565 | 7,353 | ||||||
|
|
|
|
|
|||||
| Total liabilities |
455,586 | 567,261 | ||||||
|
|
|
|
|
|||||
| Stockholders’ equity |
||||||||
| Preferred stock, par value $0.01, authorized 1 share, none issued and outstanding |
— | — | ||||||
| Common stock, par value $0.01, authorized 200,000 shares on December 31, 2011 and 2010, 76,997 issued and outstanding on December 31, 2011 and 76,662 issued and outstanding on December 31, 2010 |
770 | 767 | ||||||
| Paid-in capital |
1,009,748 | 1,008,823 | ||||||
| Distributions in excess of earnings |
||||||||
| Paid-in capital |
(195,310 | ) | (166,029 | ) | ||||
| Other |
(103,912 | ) | (28,555 | ) | ||||
| Net unrealized depreciation on investments |
(276,344 | ) | (236,990 | ) | ||||
|
|
|
|
|
|||||
| Total stockholders’ equity |
434,952 | 578,016 | ||||||
|
|
|
|
|
|||||
| Total liabilities and stockholders’ equity |
$ | 890,538 | $ | 1,145,277 | ||||
|
|
|
|
|
|||||
| Net asset value per common share at end of period |
$ | 5.65 | $ | 7.54 | ||||
The accompanying notes are an integral part of these financial statements
77
Table of Contents
CONSOLIDATED STATEMENTS OF OPERATIONS
| Years ended December 31, | ||||||||||||
| (in thousands, except per share amounts) |
2011 | 2010 | 2009 | |||||||||
| Revenue |
||||||||||||
| Interest and dividend income |
||||||||||||
| Non-affiliate investments (less than 5% owned) |
$ | 65,874 | $ | 61,396 | $ | 64,209 | ||||||
| Affiliate investments (5% to 25% owned) |
5,266 | 4,859 | 4,470 | |||||||||
| Control investments (more than 25% owned) |
11,068 | 20,274 | 28,627 | |||||||||
|
|
|
|
|
|
|
|||||||
| Total interest and dividend income |
82,208 | 86,529 | 97,306 | |||||||||
|
|
|
|
|
|
|
|||||||
| Advisory fees and other income |
||||||||||||
| Non-affiliate investments (less than 5% owned) |
2,458 | 1,982 | 1,333 | |||||||||
| Affiliate investments (5% to 25% owned) |
— | 320 | — | |||||||||
| Control investments (more than 25% owned) |
1,030 | 738 | 1,195 | |||||||||
|
|
|
|
|
|
|
|||||||
| Total advisory fees and other income |
3,488 | 3,040 | 2,528 | |||||||||
|
|
|
|
|
|
|
|||||||
| Total revenue |
85,696 | 89,569 | 99,834 | |||||||||
|
|
|
|
|
|
|
|||||||
| Operating expenses |
||||||||||||
| Interest expense |
15,634 | 16,891 | 23,444 | |||||||||
| Employee compensation |
||||||||||||
| Salaries and benefits |
11,998 | 16,275 | 14,825 | |||||||||
| Amortization of employee restricted stock awards |
2,081 | 4,342 | 7,727 | |||||||||
|
|
|
|
|
|
|
|||||||
| Total employee compensation |
14,079 | 20,617 | 22,552 | |||||||||
| General and administrative expense |
14,036 | 11,495 | 15,644 | |||||||||
| Restructuring expense |
4,289 | 1 | 6 | |||||||||
|
|
|
|
|
|
|
|||||||
| Total operating expenses |
48,038 | 49,004 | 61,646 | |||||||||
|
|
|
|
|
|
|
|||||||
| Net operating income before net investment loss, (loss) gain on extinguishment of debt and income tax provision (benefit) |
37,658 | 40,565 | 38,188 | |||||||||
|
|
|
|
|
|
|
|||||||
| Net realized (loss) gain on investments |
||||||||||||
| Non-affiliate investments (less than 5% owned) |
(46,887 | ) | 17,529 | (18,015 | ) | |||||||
| Affiliate investments (5% to 25% owned) |
(703 | ) | 36 | (1,947 | ) | |||||||
| Control investments (more than 25% owned) |
(42,929 | ) | (5,711 | ) | (172,022 | ) | ||||||
|
|
|
|
|
|
|
|||||||
| Total net realized (loss) gain on investments |
(90,519 | ) | 11,854 | (191,984 | ) | |||||||
|
|
|
|
|
|
|
|||||||
| Net unrealized (depreciation) appreciation on investments |
||||||||||||
| Non-affiliate investments (less than 5% owned) |
38,593 | (10,296 | ) | (6,803 | ) | |||||||
| Affiliate investments (5% to 25% owned) |
1,333 | 4,036 | (5,442 | ) | ||||||||
| Control investments (more than 25% owned) |
(80,010 | ) | (61,130 | ) | 110,642 | |||||||
| Derivative and other fair value adjustments |
730 | 717 | (766 | ) | ||||||||
|
|
|
|
|
|
|
|||||||
| Total net unrealized (depreciation) appreciation on investments |
(39,354 | ) | (66,673 | ) | 97,631 | |||||||
|
|
|
|
|
|
|
|||||||
| Net investment loss before income tax provision (benefit) |
(129,873 | ) | (54,819 | ) | (94,353 | ) | ||||||
| (Loss) gain on extinguishment of debt before income tax provision (benefit) |
(863 | ) | 2,983 | 5,025 | ||||||||
| Income tax provision (benefit) |
37 | 1,801 | (81 | ) | ||||||||
|
|
|
|
|
|
|
|||||||
| Net loss |
$ | (93,115 | ) | $ | (13,072 | ) | $ | (51,059 | ) | |||
|
|
|
|
|
|
|
|||||||
| Loss per basic and diluted common share |
$ | (1.22 | ) | $ | (0.17 | ) | $ | (0.68 | ) | |||
| Cash distributions declared per common share |
$ | 0.66 | $ | 0.37 | $ | — | ||||||
| Weighted-average common shares outstanding—basic and diluted |
76,259 | 75,422 | 74,692 | |||||||||
The accompanying notes are an integral part of these financial statements
78
Table of Contents
CONSOLIDATED STATEMENTS OF CHANGES IN NET ASSETS
| Years ended December 31, | ||||||||||||
| (in thousands, except per share amounts) |
2011 | 2010 | 2009 | |||||||||
| Increase (decrease) in net assets from operations |
||||||||||||
| Net operating income before net investment loss, (loss) gain on extinguishment of debt and income tax (provision) benefit |
$ | 37,658 | $ | 40,565 | $ | 38,188 | ||||||
| Net realized (loss) gain on investments |
(90,519 | ) | 11,854 | (191,984 | ) | |||||||
| Net unrealized (depreciation) appreciation on investments |
(39,354 | ) | (66,673 | ) | 97,631 | |||||||
| (Loss) gain on extinguishment of debt |
(863 | ) | 2,983 | 5,025 | ||||||||
| Income tax (provision) benefit |
(37 | ) | (1,801 | ) | 81 | |||||||
|
|
|
|
|
|
|
|||||||
| Net loss |
(93,115 | ) | (13,072 | ) | (51,059 | ) | ||||||
|
|
|
|
|
|
|
|||||||
| Distributions to stockholders |
||||||||||||
| Distributions from net investment income |
(21,596 | ) | (25,097 | ) | — | |||||||
| Distributions in excess of net investment income (accumulated distributions in excess of net investment income and capital gains for December 31, 2011, 2010 and 2009 were $195,310, $166,029 and $162,783, respectively) |
(29,281 | ) | (3,246 | ) | — | |||||||
| Distributions forfeited |
— | 7 | — | |||||||||
|
|
|
|
|
|
|
|||||||
| Net decrease in net assets resulting from stockholder distributions |
(50,877 | ) | (28,336 | ) | — | |||||||
|
|
|
|
|
|
|
|||||||
| Capital share transactions |
||||||||||||
| Amortization of restricted stock awards |
||||||||||||
| Employee awards accounted for as employee compensation |
2,081 | 4,342 | 7,727 | |||||||||
| Employee awards accounted for as restructuring expense |
432 | — | — | |||||||||
| Non-employee director awards accounted for as general and administrative expense |
64 | 76 | 135 | |||||||||
| Common stock withheld to pay taxes applicable to the vesting of restricted stock |
(1,638 | ) | (661 | ) | — | |||||||
| Net forfeitures of restricted common stock |
(11 | ) | (16 | ) | — | |||||||
| Cancellation of common stock held as collateral for stockholder loans |
— | — | (92 | ) | ||||||||
| Stockholder loans |
||||||||||||
| Unrealized appreciation on stockholder loans |
— | — | (31 | ) | ||||||||
| Repayment of stockholder loans |
— | — | 92 | |||||||||
|
|
|
|
|
|
|
|||||||
| Net increase in net assets resulting from capital share transactions |
928 | 3,741 | 7,831 | |||||||||
|
|
|
|
|
|
|
|||||||
| Total decrease in net assets |
(143,064 | ) | (37,667 | ) | (43,228 | ) | ||||||
| Net assets |
||||||||||||
| Beginning of period |
578,016 | 615,683 | 658,911 | |||||||||
|
|
|
|
|
|
|
|||||||
| End of period |
$ | 434,952 | $ | 578,016 | $ | 615,683 | ||||||
|
|
|
|
|
|
|
|||||||
| Net asset value per common share at end of period |
$ | 5.65 | $ | 7.54 | $ | 8.06 | ||||||
| Common shares outstanding at end of period |
76,997 | 76,662 | 76,394 | |||||||||
The accompanying notes are an integral part of these financial statements
79
Table of Contents
CONSOLIDATED STATEMENTS OF CASH FLOWS
| Years ended December 31, | ||||||||||||
| (in thousands) |
2011 | 2010 | 2009 | |||||||||
| Cash flows from operating activities |
||||||||||||
| Net loss |
$ | (93,115 | ) | $ | (13,072 | ) | $ | (51,059 | ) | |||
| Adjustments to reconcile net loss to net cash provided by (used in) operating activities |
||||||||||||
| Investments in portfolio companies |
(255,852 | ) | (294,904 | ) | (58,673 | ) | ||||||
| Principal collections related to investment repayments or sales |
375,138 | 216,879 | 196,575 | |||||||||
| Decrease (increase) in interest receivable, accrued payment-in-kind interest and dividends |
20,052 | (395 | ) | (13,330 | ) | |||||||
| Amortization of restricted stock awards |
||||||||||||
| Employee |
2,513 | 4,342 | 7,727 | |||||||||
| Non-employee director |
64 | 76 | 135 | |||||||||
| Decrease in cash—securitization accounts from interest collections |
2,961 | 2,552 | 1,305 | |||||||||
| Increase in restricted cash—escrow accounts |
(1,799 | ) | — | — | ||||||||
| Depreciation and amortization |
4,125 | 3,954 | 5,395 | |||||||||
| Unrealized appreciation on stockholder loans |
— | — | (31 | ) | ||||||||
| Decrease in other assets |
207 | 166 | 1,160 | |||||||||
| Increase (decrease) in other liabilities |
3,246 | (7,223 | ) | 663 | ||||||||
| Realized (gain) loss on investments |
90,519 | (11,854 | ) | 191,984 | ||||||||
| Net change in unrealized depreciation (appreciation) on investments |
39,354 | 66,673 | (97,631 | ) | ||||||||
| Loss (gain) on extinguishment of debt |
863 | (2,983 | ) | (5,025 | ) | |||||||
|
|
|
|
|
|
|
|||||||
| Net cash provided by (used in) operating activities |
188,276 | (35,789 | ) | 179,195 | ||||||||
|
|
|
|
|
|
|
|||||||
| Cash flows from financing activities |
||||||||||||
| Payments on borrowings |
(142,526 | ) | (88,983 | ) | (73,776 | ) | ||||||
| Proceeds from borrowings |
25,000 | 81,000 | — | |||||||||
| Decrease (increase) in cash in restricted and securitization accounts |
||||||||||||
| Securitization accounts for repayment of principal on debt |
(1,022 | ) | 64,344 | (72,953 | ) | |||||||
| Restricted cash |
(3,782 | ) | (8,151 | ) | (20,253 | ) | ||||||
| Payment of financing costs |
(2,184 | ) | (3,353 | ) | (4,175 | ) | ||||||
| Distributions paid |
(48,520 | ) | (17,608 | ) | — | |||||||
| Cancellation of common stock held as collateral for stockholder loans |
— | — | (92 | ) | ||||||||
| Common stock withheld to pay taxes applicable to the vesting of restricted stock |
(1,638 | ) | (661 | ) | — | |||||||
| Net forfeitures of restricted common stock |
(11 | ) | (16 | ) | — | |||||||
| Repayment of stockholder loans |
— | — | 92 | |||||||||
|
|
|
|
|
|
|
|||||||
| Net cash (used in) provided by financing activities |
(174,683 | ) | 26,572 | (171,157 | ) | |||||||
|
|
|
|
|
|
|
|||||||
| Increase (decrease) in cash and cash equivalents |
13,593 | (9,217 | ) | 8,038 | ||||||||
| Cash and cash equivalents |
||||||||||||
| Beginning balance |
44,970 | 54,187 | 46,149 | |||||||||
|
|
|
|
|
|
|
|||||||
| Ending balance |
$ | 58,563 | $ | 44,970 | $ | 54,187 | ||||||
|
|
|
|
|
|
|
|||||||
| Supplemental disclosure of cash flow information |
||||||||||||
| Interest paid |
$ | 12,206 | $ | 14,666 | $ | 22,056 | ||||||
| Income taxes paid |
349 | 3,247 | 59 | |||||||||
| Payment-in-kind interest collected |
21,600 | 18,819 | 2,214 | |||||||||
| Dividend income collected |
13,500 | 3,970 | 8,414 | |||||||||
The accompanying notes are an integral part of these financial statements
80
Table of Contents
CONSOLIDATED SCHEDULE OF INVESTMENTS
December 31, 2011
(dollars in thousands)
| Interest Rate(9) | Fair Value |
|||||||||||||||||||||||||||
| Portfolio Company |
Industry |
Investment |
Current | PIK | Total | Principal | Cost | |||||||||||||||||||||
| Control Investments(4): |
||||||||||||||||||||||||||||
| Broadview Networks Holdings, Inc.(6) |
Communications |
Series A Preferred Stock (12.0%, 87,254 shares) |
$ | 81,984 | $ | 5,015 | ||||||||||||||||||||||
| Series A-1 Preferred Stock (12.0%, 100,702 shares) |
77,496 | 5,788 | ||||||||||||||||||||||||||
| Series B Preferred Stock (12.0%, 1,282 shares) |
100 | 74 | ||||||||||||||||||||||||||
| Class A Common Stock (4,731,031 shares) |
— | — | ||||||||||||||||||||||||||
| GMC Television Broadcasting, LLC(2) |
Broadcasting |
Senior Debt (Due 12/16)(1) |
4.6 | % | — | 4.6 | % | $ | 19,103 | 16,651 | 17,167 | |||||||||||||||||
| Subordinated Debt (Due 12/16)(1)(7) |
2.5 | % | — | 2.5 | % | 10,950 | 6,976 | — | ||||||||||||||||||||
| Class B Voting Units (8.0%, 86,700 units) |
9,071 | — | ||||||||||||||||||||||||||
| Intran Media, LLC(6) |
Other Media |
Series A Preferred Units (10.0%, 36,300 units) |
9,095 | 400 | ||||||||||||||||||||||||
| Series B Preferred Units (10.0%, 12,700 units) |
3,000 | — | ||||||||||||||||||||||||||
| Series C Preferred Units (10.0%,15,000 units) |
1,250 | — | ||||||||||||||||||||||||||
| Jet Plastica Investors, LLC(2) |
Plastic Products |
Senior Debt A (Due 3/15)(1)(7) |
2.6 | % | 7.0 | % | 9.6 | % | 15,288 | 14,914 | 9,145 | |||||||||||||||||
| Senior Debt B (Due 6/15)(1)(7) |
2.6 | % | 5.0 | % | 7.6 | % | 23,836 | 18,977 | — | |||||||||||||||||||
| Senior Debt C (Due 6/16)(7) |
— | 2.5 | % | 2.5 | % | 6,299 | 6,250 | — | ||||||||||||||||||||
| Senior Debt D (Due 3/13-9/16)(7) |
— | 2.5 | % | 2.5 | % | 29,018 | 21,560 | — | ||||||||||||||||||||
| Series B Preferred Stock (8.0%, 10,000 shares) |
10,000 | — | ||||||||||||||||||||||||||
| Preferred LLC Interest (8.0%, 301,595 units) |
34,014 | — | ||||||||||||||||||||||||||
| NPS Holding Group, LLC(2)(5)(6) |
Business Services |
Senior Debt Revolver (Due 6/13)(1)(7) |
6.3 | % | 2.5 | % | 8.7 | % | 3,909 | 2,360 | 4,116 | |||||||||||||||||
| Senior Debt A1 (Due 6/13)(1)(7) |
6.3 | % | — | 6.3 | % | 9,157 | 3,470 | 5,237 | ||||||||||||||||||||
| Senior Debt A2 (Due 6/13)(1)(7) |
6.3 | % | — | 6.3 | % | 2,069 | 1,905 | 32 | ||||||||||||||||||||
| Senior Debt A3 (Due 6/13)(1)(7) |
6.3 | % | — | 6.3 | % | 15,324 | 6,228 | 230 | ||||||||||||||||||||
| Series A Preferred Units (504 units) |
50 | — | ||||||||||||||||||||||||||
| Series B Preferred Units (5.0%, 10,731 units) |
10,731 | — | ||||||||||||||||||||||||||
| Common Units (36,500 units) |
— | — | ||||||||||||||||||||||||||
| Orbitel Holdings, LLC(2) |
Cable |
Senior Debt (Due 2/13)(1) |
10.0 | % | — | 10.0 | % | 18,580 | 18,512 | 18,512 | ||||||||||||||||||
| Preferred LLC Interest (10.0%, 150,000 units)(1) |
17,929 | 19,090 | ||||||||||||||||||||||||||
| PremierGarage Holdings, LLC(2)(6) |
Home Furnishings |
Preferred LLC Units (400 units) |
400 | — | ||||||||||||||||||||||||
| Common LLC Units (79,935 units) |
4,971 | — | ||||||||||||||||||||||||||
| RadioPharmacy Investors, LLC(2) |
Healthcare |
Senior Debt (Due 12/16)(1) |
7.5 | % | — | 7.5 | % | 8,176 | 8,176 | 8,176 | ||||||||||||||||||
| Subordinated Debt (Due 12/16)(1) |
12.0 | % | 3.0 | % | 15.0 | % | 10,362 | 10,355 | 10,355 | |||||||||||||||||||
| Preferred LLC Interest (19.7%, 70,000 units) |
9,726 | 15,926 | ||||||||||||||||||||||||||
|
|
|
|
|
|||||||||||||||||||||||||
| Total Control Investments (represents 16.1% of total investments at fair value) |
|
406,151 | 119,263 | |||||||||||||||||||||||||
|
|
|
|
|
|||||||||||||||||||||||||
| Affiliate Investments(3): |
||||||||||||||||||||||||||||
| Advanced Sleep Concepts, Inc.(2) |
Home Furnishings |
Senior Debt (Due 1/14)(1) |
13.4 | % | — | 13.4 | % | $ | 5,859 | $ | 5,851 | $ | 5,851 | |||||||||||||||
| Subordinated Debt (Due 1/14)(1) |
12.0 | % | 4.0 | % | 16.0 | % | 5,640 | 5,614 | 5,614 | |||||||||||||||||||
| Series A Preferred Stock (20.0%, 49 shares) |
344 | 61 | ||||||||||||||||||||||||||
| Series B Preferred Stock (1,000 shares) |
— | 270 | ||||||||||||||||||||||||||
| Common Stock (423 shares) |
524 | — | ||||||||||||||||||||||||||
| Warrants to purchase Common Stock (expire 10/16) |
348 | — | ||||||||||||||||||||||||||
| Contract Datascan Holdings, Inc. |
Business Services |
Subordinated Debt (Due 3/16)(1) |
12.0 | % | 2.0 | % | 14.0 | % | 8,402 | 7,778 | 7,353 | |||||||||||||||||
| Series A Preferred Stock (10.0%, 2,313 shares)(1) |
2,387 | 1,931 | ||||||||||||||||||||||||||
| Common Stock (4,806 shares)(1) |
477 | — | ||||||||||||||||||||||||||
| Stratford School Holdings, Inc.(2) |
Education |
Senior Debt (Due 12/15)(1) |
7.5 | % | — | 7.5 | % | 17,500 | 17,412 | 17,412 | ||||||||||||||||||
| Series A Convertible Preferred Stock (12.0%, 10,000 shares) |
123 | 10,191 | ||||||||||||||||||||||||||
| Warrants to purchase Common Stock (expire 5/15)(1) |
— | 3,087 | ||||||||||||||||||||||||||
|
|
|
|
|
|||||||||||||||||||||||||
| Total Affiliate Investments (represents 7.0% of total investments at fair value) |
|
40,858 | 51,770 | |||||||||||||||||||||||||
|
|
|
|
|
|||||||||||||||||||||||||
The accompanying notes are an integral part of these financial statements
81
Table of Contents
MCG Capital Corporation
CONSOLIDATED SCHEDULE OF INVESTMENTS
December 31, 2011
(dollars in thousands)
| Interest Rate(9) | Fair Value |
|||||||||||||||||||||||||||
| Portfolio Company |
Industry |
Investment |
Current | PIK | Total | Principal | Cost | |||||||||||||||||||||
| Non-Affiliate Investments (less than 5% owned): |
||||||||||||||||||||||||||||
| BarBri, Inc. |
Publishing |
Senior Debt (Due 6/17)(1) |
6.0 | % | — | 6.0 | % | $ | 7,000 | $ | 6,936 | $ | 6,991 | |||||||||||||||
| Bentley Systems, Incorporated(14) |
Information Services |
Senior Debt (Due 12/16)(1) |
5.8 | % | — | 5.8 | % | 9,900 | 9,810 | 9,810 | ||||||||||||||||||
| Capstone Logistics, LLC(12) |
Logistics |
Senior Debt (Due 9/16)(1) |
10.5 | % | — | 10.5 | % | 29,957 | 29,816 | 29,816 | ||||||||||||||||||
| Chase Doors Holdings, Inc. |
Manufacturing |
Senior Debt (Due 12/15)(1) |
9.5 | % | — | 9.5 | % | 23,660 | 23,442 | 23,442 | ||||||||||||||||||
| Coastal Sunbelt Holding, Inc.(2) |
Food Services |
Senior Debt (Due 8/14-12/15)(1) |
9.1 | % | — | 9.1 | % | 19,961 | 19,818 | 19,818 | ||||||||||||||||||
| Subordinated Debt (Due 8/15)(1) |
16.0 | % | — | 16.0 | % | 9,038 | 8,967 | 9,024 | ||||||||||||||||||||
| Coastal Sunbelt Real Estate, Inc. |
Real Estate Investments |
Series A-2 Preferred Stock (12.0%, 20,000 shares) |
— | 441 | ||||||||||||||||||||||||
| Construction Trailer Specialists, Inc.(2) |
Auto Parts |
Senior Debt (Due 6/13)(1) |
8.6 | % | 6.3 | % | 14.9 | % | 8,020 | 7,877 | 7,575 | |||||||||||||||||
| Cruz Bay Publishing, Inc. |
Publishing |
Subordinated Debt (Due 12/13)(1)(8) |
5.3 | % | 8.0 | % | 13.3 | % | 26,154 | 22,895 | 19,440 | |||||||||||||||||
| CWP/RMK Acquisition Corp.(2)(6) |
Home Furnishings |
Senior Debt (Due 12/16)(7) |
3.0 | % | — | 3.0 | % | 600 | 564 | 559 | ||||||||||||||||||
| Data Based Systems International, Inc. |
Business Services |
Subordinated Debt (Due 8/16)(1) |
10.0 | % | 4.0 | % | 14.0 | % | 9,004 | 8,834 | 8,989 | |||||||||||||||||
| Education Management, Inc. |
Education |
Senior Debt (Due 6/15)(1) |
9.3 | % | — | 9.3 | % | 25,000 | 24,775 | 24,963 | ||||||||||||||||||
| Focus Brands Inc. (13) |
Restaurants |
Senior Debt (Due 11/16)(1) |
5.3 | % | — | 5.3 | % | 9,354 | 9,355 | 9,296 | ||||||||||||||||||
| Gans Communications, L.P.(2) |
Cable |
Senior Debt (Due 10/17)(1) |
5.3 | % | — | 5.3 | % | 5,565 | 5,548 | 5,520 | ||||||||||||||||||
| G&L Investment Holdings, LLC(2) |
Insurance |
Subordinated Debt (Due 5/14)(1) |
10.7 | % | 4.3 | % | 15.0 | % | 17,882 | 17,565 | 17,565 | |||||||||||||||||
| Series A Preferred Shares (14.0%, 5,000,000 shares) |
8,192 | 7,422 | ||||||||||||||||||||||||||
| Class C Shares (621,907 shares) |
529 | — | ||||||||||||||||||||||||||
| Golden Knight II CLO, Ltd. |
Diversified Financial Services |
Income Notes (Due 4/19) |
8.0 | % | — | 8.0 | % | 3,053 | 2,207 | |||||||||||||||||||
| Goodman Global, Inc. |
Manufacturing |
Senior Debt (Due 10/16)(1) |
5.8 | % | — | 5.8 | % | 5,599 | 5,630 | 5,611 | ||||||||||||||||||
| GSDM Holdings Corp.(2) |
Healthcare |
Senior Debt (Due 1/16)(1) |
11.5 | % | 6.0 | % | 17.5 | % | 26,777 | 26,536 | 26,536 | |||||||||||||||||
| Series B Preferred Stock (12.5%, 852,950 shares) |
5,292 | 8,117 | ||||||||||||||||||||||||||
| Haws Corporation(15) |
Manufacturing |
Senior Debt (Due 12/15)(1) |
10.5 | % | — | 10.5 | % | 16,500 | 16,320 | 16,320 | ||||||||||||||||||
| Industrial Safety Technologies, LLC |
Manufacturing |
Senior Debt (Due 9/16)(1) |
10.0 | % | — | 10.0 | % | 22,000 | 21,772 | 21,772 | ||||||||||||||||||
| Jenzabar, Inc.(10) |
Technology |
Senior Preferred Stock (11.0%, 3,750 shares) |
6,844 | 6,844 | ||||||||||||||||||||||||
| Subordinated Preferred Stock (109,800 shares) |
1,098 | 988 | ||||||||||||||||||||||||||
| Warrants to purchase Common Stock (expire 4/16) |
422 | 16,858 | ||||||||||||||||||||||||||
| Legacy Cabinets Holdings II, Inc.(6) |
Home Furnishings |
Class B-1 Common Stock (2,000 shares) |
2,185 | — | ||||||||||||||||||||||||
| Mailsouth, Inc. |
Publishing |
Senior Debt (Due 12/16)(1) |
6.8 | % | — | 6.8 | % | 4,963 | 4,901 | 4,888 | ||||||||||||||||||
| Maverick Healthcare Equity, LLC |
Healthcare |
Preferred Units (10.0%, 1,250,000 units) |
1,744 | 1,882 | ||||||||||||||||||||||||
| Class A Common Units (1,250,000 units) |
— | 484 | ||||||||||||||||||||||||||
| Metropolitan Telecommunications Holding Company(2) |
Communications |
Senior Debt (Due 3/14-12/16)(1) |
8.1 | % | — | 8.1 | % | 23,770 | 23,630 | 23,630 | ||||||||||||||||||
| Miles Media Group, LLC(2) |
Business Services |
Senior Debt (Due 6/16)(1) |
12.5 | % | — | 12.5 | % | 17,738 | 17,444 | 17,309 | ||||||||||||||||||
| Warrants to purchase Class A Units (expire 3/21) (1) |
123 | 523 | ||||||||||||||||||||||||||
| NDSSI Holdings, LLC(2) |
Electronics |
Senior Debt (Due 12/12)(1) |
12.8 | % | 1.0 | % | 13.8 | % | 29,859 | 29,718 | 28,791 | |||||||||||||||||
| Series D Preferred Units (30.0%, 2,000,000 units) |
2,000 | 3,175 | ||||||||||||||||||||||||||
| Series A Preferred Units (516,691 units) |
718 | — | ||||||||||||||||||||||||||
| Series B Convertible Preferred Units (165,003 units) |
142 | — | ||||||||||||||||||||||||||
| Class A Common Units (1,000,000 units) |
333 | — | ||||||||||||||||||||||||||
The accompanying notes are an integral part of these financial statements
82
Table of Contents
MCG Capital Corporation
CONSOLIDATED SCHEDULE OF INVESTMENTS
December 31, 2011
(dollars in thousands)
| Interest Rate(9) | Principal | Cost | Fair Value |
|||||||||||||||||||||||||
| Portfolio Company |
Industry |
Investment |
Current | PIK | Total | |||||||||||||||||||||||
| Orbitz Worldwide, Inc. |
Personal Transportation |
Senior Debt (Due 7/14)(1) |
3.4 | % | — | 3.4 | % | $ | 3,014 | $ | 2,883 | $ | 2,604 | |||||||||||||||
| Ozburn-Hessey Holding Company LLC |
Logistics |
Senior Debt (Due 4/16)(1) |
8.3 | % | — | 8.3 | % | 4,378 | 4,426 | 3,868 | ||||||||||||||||||
| Philadelphia Media Network, Inc.(6) |
Newspaper |
Class A Common Stock (1,000 shares) |
5,070 | 7 | ||||||||||||||||||||||||
| Qualawash Holdings, LLC |
Repair Services |
Subordinated Debt (Due 1/16)(1) |
11.0 | % | — | 11.0 | % | 20,000 | 19,839 | 19,839 | ||||||||||||||||||
| Rita’s Water Ice Franchise Company, LLC |
Restaurants |
Senior Debt (Due 11/16)(1) |
14.0 | % | — | 14.0 | % | 9,375 | 9,282 | 9,282 | ||||||||||||||||||
| Sagamore Hill Broadcasting, LLC(2) |
Broadcasting |
Senior Debt (Due 8/14)(1) |
12.0 | % | 1.0 | % | 13.0 | % | 11,114 | 11,018 | 11,018 | |||||||||||||||||
| Sally Holdings LLC |
Cosmetics |
Senior Debt (Due 11/13)(1) |
2.6 | % | — | 2.6 | % | 8,531 | 8,541 | 8,521 | ||||||||||||||||||
| SC Academy Holdings, Inc. |
Education |
Subordinated Debt (Due 7/16)(1) |
12.0 | % | — | 12.0 | % | 13,500 | 13,398 | 13,471 | ||||||||||||||||||
| Scotsman Industries, Inc. |
Manufacturing |
Senior Debt (Due 4/16)(1) |
5.8 | % | — | 5.8 | % | 5,309 | 5,309 | 5,256 | ||||||||||||||||||
| Service Champ, Inc. |
Auto Parts |
Subordinated Unsecured Debt ( Due 2/17)(1) |
12.0 | % | 2.3 | % | 14.3 | % | 12,111 | 12,009 | 12,203 | |||||||||||||||||
| ShowPlex Cinemas, Inc. |
Entertainment |
Senior Debt (Due 5/15)(1) |
11.0 | % | — | 11.0 | % | 7,689 | 7,539 | 7,539 | ||||||||||||||||||
| Softlayer Technologies, Inc. |
Business Services |
Senior Debt (Due 11/16)(1) |
7.3 | % | — | 7.3 | % | 13,860 | 13,718 | 13,906 | ||||||||||||||||||
| Summit Business Media Parent Holding Company LLC(6)(11) |
Information Services |
Class E Series I Units (636 units)(1) |
4,120 | 281 | ||||||||||||||||||||||||
| Class E Series II Units (276 units) (1) |
1,788 | — | ||||||||||||||||||||||||||
| Sunshine Media Group, Inc.(2)(6) |
Publishing |
Warrants to purchase Common Stock (expire 1/21) |
— | — | ||||||||||||||||||||||||
| Tank Intermediate Holding Corp. |
Manufacturing |
Senior Debt (Due 4/16)(1) |
5.0 | % | — | 5.0 | % | 5,506 | 5,421 | 5,448 | ||||||||||||||||||
| The e-Media Club I, LLC(6) |
Investment Fund |
LLC Interest (74 units) |
88 | 11 | ||||||||||||||||||||||||
| The Gavilon Group, LLC |
Agriculture |
Senior Debt (Due 12/16)(1) |
6.0 | % | — | 6.0 | % | 9,500 | 9,395 | 9,464 | ||||||||||||||||||
| The Matrixx Group, Incorporated |
Plastic Products |
Subordinated Debt (Due 6/14)(1) |
10.8 | % | — | 10.8 | % | 12,500 | 12,500 | 12,639 | ||||||||||||||||||
| Virtual Radiologic Corporation |
Healthcare |
Senior Debt (Due 12/16)(1) |
7.8 | % | — | 7.8 | % | 13,915 | 13,730 | 13,184 | ||||||||||||||||||
| Visant Corporation |
Consumer Products |
Senior Debt (Due 12/16)(1) |
5.3 | % | — | 5.3 | % | 4,851 | 4,866 | 4,563 | ||||||||||||||||||
| VS&A-PBI Holding LLC(6) |
Publishing |
LLC Interest |
500 | — | ||||||||||||||||||||||||
| West World Media, LLC |
Information Services |
Senior Debt (Due 9/15)(1) |
11.0 | % | 3.0 | % | 14.0 | % | 11,301 | 10,577 | 10,577 | |||||||||||||||||
| Class A Membership Units (25,000 units) (1) |
1 | 285 | ||||||||||||||||||||||||||
| Warrant to purchase Class A Membership Units (expire 9/15) (1) |
324 | 719 | ||||||||||||||||||||||||||
| Xpressdocs Holdings, Inc.(2) |
Business Services |
Senior Debt (Due 4/12-4/13)(1) |
10.9 | % | 0.9 | % | 11.8 | % | 18,734 | 18,539 | 18,733 | |||||||||||||||||
| Series A Preferred Stock (161,870 shares) |
500 | 109 | ||||||||||||||||||||||||||
|
|
|
|
|
|||||||||||||||||||||||||
| Total Non-Affiliate Investments (represents 76.9% of total investments at fair value) |
570,209 | 570,133 | ||||||||||||||||||||||||||
|
|
|
|
|
|||||||||||||||||||||||||
| Total Investments |
$ | 1,017,218 | $ | 741,166 | ||||||||||||||||||||||||
|
|
|
|
|
|||||||||||||||||||||||||
The accompanying notes are an integral part of these financial statements
83
Table of Contents
CONSOLIDATED SCHEDULE OF INVESTMENTS
December 31, 2010
(dollars in thousands)
| Interest Rate(9) | Fair Value | |||||||||||||||||||||||||||
| Portfolio Company |
Industry |
Investment |
Current | PIK | Total | Principal | Cost | |||||||||||||||||||||
| Control Investments(4): |
||||||||||||||||||||||||||||
| Avenue Broadband LLC(2) |
Cable | Subordinated Debt (Due 3/14)(1) | 9.0 | % | 5.0 | % | 14.0 | % | $ | 15,182 | $ | 15,115 | $ | 15,115 | ||||||||||||||
| Preferred Units (10.8%, 17,100 units)(1) | 23,151 | 35,371 | ||||||||||||||||||||||||||
| Warrants to purchase Class B Common Stock | — | — | ||||||||||||||||||||||||||
| Broadview Networks |
Communications | Series A Preferred Stock (12.0%, 87,254 shares) | 81,984 | 47,477 | ||||||||||||||||||||||||
| Holdings, Inc.(6) |
Series A-1 Preferred Stock (12.0%, 100,702 shares) | 77,495 | 54,794 | |||||||||||||||||||||||||
| Series B Preferred Stock (12.0%, 1,282 shares) | 100 | 698 | ||||||||||||||||||||||||||
| Class A Common Stock (4,731,031 shares) | — | — | ||||||||||||||||||||||||||
| GMC Television |
Broadcasting | Senior Debt (Due 12/16)(1) | 4.3 | % | — | 4.3 | % | 23,720 | 21,240 | 21,656 | ||||||||||||||||||
| Broadcasting, LLC(2) |
Subordinated Debt (Due 12/16)(1)(7) | 14.0 | % | — | 14.0 | % | 10,446 | 6,975 | — | |||||||||||||||||||
| Subordinated Unsecured Debt (Due 12/16)(7) | 16.0 | % | — | 16.0 | % | 1,248 | 1,000 | — | ||||||||||||||||||||
| Class B Voting Units (8.0%, 86,700 units) | 9,071 | — | ||||||||||||||||||||||||||
| Intran Media, LLC |
Other Media | Senior Debt (Due 12/11)(1) | 9.5 | % | — | 9.5 | % | 9,200 | 9,164 | 7,430 | ||||||||||||||||||
| Series A Preferred Units (10.0%, 86,000 units) | 9,095 | — | ||||||||||||||||||||||||||
| Series B Preferred Units (10.0%, 30,000 units) | 3,000 | — | ||||||||||||||||||||||||||
| Jet Plastica Investors, LLC(2) |
Plastic Products | Senior Debt (Due 12/12)(1) | 13.3 | % | — | 13.3 | % | 14,052 | 13,990 | 13,990 | ||||||||||||||||||
| Subordinated Debt A (Due 3/13)(1)(7) | 3.7 | % | 11.5 | % | 15.2 | % | 22,038 | 19,365 | 7,143 | |||||||||||||||||||
| Subordinated Debt B (Due 3/13)(1)(7) | 17.0 | % | — | 17.0 | % | 27,485 | 21,560 | — | ||||||||||||||||||||
| Preferred LLC Interest (8.0%, 301,595 units) | 34,014 | — | ||||||||||||||||||||||||||
| MTP Holding, LLC(6) |
Communications | Common LLC Interest (79,171 units) | 1 | — | ||||||||||||||||||||||||
| NPS Holding |
Business | Senior Debt A1 (Due 6/13)(1)(7) | 6.0 | % | — | 6.0 | % | 4,702 | 3,470 | 3,348 | ||||||||||||||||||
| Group, LLC(2)(5)(6) |
Services | Senior Debt A2 (Due 6/13)(1)(7) | 6.0 | % | — | 6.0 | % | 2,070 | 1,905 | — | ||||||||||||||||||
| Senior Debt A3 (Due 6/13)(1)(7) | 6.0 | % | — | 6.0 | % | 7,872 | 6,228 | — | ||||||||||||||||||||
| Series A Preferred Units (347 units) | — | — | ||||||||||||||||||||||||||
| Series B Preferred Units (5.0%,10,731 units) | 10,731 | — | ||||||||||||||||||||||||||
| Common Units (36,500 units) | — | — | ||||||||||||||||||||||||||
| Orbitel Holdings, LLC(2) |
Cable | Senior Debt (Due 3/12)(1) | 9.0 | % | — | 9.0 | % | 14,915 | 14,874 | 14,874 | ||||||||||||||||||
| Preferred LLC Interest (10.0%, 120,000 units) | 14,138 | 13,515 | ||||||||||||||||||||||||||
| Premier Garage |
Home Furnishings | Senior Debt (Due 12/10-9/11)(1)(7) | 8.0 | % | — | 8.0 | % | 10,441 | 8,998 | 5,916 | ||||||||||||||||||
| Holdings, LLC(2)(6) |
Preferred LLC Units (400 units) | 400 | — | |||||||||||||||||||||||||
| Common LLC Units (79,935 units) | 4,971 | — | ||||||||||||||||||||||||||
| Radio Pharmacy |
Healthcare | Senior Debt (Due 10/11)(1) | 7.0 | % | — | 7.0 | % | 8,500 | 8,500 | 8,500 | ||||||||||||||||||
| Investors, LLC(2) |
Subordinated Debt (Due 12/12)(1) | 12.0 | % | 3.0 | % | 15.0 | % | 10,372 | 10,357 | 10,357 | ||||||||||||||||||
| Preferred LLC Interest (8.0%, 70,000 units) | 8,123 | 7,219 | ||||||||||||||||||||||||||
| Superior Industries Investors, LLC(2) |
Sporting Goods | Subordinated Debt (Due 3/13)(1) | 7.0 | % | 9.0 | % | 16.0 | % | 23,662 | 23,603 | 23,603 | |||||||||||||||||
| Preferred Units (8.0%, 125,400 units) | 16,495 | 19,283 | ||||||||||||||||||||||||||
| Total Sleep Holdings, Inc.(2)(6) |
Healthcare | Subordinated Debt (Due 9/11)(7) | 8.0 | % | — | 8.0 | % | 13,044 | 11,780 | — | ||||||||||||||||||
| Unsecured Note (Due 6/11)(7) | 0.0 | % | — | 0.0 | % | 375 | 332 | — | ||||||||||||||||||||
| Series A Preferred Stock (10.0%, 3,700 shares) | 3,793 | — | ||||||||||||||||||||||||||
| Series B Preferred Stock (10.0%, 2,752 shares) | 21,149 | — | ||||||||||||||||||||||||||
| Common Stock (40,469 shares) | 1,000 | — | ||||||||||||||||||||||||||
|
|
|
|
|
|||||||||||||||||||||||||
| Total Control Investments (represents 30.7% of total investments at fair value) |
517,167 | 310,289 | ||||||||||||||||||||||||||
|
|
|
|
|
|||||||||||||||||||||||||
The accompanying notes are an integral part of these financial statements
84
Table of Contents
MCG Capital Corporation
CONSOLIDATED SCHEDULE OF INVESTMENTS
December 31, 2010
(dollars in thousands)
| Interest Rate(9) | Fair Value |
|||||||||||||||||||||||||||
| Portfolio Company |
Industry | Investment |
Current | PIK | Total | Principal | Cost | |||||||||||||||||||||
| Affiliate Investments(3): |
||||||||||||||||||||||||||||
| Advanced Sleep |
Home Furnishings |
Senior Debt (Due 10/11)(1) | 13.6 | % | — | 13.6 | % | $ | 5,355 | $ | 5,322 | $ | 5,322 | |||||||||||||||
| Concepts, Inc.(2) |
Subordinated Debt (Due 4/12)(1) | 12.0 | % | 4.0 | % | 16.0 | % | 5,336 | 5,285 | 5,274 | ||||||||||||||||||
| Series A Preferred Stock (20.0%, 49 shares) | 297 | 104 | ||||||||||||||||||||||||||
| Common Stock (423 shares) | 524 | — | ||||||||||||||||||||||||||
| Warrants to purchase Common Stock (expire 10/16) | 348 | — | ||||||||||||||||||||||||||
| Cherry Hill Holdings, Inc. |
Entertainment | Series A Preferred Stock (10.0%, 750 shares) | 945 | 1,076 | ||||||||||||||||||||||||
| Contract Datascan |
Business Services | Subordinated Debt (Due 3/16)(1) | 12.0 | % | 2.0 | % | 14.0 | % | 7,756 | 7,074 | 7,074 | |||||||||||||||||
| Holdings, Inc. |
Series A Preferred Stock (1,987 shares)(1) | 1,983 | 1,983 | |||||||||||||||||||||||||
| Common Stock (4,135 shares)(1) | 410 | 410 | ||||||||||||||||||||||||||
| Stratford School |
Education | Senior Debt (Due 12/15)(1) | 7.5 | % | — | 7.5 | % | 19,000 | 18,885 | 18,885 | ||||||||||||||||||
| Holdings, Inc.(2) |
Series A Convertible Preferred Stock (12.0%, 10,000 shares) | 3 | 8,534 | |||||||||||||||||||||||||
| Warrants to purchase Common Stock (expire 5/15)(1) | — | 2,910 | ||||||||||||||||||||||||||
| Sunshine Media |
Publishing | Common Stock (145 shares) | 581 | 116 | ||||||||||||||||||||||||
| Delaware, LLC(2)(6) |
Class A LLC Interest (8.0%, 563,808 units) | 564 | 112 | |||||||||||||||||||||||||
| Options to acquire Warrants to purchase Class B LLC Interest (expire 5/14) | — | — | ||||||||||||||||||||||||||
| Velocity Technology |
Business Services | Series A Preferred Stock (1,506,602 shares) | 1,500 | 1,500 | ||||||||||||||||||||||||
| Enterprises, Inc.(2)(6) |
||||||||||||||||||||||||||||
|
|
|
|
|
|||||||||||||||||||||||||
| Total Affiliate Investments (represents 5.3% of total investments at fair value) |
43,721 | 53,300 | ||||||||||||||||||||||||||
|
|
|
|
|
|||||||||||||||||||||||||
The accompanying notes are an integral part of these financial statements
85
Table of Contents
MCG Capital Corporation
CONSOLIDATED SCHEDULE OF INVESTMENTS
December 31, 2010
(dollars in thousands)
| Interest Rate(9) | Fair Value |
|||||||||||||||||||||||||||
| Portfolio Company |
Industry |
Investment |
Current | PIK | Total | Principal | Cost | |||||||||||||||||||||
| Non-Affiliate Investments (less than 5% owned): |
||||||||||||||||||||||||||||
| Active BrandsInternational, Inc.(2)(6) |
Consumer Products |
Senior Debt (Due 6/12)(1)(7) |
10.4 | % | — | 10.4 | % | $ | 29,263 | $ | 26,328 | $ | 1,939 | |||||||||||||||
| Subordinated Debt (Due 9/12)(1)(7) |
— | 17.0 | % | 17.0 | % | 18,066 | 12,053 | — | ||||||||||||||||||||
| Class A-1 Common Stock (3,056 shares) |
3,056 | — | ||||||||||||||||||||||||||
| Warrants to purchase Class A-1 Common Stock (expire 6/17) |
331 | — | ||||||||||||||||||||||||||
| Allen’s T.V. Cable Service, Inc. |
Cable |
Senior Debt (Due 12/12)(1) |
7.3 | % | — | 7.3 | % | 5,080 | 5,069 | 5,069 | ||||||||||||||||||
| Subordinated Debt (Due 12/12)(1) |
10.0 | % | — | 10.0 | % | 2,415 | 2,384 | 2,343 | ||||||||||||||||||||
| Warrants to purchase Common Stock (expire 11/15) |
— | 47 | ||||||||||||||||||||||||||
| Chase Doors Holdings, Inc. |
Manufacturing |
Senior Debt (Due 12/15)(1) |
9.5 | % | — | 9.5 | % | 29,250 | 28,935 | 28,935 | ||||||||||||||||||
| Coastal Sunbelt Holding, Inc.(2) |
Food Services |
Senior Debt (Due 8/14-2/15)(1) |
9.1 | % | — | 9.1 | % | 21,411 | 21,239 | 21,239 | ||||||||||||||||||
| Subordinated Debt (Due 8/15)(1) |
12.0 | % | 4.0 | % | 16.0 | % | 8,859 | 8,795 | 8,795 | |||||||||||||||||||
| Coastal Sunbelt Real Estate, Inc. |
Real Estate Investments |
Subordinated Unsecured Debt (Due 7/12) |
15.0 | % | — | 15.0 | % | 2,257 | 2,251 | 2,251 | ||||||||||||||||||
| Series A-2 Preferred Stock (12.0%, 20,000 shares) |
2,656 | 2,318 | ||||||||||||||||||||||||||
| Warrants to purchase Class B Common Stock |
— | — | ||||||||||||||||||||||||||
| Construction Trailer Specialists, Inc.(2) |
Auto Parts |
Senior Debt (Due 06/13)(1) |
8.6 | % | 6.3 | % | 14.9 | % | 7,690 | 7,531 | 6,889 | |||||||||||||||||
| Cruz Bay Publishing, Inc. |
Publishing |
Subordinated Debt (Due 12/13)(1)(8) |
5.0 | % | 8.0 | % | 13.0 | % | 24,630 | 22,855 | 17,365 | |||||||||||||||||
| CWP/RMK Acquisition Corp.(2)(6) |
Home Furnishings |
Senior Debt (Due 12/16)(7) |
3.0 | % | — | 3.0 | % | 600 | 583 | 518 | ||||||||||||||||||
| Empower IT Holdings, Inc.(2) |
Information Services |
Senior Debt (Due 5/12)(1) |
11.0 | % | — | 11.0 | % | 3,387 | 3,343 | 3,343 | ||||||||||||||||||
| Equibrand Holding(16) Corporation(2) |
Leisure Activities |
Senior Debt (Due 6/11)(1) |
9.5 | % | — | 9.5 | % | 4,244 | 4,234 | 4,234 | ||||||||||||||||||
| Subordinated Debt (Due 12/11)(1) |
12.0 | % | 5.0 | % | 17.0 | % | 10,142 | 10,109 | 10,109 | |||||||||||||||||||
| Focus Brands Inc. |
Restaurants |
Senior Debt (Due 11/16)(1) |
7.3 | % | — | 7.3 | % | 11,018 | 11,047 | 11,150 | ||||||||||||||||||
| G&L Investment |
Insurance |
Subordinated Debt (Due 5/14)(1) |
9.8 | % | — | 9.8 | % | 17,500 | 17,129 | 17,129 | ||||||||||||||||||
| Holdings, LLC(2) |
Series A Preferred Shares (14.0%, 5,000,000 shares) |
7,651 | 7,651 | |||||||||||||||||||||||||
| Class C Shares (621,907 shares) |
529 | 213 | ||||||||||||||||||||||||||
| Golden Knight II CLO, Ltd.(6) |
Diversified Financial Services |
Income Notes (Due 4/19) |
8.0 | % | — | 8.0 | % | 3,038 | 2,395 | |||||||||||||||||||
| Goodman Global, Inc. |
Business Services |
Senior Debt (Due 10/16)(1) |
5.8 | % | — | 5.8 | % | 2,993 | 2,993 | 3,013 | ||||||||||||||||||
| GSDM Holdings, LLC(2) |
Healthcare |
Senior Debt (Due 12/13)(1) |
12.9 | % | — | 12.9 | % | 26,130 | 25,980 | 25,980 | ||||||||||||||||||
| Series B Preferred Units (12.5%, 4,213,333 units) |
4,679 | 5,052 | ||||||||||||||||||||||||||
| Haws Corporation(15) |
Manufacturing |
Senior Debt (Due 12/15)(1) |
10.5 | % | — | 10.5 | % | 22,500 | 22,230 | 22,230 | ||||||||||||||||||
| Interactive Data Corporation |
Diversified Financial Services |
Senior Debt (Due 01/17) (1) |
6.8 | % | — | 6.8 | % | 9,950 | 10,040 | 10,094 | ||||||||||||||||||
| Jenzabar, Inc.(10) |
Technology |
Senior Preferred Stock (11.0%, 3,750 shares) |
6,431 | 6,431 | ||||||||||||||||||||||||
| Subordinated Preferred Stock (109,800 shares) |
1,098 | 1,098 | ||||||||||||||||||||||||||
| Warrants to purchase Common Stock (expire 4/16) |
423 | 27,798 | ||||||||||||||||||||||||||
| Knology Inc. |
Cable |
Senior Debt (Due 10/16)(1) |
5.5 | % | — | 5.5 | % | 6,090 | 6,098 | 6,133 | ||||||||||||||||||
| Lambeau Telecom Company, LLC(6) |
Communications |
Senior Debt (Due 2/13)(7) |
12.0 | % | — | 12.0 | % | 1,067 | 1,002 | 675 | ||||||||||||||||||
| Legacy Cabinets Holdings II, Inc.(6) |
Home Furnishings |
Class B-1 Common Stock (2,000 shares) |
2,185 | 17 | ||||||||||||||||||||||||
| LMS INTELLIBOUND, INC.(2)(12) |
Logistics |
Senior Debt (Due 3/14–6/14)(1) |
8.7 | % | — | 8.7 | % | 16,320 | 16,114 | 16,114 | ||||||||||||||||||
| Subordinated Debt (Due 9/14)(1) |
12.0 | % | 4.0 | % | 16.0 | % | 7,000 | 6,879 | 6,879 | |||||||||||||||||||
| Mailsouth, Inc. |
Publishing |
Senior Debt (Due 12/16) |
7.0 | % | — | 7.0 | % | 5,000 | 4,925 | 4,950 | ||||||||||||||||||
| Massage Envy, LLC |
Leisure Activities |
Senior Debt (Due 12/14)(1) |
11.0 | % | — | 11.0 | % | 10,222 | 10,023 | 10,023 | ||||||||||||||||||
| Maverick Healthcare Equity, LLC |
Healthcare |
Subordinated Debt (Due 4/14)(1) |
12.5 | % | 3.5 | % | 16.0 | % | 13,357 | 13,223 | 13,223 | |||||||||||||||||
| Preferred Units (10.0%, 1,250,000 units) |
1,580 | 1,710 | ||||||||||||||||||||||||||
| Class A Common Units (1,250,000 units) |
— | 271 | ||||||||||||||||||||||||||
The accompanying notes are an integral part of these financial statements
86
Table of Contents
MCG Capital Corporation
CONSOLIDATED SCHEDULE OF INVESTMENTS
December 31, 2010
(dollars in thousands)
| Interest Rate(9) | Fair Value |
|||||||||||||||||||||||||||
| Portfolio Company |
Industry | Investment |
Current | PIK | Total | Principal | Cost | |||||||||||||||||||||
| Metropolitan Telecommunications Holding Company(2) |
Communications | Senior Debt (Due 3/14-12/16)(1) | 8.0 | % | — | 8.0 | % | $ | 27,770 | $ | 27,534 | $ | 27,534 | |||||||||||||||
| Miles Media Group, LLC(2) |
Business Services |
Senior Debt (Due 6/13)(1) | 12.5 | % | — | 12.5 | % | 16,238 | 16,049 | 16,049 | ||||||||||||||||||
| MLM Holdings, Inc. |
Information Services |
Senior Debt (Due 12/16)(1) | 7.0 | % | — | 7.0 | % | 14,464 | 14,248 | 14,301 | ||||||||||||||||||
| NDSSI Holdings, LLC(2) |
Electronics | Senior Debt (Due 9/14)(1) | 13.8 | % | 1.0 | % | 14.8 | % | 30,132 | 29,928 | 29,928 | |||||||||||||||||
| Series A Preferred Units (516,691 units) | 718 | 125 | ||||||||||||||||||||||||||
| Series B Convertible Preferred Units (165,003 units) | 142 | 356 | ||||||||||||||||||||||||||
| Class A Common Units (1,000,000 units) | 333 | — | ||||||||||||||||||||||||||
| Orbitz Worldwide, Inc. |
Personal Transportation |
Senior Debt (Due 07/14)(1) | 3.3 | % | — | 3.3 | % | 3,140 | 2,960 | 2,949 | ||||||||||||||||||
| Ozburn-Hessey Holding Company LLC |
Logistics | Senior Debt (Due 04/16)(1) | 7.5 | % | — | 7.5 | % | 4,975 | 5,034 | 5,043 | ||||||||||||||||||
| Philadelphia Media Network, Inc.(6) |
Newspaper | Class A Common Stock (1,000 shares) | 5,070 | 48 | ||||||||||||||||||||||||
| Provo Craft & Novelty Inc. |
Leisure Activities |
Senior Debt (Due 3/16)(1) | 8.0 | % | — | 8.0 | % | 8,077 | 7,841 | 7,850 | ||||||||||||||||||
| Restaurant Technologies, Inc. |
Food Services | Senior Debt (Due 2/12)(1) | 17.6 | % | — | 17.6 | % | 42,742 | 42,607 | 42,607 | ||||||||||||||||||
| Common Stock (47,512 shares) | 353 | 81 | ||||||||||||||||||||||||||
| Warrants to purchase Common Stock (expire 6/14) | — | 685 | ||||||||||||||||||||||||||
| Rural/Metro Operating Company, LLC |
Healthcare | Senior Debt (Due 11/16) (1) | 6.0 | % | — | 6.0 | % | 4,000 | 3,980 | 4,046 | ||||||||||||||||||
| Sagamore Hill Broadcasting, LLC(2) |
Broadcasting | Senior Debt (Due 8/11)(1) | 12.0 | % | 2.0 | % | 14.0 | % | 27,169 | 26,360 | 26,183 | |||||||||||||||||
| Savvis Communications Corporation |
Business Services |
Senior Debt (Due 08/16)(1) | 6.8 | % | — | 6.8 | % | 9,975 | 10,029 | 10,148 | ||||||||||||||||||
| SC Academy Holdings, Inc. |
Education | Subordinated Debt (Due 7/16)(1) | 12.0 | % | — | 12.0 | % | 13,500 | 13,375 | 13,375 | ||||||||||||||||||
| Service Champ, Inc. |
Auto Parts | Subordinated Unsecured Debt (Due 1/16)(1) | 12.0 | % | 2.3 | % | 14.3 | % | 10,158 | 10,070 | 10,070 | |||||||||||||||||
| ShowPlex Cinemas, Inc. |
Entertainment | Senior Debt (Due 5/15)(1) | 9.0 | % | — | 9.0 | % | 11,025 | 10,882 | 10,706 | ||||||||||||||||||
| Softlayer Technologies, Inc. |
Business Services |
Senior Debt (Due 11/16)(1) | 7.8 | % | — | 7.8 | % | 14,000 | 13,830 | 14,003 | ||||||||||||||||||
| Summit Business Media Intermediate Holding Company, LLC(6)(11) |
Information Services |
Subordinated Debt (Due 7/14)(1)(7) | 11.0 | % | — | 11.0 | % | 7,158 | 5,996 | 296 | ||||||||||||||||||
| Teleguam Holdings, LLC(2) |
Communications | Subordinated Debt (Due 10/12)(1) | 7.3 | % | — | 7.3 | % | 20,000 | 19,921 | 19,729 | ||||||||||||||||||
| The e-Media Club I, LLC(6) |
Investment Fund | LLC Interest (74 units) | 88 | 10 | ||||||||||||||||||||||||
| The Gavilon Group, LLC |
Agriculture | Senior Debt (Due 12/16)(1) | 6.0 | % | — | 6.0 | % | 8,500 | 8,373 | 8,418 | ||||||||||||||||||
| The Matrixx Group, Incorporated |
Plastic Products | Subordinated Debt (Due 6/14)(1) | 10.8 | % | — | 10.8 | % | 12,500 | 12,500 | 12,500 | ||||||||||||||||||
| The SI Organization, Inc. |
Defense | Senior Debt (Due 11/16)(1) | 5.8 | % | — | 5.8 | % | 3,000 | 3,000 | 3,030 | ||||||||||||||||||
| The Telx Group, Inc. |
Business Services |
Senior Debt (Due 6/15)(1) | 8.0 | % | — | 8.0 | % | 13,930 | 13,680 | 13,860 | ||||||||||||||||||
| Visant Corporation |
Consumer Products |
Senior Debt (Due 12/16)(1) | 7.0 | % | — | 7.0 | % | 6,983 | 6,849 | 7,077 | ||||||||||||||||||
| VOX Communications |
Broadcasting | Senior Debt (Due 3/09)(1)(7) | 13.5 | % | — | 13.5 | % | 11,717 | 10,388 | 6,157 | ||||||||||||||||||
| Group Holdings, LLC(2)(6) |
Convertible Preferred Subordinated Notes (12.5%, Due 6/15-6/17)(7) | 2,459 | 1,414 | — | ||||||||||||||||||||||||
| VS&A-PBI Holding LLC(6) |
Publishing | LLC Interest | 500 | — | ||||||||||||||||||||||||
| Wireco Worldgroup Inc. |
Industrial Equipment |
Senior Debt (Due 2/14)(1) | 5.3 | % | — | 5.3 | % | 3,850 | 3,856 | 3,807 | ||||||||||||||||||
| Xpressdocs Holdings, |
Business | Senior Debt (Due 4/12-4/13)(1) | 10.8 | % | 0.8 | % | 11.6 | % | 19,533 | 19,328 | 19,522 | |||||||||||||||||
|
Inc.(2) |
Services | Series A Preferred Stock (161,870 shares) | 500 | — | ||||||||||||||||||||||||
|
|
|
|
|
|||||||||||||||||||||||||
| Total Non-Affiliate Investments (represents 64.0% of total investments at fair value) |
|
684,785 | 646,116 | |||||||||||||||||||||||||
|
|
|
|
|
|||||||||||||||||||||||||
| Total Investments |
$ | 1,245,673 | $ | 1,009,705 | ||||||||||||||||||||||||
|
|
|
|
|
|||||||||||||||||||||||||
The accompanying notes are an integral part of these financial statements
87
Table of Contents
MCG Capital Corporation
CONSOLIDATED SCHEDULE OF INVESTMENTS
December 31, 2010
(dollars in thousands)
| Counterparty |
Instrument |
Pay Fixed Rate of |
Receive Floating Rate of |
Expiring | Notional | Cost | Fair Value(a) |
|||||||||||||||||||
| Interest Rate Swaps |
||||||||||||||||||||||||||
| SunTrust Bank |
Interest Rate Swap—Pay Fixed/Receive Floating | 13.0 | % | 11.0 | % | 08/11 | $ | 12,500 | $ | — | $ | (183 | ) | |||||||||||||
| Interest Rate Swap—Pay Fixed/Receive Floating |
9.0 | % | 7.0 | % | 08/11 | 8,681 | — | (127 | ) | |||||||||||||||||
|
|
|
|
|
|
|
|||||||||||||||||||||
| Total Interest Rate Swaps |
$ | 21,181 | $ | — | $ | (310 | ) | |||||||||||||||||||
|
|
|
|
|
|
|
|||||||||||||||||||||
| (a) | We include the fair value of interest rate swaps in other liabilities on our Consolidated Balance Sheets. |
| (1) | Some or all of this security is held by our SBIC subsidiary or one of our other financing subsidiaries and may have been pledged as collateral in connection therewith. See Note 6—Borrowings to the Consolidated Financial Statements. |
| (2) | Includes securities issued by one or more of the portfolio company’s affiliates. |
| (3) | Affiliate investments represent companies in which we own at least 5%, but not more than 25% of the portfolio company’s voting securities. |
| (4) | Control investments represent companies in which we own more than 25% of the portfolio company’s voting securities. |
| (5) | Represents a non-majority-owned control portfolio company of which we own at least 25%, but not more than 50% of the portfolio company’s voting securities. |
| (6) | Portfolio company is non-income producing at period-end. |
| (7) | Loan or debt security is on non-accrual status. |
| (8) | We did not recognize paid-in-kind, or PIK, interest or accretion income because the fair value of our investment was below its cost basis. However, we continue to accrue interest that is receivable in cash from the portfolio company. |
| (9) | Interest rates represent the weighted-average annual stated interest rate on debt securities, presented by nature of indebtedness for a single issuer. PIK interest represents contractually deferred interest that is added to the principal balance of the debt security and compounded if not paid on a current basis. PIK may be prepaid by either contract or the portfolio company’s choice, but generally is paid at the end of the loan term. The maturity dates represent the earliest and the latest maturity dates. Rates on preferred stock and preferred LLC interests, where applicable, represent the contractual rate. |
| (10) | In February 2012, we accepted $23.7 million for our senior preferred stock and warrant position in Jenzabar. The consideration received also settled any and all direct claims and counterclaims asserted in the litigation by and among the Company, Jenzabar and certain Jenzabar officers and directors. We will receive the balance of the payment for our position in Jenzabar in the amount of $990,000 for our subordinated preferred stock and will exchange those shares upon the final dismissal of the litigation, including the dismissal of the derivative claims. |
| (11) | On January 25, 2011, Summit Business Media Intermediate Holding Company, LLC filed for Chapter 11 bankruptcy protection. |
| (12) | In September 2011, LMS Intellibound, Inc. (a non-affiliate portfolio company) and Progressive Logistics Systems (an unaffiliated company) entered into a combination where they are now subsidiaries of Capstone Logistics, LLC. |
| (13) | In February 2012, Focus Brands Inc. senior debt was repaid in full. |
| (14) | In February 2012, Bentley Systems Incorporated senior debt was repaid in full. |
| (15) | In January 2012, Haws Corporation senior debt was repaid in full. |
The accompanying notes are an integral part of these financial statements
88
Table of Contents
NOTES TO CONSOLIDATED FINANCIAL STATEMENTS
NOTE 1—DESCRIPTION OF BUSINESS AND BASIS OF PRESENTATION
These Consolidated Financial Statements present the results of operations, financial position and cash flows of MCG Capital Corporation and its consolidated subsidiaries. The terms “we,” “our,” “us” and “MCG” refer to MCG Capital Corporation and its consolidated subsidiaries.
We are a solutions-focused commercial finance company that provides capital and advisory services to middle-market companies throughout the United States. We are an internally managed, non-diversified, closed-end investment company that elected to be regulated as a business development company, or BDC, under the Investment Company Act of 1940, as amended, or the 1940 Act. Our organization includes the following categories of subsidiaries:
Wholly Owned Special-Purpose Financing Subsidiaries—These subsidiaries are bankruptcy remote, special-purpose entities to which we transfer certain loans. Each financing subsidiary, in turn, transfers the loans to a Delaware statutory trust. For accounting purposes, the transfers of the loans to the Delaware statutory trusts are structured as on-balance sheet securitizations.
Small Business Investment Subsidiaries—We own Solutions Capital I, L.P., a wholly owned subsidiary licensed by the United States Small Business Administration, or SBA, which operates as a small business investment company, or SBIC, under the Small Business Investment Act of 1958, as amended, or SBIC Act. In March 2011, we formed another wholly owned subsidiary, Solutions Capital II, L. P., and in May 2011 we submitted a license to the SBA to obtain an SBIC license for Solutions Capital II, L.P. On September 30, 2011, after discussions with the SBA, we elected to withdraw our application for a second license. MCG is also the sole member of Solutions Capital G.P., LLC, which acts as the general partner of Solutions Capital I, L.P.
Taxable Subsidiaries—We currently qualify as a regulated investment company, or RIC, for federal income tax purposes and, therefore, are not required to pay corporate income taxes on any income or gains that we distribute to our stockholders. We have certain wholly owned taxable subsidiaries, or Taxable Subsidiaries, each of which holds one or more portfolio investments listed on our Consolidated Schedules of Investments. The purpose of these Taxable Subsidiaries is to permit us to hold portfolio companies organized as limited liability companies, or LLCs, (or other forms of pass-through entities) and still satisfy the RIC tax requirement that at least 90% of our gross revenue for income tax purposes must consist of investment income. Absent the Taxable Subsidiaries, a portion of the gross income of any LLC (or other pass-through entity) portfolio investment would flow through directly to us and be included in the calculation of the 90% test. To the extent that such income did not consist of investment income, it could jeopardize our ability to qualify as a RIC and, therefore, cause us to incur significant federal income taxes. The income of the LLCs (or other pass-through entities) owned by Taxable Subsidiaries is taxed to the Taxable Subsidiaries and does not flow through to us, thereby helping us preserve our RIC status and resultant tax advantages. We do not consolidate the Taxable Subsidiaries for income tax purposes and they may generate income tax expense because of the Taxable Subsidiaries’ ownership of the portfolio companies. We reflect any such income tax expense on our Consolidated Statements of Operations.
The accompanying financial statements reflect the consolidated accounts of MCG and the following subsidiaries: Solutions Capital I, L.P.; Solutions Capital II, L.P.; Solutions Capital G.P., LLC; and MCG’s special-purpose financing subsidiaries: MCG Finance V, LLC and MCG Finance VII, LLC.
Basis of Presentation and Use of Estimates
These consolidated financial statements and the accompanying notes are prepared in accordance with accounting principles generally accepted in the United States of America and conform to Regulation S-X under the Securities Exchange Act of 1934, as amended. We believe we have made all necessary adjustments so that the consolidated financial statements are presented fairly and that all such adjustments are of a normal recurring nature. We eliminated all significant intercompany balances. In accordance with Article 6 of Regulation S-X of the Securities Act of 1933, as amended, and the Securities Exchange Act of 1934, as amended, we do not consolidate portfolio company investments, including those in which we have a controlling interest. Certain prior period information has been reclassified to conform to current year presentation. Further, in connection with the preparation of these Consolidated Financial Statements, we have evaluated subsequent events that occurred after the balance sheet date of December 31, 2011 through the date these financial statements were issued.
89
Table of Contents
Preparing financial statements requires us to make estimates and assumptions that affect the amounts reported on our Consolidated Financial Statements and accompanying notes. Although we believe the estimates and assumptions used in preparing these Consolidated Financial Statements and related notes are reasonable, actual results could differ materially.
NOTE 2—SIGNIFICANT ACCOUNTING POLICIES, CERTAIN RISKS AND UNCERTAINTIES AND NEW ACCOUNTING PRONOUNCEMENTS
Significant Accounting Policies
INCOME RECOGNITION
We follow the policies described below to recognize income on our Consolidated Statements of Operations:
| • | Interest Income—We accrue interest income if we expect that ultimately we will be able to collect it. Generally, when a loan becomes more than 90 days past due, or if we otherwise believe the customer is unable to service its debt and other obligations, we will place the loan on non-accrual status and will cease recognizing interest income on that loan until all principal and interest is current through payment or due to a restructuring such that the interest income is deemed to be collectible. However, we remain contractually entitled to this interest. We may make exceptions to this policy if the loan has sufficient collateral value and is in the process of collection. |
Paid-in-kind interest, or PIK, represents contractually deferred interest that typically is added to the loan balance. Generally, PIK interest is due at the end of the loan term. We generally accrue PIK interest when collection is expected and cease accruing PIK if there is insufficient value to support the accrual or we expect the customer is unable to pay all principal and interest due.
| • | Dividend Income—We accrue dividend income on equity investments with stated income, if we expect to collect the dividends. We record dividend income on common equity investments, and gains from realized distributions, when the dividend has been declared and is required to be paid. |
| • | Loan Origination Fees—We capitalize loan origination fees, then amortize these fees into interest income over the term of the loan using the effective interest rate method. In certain loan arrangements, we receive warrants or other equity interests from the borrower as additional origination fees. Typically, borrowers granting these interests are not traded publicly. We record the financial instruments received at fair value as determined in good faith by our board of directors. In certain cases, when we record a warrant or other equity instrument that results in a loan discount, we accrete the discount into income over the term of the loan. |
| • | Advisory Fees and Other Income—We charge our portfolio companies market based fees for services that we provide, including advisory and management services, equity structuring, prepayments, research, bank interest and other fees. We recognize advisory and management services fees when earned. We also recognize equity structuring fees as earned, which generally occurs when the investment transaction closes. Finally, we recognize prepayment fees upon receipt. |
PORTFOLIO INVESTMENTS
In accordance with the 1940 Act, we classify portfolio investments on our Consolidated Balance Sheets and our Consolidated Schedules of Investments into the following categories:
| • | Control Investments—Investments in which we control more than 25% of the voting securities or have greater than 50% representation on the board of directors; |
| • | Affiliate Investments—Investments in which we own between 5% and 25% of the voting securities and have less than 50% representation on the board of directors; and |
| • | Non-Affiliate Investments—Investments in which we own less than 5% of the voting securities. |
We carry our investments at fair value in accordance with the 1940 Act and Accounting Standard Codification Topic 820—Fair Value Measurements and Disclosures, or ASC 820. We base the fair value of portfolio investments on market prices when market quotations are readily available. As required by the 1940 Act, the fair value of all other investments is determined in good faith by our board of directors. Typically, there are no readily available market values for the majority of investments in our portfolio. As a result, the fair value of our entire investment portfolio was determined in good faith by our board of directors. We determine fair values using
90
Table of Contents
various valuation models that estimate the underlying value of the associated entity, taking into consideration our ownership share, as well as any discounts for transfer restrictions or other terms that impact the value. No single standard exists for determining fair value in good faith. Therefore, our board of directors applies judgment to specific facts and circumstances about each investment in our portfolio pursuant to our valuation policy and accounting principles generally accepted in the United States.
ASC 820 defines fair value, establishes a framework for measuring fair value and expands disclosures about assets and liabilities measured at fair value. ASC 820’s definition of fair value focuses on exit price in the principal, or most advantageous, market and prioritizes the use of market-based inputs over entity-specific inputs within a measurement of fair value.
Each quarter, we record the difference between the carrying value of our investments and the fair values determined by the board of directors as unrealized (depreciation) appreciation on investments on our Consolidated Statements of Operations. Upon the ultimate disposition of an asset in our portfolio, we reverse any previously recorded unrealized (depreciation) appreciation and realize a (loss) gain on investment that reflects the difference between the carrying cost of the investment and the net proceeds from the sale. See Note 4—Fair Value Measurement for additional information about the methodologies that the board of directors uses to determine the fair value of our investments, as well as our application of ASC 820.
CASH
Our Consolidated Balance Sheets and our Consolidated Statements of Cash Flows reflect the following categories of cash:
| • | Cash and cash equivalents—Represents unrestricted cash, including checking accounts, interest bearing deposits collateralized by marketable debt securities and highly liquid investments with original maturities of 90 days or less; |
| • | Cash, securitization accounts—Represents principal and interest held in designated bank accounts that we received on securitized loans or other reserved amounts associated with our securitization facilities. We must use the funds deposited in these accounts to pay interest, reduce borrowings or pay other specified obligations in accordance with associated securitization agreements. Interest collections in excess of the interest payments and other specified obligations are distributed back to us; and |
| • | Cash, restricted—Includes cash held in escrow that we received as part of an asset sale, cash held for regulatory purposes and cash that we have received that is earmarked for transfer into our cash, securitization accounts. |
BORROWING FACILITIES
As described more fully in Note 6—Borrowings, we borrow funds from various lenders through unsecured credit facilities, private placements, warehouse loan facilities and the SBA. In addition, we have bankruptcy-remote, special-purpose entities that issued debt collateralized by pools of loans that we transfer to the entity. We have recorded our obligation to repay all our borrowings at cost on our Consolidated Balance Sheets. We account for loans transferred to our bankruptcy remote, special-purpose entities for use in securitization transactions in accordance with ASC Topic 860—Transfers and Servicing, or ASC 860.
Debt issuance costs represent fees and other direct incremental costs incurred in connection with our borrowings. We amortize these costs ratably over the contractual term of the borrowing using the effective interest method and include this amortization in interest expense on our Consolidated Statements of Operations.
From time-to-time, we may repurchase certain debt instruments issued by one of our bankruptcy-remote special-purpose entities from third parties at a negotiated price that may be different than the principal amount of the debt. In accordance with ASC 470—Debt, we treat these repurchases as if the debt were extinguished and report the difference between the reacquisition price and the net carrying amount of the extinguished debt as a gain on extinguishment of debt on our Consolidated Statements of Operations.
SHARE-BASED COMPENSATION
In accordance with ASC Topic 718—Compensation—Stock Compensation, or ASC 718, we recognize compensation cost related to share-based awards for which forfeiture provisions are expected to lapse over the requisite service period.
91
Table of Contents
INCOME TAXES
We currently qualify as a RIC for federal income tax purposes, which generally allows us to avoid paying corporate income taxes on any income or gains that we distribute to our stockholders. Generally, we intend to distribute sufficient dividends to eliminate taxable income and may distribute more than the taxable income which would be considered a return of capital. We are subject to a 4% excise tax to the extent that we do not distribute on an actual or on deemed basis: (i) 98.0% of our current year ordinary income; and (ii) 98.2% of our current year net capital gain income.
We have certain wholly owned Taxable Subsidiaries, each of which holds one or more portfolio investments listed on our Consolidated Schedule of Investments. The purpose of these Taxable Subsidiaries is to permit us to hold portfolio companies organized as LLCs or other forms of pass-through entities and still satisfy the RIC tax requirement that at least 90% of our gross revenue for income tax purposes must consist of investment income. Absent the Taxable Subsidiaries, a portion of the gross income of any LLC or other pass-through entity portfolio investment would flow through directly to us for the 90% test. To the extent that such income did not consist of investment income, it could jeopardize our ability to qualify as a RIC and, therefore, cause us to incur significant federal income taxes. The income of the LLCs or other pass-through entities owned by Taxable Subsidiaries is taxed to the Taxable Subsidiaries and does not flow through to us, thereby helping us preserve our RIC status and resultant tax advantages. We do not consolidate the Taxable Subsidiaries for income tax purposes and they may generate income tax expense because of the Taxable Subsidiaries’ ownership of the portfolio companies. We reflect any such income tax expense on our Consolidated Statement of Operations. For additional information about our Taxable Subsidiaries and the determination of our income taxes, see Note 11—Income Taxes.
Recent Accounting Pronouncements
In April 2011, Financial Accounting Standards Board, or FASB, issued Accounting Standards Update 2011-02—A Creditor’s Determination of Whether a Restructuring is a Troubled Debt Restructuring, or ASU 2011-02. This standard amends previous guidance provided in Accounting Standards Codification 310-40—Receivables—Troubled Debt Restructurings by Creditors. ASU 2011-02 provides additional guidance and criteria on how companies should determine whether a restructuring or refinancing of an existing financial receivable represents a troubled debt restructuring. Companies must assess whether the restructuring or refinancing of an existing financial receivable is a troubled debt restructuring in order to determine how to account for the remaining unamortized portion of certain fees, such as origination fees, associated with the original debt investment. ASU 2011-02 is effective for the first interim period beginning on or after June 15, 2011. We adopted this standard beginning with the quarter ended December 31, 2011. Our adoption of this update did not have a material impact on our financial position or results of operations.
In May 2011, the FASB issued Accounting Standards Update No. 2011-04—Fair Value Measurement: Amendments to Achieve Common Fair Value Measurement and Disclosure Requirements in U.S. GAAP and IFRSs, or ASU 2011-04. ASU 2011-04 clarifies the application of existing fair value measurement and disclosure requirements, changes the application of some requirements for measuring fair value and requires additional disclosure for fair value measurements. The disclosure requirements are expanded to include for fair value measurements categorized in Level 3 of the fair value hierarchy: 1) a quantitative disclosure of the unobservable inputs and assumptions used in the measurement; 2) a description of the valuation processes in place; and 3) a narrative description of the sensitivity of the fair value to changes in unobservable inputs and interrelationships between those inputs. ASU 2011-04 is effective for interim and annual periods beginning after December 15, 2011, for public entities. We will adopt this standard beginning on January 1, 2012. We do not anticipate that our implementation of this standard will have a material impact on our process for measuring fair values, our financial position or our results of operations.
92
Table of Contents
NOTE 3—INVESTMENT PORTFOLIO
The following table summarizes the composition of our investment portfolio at cost and fair value:
| COST BASIS | FAIR VALUE BASIS | |||||||||||||||||||||||||||||||||||||||||||
| December 31, 2011 | December 31, 2010 | December 31, 2011 | December 31, 2010 | |||||||||||||||||||||||||||||||||||||||||
| (dollars in thousands) |
Investments at Cost |
% of Total Portfolio |
Investments at Cost |
% of Total Portfolio |
Investments at Fair Value |
% of Total Portfolio |
Investments at Fair Value |
% of Total Portfolio |
||||||||||||||||||||||||||||||||||||
| Debt Investments |
||||||||||||||||||||||||||||||||||||||||||||
| Senior secured debt |
$ | 551,402 | 54.2 | % | $ | 597,046 | 47.9 | % | $ | 492,488 | 66.4 | % | $ | 555,667 | 55.0 | % | ||||||||||||||||||||||||||||
| Subordinated debt |
||||||||||||||||||||||||||||||||||||||||||||
| Secured |
134,721 | 13.2 | 266,333 | 21.4 | 124,289 | 16.8 | 190,309 | 18.9 | ||||||||||||||||||||||||||||||||||||
| Unsecured |
12,009 | 1.2 | 15,067 | 1.2 | 12,203 | 1.7 | 12,321 | 1.2 | ||||||||||||||||||||||||||||||||||||
|
|
|
|
|
|
|
|
|
|
|
|
|
|
|
|
|
|||||||||||||||||||||||||||||
| Total debt investments |
698,132 | 68.6 | 878,446 | 70.5 | 628,980 | 84.9 | 758,297 | 75.1 | ||||||||||||||||||||||||||||||||||||
|
|
|
|
|
|
|
|
|
|
|
|
|
|
|
|
|
|||||||||||||||||||||||||||||
| Equity investments |
||||||||||||||||||||||||||||||||||||||||||||
| Preferred |
297,283 | 29.3 | 345,960 | 27.8 | 89,931 | 12.1 | 218,690 | 21.7 | ||||||||||||||||||||||||||||||||||||
| Common/common equivalents |
21,803 | 2.1 | 21,267 | 1.7 | 22,255 | 3.0 | 32,718 | 3.2 | ||||||||||||||||||||||||||||||||||||
|
|
|
|
|
|
|
|
|
|
|
|
|
|
|
|
|
|||||||||||||||||||||||||||||
| Total equity investments |
319,086 | 31.4 | 367,227 | 29.5 | 112,186 | 15.1 | 251,408 | 24.9 | ||||||||||||||||||||||||||||||||||||
|
|
|
|
|
|
|
|
|
|
|
|
|
|
|
|
|
|||||||||||||||||||||||||||||
| Total investments |
$ | 1,017,218 | 100.0 | % | $ | 1,245,673 | 100 | % | $ | 741,166 | 100.0 | % | $ | 1,009,705 | 100.0 | % | ||||||||||||||||||||||||||||
|
|
|
|
|
|
|
|
|
|
|
|
|
|
|
|
|
|||||||||||||||||||||||||||||
Our debt instruments bear contractual interest rates ranging from 2.5% to 17.5%, a portion of which may be in the form of paid in kind interest. As of December 31, 2011, approximately 88.2% of the fair value of our loan portfolio had variable interest rates, based on a LIBOR benchmark or the prime rate, and 11.8% of the fair value of our loan portfolio had fixed interest rates. As of December 31, 2011, approximately 79.2% of our loan portfolio, at fair value, had LIBOR floors between 1.0% and 3.0% on a LIBOR-based index and prime floors between 1.75% and 6.0%. At origination, our loans generally have four- to eight-year stated maturities. Borrowers typically pay an origination fee based on a percent of the total commitment and a fee on undrawn commitments.
When one of our loans becomes more than 90 days past due, or if we otherwise do not expect the customer to be able to service its debt and other obligations, we will, as a general matter, place the loan on non-accrual status and generally will cease recognizing interest income on that loan until all principal and interest has been brought current through payment or due to a restructuring such that the interest income is deemed to be collectible. However, we may make exceptions to this policy if the loan has sufficient collateral value and is in the process of collection. If the fair value of a loan is below cost, we may cease recognizing paid-in-kind, or PIK, interest and/or the accretion of a discount on the debt investment until such time that the fair value equals or exceeds cost.
The following table summarizes the cost and fair value of loans more than 90 days past due and loans on non-accrual status:
| COST BASIS | FAIR VALUE BASIS | |||||||||||||||||||||||||||||||||||||||||||
| December 31, 2011 | December 31, 2010 | December 31, 2011 | December 31, 2010 | |||||||||||||||||||||||||||||||||||||||||
| (dollars in thousands) |
Investments at Cost |
% of Loan Portfolio |
Investments at Cost |
% of Loan Portfolio |
Investments at Fair Value |
% of Loan Portfolio |
Investments at Fair Value |
% of Loan Portfolio |
||||||||||||||||||||||||||||||||||||
| Loans greater than 90 days past due |
||||||||||||||||||||||||||||||||||||||||||||
| On non-accrual status(a) |
$ | 13,963 | 2.00 | % | $ | 10,388 | 1.18 | % | $ | 9,615 | 1.53 | % | $ | 6,157 | 0.81 | % | ||||||||||||||||||||||||||||
| Not on non-accrual status |
— | — | — | — | — | — | — | — | ||||||||||||||||||||||||||||||||||||
|
|
|
|
|
|
|
|
|
|
|
|
|
|
|
|
|
|||||||||||||||||||||||||||||
| Total loans greater than 90 days past due(a) |
$ | 13,963 | 2.00 | % | $ | 10,388 | 1.18 | % | $ | 9,615 | 1.53 | % | $ | 6,157 | 0.81 | % | ||||||||||||||||||||||||||||
|
|
|
|
|
|
|
|
|
|
|
|
|
|
|
|
|
|||||||||||||||||||||||||||||
| Loans on non-accrual status(a) |
||||||||||||||||||||||||||||||||||||||||||||
| 0 to 90 days past due |
$ | 69,241 | 9.92 | % | $ | 128,989 | 14.69 | % | $ | 9,704 | 1.54 | % | $ | 19,835 | 2.62 | % | ||||||||||||||||||||||||||||
| Greater than 90 days past due |
13,963 | 2.00 | 10,388 | 1.18 | 9,615 | 1.53 | 6,157 | 0.81 | ||||||||||||||||||||||||||||||||||||
|
|
|
|
|
|
|
|
|
|
|
|
|
|
|
|
|
|||||||||||||||||||||||||||||
| Total loans on non-accrual status(a) |
$ | 83,204 | 11.92 | % | $ | 139,377 | 15.87 | % | $ | 19,319 | 3.07 | % | $ | 25,992 | 3.43 | % | ||||||||||||||||||||||||||||
|
|
|
|
|
|
|
|
|
|
|
|
|
|
|
|
|
|||||||||||||||||||||||||||||
| (a) | The year-over-year change in total loans on non-accrual status primarily reflects our sales of, or repayments from, Active Brands International, Inc., Vox Communications Group Holdings, LLC, PremierGarage Holdings, LLC and Intran Media, LLC, as well as the write-off of our investment in Total Sleep Holdings, Inc. during the year ended December 31, 2011. Our investments in the debt issued by these portfolio companies were on non-accrual status as of December 31, 2010. Upon the sales and write-off of these investments, we reversed the previously unrealized depreciation and recorded realized losses. |
93
Table of Contents
The following table summarizes our investment portfolio by industry at fair value:
| December 31, 2011 | December 31, 2010 | |||||||||||||||
| (dollars in thousands) |
Investments at Fair Value |
Percent of Total Portfolio |
Investments at Fair Value |
Percent of Total Portfolio |
||||||||||||
| Healthcare |
$ | 84,660 | 11.4 | % | $ | 76,358 | 7.6 | % | ||||||||
| Business services |
78,468 | 10.6 | 87,897 | 8.7 | ||||||||||||
| Manufacturing |
77,849 | 10.5 | 54,178 | 5.4 | ||||||||||||
| Education |
69,124 | 9.3 | 43,704 | 4.3 | ||||||||||||
| Cable |
43,122 | 5.8 | 92,467 | 9.2 | ||||||||||||
| Communications |
34,507 | 4.7 | 150,907 | 14.9 | ||||||||||||
| Logistics |
33,684 | 4.5 | 28,036 | 2.8 | ||||||||||||
| Electronics |
31,966 | 4.3 | 30,409 | 3.0 | ||||||||||||
| Publishing |
31,319 | 4.2 | 22,543 | 2.2 | ||||||||||||
| Food services |
28,842 | 3.9 | 73,407 | 7.3 | ||||||||||||
| Broadcasting |
28,185 | 3.8 | 53,996 | 5.3 | ||||||||||||
| Insurance |
24,987 | 3.4 | 24,993 | 2.5 | ||||||||||||
| Technology |
24,690 | 3.3 | 35,327 | 3.5 | ||||||||||||
| Plastic products |
21,784 | 2.9 | 33,633 | 3.3 | ||||||||||||
| Information services |
21,672 | 2.9 | 17,940 | 1.8 | ||||||||||||
| Repair services |
19,839 | 2.7 | — | — | ||||||||||||
| Auto parts |
19,778 | 2.7 | 16,959 | 1.7 | ||||||||||||
| Restaurants |
18,578 | 2.5 | 11,150 | 1.1 | ||||||||||||
| Home furnishings |
12,355 | 1.7 | 17,151 | 1.7 | ||||||||||||
| Agriculture |
9,464 | 1.3 | 8,418 | 0.8 | ||||||||||||
| Cosmetics |
8,521 | 1.2 | — | — | ||||||||||||
| Entertainment |
7,539 | 1.0 | 11,782 | 1.2 | ||||||||||||
| Diversified financial services |
2,207 | 0.3 | 12,489 | 1.2 | ||||||||||||
| Leisure activities |
— | — | 32,216 | 3.2 | ||||||||||||
| Sporting goods |
— | — | 42,886 | 4.2 | ||||||||||||
|
Other(a) |
8,026 | 1.1 | 30,859 | 3.1 | ||||||||||||
|
|
|
|
|
|
|
|
|
|||||||||
| Total |
$ | 741,166 | 100.0 | % | $ | 1,009,705 | 100.0 | % | ||||||||
|
|
|
|
|
|
|
|
|
|||||||||
| (a) | No individual industry within this category exceeds 1%. |
The following table summarizes our interest rate swaps with SunTrust Bank, as the counterparty for which we paid fixed interest rates and received floating interest rates as of December 31, 2010:
| (dollars in thousands) |
Pay Fixed Interest Rate |
Receive Floating Interest Rate |
As of December 31, 2010 | |||||||||||||||||||||
|
Date |
Notional | Cost | Fair Value |
|||||||||||||||||||||
| Entered |
Expired | |||||||||||||||||||||||
| 03/09 |
08/11 | 13.0 | % | 11.0 | % | $ | 12,500 | $ | — | $ | (183 | ) | ||||||||||||
| 03/09 |
08/11 | 9.0 | % | 7.0 | % | 8,681 | — | (127 | ) | |||||||||||||||
|
|
|
|
|
|
|
|||||||||||||||||||
| Total |
$ | 21,181 | $ | — | $ | (310 | ) | |||||||||||||||||
|
|
|
|
|
|
|
|||||||||||||||||||
These interest rate swaps expired in August 2011 and as of December 31, 2011, we had no unexpired swaps. We included the fair value of these interest rate swaps in other liabilities on our Consolidated Balance Sheets and reported changes in the fair value of these interest rate swaps in net unrealized (depreciation) appreciation on investments on our Consolidated Statements of Operations.
The following table summarizes the realized and unrealized gains and losses that we recorded on our interest rate swaps for the year ended December 31, 2011 and 2010:
| (in thousands) |
Realized Loss |
Unrealized Appreciation (Depreciation) |
Reversal of Unrealized Depreciation |
Net Gain (Loss) |
||||||||||||
| Years ended December 31: |
||||||||||||||||
| 2011 |
$ | (229 | ) | $ | 81 | $ | 229 | $ | 81 | |||||||
| 2010 |
(1,116 | ) | (372 | ) | 1,116 | (372 | ) | |||||||||
94
Table of Contents
NOTE 4—FAIR VALUE MEASUREMENT
We account for our investments in portfolio companies under ASC 820. ASC 820 defines fair value, establishes a framework for measuring fair value and expands disclosures about assets and liabilities measured at fair value. ASC 820 defines “fair value” as the price that would be received to sell an asset or paid to transfer a liability in an orderly transaction between market participants at the measurement date. This fair value definition focuses on exit price in the principal, or most advantageous, market and prioritizes, within a measurement of fair value, the use of market-based inputs over entity-specific inputs.
FAIR VALUE HIERARCHY
ASC 820 establishes the following three-level hierarchy, based upon the transparency of inputs to the fair value measurement of an asset or liability as of the measurement date:
| ASC 820 Fair Value |
Inputs to Fair Value Methodology | |
| Level 1 | Quoted prices in active markets for identical assets or liabilities | |
| Level 2 | Quoted prices for similar assets or liabilities; quoted markets that are not active; or other inputs that are observable or can be corroborated by observable market data for substantially the full term of the financial instrument; inputs other than quoted prices that are observable for the asset or liability; or inputs that are derived principally from, or corroborated by, observable market information | |
| Level 3 | Pricing models, discounted cash flow methodologies or similar techniques and at least one significant model assumption is unobservable or when the estimation of fair value requires significant management judgment | |
We categorize a financial instrument in the fair value hierarchy based on the lowest level of input that is significant to its fair value measurement. In the event that transfers between these levels were to occur in the future, we would recognize those transfers as of the ending balance sheet date, based on changes in the use of observable and unobservable inputs utilized to perform the valuation for the period.
Our investment portfolio is not composed of homogeneous debt and equity securities that can be valued with a small number of inputs. Instead, the majority of our investment portfolio is composed of complex debt and equity securities with unique contract terms and conditions. As such, our valuation of each investment in our portfolio is unique and complex, often factoring in numerous unique inputs, including the historical and forecasted financial and operational performance of the portfolio company, projected cash flows, market multiples, comparable market transactions, the priority of our securities compared with those of other investors, credit risk, interest rates, independent valuations and reviews and other inputs too numerous to list quantitatively herein.
95
Table of Contents
ASSETS AND LIABILITIES MEASURED AT FAIR VALUE ON A RECURRING BASIS
The following table presents the assets and liabilities that we report at fair value on our Consolidated Balance Sheets by ASC 820 hierarchy:
| As of December 31, 2011 | ||||||||||||
| (in thousands) |
Internal Models with Significant | Total Fair
Value Reported in Consolidated Balance Sheet |
||||||||||
| Observable
Market Parameters (Level 2) |
Unobservable Market Parameters (Level 3) |
|||||||||||
| ASSETS |
||||||||||||
| Non-affiliate investments |
||||||||||||
| Senior secured debt |
$ | 108,930 | $ | 297,680 | $ | 406,610 | ||||||
| Subordinated secured debt |
— | 100,967 | 100,967 | |||||||||
| Unsecured subordinated debt |
— | 12,203 | 12,203 | |||||||||
| Preferred equity |
2,207 | 28,978 | 31,185 | |||||||||
| Common/common equivalents |
— | 19,168 | 19,168 | |||||||||
|
|
|
|
|
|
|
|||||||
| Total non-affiliate investments |
111,137 | 458,996 | 570,133 | |||||||||
|
|
|
|
|
|
|
|||||||
| Affiliate investments |
||||||||||||
| Senior secured debt |
— | 23,263 | 23,263 | |||||||||
| Subordinated secured debt |
— | 12,967 | 12,967 | |||||||||
| Preferred equity |
— | 12,453 | 12,453 | |||||||||
| Common/common equivalents |
— | 3,087 | 3,087 | |||||||||
|
|
|
|
|
|
|
|||||||
| Total affiliate investments |
— | 51,770 | 51,770 | |||||||||
|
|
|
|
|
|
|
|||||||
| Control investments |
||||||||||||
| Senior secured debt |
— | 62,615 | 62,615 | |||||||||
| Subordinated secured debt |
— | 10,355 | 10,355 | |||||||||
| Preferred equity |
— | 46,293 | 46,293 | |||||||||
|
|
|
|
|
|
|
|||||||
| Total control investments |
— | 119,263 | 119,263 | |||||||||
|
|
|
|
|
|
|
|||||||
| Total assets at fair value |
$ | 111,137 | $ | 630,029 | $ | 741,166 | ||||||
|
|
|
|
|
|
|
|||||||
As of December 31, 2011, we had no investments that had quoted market prices in active markets, which we would categorize as Level 1 investments under ASC 820.
VALUATION METHODOLOGIES
As required by the 1940 Act, we classify our investments by level of control. Control investments include both majority-owned control investments and non-majority owned control investments. A majority-owned control investment represents a security in which we own more than 50% of the voting interest of the portfolio company and generally control its board of directors. A non-majority owned control investment represents a security in which we own 25% to 50% of the portfolio company’s equity. Non-control investments represent both affiliate and non-affiliate securities for which we do not have a controlling interest. Affiliate investments represent securities in which we own 5% to 25% of the portfolio company’s equity. Non-affiliate investments represent securities in which we own less than 5% of the portfolio company’s equity.
| • | Majority-Owned Control Investments—Majority-owned control investments comprise 14.8% of our investment portfolio as of December 31, 2011. Market quotations are not readily available for these investments; therefore, we use a combination of market and income approaches to determine their fair value. Typically, private companies are bought and sold based on multiples of EBITDA, cash flows, net income, revenues or, in limited cases, book value. Generally, we apply multiples that we observe for other comparable companies to relevant financial data for the portfolio company. Also, in a limited number of cases, we use income approaches to determine the fair value of these securities, based on our projections of the discounted future free cash flows that the portfolio company will likely generate, as well as industry derived capital costs. Our valuation approaches for majority-owned investments estimate the value were we to sell or exit the investment. These valuation approaches assume the highest and best use of the investment by market participants and consider the value of our ability to control the portfolio company’s capital structure and the timing of a potential exit. |
| • | Non-Majority-Owned Control Investments—Non-majority-owned control investments comprise 1.3% of our investment portfolio as of December 31, 2011. For our non-majority-owned control equity investments, we use the same market and income valuation approaches used to value our majority-owned control investments. For non-majority owned control debt investments, we estimate fair value using the market-yield approach based on the expected future cash flows discounted at the loans’ effective interest rates, based on our estimate of current market rates. We may adjust discounted cash flow calculations to reflect other market conditions or the perceived credit risk of the borrower. |
| • | Non-Control Investments—Non-control investments comprise 83.9% of our investment portfolio as of December 31, 2011. Quoted prices are not available for 82.1% of our non-control investments as of |
96
Table of Contents
| December 31, 2011. For our non-control equity investments, we use the same market and income approaches used to value our control investments. For non-control debt investments, we estimate fair value using a market-yield approach based on the expected future cash flows discounted at the loans’ effective interest rates, based on our estimate of current market rates. We may adjust discounted cash flow calculations to reflect other market conditions or the perceived credit risk of the borrower. |
| • | Thinly Traded and Over-the-Counter Securities—Generally, we value securities that are traded in the over-the-counter market or on a stock exchange at the average of the prevailing bid and ask prices on the date of the relevant period end. However, we may apply a discount to the market value of restricted or thinly traded public securities to reflect the impact that these restrictions have on the value of these securities. We review factors including the trading volume, total securities outstanding and our percentage ownership of securities to determine whether the trading levels are active (Level 1) or inactive (Level 2). As of December 31, 2011, these securities represented 15.0% of our investment portfolio. We utilize independent pricing services with certain of our fair value estimates. The majority of our level 2 investments are senior debt investments that are secured and collateralized. To corroborate “bid/ask” quotes from independent pricing services we perform a market-yield approach to validate prices obtained or obtain other evidence. |
Our valuation analyses incorporate the impact that key events could have on the securities’ values, including public and private mergers and acquisitions, purchase transactions, public offerings, letters of intent and subsequent debt or equity sales. Our valuation analyses also include key external data, such as market changes and industry valuation benchmarks. We also use independent valuation firms to provide additional data points for our quarterly valuation analyses. Our general practice is to obtain an independent valuation or review of valuation at least once per year for each portfolio investment that had a fair value in excess of $5.0 million, unless the fair value has otherwise been derived through a sale of some or all of our investment in the portfolio company or is a new investment made within the last twelve months. As set forth in more detail in the following table, in total, either we obtained a valuation or review from an independent firm, considered new investments made or used market quotes in the preceding twelve month period for 99.6% of the fair value of our investment portfolio as of December 31, 2011.
| December 31, 2011 | ||||||||||||||||||||||||
| Investments at Fair Value | Percent of | |||||||||||||||||||||||
| (dollars in thousands) |
Debt | Equity | Total | Debt Portfolio |
Equity Portfolio |
Total Portfolio |
||||||||||||||||||
| Independent valuations/reviews, recent transactions or market quotes |
||||||||||||||||||||||||
| Independent valuation/review prepared |
||||||||||||||||||||||||
| Fourth quarter 2011 |
$ | 130,533 | $ | 87,036 | $ | 217,569 | 20.7 | % | 77.6 | % | 29.4 | % | ||||||||||||
| Third quarter 2011 |
181,025 | 9,684 | 190,709 | 28.8 | 8.6 | 25.7 | ||||||||||||||||||
| Second quarter 2011 |
38,355 | 523 | 38,878 | 6.1 | 0.5 | 5.3 | ||||||||||||||||||
| First quarter 2011 |
47,620 | 109 | 47,729 | 7.6 | 0.1 | 6.4 | ||||||||||||||||||
|
|
|
|
|
|
|
|
|
|
|
|
|
|||||||||||||
| Total independent valuations/reviews |
397,533 | 97,352 | 494,885 | 63.2 | 86.8 | 66.8 | ||||||||||||||||||
|
|
|
|
|
|
|
|
|
|
|
|
|
|||||||||||||
| Fair value from |
||||||||||||||||||||||||
| Market quotes (Level 2) |
101,939 | 2,207 | 104,146 | 16.2 | 2.0 | 14.1 | ||||||||||||||||||
| Pending sales of investments or letters of intent |
26,536 | 8,558 | 35,094 | 4.2 | 7.6 | 4.7 | ||||||||||||||||||
|
|
|
|
|
|
|
|
|
|
|
|
|
|||||||||||||
| Fair value from market quotes and pending sales |
128,475 | 10,765 | 139,240 | 20.4 | 9.6 | 18.8 | ||||||||||||||||||
| New investments made during the 12 months ended December 31, 2011 |
102,413 | 1,285 | 103,698 | 16.3 | 1.1 | 14.0 | ||||||||||||||||||
|
|
|
|
|
|
|
|
|
|
|
|
|
|||||||||||||
| Total portfolio evaluated |
628,421 | 109,402 | 737,823 | 99.9 | 97.5 | 99.6 | ||||||||||||||||||
| Not evaluated during the 12 months ended December 31, 2011 |
559 | 2,784 | 3,343 | 0.1 | 2.5 | 0.4 | ||||||||||||||||||
|
|
|
|
|
|
|
|
|
|
|
|
|
|||||||||||||
| Total investment portfolio |
$ | 628,980 | $ | 112,186 | $ | 741,166 | 100.0 | % | 100.0 | % | 100.0 | % | ||||||||||||
|
|
|
|
|
|
|
|
|
|
|
|
|
|||||||||||||
The majority of the valuations performed by the independent valuation firms utilize proprietary models and inputs. We have used, and intend to continue to use, independent valuation firms to provide additional support for our internal analyses. Our board of directors considers our valuations, as well as the independent valuations and reviews, in its determination of the fair value of our investments. The fair value of our interest rate swaps was based on a binding broker quote, which was based on the estimated net present value of the future cash flows using a forward interest rate yield-curve in effect as of the measurement period.
Due to the uncertainty inherent in the valuation process, such estimates of fair value may differ significantly from the values that would have been used had a ready market for the securities existed, and such differences could be material. In addition, changes in the market environment and other events that may occur over the life of the investments may cause the gains or losses ultimately realized on these investments to differ from the valuations currently assigned.
97
Table of Contents
CHANGES IN LEVEL 3 FAIR VALUE MEASUREMENTS
We classify securities in the Level 3 valuation hierarchy based on the significance of the unobservable factors to the overall fair value measurement. Our fair value approach for Level 3 securities primarily uses unobservable inputs, but may also include observable, actively quoted components derived from external sources. Accordingly, the gains and losses in the table below include fair value changes due, in part, to observable factors. Additionally, we transfer investments in and out of Level 1, 2 and 3 securities as of the ending balance sheet date, based on changes in the use of observable and unobservable inputs utilized to perform the valuation for the period. During 2011, there were no transfers in or out of Level 1, 2 or 3.
98
Table of Contents
The following table provides a reconciliation of fair value changes during the year ended December 31, 2011 for all investments for which we determine fair value using unobservable (Level 3) factors.
| (in thousands) |
Fair value measurements using unobservable inputs (Level 3) | |||||||||||||||
| Non-affiliate Investments |
Affiliate Investments |
Control Investments |
Total | |||||||||||||
| Fair value December 31, 2010 |
||||||||||||||||
| Senior secured debt |
$ | 325,874 | $ | 24,207 | $ | 75,714 | $ | 425,795 | ||||||||
| Subordinated secured debt |
121,743 | 12,348 | 56,218 | 190,309 | ||||||||||||
| Unsecured subordinated debt |
12,321 | — | — | 12,321 | ||||||||||||
| Preferred equity |
24,741 | 13,197 | 178,357 | 216,295 | ||||||||||||
| Common/common equivalents equity |
29,170 | 3,548 | — | 32,718 | ||||||||||||
|
|
|
|
|
|
|
|
|
|||||||||
| Total fair value December 31, 2010 |
513,849 | 53,300 | 310,289 | 877,438 | ||||||||||||
|
|
|
|
|
|
|
|
|
|||||||||
| Realized/unrealized gain (loss) |
||||||||||||||||
| Senior secured debt |
(2,049 | ) | — | (60,823 | ) | (62,872 | ) | |||||||||
| Subordinated secured debt |
2,717 | (413 | ) | 33,727 | 36,031 | |||||||||||
| Unsecured subordinated debt |
194 | — | (87 | ) | 107 | |||||||||||
| Preferred equity |
3,830 | 1,345 | (95,853 | ) | (90,678 | ) | ||||||||||
| Common/common equivalents equity |
(8,465 | ) | (300 | ) | 4 | (8,761 | ) | |||||||||
|
|
|
|
|
|
|
|
|
|||||||||
| Total realized/unrealized gain (loss) |
(3,773 | ) | 632 | (123,032 | ) | (126,173 | ) | |||||||||
|
|
|
|
|
|
|
|
|
|||||||||
| Purchases |
||||||||||||||||
| Senior secured debt |
— | — | 11,863 | 11,863 | ||||||||||||
| Preferred equity |
2,000 | — | 4,300 | 6,300 | ||||||||||||
| Common/common equivalents equity |
123 | — | — | 123 | ||||||||||||
|
|
|
|
|
|
|
|
|
|||||||||
| Total purchases |
2,123 | — | 16,163 | 18,286 | ||||||||||||
|
|
|
|
|
|
|
|
|
|||||||||
| Issuances |
||||||||||||||||
| Senior secured debt |
102,634 | 4,002 | 44,206 | 150,842 | ||||||||||||
| Subordinated secured debt |
30,628 | 1,032 | 1,224 | 32,884 | ||||||||||||
| Unsecured subordinated debt |
1,945 | — | — | 1,945 | ||||||||||||
| Preferred equity |
1,899 | 1,186 | 13,354 | 16,439 | ||||||||||||
| Common/common equivalents equity |
533 | 67 | — | 600 | ||||||||||||
|
|
|
|
|
|
|
|
|
|||||||||
| Total issuances |
137,639 | 6,287 | 58,784 | 202,710 | ||||||||||||
|
|
|
|
|
|
|
|
|
|||||||||
| Settlements |
||||||||||||||||
| Senior secured debt |
(118,573 | ) | (4,946 | ) | (8,345 | ) | (131,864 | ) | ||||||||
| Subordinated secured debt |
(54,121 | ) | — | (80,814 | ) | (134,935 | ) | |||||||||
| Unsecured subordinated debt |
(2,257 | ) | — | 87 | (2,170 | ) | ||||||||||
| Preferred equity |
(3,209 | ) | (3,275 | ) | (12,171 | ) | (18,655 | ) | ||||||||
| Common/common equivalents equity |
(249 | ) | (228 | ) | (4 | ) | (481 | ) | ||||||||
|
|
|
|
|
|
|
|
|
|||||||||
| Total settlements |
(178,409 | ) | (8,449 | ) | (101,247 | ) | (288,105 | ) | ||||||||
|
|
|
|
|
|
|
|
|
|||||||||
| Sales |
||||||||||||||||
| Senior secured debt |
(10,206 | ) | — | — | (10,206 | ) | ||||||||||
| Preferred equity |
(283 | ) | — | (41,694 | ) | (41,977 | ) | |||||||||
| Common/common equivalents equity |
(1,944 | ) | — | — | (1,944 | ) | ||||||||||
|
|
|
|
|
|
|
|
|
|||||||||
| Total sales |
(12,433 | ) | — | (41,694 | ) | (54,127 | ) | |||||||||
|
|
|
|
|
|
|
|
|
|||||||||
| Fair value as of December 31, 2011 |
||||||||||||||||
| Senior secured debt |
297,680 | 23,263 | 62,615 | 383,558 | ||||||||||||
| Subordinated secured debt |
100,967 | 12,967 | 10,355 | 124,289 | ||||||||||||
| Unsecured subordinated debt |
12,203 | — | — | 12,203 | ||||||||||||
| Preferred equity |
28,978 | 12,453 | 46,293 | 87,724 | ||||||||||||
| Common/common equivalents equity |
19,168 | 3,087 | — | 22,255 | ||||||||||||
|
|
|
|
|
|
|
|
|
|||||||||
| Total fair value as of December 31, 2011 |
$ | 458,996 | $ | 51,770 | $ | 119,263 | $ | 630,029 | ||||||||
|
|
|
|
|
|
|
|
|
|||||||||
99
Table of Contents
The following table provides a reconciliation of fair value changes during the year ended December 31, 2010 for all investments for which we determine fair value using unobservable (Level 3) factors.
| (in thousands) |
Fair value measurements using unobservable inputs (Level 3) | |||||||||||||||
| Non-affiliate Investments |
Affiliate Investments |
Control Investments |
Total | |||||||||||||
| Fair value December 31, 2009 |
||||||||||||||||
| Senior secured debt |
$ | 273,319 | $ | 21,789 | $ | 80,995 | $ | 376,103 | ||||||||
| Subordinated secured debt |
183,684 | 11,511 | 80,202 | 275,397 | ||||||||||||
| Unsecured subordinated debt |
2,179 | — | 28,439 | 30,618 | ||||||||||||
| Preferred equity |
26,587 | 9,242 | 220,320 | 256,149 | ||||||||||||
| Common/common equivalents equity |
40,885 | 1,846 | 28 | 42,759 | ||||||||||||
|
|
|
|
|
|
|
|
|
|||||||||
| Total fair value December 31, 2009 |
526,654 | 44,388 | 409,984 | 981,026 | ||||||||||||
|
|
|
|
|
|
|
|
|
|||||||||
| Realized/unrealized gain (loss) |
||||||||||||||||
| Senior secured debt |
(15,442 | ) | 297 | (5,556 | ) | (20,701 | ) | |||||||||
| Subordinated secured debt |
3,082 | 207 | (33,320 | ) | (30,031 | ) | ||||||||||
| Unsecured subordinated debt |
2 | — | — | 2 | ||||||||||||
| Preferred equity |
4,149 | 2,173 | (28,174 | ) | (21,852 | ) | ||||||||||
| Common/common equivalents equity |
13,215 | 1,359 | 27 | 14,601 | ||||||||||||
|
|
|
|
|
|
|
|
|
|||||||||
| Total realized/unrealized gain (loss) |
5,006 | 4,036 | (67,023 | ) | (57,981 | ) | ||||||||||
|
|
|
|
|
|
|
|
|
|||||||||
| Purchases |
||||||||||||||||
| Preferred equity |
— | — | 100 | 100 | ||||||||||||
|
|
|
|
|
|
|
|
|
|||||||||
| Total purchases |
— | — | 100 | 100 | ||||||||||||
|
|
|
|
|
|
|
|
|
|||||||||
| Issuances |
||||||||||||||||
| Senior secured debt |
126,881 | 15,870 | 2,157 | 144,908 | ||||||||||||
| Subordinated secured debt |
20,457 | 7,507 | 9,448 | 37,412 | ||||||||||||
| Unsecured subordinated debt |
10,140 | — | 3,179 | 13,319 | ||||||||||||
| Preferred equity |
2,243 | 3,295 | 3,640 | 9,178 | ||||||||||||
| Common/common equivalents equity |
1 | 716 | — | 717 | ||||||||||||
|
|
|
|
|
|
|
|
|
|||||||||
| Total issuances |
159,722 | 27,388 | 18,424 | 205,534 | ||||||||||||
|
|
|
|
|
|
|
|
|
|||||||||
| Settlements |
||||||||||||||||
| Senior secured debt |
(58,834 | ) | (13,749 | ) | (1,882 | ) | (74,465 | ) | ||||||||
| Subordinated secured debt |
(85,480 | ) | (6,877 | ) | (112 | ) | (92,469 | ) | ||||||||
| Preferred equity |
(511 | ) | (1,513 | ) | (905 | ) | (2,929 | ) | ||||||||
| Common/common equivalents equity |
(12,000 | ) | (306 | ) | — | (12,306 | ) | |||||||||
|
|
|
|
|
|
|
|
|
|||||||||
| Total settlements |
(156,825 | ) | (22,445 | ) | (2,899 | ) | (182,169 | ) | ||||||||
|
|
|
|
|
|
|
|
|
|||||||||
| Sales |
||||||||||||||||
| Senior secured debt |
(50 | ) | — | — | (50 | ) | ||||||||||
| Unsecured subordinated debt |
— | — | (31,618 | ) | (31,618 | ) | ||||||||||
| Preferred equity |
(7,727 | ) | — | (16,624 | ) | (24,351 | ) | |||||||||
| Common/common equivalents equity |
(12,931 | ) | (67 | ) | (55 | ) | (13,053 | ) | ||||||||
|
|
|
|
|
|
|
|
|
|||||||||
| Total sales |
(20,708 | ) | (67 | ) | (48,297 | ) | (69,072 | ) | ||||||||
|
|
|
|
|
|
|
|
|
|||||||||
| Fair value as of December 31, 2010 |
||||||||||||||||
| Senior secured debt |
325,874 | 24,207 | 75,714 | 425,795 | ||||||||||||
| Subordinated secured debt |
121,743 | 12,348 | 56,218 | 190,309 | ||||||||||||
| Unsecured subordinated debt |
12,321 | — | — | 12,321 | ||||||||||||
| Preferred equity |
24,741 | 13,197 | 178,357 | 216,295 | ||||||||||||
| Common/common equivalents equity |
29,170 | 3,548 | — | 32,718 | ||||||||||||
|
|
|
|
|
|
|
|
|
|||||||||
| Total fair value as of December 31, 2010 |
$ | 513,849 | $ | 53,300 | $ | 310,289 | $ | 877,438 | ||||||||
|
|
|
|
|
|
|
|
|
|||||||||
100
Table of Contents
UNREALIZED (DEPRECIATION) APPRECIATION OF LEVEL 3 INVESTMENTS
The following table summarizes the unrealized (depreciation) appreciation that we recognized on those investments for which we determined fair value using unobservable inputs (Level 3) for the years ended December 31, 2011 and 2010.
| Year ended December 31, 2011 | Year ended December 31, 2010 | |||||||||||||||||||||||||||||||
| (in thousands) |
Non-affiliate Investments |
Affiliate Investments |
Control Investments |
Total | Non-affiliate Investments |
Affiliate Investments |
Control Investments |
Total | ||||||||||||||||||||||||
| Change in unrealized (depreciation) appreciation |
||||||||||||||||||||||||||||||||
| Senior secured debt |
$ | 28,806 | $ | — | $ | (43,731 | ) | $ | (14,925 | ) | $ | (11,041 | ) | $ | 297 | $ | (5,556 | ) | $ | (16,300 | ) | |||||||||||
| Subordinated secured debt |
14,745 | (413 | ) | 45,563 | 59,895 | 3,082 | 207 | (33,320 | ) | (30,031 | ) | |||||||||||||||||||||
| Unsecured subordinated debt |
1,633 | — | 1,332 | 2,965 | 2 | — | — | 2 | ||||||||||||||||||||||||
| Preferred equity |
3,164 | 2,048 | (84,173 | ) | (78,961 | ) | (875 | ) | 2,173 | (22,232 | ) | (20,934 | ) | |||||||||||||||||||
| Common/common equivalents equity |
(6,919 | ) | (300 | ) | 1,000 | (6,219 | ) | (6,187 | ) | 1,359 | (26 | ) | (4,854 | ) | ||||||||||||||||||
|
|
|
|
|
|
|
|
|
|
|
|
|
|
|
|
|
|||||||||||||||||
| Total change in unrealized (depreciation) appreciation on Level 3 investments |
$ | 41,429 | $ | 1,335 | $ | (80,009 | ) | $ | (37,245 | ) | $ | (15,019 | ) | $ | 4,036 | $ | (61,134 | ) | $ | (72,117 | ) | |||||||||||
|
|
|
|
|
|
|
|
|
|
|
|
|
|
|
|
|
|||||||||||||||||
NOTE 5—CONCENTRATIONS OF INVESTMENT RISK
During the year ended December 31, 2011, we had concentrations in certain industries, including the healthcare, business services and manufacturing industries. In addition, during the year ended December 31, 2010, we had a concentration in the communications industry. The following table summarizes our fair value and revenue concentrations in each of those industries:
| Investments at fair value | Revenue for the year ended | |||||||||||||||||||||||||||||||
| As of December 31, 2011 | As of December 31, 2010 | December 31, 2011 | December 31, 2010 | |||||||||||||||||||||||||||||
| (dollars in thousands) |
Amount | % of Total Portfolio |
Amount | % of Total Portfolio |
Amount | % of Total Revenue |
Amount | % of Total Revenue |
||||||||||||||||||||||||
| Industry |
||||||||||||||||||||||||||||||||
| Healthcare |
$ | 84,660 | 11.4 | % | $ | 76,358 | 7.6 | % | $ | 10,926 | 12.7 | % | $ | 10,754 | 12.0 | % | ||||||||||||||||
| Business services |
78,468 | 10.6 | 87,897 | 8.7 | 9,967 | 11.6 | 6,233 | 7.0 | ||||||||||||||||||||||||
| Manufacturing |
77,849 | 10.5 | 54,178 | 5.4 | 5,754 | 6.7 | 657 | 0.7 | ||||||||||||||||||||||||
| Communications(a) |
34,507 | 4.7 | 150,907 | 14.9 | 2,893 | 3.4 | 3,957 | 4.4 | ||||||||||||||||||||||||
| (a) | Includes Broadview, which represented $10.9 million, or 1.5%, and $103.0 million, or 10.2%, of the fair value of our investment portfolio as of December 31, 2011 and December 31, 2010, respectively. |
101
Table of Contents
NOTE 6—BORROWINGS
As of December 31, 2011, we reported $430.2 million of borrowings on our Consolidated Balance Sheet at cost. We estimate that the fair value of these borrowings as of December 31, 2011 was approximately $412.6 million, based on market data and current interest rates. The following table summarizes our borrowing facilities and the facility amounts and amounts outstanding and contingent borrowing eligibility of Solutions Capital I, L.P., a wholly owned subsidiary, as an SBIC, under the SBIC Act.
| December 31, 2011 | December 31, 2010 | |||||||||||||||||
| (dollars in thousands) |
Maturity Date | Total Facility/ Program |
Amount Outstanding |
Total Facility/ Program |
Amount Outstanding |
|||||||||||||
| Private Placement Notes |
||||||||||||||||||
| Series 2005-A |
October 2011 | $ | — | $ | — | $ | 17,434 | $ | 17,434 | |||||||||
| Series 2007-A |
October 2012(a) | 8,717 | 8,717 | 8,717 | 8,717 | |||||||||||||
| Commercial Loan Funding Trust |
||||||||||||||||||
| Variable Funding Note |
January 2014(b) | 150,000 | 55,822 | 150,000 | 100,251 | |||||||||||||
| Commercial Loan Trust 2006-1 |
||||||||||||||||||
| Series 2006-1 Class A-1 Notes |
April 2018(c) | 63,389 | 63,389 | 106,250 | 106,250 | |||||||||||||
| Series 2006-1 Class A-2 Notes |
April 2018(c) | 2,983 | 2,983 | 50,000 | — | |||||||||||||
| Series 2006-1 Class A-3 Notes |
April 2018(c) | 50,711 | 50,711 | 85,000 | 85,000 | |||||||||||||
| Series 2006-1 Class B Notes |
April 2018(c) | 58,750 | 58,750 | 58,750 | 58,750 | |||||||||||||
| Series 2006-1 Class C Notes(d) |
April 2018(c) | 45,000 | 32,000 | 45,000 | 32,000 | |||||||||||||
| Series 2006-1 Class D Notes(e) |
April 2018(c) | 46,494 | 29,247 | 47,500 | 29,880 | |||||||||||||
| SBIC (Maximum borrowing potential)(f) |
(g) | 150,000 | 128,600 | 130,000 | 108,600 | |||||||||||||
|
|
|
|
|
|
|
|
|
|||||||||||
| Total borrowings |
$ | 576,044 | $ | 430,219 | $ | 698,651 | $ | 546,882 | ||||||||||
|
|
|
|
|
|
|
|
|
|||||||||||
| (a) | In January 2012, we repaid in full and terminated the Series 2007-A private placement notes. See Note 16—Subsequent Events. |
| (b) | In January 2012, this facility entered a 24-month amortization period and the legal final maturity date was extended to January 2014. See Note 16—Subsequent Events. |
| (c) | Borrowings under the MCG Commercial Loan Trust 2006-1 facility are listed based on the contractual maturity date. The reinvestment period for this facility ended on July 20, 2011 and we will use all future principal collections from collateral in the facility to repay the securitized debt. |
| (d) | Amount outstanding excludes $5.0 million of notes that we repurchased in December 2008 for $1.6 million and $8.0 million of notes that we repurchased in April 2010 for $4.4 million. As part of the consolidation process, we eliminated the notes that MCG, the parent company, purchased. |
| (e) | Amount outstanding excludes $10.1 million of notes that we repurchased in December 2008 for $2.4 million and $7.5 million of notes that we repurchased in January 2009 for $2.1 million. As part of the consolidation process, we eliminated the notes that MCG, the parent company, purchased. |
| (f) | As of December 31, 2011, we had the potential to borrow up to $150.0 million of SBA-guaranteed debentures under the SBIC program. As of December 31, 2011, the SBA had approved and committed up to $150.0 million in borrowings to the SBIC. As of December 31, 2011, we have funded $75.0 million, which allows us to utilize the full $150.0 million borrowing potential approved and committed by the SBA under this program. In January 2012, Solutions Capital I, L.P., borrowed the remaining $21.4 million of the commitment. See Note 16—Subsequent Events. |
| (g) | We must repay borrowings under the SBIC program within ten years after the borrowing date, which will occur beginning September 2018. In January 2012, Solutions Capital I, L.P. borrowed the remaining $21.4 million of the commitment; therefore, repayment of our SBIC borrowings will occur between September 2018 and March 2022. See Note 16—Subsequent Events. |
Each of our credit facilities has certain collateral requirements and/or financial covenants. As of December 31, 2011, the net worth covenant of our Commercial Loan Funding Trust, or SunTrust Warehouse, required that we maintain a consolidated tangible net worth of not less than $450.0 million, plus 50% of any equity raised after February 26, 2009. However, in January 2012, the net worth covenant requirement was amended effective as of and after December 31, 2008 to be not less than $375.0 million, plus 50% of any equity raised after February 26, 2009. See Note 16-Subsequent Events for details about this amendment. Under the SunTrust Warehouse agreement, we must also maintain an asset coverage ratio of at least 180%.
As a BDC, we are not permitted to incur indebtedness or issue senior securities, including preferred stock, unless immediately after such borrowing we have an asset coverage for total borrowings (excluding borrowings by our SBIC facility) of at least 200%. In addition, we may not be permitted to declare any cash dividend or other distribution on our outstanding common shares, or purchase any such shares, unless, at the time of such declaration or purchase, we have an asset coverage ratio of at least 200% after deducting the amount of such dividend, distribution or purchase price. If we are unable to meet this asset coverage requirement, we may not be able to incur additional debt. As of December 31, 2011, our ratio of total assets to total borrowings and other senior securities was 244%.
We fund all of our current debt facilities, except our Series 2007-A notes, through our bankruptcy remote, special-purpose, wholly owned subsidiaries. Therefore, these subsidiaries’ assets may not be available to our creditors. In some cases, advances under our debt facilities are subject to certain collateral levels, collateral quality, leverage and other restrictive covenants. We continue to service the portfolio investments that we use as collateral in our secured borrowing facilities.
102
Table of Contents
The following table summarizes repayments of our borrowings based on the final legal maturity or the contractual principal collections of the outstanding loans that comprise the collateral, where applicable. Certain of our borrowing facilities contain provisions that require that we offer to repay a portion of the proceeds we receive from monetizations to pay down a portion of the outstanding balances. Actual repayments could differ significantly due to future prepayments by our borrowers, modifications of our borrowers’ existing loan agreements, and monetizations.
| December 31, 2011 | ||||||||||||
| (in thousands) |
Debt with Recourse |
Debt
without Recourse |
Total | |||||||||
| 2012 |
$ | 8,717 | $ | 24,266 | (a) | $ | 32,983 | |||||
| 2013 |
— | — | — | |||||||||
| 2014 |
— | 51,057 | 51,057 | |||||||||
| 2015 |
— | — | — | |||||||||
| 2016 |
— | — | — | |||||||||
| Thereafter(b) |
75,000 | 271,179 | 346,179 | |||||||||
|
|
|
|
|
|
|
|||||||
| Total |
$ | 83,717 | $ | 346,502 | $ | 430,219 | ||||||
|
|
|
|
|
|
|
|||||||
| (a) | Reflects repayments we are required to make in connection with principal collections from collateral loans in our Commercial Loan Funding Trust and Commercial Loan Trust 2006-1. |
| (b) | Our maximum exposure with respect to the indebtedness of Solutions Capital was $75.0 million, which represents the $75.0 million that MCG had funded in Solutions Capital as of December 31, 2011. |
The following table summarizes our aggregate outstanding borrowings as of December 31, 2011 and December 31, 2010, by interest rate benchmark:
| (in thousands) |
December 31, 2011 |
December 31, 2010 |
||||||||||
| Interest rate benchmark |
||||||||||||
| LIBOR |
$ | 237,080 | $ | 311,880 | ||||||||
| Commercial paper rate |
55,822 | 100,251 | ||||||||||
| Fixed rate |
137,317 | 134,751 | ||||||||||
|
|
|
|
|
|||||||||
| Total borrowings |
$ | 430,219 | $ | 546,882 | ||||||||
|
|
|
|
|
|||||||||
As of December 31, 2011, we were in compliance with all key financial covenants under each of our borrowing facilities, although there can be no assurance regarding compliance in future periods. The following sections provide additional detail about each of our borrowing facilities.
PRIVATE PLACEMENT NOTES
In October 2005, we issued $50.0 million of Series 2005-A unsecured notes with a five-year maturity. Initially, the Series 2005-A notes bore interest at 6.73% per annum, which was amended in 2009 to 9.98% per annum. In March 2011, we repaid the Series 2005-A notes in full.
In October 2007, we issued $25.0 million of Series 2007-A unsecured notes with a five-year maturity. Initially, the Series 2007-A notes bore interest at a 6.71% per annum, which was amended in 2009 to 8.96% per annum. In January 2012, we repaid the Series 2007-A notes in full. See Note 16—Subsequent Events.
COMMERCIAL LOAN FUNDING TRUST
Through MCG Commercial Loan Funding Trust, we had a $150.0 million warehouse financing facility funded through Three Pillars Funding LLC, an asset-backed commercial paper conduit administered by SunTrust Robinson Humphrey, Inc. The SunTrust Warehouse is secured primarily by MCG Commercial Loan Funding Trust’s assets, including commercial loans that we sold to the trust. The pool of commercial loans in the trust must meet certain requirements, such as term, average life, investment rating, agency rating and industry diversity requirements. The pool of commercial loans must also meet certain requirements related to portfolio performance, including required minimum portfolio yield and limitations on delinquencies and charge-offs.
In January 2011, SunTrust renewed this liquidity facility. In connection with this renewal, the legal final maturity date of the SunTrust Warehouse was extended to January 25, 2014 and the scheduled termination date was extended to 2013. The interest rate under the 2011 renewal of the SunTrust Warehouse agreement was the commercial paper rate plus 3.25%, which represented a 0.75% increase over the rate as of December 31, 2010. We paid a $1.5 million, or 1.0%, facility fee for this renewal. Subsequently, in January 2012, we entered into an amendment to the SunTrust Warehouse, which among other things, accelerated the scheduled termination date to January 17, 2012 and set the final maturity of this facility to January 17, 2014. See Note 16—Subsequent Events for additional information about this amendment.
103
Table of Contents
As of December 31, 2011, advances under this facility could be up to 64% of eligible collateral. The SunTrust Warehouse is non-recourse to us; therefore, in the event of a termination event or upon the legal final maturity date, the lenders under the SunTrust Warehouse generally may only look to the collateral to satisfy the outstanding obligations under this facility. The following table summarizes the fair value of the collateral under the Commercial Loan Funding Trust as of December 31, 2011 and December 31, 2010:
| December 31, 2011 | December 31, 2010 | |||||||||||||||
| (dollars in thousands) |
Amount | % | Amount | % | ||||||||||||
| Securitized assets |
||||||||||||||||
| Senior secured debt |
$ | 100,527 | 71.5 | % | $ | 128,330 | 69.0 | % | ||||||||
| Subordinated secured debt |
24,870 | 17.7 | 50,932 | 27.5 | ||||||||||||
|
|
|
|
|
|
|
|
|
|||||||||
| Total securitized assets |
125,397 | 89.2 | 179,262 | 96.5 | ||||||||||||
| Cash, securitization accounts |
15,111 | 10.8 | 6,539 | 3.5 | ||||||||||||
|
|
|
|
|
|
|
|
|
|||||||||
| Total collateral |
$ | 140,508 | 100.0 | % | $ | 185,801 | 100.0 | % | ||||||||
|
|
|
|
|
|
|
|
|
|||||||||
COMMERCIAL LOAN TRUST 2006-1
In April 2006, we completed a $500.0 million debt securitization through Commercial Loan Trust 2006-1, a wholly owned subsidiary. The 2006-1 Trust issued $106.25 million of Class A-1 Notes, $50.0 million of Class A-2 Notes, $85.0 million of Class A-3 Notes, $58.75 million of Class B Notes, $45.0 million of Class C Notes and $47.5 million of Class D Notes. The respective classes of notes bear interest at LIBOR plus 0.33%, 0.35%, 0.33%, 0.58%, 1.05% and 2.25%.
All of the notes are secured by the assets of the 2006-1 Trust. The following table summarizes the fair value of the assets securitized under this facility as of December 31, 2011 and December 31, 2010:
| December 31, 2011 | December 31, 2011 | |||||||||||||||
| (dollars in thousands) |
Amount | % | Amount | % | ||||||||||||
| Securitized assets |
||||||||||||||||
| Senior secured debt |
$ | 258,722 | 78.9 | % | $ | 285,854 | 68.2 | % | ||||||||
| Subordinated secured debt |
43,640 | 13.3 | 97,881 | 23.3 | ||||||||||||
| Common Equity |
282 | 0.1 | — | — | ||||||||||||
|
|
|
|
|
|
|
|
|
|||||||||
| Total securitized assets |
302,644 | 92.3 | 383,735 | 91.5 | ||||||||||||
| Cash, securitization accounts |
25,195 | 7.7 | 35,706 | 8.5 | ||||||||||||
|
|
|
|
|
|
|
|
|
|||||||||
| Total collateral |
$ | 327,839 | 100.0 | % | $ | 419,441 | 100.0 | % | ||||||||
|
|
|
|
|
|
|
|
|
|||||||||
We retain all of the equity in the securitization. The securitization included a five-year reinvestment period, which ended in July 2011.
The Class A-1, Class B, Class C and Class D Notes are term notes. The Class A-2 Notes were, but are no longer, a revolving class of secured notes with a five-year revolving period. Therefore, we may not increase the principal amount of the A-2 notes beyond the balance that was outstanding as of December 31, 2011. The Class A-3 Notes are a delayed draw class of secured notes, which were drawn in full between July 2006 and April 2007. The pool of commercial loans in the trust must meet certain requirements, such as asset mix and concentration, collateral coverage, term, agency rating, minimum coupon, minimum spread and sector diversity requirements.
SBIC DEBENTURES
In December 2004, we formed a wholly owned subsidiary, Solutions Capital I, L.P., or Solutions Capital. Solutions Capital has a license from the SBA to operate as an SBIC under the SBIC Act. As of December 31, 2011, the license gave Solutions Capital the potential to borrow up to $150.0 million. The SBA approved and committed $150.0 million in borrowings to Solutions Capital, subject to certain capital requirements and customary procedures. These funds can be used to provide debt and equity capital to qualifying small businesses. We may use the borrowings from the SBA to fund new originations; however, we may not use these borrowings to originate debt to certain companies that are currently in our portfolio without SBA approval. In addition, we may not use these funds for MCG’s, the parent company’s, working capital.
104
Table of Contents
To utilize the full $150.0 million potential borrowing for which we were approved under this program, we needed to fund a total of $75.0 million to Solutions Capital, which we had done as of December 31, 2011. In January 2012, Solutions Capital borrowed the remaining $21.4 million of the commitment. See Note 16—Subsequent Events.
The maximum amount of outstanding leverage available to single-license SBIC companies is $150.0 million. The maximum amount of outstanding leverage available to SBIC companies with multiple licenses is $225.0 million on an aggregate basis.
As of December 31, 2011 and 2010, we had $182.4 million and $144.9 million, respectively, of investments in our SBIC and we had $28.8 million and $29.4 million, respectively, of restricted cash to be used for additional investments in our SBIC.
Once drawn, the SBIC debt bears an interim interest rate of LIBOR plus 30 basis points. The rate becomes fixed at the time of SBA pooling, which is within nine months of funding, and is set to the then-current 10-year treasury rate plus a spread and an annual SBA charge. As of December 31, 2011, the SBIC had $128.6 million of borrowings outstanding summarized in the following table:
| Amount Outstanding | Treasury Rate at Pooling Date |
Spread in basis points |
||||||||||||||||||||
| (dollars in thousands) |
December 31, 2011 |
December 31, 2010 |
Rate | |||||||||||||||||||
| Tranche |
||||||||||||||||||||||
| 2008-10B |
$ | 2,600 | $ | 2,600 | 6.44 | % | Fixed | 3.80 | % | 264 | ||||||||||||
| 2009-10A |
12,000 | 12,000 | 5.34 | % | Fixed | 2.81 | % | 253 | ||||||||||||||
| 2009-10B |
13,000 | 13,000 | 4.95 | % | Fixed | 3.44 | % | 151 | ||||||||||||||
| 2010-10B |
27,500 | 27,500 | 3.93 | % | Fixed | 2.56 | % | 137 | ||||||||||||||
| 2011-10A |
53,500 | 53,500 | 4.80 | % | Fixed | 3.50 | % | 130 | ||||||||||||||
| Interim |
20,000 | — | 1.55 | % | Interim | NA | NA | |||||||||||||||
|
|
|
|
|
|||||||||||||||||||
| Total |
$ | 128,600 | $ | 108,600 | 4.21 | % | 3.14 | % | 149 | |||||||||||||
|
|
|
|
|
|||||||||||||||||||
In October 2008, we received exemptive relief from the SEC which effectively allows us to exclude debt issued by Solutions Capital from the calculation of our consolidated BDC asset coverage ratio.
NOTE 7—CAPITAL STOCK
We have one class of common stock and one class of preferred stock authorized. Our board of directors is authorized to: provide for the issuance of shares of preferred stock in one or more series; establish the number of shares to be included in each such series; and establish the designations, voting powers, preferences and rights of the shares of each such series, and any qualifications, limitations or restrictions thereof, subject to the 1940 Act. In January 2012, our board of directors authorized a stock repurchase program of up to $35.0 million. See Note 16—Subsequent Events.
The following table summarizes our distributions per share declared since January 1, 2009.
| Date Declared |
Record Date |
Payment Date |
Amount | |||||
| February 24, 2012 |
April 13, 2012 | May 15, 2012 | $ | 0.17 | ||||
| October 31, 2011 |
December 15, 2011 | January 13, 2012 | $ | 0.17 | ||||
| August 1, 2011 |
September 14, 2011 | October 14, 2011 | $ | 0.17 | ||||
| May 5, 2011 |
June 15, 2011 | July 15, 2011 | $ | 0.17 | ||||
| March 1, 2011 |
March 15, 2011 | April 15, 2011 | $ | 0.15 | ||||
| November 2, 2010 |
December 9, 2010 | January 6, 2011 | $ | 0.14 | ||||
| August 3, 2010 |
September 7, 2010 | October 4, 2010 | $ | 0.12 | ||||
| April 29, 2010 |
June 2, 2010 | July 2, 2010 | $ | 0.11 | ||||
NOTE 8—EMPLOYEE BENEFIT PLANS
All full-time employees, and those part-time employees who work at least 1,000 hours per year, are eligible to participate in a contributory employee savings plan that we sponsor under Section 401(k) of the Internal Revenue Code, or 401(k) Plan. Eligible employees may participate in the 401(k) Plan beginning on the first day of the calendar quarter following their respective date of hire. We match a portion of the contribution made by employees to the 401(k) Plan, based upon a percent of defined compensation. During the years ended December 31, 2011, 2010 and 2009, we incurred $262,000, $216,000 and $228,000, respectively, of expenses related to the 401(k) Plan.
During 2011, 2010 and 2009, we had a deferred compensation plan for certain executives that allowed them to defer a portion of their salary and bonuses to an unfunded deferred compensation plan that we manage. Contributions to
105
Table of Contents
the deferred compensation plan earn interest at a rate of 2.00% over our internal cost of funds rate, as defined by the plan. Effective December 1, 2011, the deferred compensation plan was irrevocably terminated, at which time participants were precluded from making any further contributions to the plan. In December 2012, we will make lump sum distributions to participants of all amounts remaining in their respective accounts. During the years ended December 31, 2011, 2010 and 2009, we incurred $73,000, $65,000 and $62,000, respectively, of expenses related to our deferred compensation plan.
NOTE 9—SHARE BASED COMPENSATION
EMPLOYEE SHARE-BASED COMPENSATION
From time to time, we award shares of restricted common stock to employees under our Third Amended and Restated 2006 Employee Restricted Stock Plan, or the 2006 Plan, which our stockholders initially approved in June 2006. In May 2010, our stockholders approved an amendment to the 2006 Plan increasing the number of shares we may award from 3,500,000 to 6,050,000 shares. Shares of restricted common stock awarded under the 2006 Plan may be subject to the employees’ meeting service or performance conditions specified at the time of award. The award date is the date on which the shares are awarded by the compensation committee or our board of directors, while the fair value of the respective stock award is based on the closing price of our common stock on the NASDAQ Global Select Market on the award date. We amortize restricted stock awards on a straight-line basis over the requisite service period and report this expense as amortization of employee restricted stock awards on our Consolidated Statements of Operations.
During the year ended December 31, 2011, we issued 737,250 shares of restricted stock under the 2006 Plan with a weighted-average fair value per share of common stock at the award date of $6.14. These awards included 121,250 shares of restricted stock issued under the MCG Capital Corporation 2011 Retention Program, or the Retention Program. The forfeiture provisions for 50% of the shares of restricted stock issued under the Retention Program will lapse on each of March 31, 2012 and September 30, 2012. For additional information about the Retention Program, see Note 10—Corporate Restructuring and Resignation of Chief Executive Officer. The awards made during the year ended December 31, 2011, under the 2006 Plan also included 86,500 shares of restricted stock awarded under the Long-Term Incentive Plan (discussed in more detail below). In addition to shares awarded under the Retention Program and the Long-Term Incentive Plan, during the year ended December 31, 2011, we also awarded 529,500 shares of restricted stock under the 2006 Plan to employees that will vest ratably over vesting periods up to four years. During the year ended December 31, 2010, we issued 424,500 shares of restricted stock under the 2006 Plan, at weighted-average fair value of $2.86 per share. Of the shares that we awarded during the year ended December 31, 2010, 346,000 shares were awarded under the Long-Term Incentive Plan, which is discussed in more detail below.
106
Table of Contents
The following table summarizes shares of restricted stock awarded under the 2006 Plan:
| Year |
Number of Shares | |||||||||||||||||||
| Awarded |
Forfeiture Provision Expire |
Basis for |
Awarded | Forfeiture Provisions Lapsed |
Forfeited | Outstanding as of December 31, 2011 |
||||||||||||||
| 2011 |
2011 | Market Condition | 57,700 | (57,700 | ) | — | — | |||||||||||||
| 2011 |
2012 | Market Condition and Service | 28,800 | (12,500 | ) | (800 | ) | 15,500 | ||||||||||||
| 2011 |
2012 | Service | 121,300 | — | (6,500 | ) | 114,800 | |||||||||||||
| 2011 |
2014 | Service | 504,500 | (192,700 | ) | (100,100 | ) | 211,700 | ||||||||||||
| 2011 |
2015 | Service | 25,000 | (3,100 | ) | — | 21,900 | |||||||||||||
| 2010 |
2010 | Market Condition | 230,700 | (230,700 | ) | — | — | |||||||||||||
| 2010 |
2011 | Market Condition and Service | 115,300 | (114,100 | ) | (1,200 | ) | — | ||||||||||||
| 2010 |
2014 | Service | 78,500 | (31,900 | ) | (23,200 | ) | 23,400 | ||||||||||||
| 2009 |
2009 | Market Condition | 288,300 | (288,300 | ) | — | — | |||||||||||||
| 2009 |
2010 | Market Condition and Service | 144,200 | (144,200 | ) | — | — | |||||||||||||
| 2009 |
2010 | Service and Performance | 85,000 | (42,500 | ) | (42,500 | ) | — | ||||||||||||
| 2008 |
2011 | Service | 897,500 | (718,000 | ) | (179,500 | ) | — | ||||||||||||
| 2008 |
2012 | Service | 438,100 | (319,100 | ) | (103,300 | ) | 15,700 | ||||||||||||
| 2007 |
2011 | Service | 836,100 | (721,400 | ) | (114,700 | ) | — | ||||||||||||
| 2007 |
2008 | Service and Performance | 100,000 | (88,400 | ) | (11,600 | ) | — | ||||||||||||
| 2006 |
2006 | Service | 83,000 | (83,000 | ) | — | — | |||||||||||||
| 2006 |
2008 | Service | 100,000 | (100,000 | ) | — | — | |||||||||||||
| 2006 |
2009 | Service | 300,000 | (300,000 | ) | — | — | |||||||||||||
|
|
|
|
|
|
|
|
|
|||||||||||||
| Total shares |
4,434,000 | (3,447,600 | ) | (583,400 | ) | 403,000 | ||||||||||||||
|
|
|
|
|
|
|
|
|
|||||||||||||
During the years ended December 31, 2011, 2010 and 2009, we recognized $2.1 million, $4.3 million and $7.7 million, respectively, of compensation expense related to share-based compensation awards. In addition, during the year ended December 31, 2011, we recognized $0.4 million of amortization of restricted stock awards as restructuring expense. As of December 31, 2011, all the restricted share awards for which forfeiture provisions had not lapsed carried non-forfeitable dividend rights to the holder of the restricted shares. We record dividends paid on shares of restricted common stock for which forfeiture provisions are expected to lapse to retained earnings, while we record dividends paid on shares of restricted common stock for which forfeiture provisions are not expected to lapse to compensation expense. No dividends paid during either the years ended December 31, 2011 or 2010 were recorded as compensation expense. No dividends were paid during the year ended December 31, 2009. As of December 31, 2011, we had $2.3 million of unrecognized compensation cost related to restricted common stock awarded to employees. We will recognize these costs over the remaining weighted-average requisite service period of 2.5 years.
Long-Term Incentive Plan
On July 23, 2009, our board of directors approved the Long-Term Incentive Plan, or the LTIP, which is effective for the three-year period ending July 22, 2012. LTIP participants, including our executive officers and key, non-executive employees, were eligible, in the sole discretion of the compensation committee of our board of directors, to receive their respective portions of up to an aggregate of 865,000 shares of our restricted common stock to be issued under the 2006 Plan and up to $5.2 million of cash bonuses if the closing price of our common stock achieves specific price thresholds for 20 consecutive trading days.
All of the 865,000 shares of restricted stock under the LTIP were issued during 2009 through 2011, following our achievement of share price thresholds set forth in the following table and authorization of the compensation committee of our board of directors. Forfeiture provisions for two-thirds of the respective stock awards lapsed immediately, with the forfeiture provisions for the remaining one-third of the respective stock awards lapsing twelve months later. Similarly, cash awards under the LTIP were subject to the achievement of the share price thresholds set forth in the following table. Upon satisfaction of a price threshold and the authorization of the compensation committee, the LTIP provides for the immediate payout of two-thirds of the associated cash with the remainder to be paid twelve months later.
107
Table of Contents
The following table summarizes the price thresholds, the cumulative percentage, number of shares and cash bonus associated with each stock price threshold set forth in the LTIP. In addition, the following table summarizes the market thresholds that were achieved and the associated stock and cash awards through December 31, 2011.
| Market Thresholds, Shares and Cash Bonus Eligible for
Award under Long-Term Incentive Plan |
Date Market Thresholds Achieved and Shares and Dollar Amounts Awarded |
|||||||||||||||||||||
| Potential Stock Awards | Aggregate Dollar Amount for Each Share Price threshold Achieved |
Number of Shares Awarded(a) |
||||||||||||||||||||
| Share Price |
% of Award | Number of Shares |
Date Share Price Achieved |
Dollar
Amount Awarded(b) |
||||||||||||||||||
| $ 3.00 |
25 | % | 216,250 | $ | — | October 2009 | 216,250 | $ | — | |||||||||||||
| $ 4.00 |
25 | % | 216,250 | — | October 2009 | 216,250 | — | |||||||||||||||
| $ 5.00 |
25 | % | 216,250 | 1,000,000 | April 2010 | 216,250 | 1,000,000 | |||||||||||||||
| $ 6.00 |
15 | % | 129,750 | 996,000 | November 2010 | 129,750 | 996,000 | |||||||||||||||
| $ 7.00 |
10 | % | 86,500 | 1,006,000 | March 2011 | 86,500 | 1,006,000 | |||||||||||||||
| $ 8.00 (c) |
— | % | — | 2,209,000 | ||||||||||||||||||
|
|
|
|
|
|
|
|
|
|
|
|||||||||||||
| 100 | % | 865,000 | $ | 5,211,000 | 865,000 | $ | 3,002,000 | |||||||||||||||
|
|
|
|
|
|
|
|
|
|
|
|||||||||||||
| (a) | As of December 31, 2011, we awarded 865,000 shares under the LTIP program, for which the forfeiture provision have lapsed on 847,419 shares and 2,083 shares were forfeited. Assuming that the associated LTIP participants meet the continuing service requirements, the forfeiture provisions for 15,500 shares will lapse in February 2012. |
| (b) | As of December 31, 2011, we awarded $3,002,000 of cash awards under the plan, of which $2,001,000 was paid out upon achievement of the market threshold. Cash in the amount of $801,000 was paid to LTIP participants in 2011 after satisfaction of the participants’ service requirement. Assuming that the associated LTIP participants meet the continuing service requirements, $180,000 will be paid in February 2012. |
| (c) | We are under no obligation to pay the cash award for the $8.00 tranche. The compensation committee of our board of directors has the sole discretion for making such determination, regardless of whether the $8.00 share price has been achieved. Cash awards in the amount of $1,021,000 were forfeited by employees upon resignation/termination from the Company. |
We accounted for the restricted stock awards as equity awards. As of the July 23, 2009 grant date for the LTIP, we estimated the fair value of these awards was $1.9 million, and we amortized this amount on a straight-line basis over the derived service period. During the years ended December 31, 2011 and 2010, we recognized less than $0.1 million and $0.6 million, respectively, of compensation expense for these equity awards.
We account for the cash portion of the LTIP as liability awards. As liability awards, we are required to account for the awards based on the fair value of the award at the end of each reporting period and to recognize the expense over the then-current estimated requisite service period. In total, during the year ended December 31, 2011, we reversed $0.4 million of previously recognized compensation expense for the cash awards under the LTIP and during the year ended December 31, 2010, we recognized $2.5 million of compensation expense for the cash awards under the LTIP. As of December 31, 2011, the fair value of the $8.00 tranche was less than $0.1 million. However, during the twelve months ending December 31, 2012, we could be required to recognize up to $1.2 million of compensation expense if the associated market condition for the $8.00 tranche were to be achieved before July 22, 2012.
NON-EMPLOYEE DIRECTOR SHARE BASED COMPENSATION
During June 2006, our stockholders initially approved the 2006 Non-Employee Director Restricted Stock Plan, which was subsequently amended and restated and which we refer to as the 2006 Non-Employee Plan. In May 2010, our stockholders approved an amendment to the 2006 Non-Employee Plan that increased the number of shares we may award from 100,000 to 150,000 shares. During the years ended December 31, 2011, 2010 and 2009, we awarded 15,000, 7,500 and 22,500 shares of restricted common stock, respectively, to eligible non-employee directors. During the years ended December 31, 2011, 2010 and 2009, we recognized less than $0.1 million of compensation costs related to share-based awards to non-employee directors. We include this compensation cost in general and administrative expense on our Consolidated Statements of Operations. As of December 31, 2011, we had less than $0.1 million of unrecognized compensation cost related to restricted common stock awarded to non-employee directors, which we expect to recognize over the remaining weighted-average requisite service period of 2.0 years.
108
Table of Contents
SUMMARY OF EMPLOYEE AND NON-EMPLOYEE DIRECTOR SHARE-BASED COMPENSATION
The following table summarizes our restricted stock award activity during 2011:
| Shares | Weighted-Average Grant Date Fair Value per Share |
|||||||
| Subject to forfeiture provisions as of December 31, 2010 |
932,200 | $ | 3.92 | |||||
| Awarded |
752,250 | 6.15 | ||||||
| Forfeiture provision satisfied |
(1,112,050 | ) | 4.16 | |||||
| Forfeited |
(141,890 | ) | 6.86 | |||||
|
|
|
|||||||
| Subject to forfeiture provisions as of December 31, 2011 |
430,510 | $ | 6.14 | |||||
|
|
|
|||||||
NOTE 10—CORPORATE RESTRUCTURING AND RESIGNATION OF CHIEF EXECUTIVE OFFICER
CORPORATE RESTRUCTURING
On August 1, 2011, our board of directors approved a plan to reduce our workforce by 42%, including 22 current employees and 5 resignations. As of December 31, 2011, our headcount was 37 employees. Affected employees received severance pay, continuation of benefits and, for employees who had been awarded restricted stock, additional lapsing of restrictions associated with restricted stock awards. We have accounted for these costs in accordance with ASC 420-10—Exit or Disposal Cost Obligations.
During the year ended December 31, 2011, we incurred $4.3 million of restructuring expenses, which we reported as a separate line item on our Consolidated Statements of Operations. The following table summarizes the restructuring charges recognized during the year ended December 31, 2011 related to our 2011 corporate restructuring:
| (In thousands) |
Year ended December 31, 2011 |
|||
| Severance benefits |
||||
| Amortization of restricted stock(a) |
$ | 432 | ||
| Cash severance obligations |
3,803 | |||
| Other restructuring costs(b) |
54 | |||
|
|
|
|||
| Total restructuring charge |
$ | 4,289 | ||
|
|
|
|||
| (a) | Represents share-based compensation expenses associated with the lapsing of forfeiture restrictions applicable to restricted stock awards for affected employees over their respective severance periods. In total, the forfeiture provisions with respect to 67,742 shares of restricted stock that shall lapse during the former employees’ respective severance periods. |
| (b) | Includes $17 for retirement of fixed assets associated with restructuring. |
We included liabilities associated with our restructuring in other liabilities on our Consolidated Balance Sheets. The following table summarizes changes in the balance of our restructuring liabilities from January 1, 2009 through December 31, 2011:
| (in thousands) |
Severance Benefits(a) |
Other | Total | |||||||||
| Balance as of January 1, 2009(b) |
$ | 272 | $ | 194 | $ | 466 | ||||||
| Additions |
4 | — | 4 | |||||||||
| Accretion |
1 | 2 | 3 | |||||||||
| Cash payments |
(99 | ) | (85 | ) | (184 | ) | ||||||
|
|
|
|
|
|
|
|||||||
| Balance as of December 31, 2009 |
$ | 178 | $ | 111 | $ | 289 | ||||||
| Additions |
— | — | — | |||||||||
| Accretion |
— | 1 | 1 | |||||||||
| Cash payments |
— | (27 | ) | (27 | ) | |||||||
|
|
|
|
|
|
|
|||||||
| Balance as of December 31, 2010 |
$ | 178 | $ | 85 | $ | 263 | ||||||
| Additions |
3,747 | 36 | 3,783 | |||||||||
| Accretion |
56 | 1 | 57 | |||||||||
| Cash payments |
(1,509 | ) | (68 | ) | (1,577 | ) | ||||||
|
|
|
|
|
|
|
|||||||
| Balance as of December 31, 2011 |
$ | 2,472 | $ | 54 | $ | 2,526 | ||||||
|
|
|
|
|
|
|
|||||||
| (a) | Includes the cost of severance and continuation of benefits. |
| (b) | The January 1, 2009 balance relates to liabilities carried forward from our August 2008 corporate restructuring. |
2011 RETENTION PROGRAM
On August 1, 2011, our board of directors approved the MCG Capital Corporation 2011 Retention Program, or the Retention Program, for the benefit of our employees, including one of our named executive officers, but excluding our then: i) President and Chief Executive Officer; ii) Executive Vice President and Chief Financial Officer;
109
Table of Contents
iii) Executive Vice President of Business Development; and iv) Senior Vice President, General Counsel and Chief Compliance Officer. We designed the Retention Program to provide eligible employees with certain incentives related to their past service and continuing employment with MCG. The Retention Program consists of an aggregate of $1.3 million in cash and up to 121,250 shares of restricted common stock.
Under the Retention Program, we awarded a cash bonus to eligible employees, representing a specified percentage of each eligible employee’s respective annual cash bonus target for the fiscal year ending December 31, 2011. We will pay the incentive bonus to eligible employees in two equal installments on each of March 31, 2012 and September 30, 2012, subject to continued employment with MCG. Certain employees also received shares of restricted common stock under the MCG Capital Corporation 2006 Employee Restricted Stock Plan, as amended, or the 2006 Plan. The forfeiture provisions with respect to 50% of the shares of restricted common stock subject to each retention stock award will lapse on each of March 31, 2012 and September 30, 2012.
RESIGNATION OF CHIEF EXECUTIVE OFFICER
On October 31, 2011, Richard W. Neu, chairman of our board of directors, was elected as chief executive officer, succeeding Steven F. Tunney, Sr. who resigned in order to pursue other interests. During the three months ending December 31, we recognized $2.7 million of expenses related to Mr. Tunney’s resignation consisting of $2.3 million of severance recognized in general and administrative expense and $0.4 million recognized in amortization of employee restricted stock on our Consolidated Statements of Operations. As of December 31, 2011, we had recorded $2.3 million of liabilities related to Mr. Tunney’s severance which was included in other liabilities on our Consolidated Balance Sheets.
NOTE 11—INCOME TAXES
As a RIC, we are taxed under Subchapter M of the Internal Revenue Code. As such, our income generally is not taxable to the extent we distribute it to stockholders and we meet certain qualification tests as outlined in the Internal Revenue Code. However, income from certain investments owned by our wholly owned subsidiaries is subject to federal, state and local income taxes. During 2011 and 2010, we declared and paid distributions from ordinary income that were sufficient to meet our distribution requirements as a RIC. On a continuing basis, we monitor distribution requirements in order to comply with Subchapter M of the Internal Revenue Code.
We use the asset and liability method to account for our Taxable Subsidiaries’ income taxes. Using this method, we recognize deferred tax assets and liabilities for the estimated future tax effects attributable to temporary differences between financial reporting and the tax bases of assets and liabilities. In addition, we recognize deferred tax benefits associated with net operating carryforwards that we may use to offset future tax obligations. We measure deferred tax assets and liabilities using the enacted tax rates expected to apply to taxable income in the years in which we expect to recover or settle those temporary differences. During the years ended December 31, 2011 and 2010, we recorded income tax provisions of $37,000 and $1.8 million, respectively. During 2009, we recorded an income tax benefit of $0.1 million. Approximately $1.6 million of the income tax expense accrued during 2010 was attributable to the sale of JetBroadband Holdings, LLC in July 2010. The remaining tax expense for 2011 and 2010 and the income tax benefit for 2009 were primarily attributable to unrealized depreciation or appreciation and flow-through taxable income on certain investments held by our subsidiaries.
Historically, we have declared dividends that were paid the following quarter. From December 2001 through December 31, 2011, we declared distributions per share of $12.81. Each year, we mail statements on Form 1099-DIV to our stockholders that identify whether we made distributions from ordinary income, net capital gains on the sale of securities, which are each taxable distributions, and/or a return of paid-in-capital surplus, which is a nontaxable distribution. A portion of our distributions may represent a return of capital to our stockholders, to the extent that the total distributions paid in a given year exceed current and accumulated taxable earnings and profits. A portion of the distributions that we paid to stockholders during fiscal years 2011, 2008, 2006, 2005, 2004 and 2003 represented a return of capital.
110
Table of Contents
The following table summarizes the distributions that we declared and paid during the three years ended December 31, 2011.
| Dividends per share | ||||||||
| Declared | Paid | |||||||
| Years ended December 31, |
||||||||
| 2011 |
$ | 0.66 | $ | 0.63 | ||||
| 2010 |
0.37 | 0.23 | ||||||
| 2009 |
— | — | ||||||
We determine the tax attributes of our distributions as of the end of our fiscal year based upon our taxable income for the full year and distributions paid during the full year. During 2011 and 2010, we declared and paid distributions from ordinary income that were sufficient to meet our distribution requirements as a RIC. During fiscal year 2009, we did not declare or pay any dividends to stockholders. We will monitor 2012 taxable income in order to ensure compliance with the distribution requirements as a RIC.
For tax years ended on or before December 31, 2010, we were able to carryforward net capital losses that we may have incurred for a period of eight years. In December 2010, Congress enacted the Regulated Investment Company Modernization Act of 2010, which, in part, will allow us to indefinitely carryover net capital losses that we may incur after 2010. For the tax years ended December 31, 2011, 2010 and 2009, we had net capital losses of $26.0 million, $5.2 million and $54.2 million, respectively, which we will carry forward to offset future net capital gains to the extent provided by federal tax law. The net capital loss carryforward from 2010 will expire in the tax year ending December 31, 2018 and the net capital loss carryforward from 2009 will expire in the tax year ending December 31, 2017.
For income tax purposes, we report distributions paid to stockholders as ordinary income, return of capital, capital gains or a combination thereof. For the tax year ended December 31, 2011, 37% of our distributions were from ordinary income and 63% of our distributions were a return of capital. For the tax year ended December 31, 2010, 100% of our distributions were from ordinary income. We did not make distributions on our common stock during the year ended December 31, 2009. Distributions per common share for the years ended December 31, 2011 and 2010 were taxable as follows:
| Years ended December 31, | ||||||||||||||||||
| 2011 | 2010 | |||||||||||||||||
| $/Share | % of Total | $/Share | % of Total | |||||||||||||||
| Dividends declared during the year |
$ | 0.66 | $ | 0.37 | ||||||||||||||
| Dividends declared in 2011 but paid in 2012 |
(0.17 | ) | — | |||||||||||||||
| Dividends declared in 2010 but paid in 2011 |
0.14 | (0.14 | ) | |||||||||||||||
|
|
|
|
|
|||||||||||||||
| Dividends paid in calendar year |
0.63 | 0.23 | ||||||||||||||||
| Dividends declared in 2010, paid in 2011, but treated as taxable in 2010 as required by the Internal Revenue Code |
(0.03 | ) | 0.03 | |||||||||||||||
|
|
|
|
|
|||||||||||||||
| Dividends paid for tax purposes |
$ | 0.60 | $ | 0.26 | ||||||||||||||
|
|
|
|
|
|||||||||||||||
| Dividends declared on tax Form 1099-DIV(unaudited) |
||||||||||||||||||
| Ordinary income(a) |
$ | 0.22 | 37.0 | % | $ | 0.26 | 100.0 | % | ||||||||||
| Long-term capital gains(a) |
— | — | — | — | ||||||||||||||
| Return of capital(b) |
0.38 | 63.0 | — | — | ||||||||||||||
|
|
|
|
|
|
|
|
|
|||||||||||
| Total reported on tax Form 1099-DIV |
$ | 0.60 | 100.0 | % | $ | 0.26 | 100.0 | % | ||||||||||
|
|
|
|
|
|
|
|
|
|||||||||||
| (a) | For 2011 and 2010, ordinary income was reported on Form 1099-DIV as either qualified or non-qualified. |
| (b) | Return of capital refers to those amounts reported as nontaxable distributions on Form 1099-DIV. |
On a tax basis, distributions allocable to 2011 were composed of $16.3 million of ordinary income and $29.0 million return of capital and distributions in 2010 were composed of $20.0 million of ordinary income.
Taxable income differs from net income recognized in accordance with GAAP because of temporary and permanent differences in income and expense recognition.
Taxable income generally excludes unrealized gains and losses from appreciation or depreciation of our investments, which are included in GAAP net income. Further, amounts recognized for financial reporting purposes may differ from amounts included in taxable income due to the accrued dividends on preferred stock, which increases the book basis but not the tax basis of our investments, and non-accrual interest on loans, which increases tax basis but not book basis.
111
Table of Contents
The following table summarizes the cost, as well as the unrealized appreciation and depreciation for federal income tax purposes as of December 31, 2011 and 2010:
| December 31, | ||||||||
| (in thousands) |
2011 | 2010 | ||||||
| Cost for federal income tax purposes |
$ | 952,154 | $ | 1,144,899 | ||||
|
|
|
|
|
|||||
| Gross unrealized appreciation |
||||||||
| Unrealized appreciation of fair value of portfolio investments (GAAP) |
43,663 | 56,950 | ||||||
| Book to tax differences |
84,712 | 90,981 | ||||||
|
|
|
|
|
|||||
| Gross unrealized appreciation—tax basis |
128,375 | 147,931 | ||||||
|
|
|
|
|
|||||
| Gross unrealized depreciation |
||||||||
| Unrealized depreciation of fair value of portfolio investments (GAAP) |
(320,007 | ) | (293,940 | ) | ||||
| Book to tax differences |
(30,381 | ) | (37,981 | ) | ||||
|
|
|
|
|
|||||
| Gross unrealized depreciation—tax basis |
(350,388 | ) | (331,921 | ) | ||||
|
|
|
|
|
|||||
| Net unrealized depreciation—tax basis |
(222,013 | ) | (183,990 | ) | ||||
| Less: Unrealized depreciation of fair value of other assets and liabilities (GAAP) |
294 | 1,023 | ||||||
| Gross realized depreciation |
||||||||
| Book to tax differences |
10,731 | 47,773 | ||||||
|
|
|
|
|
|||||
| Net realized depreciation—tax basis |
10,731 | 47,773 | ||||||
|
|
|
|
|
|||||
| Total investments at fair value (GAAP) |
$ | 741,166 | $ | 1,009,705 | ||||
|
|
|
|
|
|||||
The following table reconciles GAAP net loss to taxable net income for the years ended December 31, 2011 and 2010:
| (in thousands) |
Years ended December 31, | |||||||
| 2011 | 2010 | |||||||
| Net loss |
$ | (93,115 | ) | $ | (13,072 | ) | ||
| Difference between book and tax losses on investments |
52,005 | (52,865 | ) | |||||
| Net change in unrealized depreciation on investments not taxable until realized |
39,354 | 66,673 | ||||||
| Capital losses in excess of capital gains |
25,992 | 4,861 | ||||||
| Timing difference related to deductibility of long-term incentive compensation |
(5,909 | ) | 1,594 | |||||
| Taxable interest income on non-accrual loans(a) |
(1,257 | ) | 14,857 | |||||
| Dividend income accrued for GAAP purposes that is not yet taxable |
(7,344 | ) | (7,368 | ) | ||||
| Distributions from taxable subsidiaries |
2,152 | 3,529 | ||||||
| Federal tax provision |
37 | 1,801 | ||||||
| Other, net |
4,337 | 25 | ||||||
|
|
|
|
|
|||||
| Taxable income before deductions for distributions |
$ | 16,252 | $ | 20,035 | ||||
|
|
|
|
|
|||||
| (a) | Results for the year ended December 31, 2011 reflect the reversal of interest we previously recognized on non-accrual loans of portfolio investments that we monetized. In accordance with the Internal Revenue Code, we are required to recognize as taxable interest income all interest that is owed to us by portfolio companies, including interest on those debt investments that are on non-accrual status for GAAP reporting purposes. |
In December 2007, we received an examination report from the IRS related to its audit of our tax returns for the 2004 and 2005 tax years. The IRS proposed changes to certain deductions made by us for those years, primarily associated with the timing of certain realized losses in our portfolio. We appealed the proposed changes and reached a settlement with the IRS in the fourth quarter of 2010. As a result of this settlement, we paid approximately $0.8 million in federal and state tax, interest and penalties. All federal tax years subsequent to 2007 remain open to examination by the IRS. As of December 31, 2011, based on our analysis of our tax position, we concluded that we did not have any uncertain tax positions that met the recognition or measurement criteria of ASC Topic 740, Income Taxes.
112
Table of Contents
NOTE 12—LOSS PER SHARE
The following table sets forth the computation of basic and diluted loss per common share for the years ended December 31, 2011, 2010 and 2009:
| Years ended December 31, | ||||||||||||
| (dollars in thousands, except per share amounts) |
2011 | 2010 | 2009 | |||||||||
| Numerator for basic and diluted loss per share |
||||||||||||
| Net loss |
$ | (93,115 | ) | $ | (13,072 | ) | $ | (51,059 | ) | |||
| Less: Dividends declared—common and restricted shares |
(50,877 | ) | (28,343 | ) | — | |||||||
|
|
|
|
|
|
|
|||||||
| Undistributed earnings |
(143,992 | ) | (41,415 | ) | (51,059 | ) | ||||||
| Percentage allocated to common shares(a) |
100.0 | % | 100.0 | % | 100.0 | % | ||||||
|
|
|
|
|
|
|
|||||||
| Undistributed earnings—common shares |
(143,992 | ) | (41,415 | ) | (51,059 | ) | ||||||
| Add: Dividends declared—common shares |
50,877 | 28,343 | — | |||||||||
|
|
|
|
|
|
|
|||||||
| Numerator for common shares outstanding excluding participating shares |
(93,115 | ) | (13,072 | ) | (51,059 | ) | ||||||
| Numerator for participating unvested shares only |
— | — | — | |||||||||
|
|
|
|
|
|
|
|||||||
| Numerator for basic and diluted loss per share—total |
$ | (93,115 | ) | $ | (13,072 | ) | $ | (51,059 | ) | |||
|
|
|
|
|
|
|
|||||||
| Denominator for basic and diluted weighted-average shares outstanding |
||||||||||||
| Common shares outstanding |
76,259 | 75,422 | 74,692 | |||||||||
| Participating unvested shares(b) |
— | — | — | |||||||||
| Basic and diluted weighted-average common shares outstanding—total(b) |
76,259 | 75,422 | 74,692 | |||||||||
| Loss per share—basic and diluted |
$ | (1.22 | ) | $ | (0.17 | ) | $ | (0.68 | ) | |||
|
(a) Basic and diluted weighted-average common shares: |
||||||||||||
| Weighted-average common shares outstanding |
76,259 | 75,422 | 74,692 | |||||||||
| Weighted-average restricted shares |
— | — | — | |||||||||
|
|
|
|
|
|
|
|||||||
| Total basic and diluted(b) weighted-average common shares |
76,259 | 75,422 | 74,692 | |||||||||
|
|
|
|
|
|
|
|||||||
| Percentage allocated to common shares |
100.0 | % | 100.0 | % | 100.0 | % | ||||||
| (b) | For the years ended December 31, 2011, 2010 and 2009, we excluded 735, 1,085, and 1,287 of weighted-average shares of restricted common stock from the calculation of diluted loss per share because the inclusion of these shares would have had an anti-dilutive impact on the calculation of loss per share. |
Holders of unvested shares of our issued and outstanding restricted common stock are eligible to receive non-forfeitable dividends. As such, these unvested shares are participating securities requiring the two-class method of computing earnings per share. Pursuant to the two-class method, we report basic and diluted earnings per share both inclusive and exclusive of the participating securities.
NOTE 13—COMMITMENTS AND CONTINGENCIES
LEGAL PROCEEDINGS
We are a party to certain legal proceedings incidental to the normal course of our business, including the enforcement of our rights under contracts with our portfolio companies. While the outcome of these legal proceedings cannot at this time be predicted with certainty, we do not expect that these proceedings will have a material effect on our financial condition or results of operations.
FINANCIAL INSTRUMENTS
During the normal course of business, we are party to certain financial instruments, including loans, participations in loans, guarantees, letters of credit and other financial commitments. We conduct extensive due diligence and, when appropriate, obtain collateral to limit our credit risk. Generally, these commitments have fixed expiration dates or other termination clauses, which may require payment of a fee by the counterparty. We expect many of these commitments will not be fully used before they expire; therefore, the total commitment amounts do not necessarily represent future cash requirements.
113
Table of Contents
We do not report the unused portions of these commitments on our Consolidated Balance Sheets. As of December 31, 2011 and 2010, we had $22.6 million and $32.3 million, respectively, of outstanding unused loan commitments. We estimate that for both December 31, 2011 and 2010 the fair value of these commitments were $0.1 million and $0.2 million, respectively, based on the fees that we currently charge to enter into similar arrangements, taking into account the creditworthiness of the counterparties. As of December 31, 2011 and 2010, we had no outstanding guarantees or standby letters of credit.
LEASE OBLIGATIONS
We lease our headquarters and certain other facilities under non-cancelable operating leases which expire through 2013. We have sublet certain of our facilities to third parties. Future minimum lease payments for non-cancelable leases with terms of one year or more are as follows:
| (in thousands) |
Lease Commitments |
Sublease | Lease Commitments Less Sublease |
|||||||||
| Year ending December 31, |
||||||||||||
| 2012 |
$ | 2,137 | $ | (60 | ) | $ | 2,077 | |||||
| 2013 |
392 | — | 392 | |||||||||
|
|
|
|
|
|
|
|||||||
| Total |
$ | 2,529 | $ | (60 | ) | $ | 2,469 | |||||
|
|
|
|
|
|
|
|||||||
Certain leases contain provisions for rental options and rent escalations based on scheduled increases, as well as increases resulting from a rise in certain costs incurred by the lessor. During the years ended December 31, 2011, 2010 and 2009, our rent expense totaled $1.8 million, $1.7 million and $1.8 million, respectively.
114
Table of Contents
NOTE 14—FINANCIAL HIGHLIGHTS
Following schedule summarizes financial highlights for the five years ended December 31, 2011:
| Years Ended December 31, | ||||||||||||||||||||
| (in thousands, except per share amounts) |
2011 | 2010 | 2009 | 2008 | 2007 | |||||||||||||||
| PER SHARE DATA |
||||||||||||||||||||
| Net asset value at beginning of year(a) |
$ | 7.54 | $ | 8.06 | $ | 8.66 | $ | 12.73 | $ | 12.83 | ||||||||||
|
|
|
|
|
|
|
|
|
|
|
|||||||||||
| Net (loss) income(b) |
||||||||||||||||||||
| Net operating income before investment (loss) gain, (loss) gain on extinguishment of debt and income tax provision (benefit) |
0.49 | 0.54 | 0.51 | 0.78 | 1.55 | |||||||||||||||
| Net change in unrealized (depreciation) appreciation on investments |
(0.51 | ) | (0.88 | ) | 1.31 | (3.44 | ) | (0.53 | ) | |||||||||||
| Net realized (loss) gain on investments |
(1.19 | ) | 0.15 | (2.57 | ) | (0.13 | ) | 0.34 | ||||||||||||
| (Loss) gain on extinguishment of debt |
(0.01 | ) | 0.04 | 0.07 | 0.15 | — | ||||||||||||||
| Income tax provision |
— | (0.02 | ) | — | (0.01 | ) | (0.04 | ) | ||||||||||||
|
|
|
|
|
|
|
|
|
|
|
|||||||||||
| Net (loss) income |
(1.22 | ) | (0.17 | ) | (0.68 | ) | (2.65 | ) | 1.32 | |||||||||||
|
|
|
|
|
|
|
|
|
|
|
|||||||||||
| Net decrease in net assets resulting from distributions |
||||||||||||||||||||
| From net investment income |
(0.28 | ) | (0.37 | ) | — | — | (1.41 | ) | ||||||||||||
| From capital gains |
— | — | — | — | (0.35 | ) | ||||||||||||||
| From return of capital |
(0.38 | ) | — | — | (0.71 | ) | — | |||||||||||||
| Effect of stock offerings after record dates(c) |
— | — | — | — | 0.02 | |||||||||||||||
|
|
|
|
|
|
|
|
|
|
|
|||||||||||
| Net decrease in net assets resulting from distributions |
(0.66 | ) | (0.37 | ) | — | (0.71 | ) | (1.74 | ) | |||||||||||
|
|
|
|
|
|
|
|
|
|
|
|||||||||||
| Net (decrease) increase in net assets relating to stock-based transactions |
||||||||||||||||||||
| Issuance of shares of common stock |
— | — | — | (0.50 | ) | 2.91 | ||||||||||||||
| Issuance of shares of restricted common stock(d) |
(0.04 | ) | (0.04 | ) | — | (0.35 | ) | (2.83 | ) | |||||||||||
| Net increase in stockholders’ equity from restricted stock amortization |
0.03 | 0.06 | 0.11 | 0.10 | 0.14 | |||||||||||||||
| Net (decrease) increase in stockholders’ equity from other stock transactions(b) |
— | — | (0.03 | ) | 0.04 | 0.10 | ||||||||||||||
|
|
|
|
|
|
|
|
|
|
|
|||||||||||
| Net (decrease) increase in net assets relating to share issuances |
(0.01 | ) | 0.02 | 0.08 | (0.71 | ) | 0.32 | |||||||||||||
|
|
|
|
|
|
|
|
|
|
|
|||||||||||
| Net asset value at end of year(a) |
$ | 5.65 | $ | 7.54 | $ | 8.06 | $ | 8.66 | $ | 12.73 | ||||||||||
|
|
|
|
|
|
|
|
|
|
|
|||||||||||
| MARKET PRICE PER SHARE AT END OF YEAR |
$ | 3.99 | $ | 6.97 | $ | 4.32 | $ | 0.71 | $ | 11.59 | ||||||||||
| TOTAL RETURN(e) |
(33.72 | )% | 66.67 | % | 508.45 | % | (87.75 | )% | (34.30 | )% | ||||||||||
| SHARES OF COMMON STOCK OUTSTANDING |
||||||||||||||||||||
| Weighted-average (diluted) |
76,259 | 75,422 | 74,692 | 72,254 | 65,606 | |||||||||||||||
| End of year |
76,997 | 76,662 | 76,394 | 76,075 | 65,587 | |||||||||||||||
| NET ASSETS |
||||||||||||||||||||
| Average |
$ | 534,240 | $ | 611,084 | $ | 620,243 | $ | 788,036 | $ | 800,127 | ||||||||||
| End of year |
$ | 434,952 | $ | 578,016 | $ | 615,683 | $ | 658,911 | $ | 834,689 | ||||||||||
| RATIO |
||||||||||||||||||||
| Operating expenses to average net assets |
8.99 | % | 8.02 | % | 9.94 | % | 10.06 | % | 10.65 | % | ||||||||||
| Net operating income to average net assets |
7.05 | % | 6.64 | % | 6.16 | % | 7.12 | % | 12.74 | % | ||||||||||
| General and administrative expense to average net assets |
2.63 | % | 1.88 | % | 2.52 | % | 2.11 | % | 1.41 | % | ||||||||||
| Return on average equity |
(17.43 | )% | (2.14 | )% | (8.23 | )% | (24.27 | )% | 10.83 | % | ||||||||||
| (a) | Based on total shares outstanding. |
| (b) | Based on weighted-average shares outstanding. |
| (c) | The effect on distributions of stock offerings after record dates represents the effect on net asset value of issuing additional shares after the record date of a distribution. |
| (d) | Represents the effects of shares issued during the period and the lapsing of forfeiture provisions on restricted stock on earnings per share. |
| (e) | Total return = [(ending market price per share – beginning market price per share + dividends paid per share) / beginning market price]. |
115
Table of Contents
NOTE 15—SELECTED QUARTERLY DATA (UNAUDITED)
The following tables summarize key unaudited financial information for the eight quarters ended December 31, 2011. Results for any quarter are not necessarily indicative of results for the full year or for any future quarter.
| 2011 Quarters | 2010 Quarters | |||||||||||||||||||||||||||||||
| (in thousands, except per share amounts) |
Fourth | Third | Second | First | Fourth | Third | Second | First | ||||||||||||||||||||||||
| INCOME STATEMENT DATA |
||||||||||||||||||||||||||||||||
| Revenue |
$ | 19,475 | $ | 20,710 | $ | 21,208 | $ | 24,303 | $ | 23,484 | $ | 22,571 | $ | 21,768 | $ | 21,746 | ||||||||||||||||
| Net operating income before investment loss, (loss) gain on extinguishment of debt and income tax provision (benefit) |
7,464 | 5,953 | 11,238 | 13,003 | 11,876 | 11,400 | 8,850 | 8,439 | ||||||||||||||||||||||||
| Net (loss) income |
$ | (48,973 | ) | $ | (25,109 | ) | $ | (10,218 | ) | $ | (8,815 | ) | $ | (17,748 | ) | $ | (529 | ) | $ | (750 | ) | $ | 5,955 | |||||||||
| (Loss) earnings per common share—basic and diluted |
$ | (0.64 | ) | $ | (0.33 | ) | $ | (0.13 | ) | $ | (0.12 | ) | $ | (0.23 | ) | $ | (0.01 | ) | $ | (0.01 | ) | $ | 0.08 | |||||||||
| WEIGHTED-AVERAGE COMMON SHARES OUTSTANDING—BASIC AND DILUTED |
76,514 | 76,404 | 76,343 | 75,765 | 75,648 | 75,486 | 75,392 | 76,339 | ||||||||||||||||||||||||
NOTE 16—SUBSEQUENT EVENTS
AMENDED WAREHOUSE SALE AND SERVICING AGREEMENT
In January 2012, we entered into an amendment to the SunTrust Warehouse to accelerate the termination date of the facility to January 17, 2012. The facility entered a 24-month amortization period and the new legal final maturity date is January 17, 2014. In connection with the execution of the amendment, $4.8 million from the principal collections account in the MCG Commercial Loan Funding Trust was used to reduce the outstanding advances from the SunTrust Warehouse. After this repayment, the new balance of the outstanding advances from the SunTrust Warehouse is $51.1 million. All future principal collections will be used to further reduce the balance of the outstanding advances. The SunTrust Warehouse is non-recourse to us; therefore, in the event of a termination event or upon the legal final maturity date, the lenders under the warehouse facility may only look to the collateral to satisfy the outstanding obligations under this facility.
We also agreed to a number of modifications to the SunTrust Warehouse terms, including a decrease in the required amount of the minimum consolidated tangible net worth of the Company from $450 million plus 50% of any equity raised after February 26, 2009 to $375 million plus 50% of any equity raised after February 26, 2009. The amendment also removed certain requirements that were to be met in order for the pool of commercial loans in the Trust to be fully included in the borrowing base, such as those relating to average loan amount limit and obligor residency and industry diversity. In addition, SunTrust approved Richard W. Neu, our Chief Executive Officer, as an acceptable replacement for Steven F. Tunney in the management of the Company, and the amendment modified the key man provision to include Stephen Bacica, our Chief Financial Officer, in addition to B. Hagen Saville, our President and Chief Operating Officer, and Richard W. Neu.
We paid to SunTrust an amendment fee of $0.5 million, or 1.0% of the advances outstanding after the repayments related to the amendment. In addition, due to the reduction of the facility we will recognize in interest expense approximately $1.5 million of accelerated deferred financing fees in the first quarter of 2012. The interest rate margin on outstanding advances, which accrue interest based on the commercial paper or eurodollar rate, is 3.25%.
PAY-OFF OF PRIVATE PLACEMENT NOTES
On January 17, 2012, we repaid in full and terminated the Series 2007-A unsecured notes. In connection with the termination of the notes and pursuant to the terms of a prepayment and waiver agreement with the noteholders, we paid to the noteholders $8.7 million of principal, $0.2 million in accrued interest and $0.2 million in prepayment fees.
STOCK REPURCHASE PLAN
On January 17, 2012, our board of directors authorized a stock repurchase program of up to $35.0 million. Under the program, we are authorized to repurchase shares in open market transactions, including through block purchases, depending on prevailing market conditions and other factors. The repurchase program may be extended, modified or discontinued at any time for any reason. The program does not obligate us to acquire any specific number of shares, and all repurchases will be made in accordance with SEC Rule 10b-18, which sets certain restrictions on the method, timing, price and volume of stock repurchases. As of March 1, 2012, no shares have been repurchased.
116
Table of Contents
DRAW OF SBA COMMITMENT
As of December 31, 2011, The SBA had approved and committed $150.0 million in borrowings to us through Solutions Capital. As of December 31, 2011, $128.6 million of SBA borrowings were outstanding. In January 2012, Solutions Capital borrowed the remaining $21.4 million of the commitment. The new borrowings bear an interim financing rate of 1.3%. The rate will become fixed at the time of SBA pooling, which is within nine months of funding, and is set to the then-current 10-year treasury rate plus a spread and an annual SBA charge.
PORTFOLIO INVESTMENTS
In February 2012, we accepted $23.7 million for our senior preferred stock and warrant position in Jenzabar. This amount resulted in an $11.0 million unrealized depreciation during 2011 of our investment in Jenzabar. The consideration received also settled any and all direct claims and counterclaims asserted in the litigation by and among the Company, Jenzabar and certain Jenzabar officers and directors. We will receive the balance of the payment for our position in Jenzabar in the amount of $990,000 for our subordinated preferred stock and will exchange those shares upon the final dismissal of the litigation, including the dismissal of the derivative claims.
117
Table of Contents
| ITEM 9. | CHANGES IN AND DISAGREEMENTS WITH ACCOUNTANTS ON ACCOUNTING AND FINANCIAL DISCLOSURE. |
None.
| ITEM 9A. | CONTROLS AND PROCEDURES. |
| 1. | Disclosure Controls and Procedures. |
Our management, with the participation of our Chief Executive Officer, Chief Financial Officer and Chief Accounting Officer, evaluated the effectiveness of our disclosure controls and procedures as of December 31, 2011. The term “disclosure controls and procedures” (as defined in Rules 13a-15(e) and 15d-15(e) under the Exchange Act) means controls and other procedures of a company that are designed to ensure that information required to be disclosed by a company in reports that it files or submits under the Exchange Act is recorded, processed, summarized and reported, within the time periods specified in the SEC’s rules and forms. Disclosure controls and procedures include, without limitation, controls and procedures designed to ensure that information required to be disclosed by a company in the reports that it files or submits under the Exchange Act is accumulated and communicated to the company’s management, including its principal executive and principal financial officers, as appropriate to allow timely decisions regarding required disclosure.
Management recognizes that any controls and procedures, no matter how well designed and operated, can provide only reasonable assurance of achieving their objectives and management necessarily applies its judgment in evaluating the cost-benefit relationship of possible controls and procedures. Based on the foregoing evaluation of our disclosure controls and procedures as of December 31, 2011, our Chief Executive Officer, our Chief Financial Officer and our Chief Accounting Officer concluded that, as of such date, our disclosure controls and procedures were effective at the reasonable assurance level.
| 2. | Internal Control Over Financial Reporting. |
(a) MANAGEMENT’S ANNUAL REPORT ON INTERNAL CONTROL OVER FINANCIAL REPORTING
Our management is responsible for establishing and maintaining adequate internal control over financial reporting for the Company. Internal control over financial reporting is defined in Rule 13a-15(f) or 15d-15(f) promulgated under the Exchange Act as a process designed by, or under the supervision of, the company’s principal executive and principal financial officers and effected by the company’s board of directors, management and other personnel, to provide reasonable assurance regarding the reliability of financial reporting and the preparation of financial statements for external purposes in accordance with generally accepted accounting principles and includes those policies and procedures that:
| • | pertain to the maintenance of records that in reasonable detail accurately and fairly reflect the transactions and dispositions of the assets of the company; |
| • | provide reasonable assurance that transactions are recorded as necessary to permit preparation of financial statements in accordance with generally accepted accounting principles, and that receipts and expenditures of the company are being made only in accordance with authorizations of management and directors of the company; and |
| • | provide reasonable assurance regarding prevention or timely detection of unauthorized acquisition, use or disposition of the company’s assets that could have a material effect on the financial statements. |
Because of its inherent limitations, internal control over financial reporting may not prevent or detect misstatements. Projections of any evaluation of effectiveness to future periods are subject to the risk that controls may become inadequate because of changes in conditions, or that the degree of compliance with the policies or procedures may deteriorate.
Our management, including the supervision and participation of the Chief Executive Officer, Chief Financial Officer and Chief Accounting Officer, assessed the effectiveness of our internal control over financial reporting as of December 31, 2011. In making this assessment, our management used the criteria set forth by the Committee of Sponsoring Organizations of the Treadway Commission (COSO) in “Internal Control—Integrated Framework.”
Based on our assessment, management concluded that, as of December 31, 2011, our internal control over financial reporting is effective based on those criteria.
118
Table of Contents
Our independent registered public accounting firm has issued an attestation report with regard to our internal control over financial reporting.
(b) ATTESTATION REPORT OF THE REGISTERED PUBLIC ACCOUNTING FIRM
The attestation report of our independent registered public accounting firm regarding our internal control over financial reporting appears on page 75.
(c) CHANGES IN INTERNAL CONTROL OVER FINANCIAL REPORTING
No change in our internal control over financial reporting (as defined in Rules 13a-15(f) and 15d-15(f) under the Exchange Act), occurred during the fiscal quarter ended December 31, 2011 that has materially affected, or is reasonably likely to materially affect, our internal control over financial reporting.
| ITEM 9B. | OTHER INFORMATION |
None.
119
Table of Contents
| ITEM 10. | DIRECTORS, EXECUTIVE OFFICERS AND CORPORATE GOVERNANCE. |
The information relating to our directors, nominees for election as directors, executive officers and audit committee under the headings Election of Directors, Corporate Governance—Our Executive Officers, Corporate Governance—Section 16(a) Beneficial Ownership Reporting Compliance and Corporate Governance—Board Committees in our definitive proxy statement for the 2012 Annual Meeting of Stockholders is incorporated herein by reference to such proxy statement.
We have adopted a written code of business conduct and ethics that applies to our directors, officers and employees, including our principal executive officer, principal financial officer, principal accounting officer or controller, or persons performing similar functions. We make available our code of business conduct and ethics free of charge through our website which is located at www.mcgcapital.com. We are not including the information contained on our website as a part of, or incorporating it by reference into, this Annual Report on Form 10-K. We intend to disclose any amendments to, or waivers from, our code of business conduct and ethics that are required to be publicly disclosed pursuant to rules of the Securities and Exchange Commission and the NASDAQ Global Select Market by filing such amendment or waiver with the Securities and Exchange Commission and by posting it on our website.
We made no material change to the procedures by which stockholders may recommend nominees to our board of directors, as described in our 2011 proxy statement.
| ITEM 11. | EXECUTIVE COMPENSATION. |
The discussion under the headings Executive Compensation, Compensation of Directors, Compensation Committee Report, Compensation Committee Interlocks and Insider Participation, and Narrative Disclosure of Our Compensation Policies and Practices as They Relate to Risk Management in our definitive proxy statement for the 2012 Annual Meeting of Stockholders is incorporated herein by reference to such proxy statement.
| ITEM 12. | SECURITY OWNERSHIP OF CERTAIN BENEFICIAL OWNERS AND MANAGEMENT AND RELATED STOCKHOLDER MATTERS. |
The discussion under the heading Security Ownership of Certain Beneficial Owners and Management and Related Stockholder Matters in our definitive proxy statement for the 2012 Annual Meeting of Stockholders is incorporated herein by reference to such proxy statement.
| ITEM 13. | CERTAIN RELATIONSHIPS AND RELATED TRANSACTIONS, AND DIRECTOR INDEPENDENCE. |
The discussion under the headings Certain Relationships and Related Transactions; Policies and Procedures for Related Person Transactions and Corporate Governance—Board Determination of Independence in our definitive proxy statement for the 2012 Annual Meeting of Stockholders is incorporated herein by reference to such proxy statement.
| ITEM 14. | PRINCIPAL ACCOUNTANT FEES AND SERVICES. |
The discussion under the heading Ratification of Selection of Independent Registered Public Accounting Firm—Auditors’ Fees and—Pre-Approval Policies and Procedures in our definitive proxy statement for the 2012 Annual Meeting of Stockholders is incorporated herein by reference to such proxy statement.
120
Table of Contents
| ITEM 15. | EXHIBITS AND FINANCIAL STATEMENT SCHEDULES |
| Page | ||||||
| 1. |
The following financial statements are filed herewith: |
|||||
| 75 | ||||||
| Consolidated Balance Sheets as of December 31, 2011 and 2010 |
77 | |||||
| Consolidated Statements of Operations for the years ended December 31, 2011, 2010 and 2009 |
78 | |||||
| 79 | ||||||
| Consolidated Statements of Cash Flows for the years ended December 31, 2011, 2010 and 2009 |
80 | |||||
| Consolidated Schedule of Investments as of December 31, 2011 |
81 | |||||
| Consolidated Schedule of Investments as of December 31, 2010 |
84 | |||||
| 89 | ||||||
| 2. | The following financial statement schedules are filed herewith: | |||||
| 123 | ||||||
| 3. |
125 | |||||
121
Table of Contents
Report of Independent Registered Public Accounting Firm
Board of Directors and Stockholders
MCG Capital Corporation
We have audited the consolidated balance sheets of MCG Capital Corporation (the Company), including the consolidated schedules of investments, as of December 31, 2011 and 2010, and the related consolidated statements of operations, changes in net assets, and cash flows for each of the three years in the period ended December 31, 2011, and the consolidated financial highlights for each of the five years in the period ended December 31, 2011, and have issued our report thereon dated March 1, 2012 (included elsewhere in this Form 10-K). Our audits also included the Schedule 12-14 listed in Item 15 of this Form 10-K. The Schedule 12-14 is the responsibility of the Company’s management. Our responsibility is to express an opinion based on our audits.
In our opinion, the Schedule 12-14 referred to above, when considered in relation to the basic financial statements taken as a whole, presents fairly in all material respects the information set forth therein.
/s/ Ernst & Young LLP
McLean, Virginia
March 1, 2012
122
Table of Contents
MCG Capital Corporation
SCHEDULE OF INVESTMENTS IN AND ADVANCES TO AFFILIATES
| (in thousands) |
Year Ended December 31, 2011 |
As of December 31, 2010 Fair Value |
As of December 31, 2011 Fair Value |
|||||||||||||||||||
| Portfolio Company |
Investment(a) | Amount of Interest or Dividends Credited to Income(e) |
Gross Additions(b) |
Gross Reductions(c) |
||||||||||||||||||
| Control Investments: Majority-owned |
||||||||||||||||||||||
| Avenue Broadband LLC |
Subordinated Debt | $ | 684 | $ | 15,115 | $ | 289 | $ | (15,404 | ) | $ | — | ||||||||||
| Preferred Units | 727 | 35,371 | 727 | (36,098 | ) | — | ||||||||||||||||
| Warrants to purchase Class B Common Stock |
— | — | — | — | — | |||||||||||||||||
| Broadview Networks Holdings, Inc. |
Series A Preferred Stock | — | 47,477 | — | (42,462 | ) | 5,015 | |||||||||||||||
| Series A-1 Preferred Stock | — | 54,794 | — | (49,006 | ) | 5,788 | ||||||||||||||||
| Series B Preferred Stock | — | 698 | — | (624 | ) | 74 | ||||||||||||||||
| Class A Common Stock | — | — | — | — | — | |||||||||||||||||
| GMC Television Broadcasting, LLC |
Senior Debt | 936 | 21,656 | 1,129 | (5,618 | ) | 17,167 | |||||||||||||||
| Subordinated Debt(d) | — | — | — | — | — | |||||||||||||||||
| Subordinated Unsecured Debt(d) | — | — | — | — | — | |||||||||||||||||
| Class B Voting Units | — | — | — | — | — | |||||||||||||||||
| Intran Media, LLC |
Senior Debt | 237 | 7,430 | 2,974 | (10,404 | ) | — | |||||||||||||||
| Preferred A Units | — | — | 400 | — | 400 | |||||||||||||||||
| Preferred B Units | — | — | — | — | — | |||||||||||||||||
| Preferred C Units | — | — | 1,250 | (1,250 | ) | — | ||||||||||||||||
| Jet Plastica Investors, LLC |
Senior Debt(d) | 1,185 | 13,990 | 17,268 | (22,113 | ) | 9,145 | |||||||||||||||
| Subordinated Debt(d) | — | 7,143 | 161 | (7,304 | ) | — | ||||||||||||||||
| Preferred LLC Interest | — | — | — | — | — | |||||||||||||||||
| MTP Holding, LLC |
Common LLC Interest | — | — | — | — | — | ||||||||||||||||
| Orbitel Holdings, LLC |
Senior Debt | 1,718 | 14,874 | 3,823 | (185 | ) | 18,512 | |||||||||||||||
| Preferred LLC Interest | 792 | 13,515 | 5,575 | — | 19,090 | |||||||||||||||||
| PremierGarage Holdings, LLC |
Senior Debt(d) | — | 5,916 | 3,581 | (9,497 | ) | — | |||||||||||||||
| Preferred LLC Units | — | — | — | — | — | |||||||||||||||||
| Common LLC Units | — | — | — | — | — | |||||||||||||||||
| RadioPharmacy Investors, LLC |
Senior Debt | 623 | 8,500 | — | (324 | ) | 8,176 | |||||||||||||||
| Subordinated Debt | 1,586 | 10,357 | 325 | (327 | ) | 10,355 | ||||||||||||||||
| Preferred LLC Interest | 1,603 | 7,219 | 8,707 | — | 15,926 | |||||||||||||||||
| Superior Industries Investors, LLC |
Subordinated Debt | 748 | 23,603 | 449 | (24,052 | ) | — | |||||||||||||||
| Preferred Units | 229 | 19,283 | 229 | (19,512 | ) | — | ||||||||||||||||
| Total Sleep Holdings, Inc.(f) |
Subordinated Debt(d) | — | — | — | — | — | ||||||||||||||||
| Unsecured Notes | — | — | — | — | — | |||||||||||||||||
| Series A Preferred Stock | — | — | — | — | — | |||||||||||||||||
| Series B Preferred Stock | — | — | — | — | — | |||||||||||||||||
| Common Stock | — | — | — | — | — | |||||||||||||||||
|
|
|
|
|
|
|
|
|
|
|
|||||||||||||
| Total Control Investments: Majority-owned |
11,068 | 306,941 | 46,887 | (244,180 | ) | 109,648 | ||||||||||||||||
|
|
|
|
|
|
|
|
|
|
|
|||||||||||||
| Control Investments: Non-majority owned |
||||||||||||||||||||||
| National Product Services, Inc. |
Senior Debt(d) | — | 3,348 | 19,681 | (13,414 | ) | 9,615 | |||||||||||||||
| Series A Preferred Units | — | — | 50 | (50 | ) | — | ||||||||||||||||
| Series B Preferred Units | — | — | — | — | — | |||||||||||||||||
| Common Units | — | — | — | — | — | |||||||||||||||||
|
|
|
|
|
|
|
|
|
|
|
|||||||||||||
| Total Control Investments: Non-majority owned |
— | 3,348 | 19,731 | (13,464 | ) | 9,615 | ||||||||||||||||
|
|
|
|
|
|
|
|
|
|
|
|||||||||||||
| Total Control Investments |
$ | 11,068 | $ | 310,289 | $ | 66,618 | $ | (257,644 | ) | $ | 119,263 | |||||||||||
|
|
|
|
|
|
|
|
|
|
|
|||||||||||||
123
Table of Contents
MCG Capital Corporation
SCHEDULE OF INVESTMENTS IN AND ADVANCES TO AFFILIATES
| (in thousands) |
Year Ended December 31, 2011 |
As of December 31, 2010 Fair Value |
As of December 31, 2011 Fair Value |
|||||||||||||||||||
| Portfolio Company |
Investment(a) | Amount of Interest or Dividends Credited to Income(e) |
Gross Additions(b) |
Gross Reductions(c) |
||||||||||||||||||
| Affiliate Investments |
||||||||||||||||||||||
| Advanced Sleep Concepts, Inc. |
Senior Debt | $ | 938 | $ | 5,322 | $ | 1,476 | $ | (947 | ) | $ | 5,851 | ||||||||||
| Subordinated Debt | 750 | 5,274 | 340 | — | 5,614 | |||||||||||||||||
| Series A Preferred Stock | 47 | 104 | 47 | (90 | ) | 61 | ||||||||||||||||
| Series B Preferred Stock | — | — | 270 | — | 270 | |||||||||||||||||
| Common Stock | — | — | — | — | — | |||||||||||||||||
| Warrants to purchase Common Stock | — | — | — | — | — | |||||||||||||||||
| Cherry Hill Holdings Inc. |
Series A Preferred Stock | 616 | 1,076 | 616 | (1,692 | ) | — | |||||||||||||||
| Contract Datascan Holdings, Inc. |
Subordinated Debt | 1,250 | 7,074 | 765 | (486 | ) | 7,353 | |||||||||||||||
| Series A Preferred Stock | 81 | 1,983 | 405 | (457 | ) | 1,931 | ||||||||||||||||
| Common Stock | — | 410 | 67 | (477 | ) | — | ||||||||||||||||
| Stratford School Holdings, Inc. |
Senior Debt | 1,464 | 18,885 | 2,527 | (4,000 | ) | 17,412 | |||||||||||||||
| Series A Convertible Preferred Stock | 120 | 8,534 | 1,657 | — | 10,191 | |||||||||||||||||
| Warrants to purchase Common Stock | — | 2,910 | 177 | — | 3,087 | |||||||||||||||||
| Sunshine Media Delaware, LLC |
Common Stock | — | 116 | 448 | (564 | ) | — | |||||||||||||||
| Class A LLC Interest | — | 112 | 469 | (581 | ) | — | ||||||||||||||||
| Options to acquire Warrants to purchase Class B LLC Interest |
— | — | — | — | — | |||||||||||||||||
| Velocity Technology Enterprises, Inc. |
Series A Preferred Stock | — | 1,500 | — | (1,500 | ) | — | |||||||||||||||
|
|
|
|
|
|
|
|
|
|
|
|||||||||||||
| Total Affiliate Investments |
$ | 5,266 | $ | 53,300 | $ | 9,264 | $ | (10,794 | ) | $ | 51,770 | |||||||||||
|
|
|
|
|
|
|
|
|
|
|
|||||||||||||
This schedule should be read in conjunction with our Consolidated Financial Statements, including our Consolidated Schedule of Investments and Notes 3 and 4 to the Consolidated Financial Statements.
| (a) | Common stock, warrants, options and, in some cases, preferred stock generally are non-income producing and restricted. The principal amount of the debt and the number of shares of common stock and preferred stock are shown in the Consolidated Schedule of Investments as of December 31, 2011. |
| (b) | Gross additions include increases in investments resulting from new portfolio company investments, paid-in-kind interest or dividends, amortization of discounts and fees, and exchange of one or more existing securities for one or more new securities. Gross additions also include net changes in unrealized appreciation (depreciation). |
| (c) | Gross reductions include decreases in investments resulting from principal collections related to investment repayments or sales and the exchange of one or more existing securities for one or more new securities. Gross reductions also include net increases in unrealized depreciation or net decreases in unrealized appreciation. |
| (d) | All or part of this debt is on non-accrual status as of December 31, 2011, and, therefore, is considered non-income producing. |
| (e) | Represents the total amount of interest or dividends credited to income for the portion of the year an investment was a control investment (more than 25% owned) or an affiliate investment (5% to 25% owned), respectively. All dividend income is non-cash unless otherwise noted. |
| (f) | In 2011, we wrote-off our investment in Total Sleep Holdings, Inc., which had zero fair value as of December 31, 2010. |
| ** | Information related to the amount of equity in the net profit and loss for the period for the investments listed has not been included in this schedule. This information is not considered to be meaningful due to the complex capital structures of the portfolio companies, with different classes of equity securities outstanding with different preferences in liquidation. These investments are neither consolidated nor accounted for under the equity method of accounting. |
124
Table of Contents
The following table lists exhibits filed as part of this report, according to the number assigned to them in Item 601 of Regulation S-K. All exhibits listed in the following table are incorporated by reference except for those exhibits denoted in the last column. Please note that the agreements included as exhibits to this Form 10-K are included to provide information regarding their terms and are not intended to provide any other factual or disclosure information about us or the other parties to the agreements. The agreements contain representations and warranties by each of the parties to the applicable agreement that have been made solely for the benefit of the other parties to the applicable agreement and may not describe the actual state of affairs as of the date they were made or at any other time.
| Incorporated by Reference |
||||||||||
| Exhibit No. |
Description |
Form and SEC File No. |
Filing Date with SEC |
Exhibit No. |
Filed with this 10-K | |||||
| Certificate of Incorporation and Bylaws | ||||||||||
| 3.1 | Restated Certificate of Incorporation of MCG Capital Corporation | 8-K (0-33377) |
May 31, 2005 | 3.1 | ||||||
| 3.2 | Amended and Restated Bylaws of MCG Capital Corporation | 8-K (0-33377) |
October 30, 2009 | 3.1 | ||||||
| Instruments Defining the Rights of Security Holders | ||||||||||
| 4.1 | Specimen Common Stock Certificate | N-2 (333-64596) |
November 1, 2001 | 99.d.1 | ||||||
| 4.2 | Third Amended and Restated Registration Rights Agreement by and among MCG Capital Corporation and certain stockholders | 10-K (0-33377) |
April 1, 2002 | 10.1 | ||||||
| Material Contracts—Purchase, Financing and Credit Agreements | ||||||||||
| 10.1 | Corporate Custodial Agreement between MCG Capital Corporation and Riggs Bank, N.A. | 10-K (0-33377) |
April 1, 2002 | 10.45 | ||||||
| 10.2 | Amended and Restated Custody Agreement by and between MCG Capital Corporation and Wells Fargo Bank, National Association, dated December 11, 2008 | 10-K (0-33377) |
March 9, 2009 | 10.2 | ||||||
| 10.3 | Amended and Restated Sale and Servicing Agreement by and among MCG Capital Corporation, MCG Commercial Loan Funding Trust, Three Pillars Funding LLC, SunTrust Robinson Humphrey, Inc. and Wells Fargo Bank, National Association, dated as of February 26, 2009 | 8-K (0-33377) |
February 27, 2009 | 10.2 | ||||||
| 10.4 | Amendment No. 1 to Amended and Restated Sale and Servicing Agreement by and among MCG Capital Corporation, MCG Commercial Loan Funding Trust, Three Pillars Funding LLC, SunTrust Robinson Humphrey, Inc. and Wells Fargo Bank, National Association, dated as of February 17, 2010 | 8-K (0-33377) |
February 18, 2010 | 10.1 | ||||||
| 10.5 | Amendment No. 2 to Amended and Restated Sale and Servicing Agreement by and among MCG Capital Corporation, MCG Commercial Loan Funding Trust, Three Pillars Funding LLC, SunTrust Robinson Humphrey, Inc. and Wells Fargo Bank, National Association, dated as of January 25, 2011 | 8-K (0-33377) |
January 27, 2011 | 10.1 | ||||||
| 10.6 | Amendment No. 3 to Amended and Restated Sale and Servicing Agreement by and among MCG Capital Corporation, MCG Commercial Loan Funding Trust; Three Pillars Funding LLC; SunTrust Robinson Humphrey, Inc. and Wells Fargo Bank, National Association, dated as of May 5, 2011 | 10-Q (0-33377) |
August 4, 2011 | 10.1 | ||||||
| 10.7 | Amendment No. 4 to Amended and Restated Sale and Servicing Agreement by and among MCG Capital Corporation, MCG Commercial Loan Funding Trust; Three Pillars Funding LLC; SunTrust Robinson Humphrey, Inc. and Wells Fargo Bank, National Association, dated as of January 17, 2012 | 8-K (0-33377) |
January 17, 2012 | 10.1 | ||||||
| 10.8 | Indenture by and between MCG Commercial Loan Trust 2006-1 and Wells Fargo Bank, National Association, dated as of April 18, 2006 | N-2 (333-133669) |
May 1, 2006 | 99.f.24 | ||||||
| 10.9 | Collateral Management Agreement, by and between MCG Commercial Loan Trust 2006-1 and MCG Capital Corporation, dated as of April 18, 2006 | N-2 (333-133669) |
May 1, 2006 | 99.f.25 | ||||||
125
Table of Contents
| Incorporated by Reference |
||||||||||
| Exhibit No. |
Description |
Form and SEC File No. |
Filing Date with SEC |
Exhibit No. |
Filed with this 10-K | |||||
| 10.10 | Class A-2 Note Purchase Agreement by and among MCG Commercial Loan Trust 2006-1 and Wells Fargo Bank, National Association, dated as of April 18, 2006 | N-2 (333-133669) |
May 1, 2006 | 99.f.26 | ||||||
| 10.11 | Class A-3 Note Purchase Agreement, by and among MCG Commercial Loan Trust 2006-1, North Sea Funding Europe Asset Purchasing Company No. 1 B.V. and Wells Fargo Bank, National Association, dated as of April 18, 2006 | N-2 (333-133669) |
May 1, 2006 | 99.f.27 | ||||||
| 10.12 | Class A-3 Note Purchase Agreement by and among MCG Commercial Loan Trust 2006-1, Barclays Bank PLC and Wells Fargo Bank, National Association, dated as of April 18, 2006 | N-2 (333- 133669) |
May 1, 2006 | 99.f.28 | ||||||
| Material Contracts—Leases | ||||||||||
| 10.13 | Deed of Lease by and between Twin Towers II Associates Limited Partnership, as landlord, and MCG Capital Corporation, as tenant, dated as of September 24, 2002 | 10-Q (0-33377) |
November 14, 2002 | 10.50 | ||||||
| 10.14 | First Amendment to Deed of Lease by and between Twin Towers II Property Associates, LLC, as landlord and MCG Capital Corporation, as tenant, dated as of November 30, 2006 | 10-K (0-33377) |
March 1, 2007 | 10.73 | ||||||
| 10.15 | Partial Termination of Deed of Lease by and between 1000-1100 Wilson Owner, LLC, as landlord and MCG Capital Corporation, as tenant, dated as of November 15, 2008 | 10-K (0-33377) |
March 9, 2009 | 10.24 | ||||||
| Material Contracts—Management Contracts and Compensation Plans | ||||||||||
| 10.16# | MCG Capital Corporation Supplemental Non-Qualified Retirement Plan Amended and Restated as of January 1, 2005 | 10-Q (0-33377) |
November 7, 2006 | 10.70 | ||||||
| 10.17# | Amendment to the MCG Capital Corporation Supplemental Non-Qualified Retirement Plan, Amended and Restated as of January 1, 2005, dated as of December 30, 2008 | 10-K (0-33377) |
March 9, 2009 | 10.26 | ||||||
| 10.18# | MCG Capital Corporation 401(k) Plan | 10-K (0-33377) |
March 4, 2011 | 10.21 | ||||||
| 10.19# | MCG Capital Corporation Dividend Reinvestment Plan | N-2 (333-64596) |
November 1, 2001 | 99.e | ||||||
| 10.20# | MCG Capital Corporation Third Amended and Restated 2006 Non-Employee Director Restricted Stock Plan | 8-K(0-33377) 8-K/A(0-33377) |
June 1, 2010 June 2, 2010 |
10.2 10.2 |
||||||
| 10.21# | MCG Capital Corporation Third Amended and Restated 2006 Employee Restricted Stock Plan | 8-K(0-33377) 8-K/A(0-33377) |
June 1, 2010 June 2, 2010 |
10.1 10.1 |
||||||
| 10.22# | Form of Restricted Stock Agreement for Non-Employee Members of the Board of Directors (pursuant to the Third Amended and Restated 2006 Non-Employee Director Restricted Stock Plan) | 10-Q (0-33377) |
August 5, 2010 | 10.4 | ||||||
| 10.23# | Form of Restricted Stock Agreement for Employees (pursuant to the Third Amended and Restated 2006 Employee Restricted Stock Plan) | 10-Q (0-33377) |
August 5, 2010 | 10.3 | ||||||
| 10.24# | Restricted Stock Agreement by and between MCG Capital Corporation and B. Hagen Saville, dated November 21, 2006 | 10-K (0-33377) |
March 9, 2009 | 10.37 | ||||||
| 10.25# | Employment Agreement by and between MCG Capital Corporation and Steven F. Tunney, dated as of September 18, 2006 | 8-K (0-33377) |
September 19, 2006 | 10.1 | ||||||
| 10.26# | Amendment to Employment Agreement by and between MCG Capital Corporation and Steven F. Tunney, dated as of December 23, 2008 | 10-K (0-33377) |
March 9, 2009 | 10.41 | ||||||
| 10.27# | Letter Agreement between MCG Capital Corporation and Steven F. Tunney, Sr. dated October 31, 2011 | 8-K (0-33377) |
October 31, 2011 | 10.41 | ||||||
| 10.28# | Employment Agreement by and between MCG Capital Corporation and B. Hagen Saville, dated as of September 18, 2006 | 8-K (0-33377) |
September 19, 2006 | 10.2 | ||||||
| 10.29# | Amendment to Employment Agreement by and between MCG Capital Corporation and B. Hagen Saville, dated as of December 31, 2008 | 10-K (0-33377) |
March 9, 2009 | 10.43 | ||||||
| 10.30# | Employment Agreement by and between MCG Capital Corporation and Samuel G. Rubenstein, dated as of March 1, 2007 | 10-K (0-33377) |
March 1, 2007 | 10.74 | ||||||
| 10.31# | Amendment to Employment Agreement by and between MCG Capital Corporation and Samuel G. Rubenstein, dated as of December 23, 2008 | 10-K (0-33377) |
March 9, 2009 | 10.47 | ||||||
126
Table of Contents
| Incorporated by Reference |
||||||||||
| Exhibit No. |
Description |
Form and SEC File No. |
Filing Date with SEC |
Exhibit No. |
Filed with this 10-K | |||||
| 10.32# | Employment Agreement by and between MCG Capital Corporation and Stephen J. Bacica, dated as of October 28, 2008 | 10-Q (0-33377) |
October 31, 2008 | 10.2 | ||||||
| 10.33# | Amendment to Employment Agreement by and between MCG Capital Corporation and Stephen J. Bacica, dated as of December 23, 2008 | 10-K (0-33377) |
March 9, 2009 | 10.50 | ||||||
| 10.34# | Severance, Confidentiality and Non-Solicitation Agreement by and between MCG Capital Corporation and Tod K. Reichert, dated August 2, 2011 | 10-Q (0-33377) |
August 4, 2011 | 10.6 | ||||||
| 10.35# | MCG Capital Corporation 2009 Long-Term Incentive Program | 8-K (0-33377) |
July 24, 2009 | 10.2 | ||||||
| 10.36# | Non-Employee Director Compensation Summary | * | ||||||||
| 10.37# | MCG Capital Corporation 2011 Retention Program, dated August 2, 2011 | 10-Q (0-33377) |
August 4, 2011 | 10.3 | ||||||
| 10.38# | MCG Capital Corporation 2011 Severance Pay Plan, dated August 3, 2011 | 10-Q (0-33377) |
August 4, 2011 | 10.4 | ||||||
| 10.39# | Restricted Stock Agreement for MCG Employee under the 2011 Retention Program | 10-Q (0-33377) |
August 4, 2011 | 10.5 | ||||||
| Material Contracts—Other | ||||||||||
| 10.40 | Settlement Agreement by and among Springbok Capital Management, LLC, Springbok Capital Onshore, LLC, Gavin Saitowitz, Soundpost Partners, LP, Jaime Lester, Lyrical Partners, L.P., Jeffrey Keswin, Edward Gage, Robert S. Everett and MCG Capital Corporation, dated as of April 24, 2009 | 8-K (0-33377) |
April 28, 2009 | 10.1 | ||||||
| Subsidiaries of the Registrant | ||||||||||
| 21 | Subsidiaries of MCG Capital Corporation and Jurisdiction of Incorporation/Organization | * | ||||||||
| Consents of Experts | ||||||||||
| 23.1 | Consent of Ernst & Young LLP, independent registered public accounting firm | * | ||||||||
| Certifications | ||||||||||
| 31.1 | Certification of Chief Executive Officer pursuant to Rules 13a-14(a) and 15d-14(a) under the Securities Exchange Act of 1934, as amended, as adopted pursuant to Section 302 of Sarbanes-Oxley Act of 2002 | * | ||||||||
| 31.2 | Certification of Chief Financial Officer pursuant to Rules 13a-14(a) and 15d-14(a) under the Securities Exchange Act of 1934, as amended, as adopted pursuant to Section 302 of Sarbanes-Oxley Act of 2002 | * | ||||||||
| 31.3 | Certification of Chief Accounting Officer pursuant to Rules 13a-14(a) and 15d-14(a) under the Securities Exchange Act of 1934, as amended, as adopted pursuant to Section 302 of Sarbanes-Oxley Act of 2002 | * | ||||||||
| 32.1 | Certification of Chief Executive Officer pursuant to 18 U.S.C. Section 1350, as adopted pursuant to Section 906 of Sarbanes-Oxley Act of 2002 | † | ||||||||
| 32.2 | Certification of Chief Financial Officer pursuant to 18 U.S.C. Section 1350, as adopted pursuant to Section 906 of Sarbanes-Oxley Act of 2002 | † | ||||||||
| 32.3 | Certification of Chief Accounting Officer pursuant to 18 U.S.C. Section 1350, as adopted pursuant to Section 906 of Sarbanes-Oxley Act of 2002 | † | ||||||||
| * | Filed herewith. |
| † | Furnished herewith. |
| # | Management contracts or compensatory plans or arrangements required to be filed as an exhibit herein pursuant to Item 15(a) of Form 10-K. |
127
Table of Contents
Pursuant to the requirements of Section 13 or 15(d) of the Securities Exchange Act of 1934, the Registrant has duly caused this report to be signed on its behalf by the undersigned, thereunto duly authorized on March 1, 2012.
| MCG CAPITAL CORPORATION | ||
| By: | /S/ RICHARD W. NEU | |
| Richard W. Neu Chief Executive Officer | ||
Pursuant to the requirements of the Securities Exchange Act of 1934, this Report on Form 10-K has been signed below by the following persons on behalf of the Registrant and in the capacities and on the dates indicated.
| Signature |
Title |
Date | ||
| /s/ RICHARD W. NEU Richard W. Neu |
Chief Executive Officer, Chairman of the Board and Director (Principal Executive Officer) |
March 1, 2012 | ||
| /s/ STEPHEN J. BACICA Stephen J. Bacica |
Executive Vice President and Chief Financial Officer (Principal Financial Officer) |
March 1, 2012 | ||
| /s/ LINDA A. NIMMONS Linda A. Nimmons |
Senior Vice President and Chief Accounting Officer (Principal Accounting Officer) |
March 1, 2012 | ||
| /s/ B. HAGEN SAVILLE |
President and Chief Operating Officer and Director |
March 1, 2012 | ||
| B. Hagen Saville |
||||
| /s/ A. HUGH EWING, III |
Director | February 24, 2012 | ||
| A. Hugh Ewing, III |
||||
| /s/ KIM D. KELLY |
Director | February 24, 2012 | ||
| Kim D. Kelly |
||||
| /s/ WALLACE B. MILLNER, III |
Director | February 24, 2012 | ||
| Wallace B. Millner, III |
||||
| /s/ KENNETH J. O’KEEFE |
Director | February 24, 2012 | ||
| Kenneth J. O’Keefe |
||||
| /s/ GAVIN SAITOWITZ |
Director | February 24, 2012 | ||
| Gavin Saitowitz |
||||
128