Attached files
| file | filename |
|---|---|
| 8-K - FORM 8-K - HollyFrontier Corp | d309884d8k.htm |
Exhibit 99.1

| HollyFrontier CorporationSimmons & Company Twelfth Annual Energy ConferenceFebruary 29th & March 1st, 2012 |

| HollyFrontier Corporation Disclosure Statement Statements made during the course of this presentation that are not historical facts are "forward- looking statements" within the meaning of the U.S. Private Securities Litigation Reform Act of 1995. Forward-looking statements are inherently uncertain and necessarily involve risks that may affect the business prospects and performance of HollyFrontier Corporation and/or Holly Energy Partners, L.P., and actual results may differ materially from those discussed during the presentation. Such risks and uncertainties include but are not limited to risks and uncertainties with respect to the actions of actual or potential competitive suppliers and transporters of refined petroleum products in HollyFrontier's and Holly Energy Partners' markets, the demand for and supply of crude oil and refined products, the spread between market prices for refined products and market prices for crude oil, the possibility of constraints on the transportation of refined products, the possibility of inefficiencies or shutdowns in refinery operations or pipelines, effects of governmental regulations and policies, the availability and cost of financing to HollyFrontier and Holly Energy Partners, the effectiveness of HollyFrontier's and Holly Energy Partners' capital investments and marketing and acquisition strategies, the possibility of terrorist attacks and the consequences of any such attacks, general economic conditions, and our ability to successfully integrate the business of Holly Corporation and Frontier Oil Corporation and to realize partially or fully the anticipated benefits of our merger of equals with Frontier. Additional information on risks and uncertainties that could affect the business prospects and performance of Holly Frontier and Holly Energy Partners is provided in the most recent reports of HollyFrontier and Holly Energy Partners filed with the Securities and Exchange Commission. All forward-looking statements included in this presentation are expressly qualified in their entirety by the foregoing cautionary statements. HollyFrontier and Holly Energy Partners undertake no obligation to publicly update or revise any forward-looking statements, whether as a result of new information, future events or otherwise. 2 |
| HollyFrontier Corporation 3 |
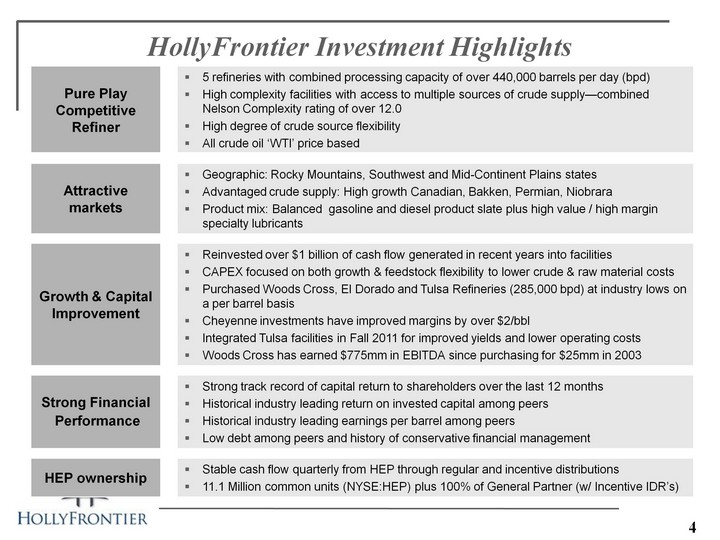
| HollyFrontier Investment Highlights HollyFrontier Investment Highlights 4 |
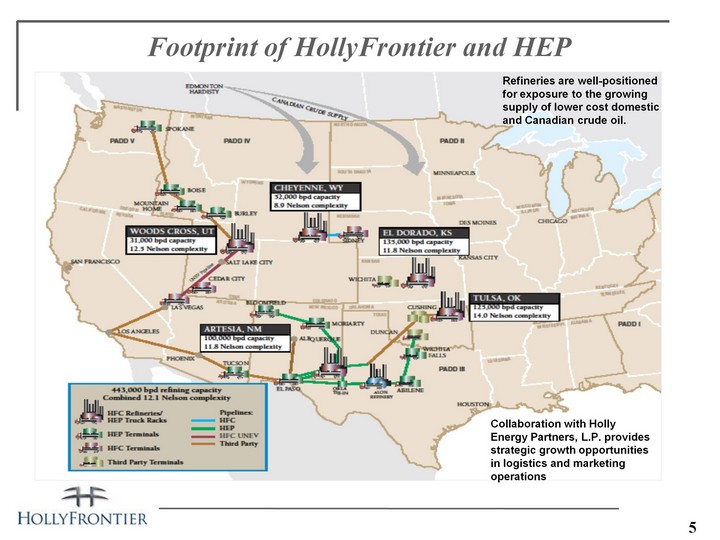
| Footprint of HollyFrontier and HEP Collaboration with Holly Energy Partners, L.P. provides strategic growth opportunities in logistics and marketing operations Refineries are well-positioned for exposure to the growing supply of lower cost domestic and Canadian crude oil. 5 |
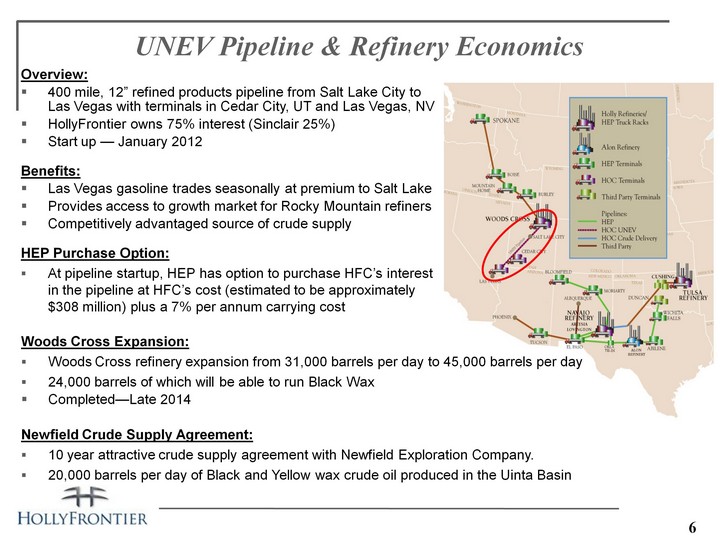
| UNEV Pipeline & Refinery Economics Overview: 400 mile, 12" refined products pipeline from Salt Lake City to Las Vegas with terminals in Cedar City, UT and Las Vegas, NVHollyFrontier owns 75% interest (Sinclair 25%)Start up - January 2012Benefits:Las Vegas gasoline trades seasonally at premium to Salt Lake Provides access to growth market for Rocky Mountain refinersCompetitively advantaged source of crude supplyHEP Purchase Option:At pipeline startup, HEP has option to purchase HFC's interest in the pipeline at HFC's cost (estimated to be approximately $308 million) plus a 7% per annum carrying cost Woods Cross Expansion:Woods Cross refinery expansion from 31,000 barrels per day to 45,000 barrels per day24,000 barrels of which will be able to run Black WaxCompleted-Late 2014Newfield Crude Supply Agreement: 10 year attractive crude supply agreement with Newfield Exploration Company. 20,000 barrels per day of Black and Yellow wax crude oil produced in the Uinta Basin 6 |
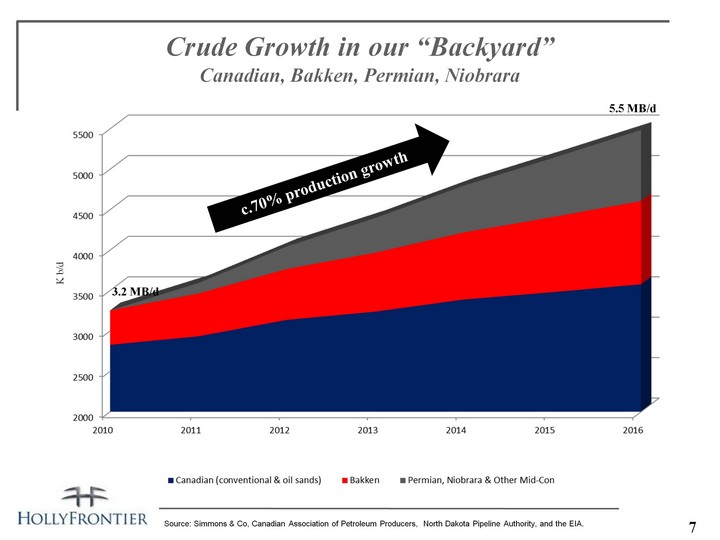
| Crude Growth in our "Backyard" Canadian, Bakken, Permian, Niobrara K b/d Source: Simmons & Co, Canadian Association of Petroleum Producers, North Dakota Pipeline Authority, and the EIA. 5.5 MB/d 3.2 MB/d c.70% production growth 7 |
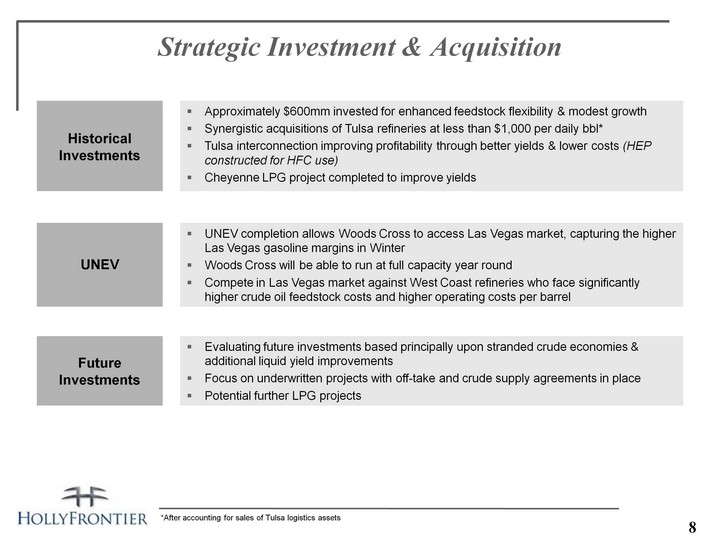
| Strategic Investment & Acquisition Strategic Investment & Acquisition *After accounting for sales of Tulsa logistics assets 8 |
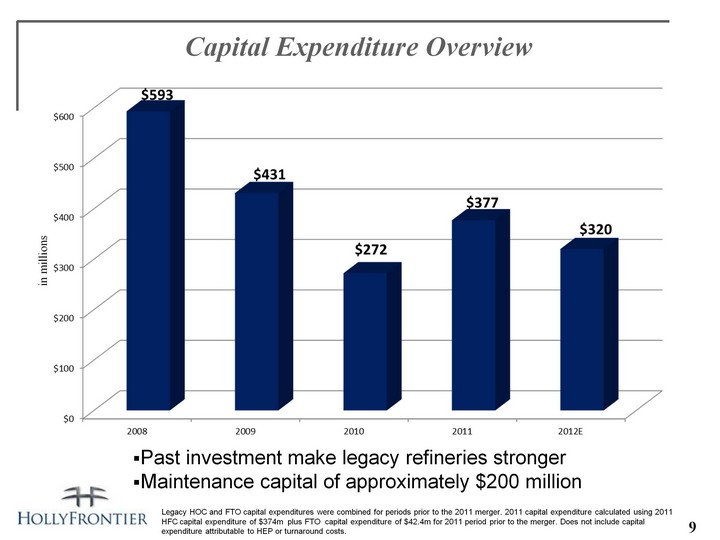
| Capital Expenditure Overview Legacy HOC and FTO capital expenditures were combined for periods prior to the 2011 merger. 2011 capital expenditure calculated using 2011HFC capital expenditure of $374m plus FTO capital expenditure of $42.4m for 2011 period prior to the merger. Does not include capitalexpenditure attributable to HEP or turnaround costs. Past investment make legacy refineries strongerMaintenance capital of approximately $200 million in millions 9 |
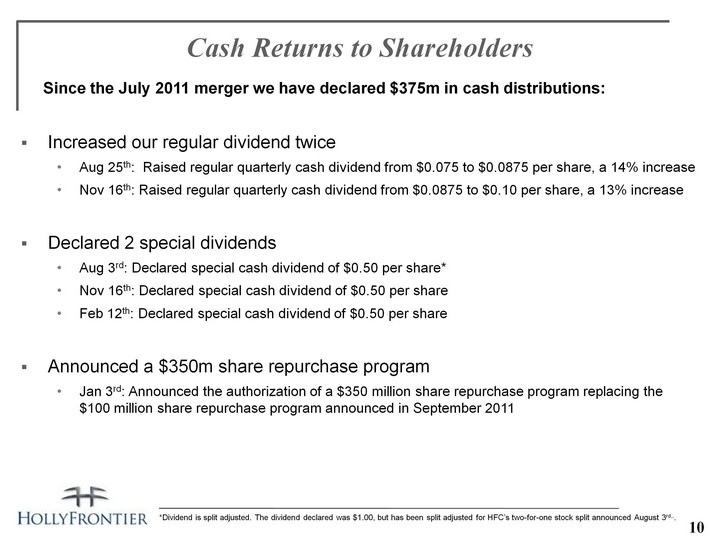
| Cash Returns to Shareholders Since the July 2011 merger we have declared $375m in cash distributions:Increased our regular dividend twice Aug 25th: Raised regular quarterly cash dividend from $0.075 to $0.0875 per share, a 14% increaseNov 16th: Raised regular quarterly cash dividend from $0.0875 to $0.10 per share, a 13% increaseDeclared 2 special dividendsAug 3rd: Declared special cash dividend of $0.50 per share*Nov 16th: Declared special cash dividend of $0.50 per shareFeb 12th: Declared special cash dividend of $0.50 per shareAnnounced a $350m share repurchase programJan 3rd: Announced the authorization of a $350 million share repurchase program replacing the $100 million share repurchase program announced in September 2011 *Dividend is split adjusted. The dividend declared was $1.00, but has been split adjusted for HFC's two-for-one stock split announced August 3rd,,. 10 |
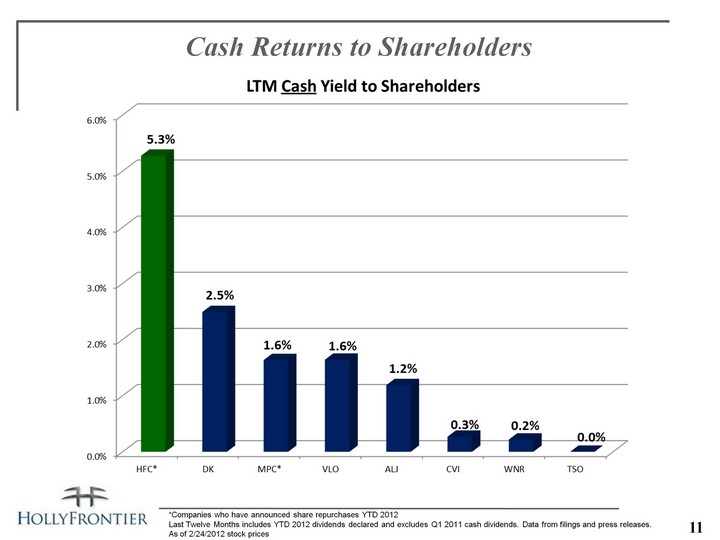
| Cash Returns to Shareholders *Companies who have announced share repurchases YTD 2012Last Twelve Months includes YTD 2012 dividends declared and excludes Q1 2011 cash dividends. Data from filings and press releases.As of 2/24/2012 stock prices 11 |
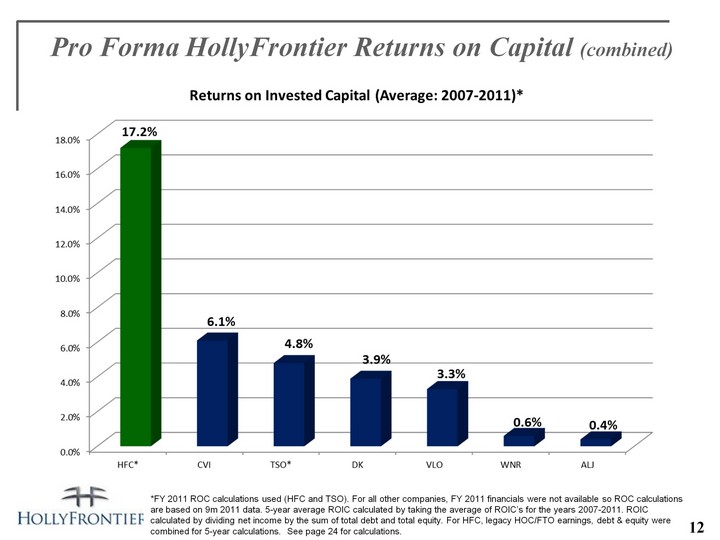
| Pro Forma HollyFrontier Returns on Capital (combined) *FY 2011 ROC calculations used (HFC and TSO). For all other companies, FY 2011 financials were not available so ROC calculations are based on 9m 2011 data. 5-year average ROIC calculated by taking the average of ROIC's for the years 2007-2011. ROIC calculated by dividing net income by the sum of total debt and total equity. For HFC, legacy HOC/FTO earnings, debt & equity were combined for 5-year calculations. See page 24 for calculations. 12 |
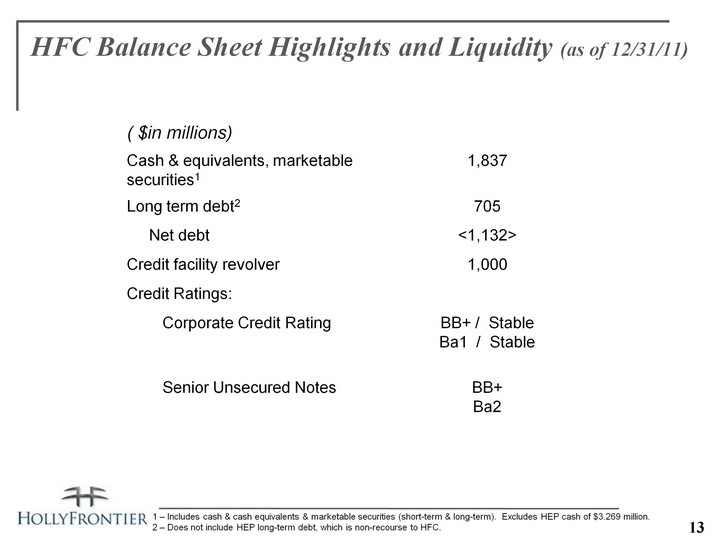
| HFC Balance Sheet Highlights and Liquidity (as of 12/31/11) 1 - Includes cash & cash equivalents & marketable securities (short-term & long-term). Excludes HEP cash of $3.269 million.2 - Does not include HEP long-term debt, which is non-recourse to HFC. ( $in millions) Cash & equivalents, marketable securities1 1,837 Long term debt2 705 Net debt <1,132> Credit facility revolver 1,000 Credit Ratings: Corporate Credit Rating BB+ / Stable Ba1 / Stable Senior Unsecured Notes BB+ Ba2 13 |
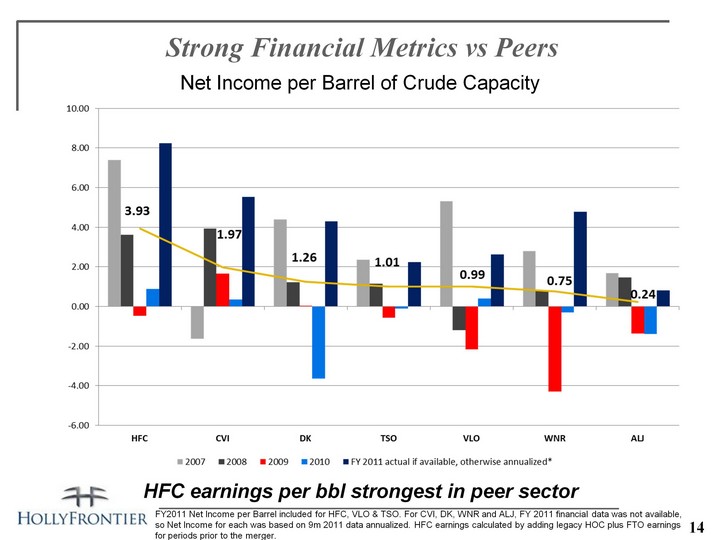
| Strong Financial Metrics vs Peers Net Income per Barrel of Crude Capacity HFC earnings per bbl strongest in peer sector FY2011 Net Income per Barrel included for HFC, VLO & TSO. For CVI, DK, WNR and ALJ, FY 2011 financial data was not available, so Net Income for each was based on 9m 2011 data annualized. HFC earnings calculated by adding legacy HOC plus FTO earnings for periods prior to the merger. 14 |
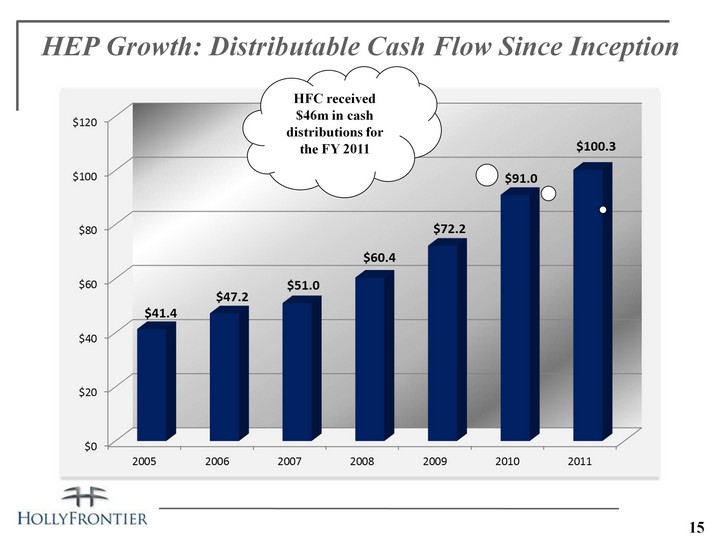
| HEP Growth: Distributable Cash Flow Since Inception HFC received $46m in cash distributions for the FY 2011 15 |
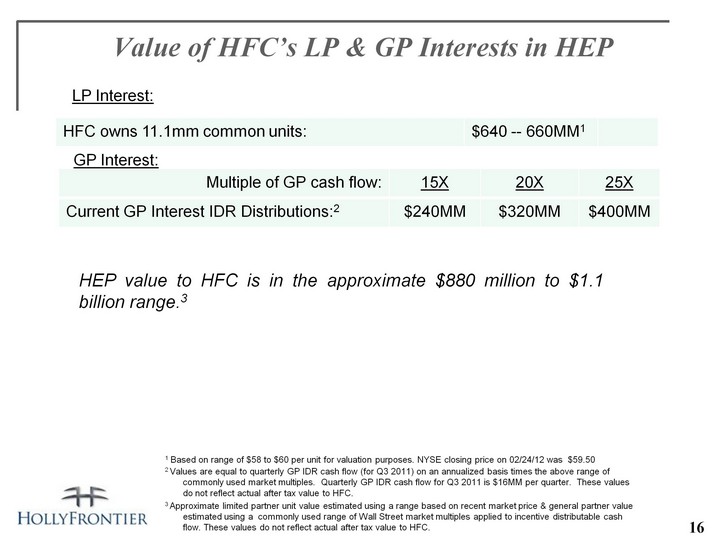
| Value of HFC's LP & GP Interests in HEP HFC owns 11.1mm common units: $640 -- 660MM1 Multiple of GP cash flow: 15X 20X 25X Current GP Interest IDR Distributions:2 $240MM $320MM $400MM HEP value to HFC is in the approximate $880 million to $1.1 billion range.3 1 Based on range of $58 to $60 per unit for valuation purposes. NYSE closing price on 02/24/12 was $59.502 Values are equal to quarterly GP IDR cash flow (for Q3 2011) on an annualized basis times the above range of commonly used market multiples. Quarterly GP IDR cash flow for Q3 2011 is $16MM per quarter. These values do not reflect actual after tax value to HFC.3 Approximate limited partner unit value estimated using a range based on recent market price & general partner value estimated using a commonly used range of Wall Street market multiples applied to incentive distributable cash flow. These values do not reflect actual after tax value to HFC. LP Interest: GP Interest: 16 |
| HollyFrontier Corporation (NYSE: HFC)2828 N. Harwood, Suite 1300Dallas, Texas 75201(214) 871-3555Neale Hickerson, Vice President, Investor RelationsNeale.hickerson@hollyfrontier.com214-871-3572www.hollyfrontier.com 17 |
| Appendix 18 |

| Mid-Continent: El Dorado & Tulsa Refineries TULSA REFINERIES EL DORADO REFINERY The Mid-Continent Region comprises our Tulsa and El Dorado Refineries and has a combined crude oil processing capacity of 260,000 BPSD. (CHART) (CHART) Mid-Continent Sales of Refinery Produced Products 268,320 BPD Located in El Dorado, Kansas135,000 BPSD capacity and Nelson Complexity rating of 11.8Processes sour and heavy (Canadian) crude oils into high value light productsDistributes to high margin markets in Colorado and Mid- Continent/Plains states Tulsa West and Tulsa East facilities are located less than two miles apart in Tulsa, Oklahoma and are operated as an integrated facility through interconnecting pipelines125,000 BPSD capacity and Nelson Complexity rating of 14.0Processes predominantly sweet crude oil with up to 10,000 BPD of heavy Canadian crudesDistributes to the Mid-Continent states and also sells its specialty lubricants, which are high value products that provide a higher margin, throughout the United States and Central and South America 19 |
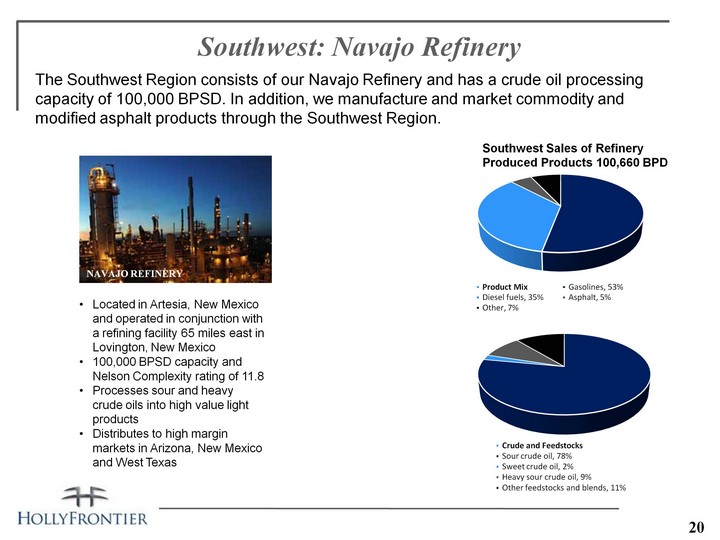
| Southwest: Navajo Refinery NAVAJO REFINERY The Southwest Region consists of our Navajo Refinery and has a crude oil processing capacity of 100,000 BPSD. In addition, we manufacture and market commodity and modified asphalt products through the Southwest Region. Southwest Sales of Refinery Produced Products 100,660 BPD Located in Artesia, New Mexico and operated in conjunction with a refining facility 65 miles east in Lovington, New Mexico100,000 BPSD capacity and Nelson Complexity rating of 11.8Processes sour and heavy crude oils into high value light products Distributes to high margin markets in Arizona, New Mexico and West Texas (CHART) (CHART) 20 |

| Rocky Mountain: Woods Cross and Cheyenne Refineries CHEYENNE REFINERY The Rocky Mountain Region comprises of our Cheyenne and Woods Cross Refineries and has a combined crude oil processing capacity of 83,000 BPSD. We also own a 75% joint venture interest in the recently completed UNEV pipeline, a 400 mile refined products pipeline that will serve refineries in the Rocky Mountain are. Rocky Mountain Sales of Refinery Produced Products 73,980 BPD Located in Cheyenne, Wyoming 52,000 BPSD capacity and Nelson Complexity rating of 8.9Processes sour and heavy Canadian crude oils into high value light productsDistributes to high margin Eastern Rockies and Plains states WOODS CROSS REFINERY Located in Woods Cross, Utah (near Salt Lake City)31,000 BPSD capacity and Nelson Complexity rating of 12.5Processes regional sweet and lower cost black wax crude as well as Canadian sour crude oilsDistributes to high margin markets in Utah, Idaho, Nevada, Wyoming, and eastern Washington (CHART) (CHART) 21 |
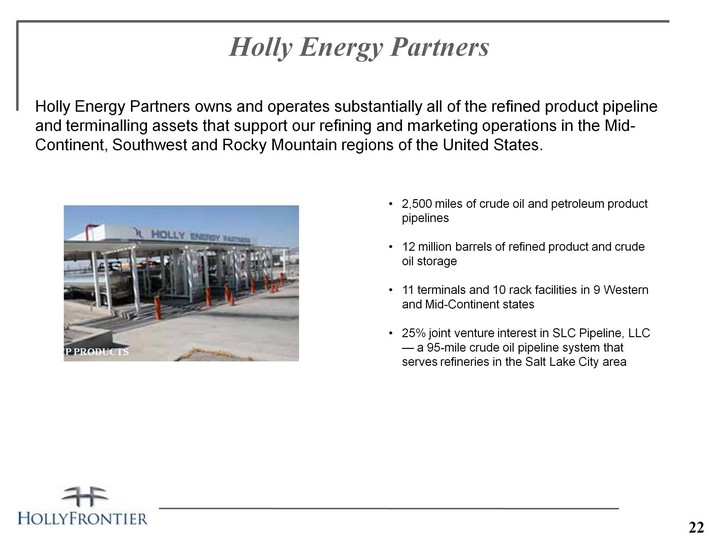
| Holly Energy Partners HEP PRODUCTS Holly Energy Partners owns and operates substantially all of the refined product pipeline and terminalling assets that support our refining and marketing operations in the Mid- Continent, Southwest and Rocky Mountain regions of the United States. 2,500 miles of crude oil and petroleum product pipelines12 million barrels of refined product and crude oil storage11 terminals and 10 rack facilities in 9 Western and Mid-Continent states25% joint venture interest in SLC Pipeline, LLC - a 95-mile crude oil pipeline system that serves refineries in the Salt Lake City area 22 |
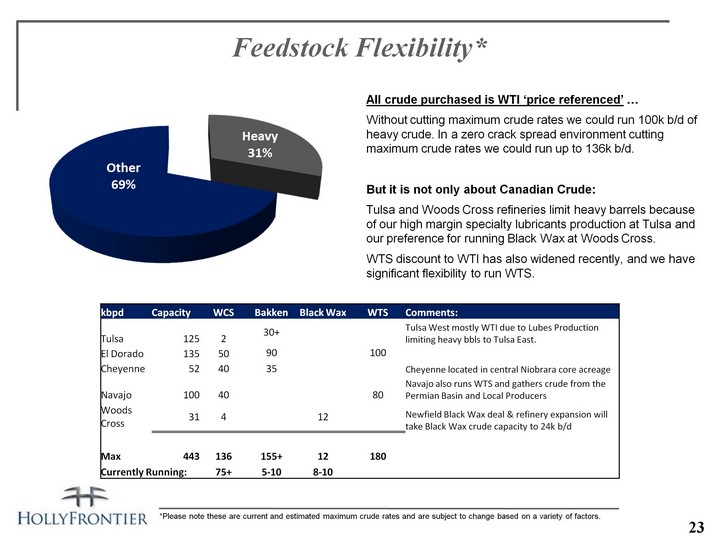
| Feedstock Flexibility* All crude purchased is WTI 'price referenced' ...Without cutting maximum crude rates we could run 100k b/d of heavy crude. In a zero crack spread environment cutting maximum crude rates we could run up to 136k b/d. But it is not only about Canadian Crude:Tulsa and Woods Cross refineries limit heavy barrels because of our high margin specialty lubricants production at Tulsa and our preference for running Black Wax at Woods Cross.WTS discount to WTI has also widened recently, and we have significant flexibility to run WTS. 23 *Please note these are current and estimated maximum crude rates and are subject to change based on a variety of factors. kbpd Capacity WCS Bakken Black Wax WTS Comments: Tulsa 125 2 30+ Tulsa West mostly WTI due to Lubes Production limiting heavy bbls to Tulsa East. El Dorado 135 50 90 100 Cheyenne 52 40 35 Cheyenne located in central Niobrara core acreage Navajo 100 40 80 Navajo also runs WTS and gathers crude from the Permian Basin and Local Producers Woods Cross 31 4 12 Newfield Black Wax deal & refinery expansion will take Black Wax crude capacity to 24k b/d Max 443 136 155+ 12 180 Currently Running: Currently Running: 75+ 5-10 8-10 |
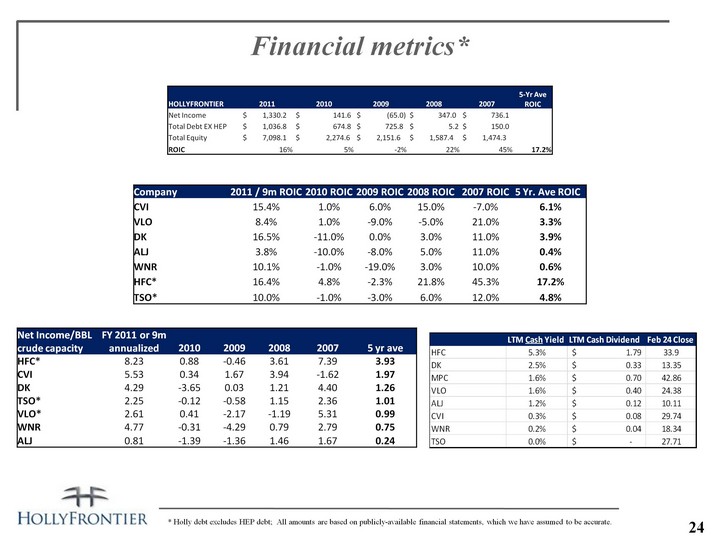
| Financial metrics* * Holly debt excludes HEP debt; All amounts are based on publicly-available financial statements, which we have assumed to be accurate. 24 Company 2011 / 9m ROIC 2010 ROIC 2009 ROIC 2008 ROIC 2007 ROIC 5 Yr. Ave ROIC CVI 15.4% 1.0% 6.0% 15.0% -7.0% 6.1% VLO 8.4% 1.0% -9.0% -5.0% 21.0% 3.3% DK 16.5% -11.0% 0.0% 3.0% 11.0% 3.9% ALJ 3.8% -10.0% -8.0% 5.0% 11.0% 0.4% WNR 10.1% -1.0% -19.0% 3.0% 10.0% 0.6% HFC* 16.4% 4.8% -2.3% 21.8% 45.3% 17.2% TSO* 10.0% -1.0% -3.0% 6.0% 12.0% 4.8% Net Income/BBL crude capacity FY 2011 or 9m annualized 2010 2009 2008 2007 5 yr ave HFC* 8.23 0.88 -0.46 3.61 7.39 3.93 CVI 5.53 0.34 1.67 3.94 -1.62 1.97 DK 4.29 -3.65 0.03 1.21 4.40 1.26 TSO* 2.25 -0.12 -0.58 1.15 2.36 1.01 VLO* 2.61 0.41 -2.17 -1.19 5.31 0.99 WNR 4.77 -0.31 -4.29 0.79 2.79 0.75 ALJ 0.81 -1.39 -1.36 1.46 1.67 0.24 HOLLYFRONTIER 2011 2010 2009 2008 2007 5-Yr Ave ROIC Net Income $ 1,330.2 $ 141.6 $ (65.0) $ 347.0 $ 736.1 Total Debt EX HEP $ 1,036.8 $ 674.8 $ 725.8 $ 5.2 $ 150.0 Total Equity $ 7,098.1 $ 2,274.6 $ 2,151.6 $ 1,587.4 $ 1,474.3 ROIC 16% 5% -2% 22% 45% 17.2% |
| Definitions Non GAPP measurements: We report certain financial measures that are not prescribed or authorized by U. S. generally accepted accounting principles ("GAAP"). We discuss management's reasons for reporting these non-GAAP measures below. Although management evaluates and presents these non-GAAP measures for the reasons described below, please be aware that these non-GAAP measures are not alternatives to revenue, operating income, income from continuing operations, net income, or any other comparable operating measure prescribed by GAAP. In addition, these non-GAAP financial measures may be calculated and/or presented differently than measures with the same or similar names that are reported by other companies, and as a result, the non-GAAP measures we report may not be comparable to those reported by others.Refining gross margin or refinery gross margin: the difference between average net sales price and average costs of products per barrel of produced refined products. This does not include the associated depreciation, depletion and amortization costs. Refining gross margin or refinery gross margin is a non-GAAP performance measure that is used by our management and others to compare our refining performance to that of other companies in our industry. This margin does not include the effect of depreciation, depletion and amortization. Other companies in our industry may not calculate this performance measure in the same manner. Our historical refining gross margin or refinery gross margin is reconciled to net income under "Reconciliation to Amounts Reported Under Generally Accepted Accounting Principles" of Holly Frontier Corporation's 2011 10-K filed February 28, 2011.Net Operating Margin: Net operating margin is a non-GAAP performance measure that is used by our management and others to compare our refining performance to that of other companies in our industry. This margin does not include the effect of depreciation, depletion and amortization. Other companies in our industry may not calculate this performance measure in the same manner. Our historical net operating margin is reconciled to net income under "Reconciliation to Amounts Reported Under Generally Accepted Accounting Principles" of Holly Frontier Corporation's 2011 10-K filed February 28, 2011.EBITDA: Earnings before interest, taxes, depreciation and amortization, which we refer to as EBITDA, is calculated as net income plus (i) interest expense net of interest income, (ii) income tax provision, and (iii) depreciation, depletion and amortization. EBITDA is not a calculation provided for under accounting principles generally accepted in the United States; however, the amounts included in the EBITDA calculation are derived from amounts included in our consolidated financial statements. EBITDA should not be considered as an alternative to net income or operating income as an indication of our operating performance or as an alternative to operating cash flow as a measure of liquidity. EBITDA is not necessarily comparable to similarly titled measures of other companies. EBITDA is presented here because it is a widely used financial indicator used by investors and analysts to measure performance. EBITDA is also used by our management for internal analysis and as a basis for financial covenants. Our historical EBITDA is reconciled to net income under "Reconciliation to Amounts Reported Under Generally Accepted Accounting Principles" of Holly Frontier Corporation's 2011 10-K filed February 28, 2011.Debt-To-Capital: A measurement of a company's financial leverage, calculated as the company's long term debt divided by its total capital. Debt includes all long-term obligations. Total capital includes the company's debt and shareholders' equity. 5 Year Return on Invested Capital: A measurement which for our purposes is calculated using the 5 year average Net Income divided by the sum of the 5 year average of Total Equity and Long Term Debt. We consider ROIC to be a meaningful indicator of our financial performance, and we evaluate this metric because it measures how effectively we use the money invested in our operations.IDR: Incentive Distribution RightsBPD: the number of barrels per calendar day of crude oil or petroleum products.BPSD: the number of barrels per stream day of crude oil or petroleum products.MMSCFD: million standard cubic feet per day.Gas Oil Hydrocracker: a refinery unit which uses catalyst at high pressure and temperature and in the presence of hydrogen to convert high boiling point hydrocarbons to light transportation fuels and low sulfur FCC feedstock.Solvent deasphalter / residuum oil supercritical extraction ("ROSE"): a refinery unit that uses a light hydrocarbon like propane or butane to extract non asphaltene heavy oils from asphalt or atmospheric reduced crude. These deasphalted oils are then further converted to gasoline and diesel in the FCC process. The remaining asphaltenes are either sold, blended to fuel oil or blended with other asphalt as a hardener.. 25 |