Attached files
| file | filename |
|---|---|
| 8-K - ALASKA COMMUNICATIONS SYSTEMS GROUP, INC. 8-K - ALASKA COMMUNICATIONS SYSTEMS GROUP INC | a50189488.htm |
| EX-99.1 - EXHIBIT 99.1 - ALASKA COMMUNICATIONS SYSTEMS GROUP INC | a50189488ex991.htm |
Exhibit 99.2
1 Alaska Communications – March 2012 Business Plan Review Accompanying Material for Q4 2011 Earnings Call: March 1, 2012
2 Alaska Communications – March 2012 Forward-Looking Statements We have included in this presentation certain "forward-looking statements," as that term is defined in the Private Securities Litigation Reform Act of 1995. These forward-looking statements are based on management's beliefs as well as on a number of assumptions concerning future events made using information currently available to management. You are cautioned not to put undue reliance on such forward-looking statements, which are not a guarantee of performance and are subject to a number of risks, uncertainties and other factors, many of which are outside ACS' control. For further information regarding risks and uncertainties associated with ACS' business, please refer to the company's SEC filings, including, but not limited to, our most recent annual report on Form 10-K and our most recent quarterly report on Form 10-Q and other filings with the SEC, included under headings such as “Risk factors” and “Management’s discussion and analysis of financial condition and results of operations.” Non-GAAP Financial Measures This presentation includes EBITDA presented for historical periods. Management believes the most directly comparable GAAP measure would be “Net cash provided by operating activities.” SAFE HARBOR STATEMENT
3 Alaska Communications – March 2012 A CASE FOR ACTION: UPDATING OUR BUSINESS PLAN In 2011, we discussed the impact of two external events: –New Competitor: Verizon Wireless began construction of an LTE network, and recently indicated it would launch service by the end of 2012. This will lead to some erosion of roaming revenue ($38.9M in 2011) and potential loss of retail market share. –Regulatory Changes: The FCC’s USF reform makes changes to our support revenues ($26.9M of wireless CETC and $21.3M of Wireline high cost support in 2011). These revenues will not go to zero –we will continue to get both revenue streams at some reduced levels, with the reductions occurring over several years. Benefiting from historically stable performance, we had one of the highest leverage and payout ratios in our industry. Our balance sheet, while having longer term maturities for debt, provides limited flexibility. Both of these are constraints during times of transition. We took a fresh look at certain market segments where we had previously participated but had not put management attention. Examples include prepaid wireless and home Internet. Our results indicate significant opportunity for success. Our assessment of the market opportunity and our disciplined execution in 2011 gives us confidence going into our business plan.
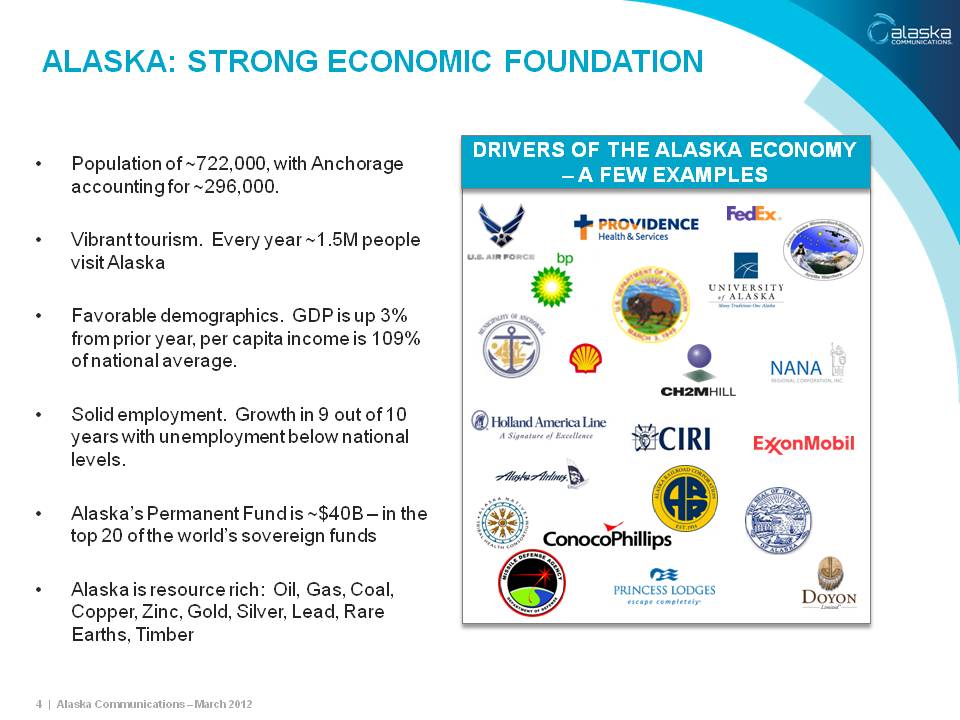
4 Alaska Communications – March 2012 ALASKA: STRONG ECONOMIC FOUNDATION NANA Regional Corporation Ciri bp Alaska Hotels, Alaska Vacations & Alaska Tours - Princess Lodges Department of the Interior Home Page Providence Health & Services logo CH2M_Hill FedEx ExxonMobil Municipality_Anchorage Population of ~722,000, with Anchorage accounting for ~296,000. Vibrant tourism. Every year ~1.5M people visit Alaska Favorable demographics. GDP is up 3% from prior year, per capita income is 109% of national average. Solid employment. Growth in 9 out of 10 years with unemployment below national levels. Alaska’s Permanent Fund is ~$40B –in the top 20 of the world’s sovereign funds Alaska is resource rich: Oil, Gas, Coal, Copper, Zinc, Gold, Silver, Lead, Rare Earths, Timber DRIVERS OF THE ALASKA ECONOMY –A FEW EXAMPLES
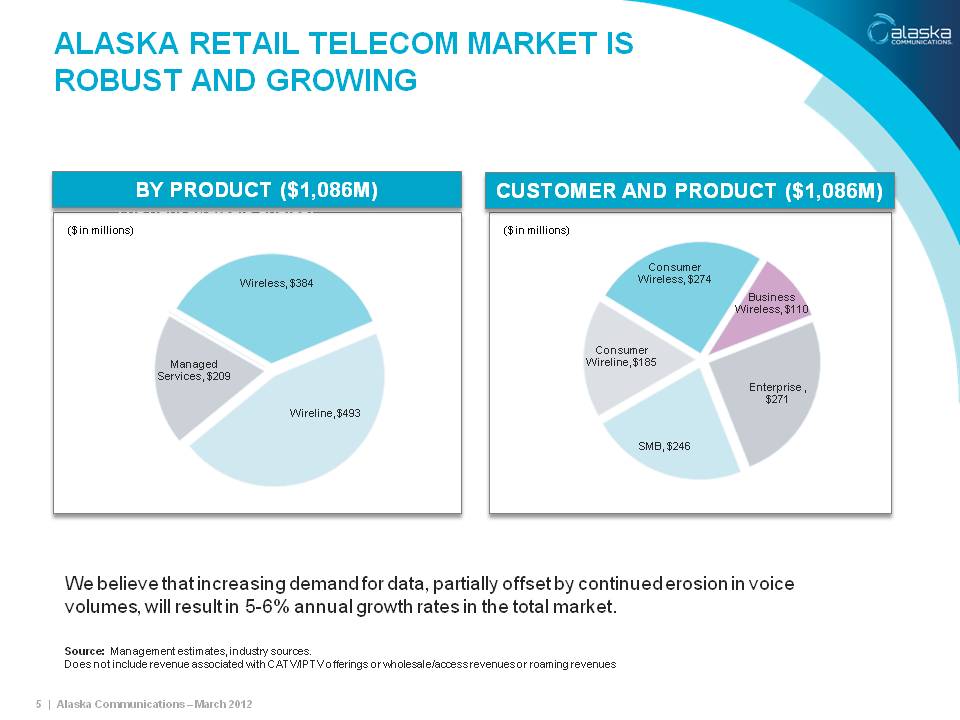
5 Alaska Communications – March 2012 The right strategic choice: Proven competitive advantage: We believe that increasing demand for data, partially offset by continued erosion in voice volumes, will result in 5-6% annual growth rates in the total market. Consumer Wireline, $185 Consumer Wireless, $274 Business Wireless, $110 Enterprise , $271 SMB, $246 Source: Management estimates, industry sources. Does not include revenue associated with CATV/IPTV offerings or wholesale/access revenues or roaming revenues BY PRODUCT ($1,086M) CUSTOMER AND PRODUCT ($1,086M) ALASKA RETAIL TELECOM MARKET IS ROBUST AND GROWING Wireless, $384 Wireline, $493 Managed Services, $209 ($ in millions) ($ in millions)
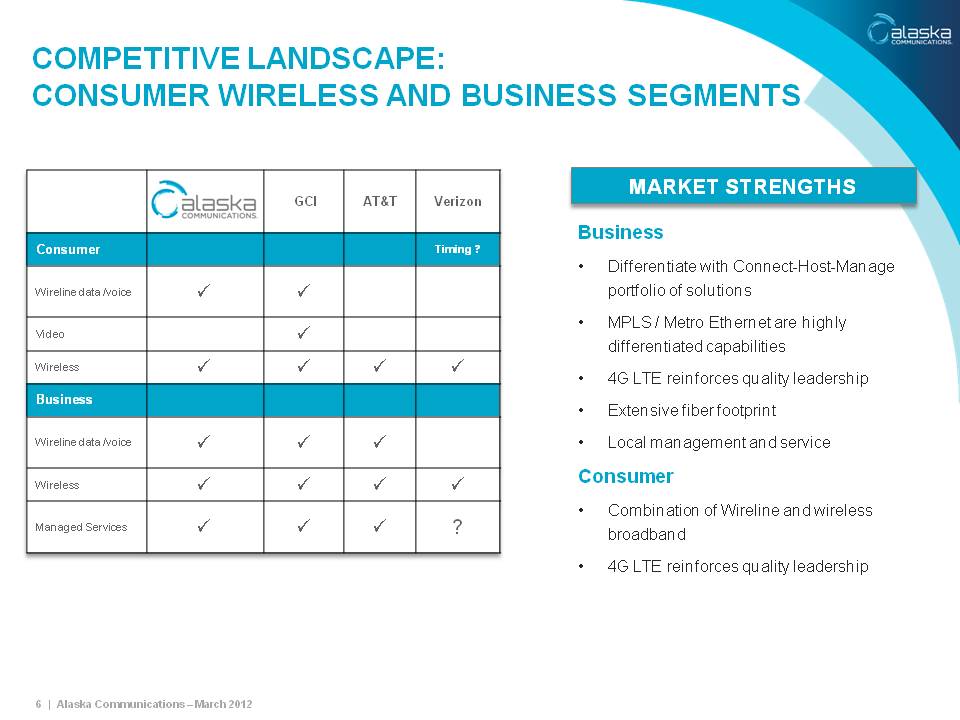
6 Alaska Communications –March 2012 COMPETITIVE LANDSCAPE: CONSUMER WIRELESS AND BUSINESS SEGMENTS GCI AT&T Verizon Consumer Timing ? Wireline data /voice Video Wireless Business Wireline data /voice Wireless Managed Services ? Business Differentiate with Connect-Host-Manage portfolio of solutions MPLS / Metro Ethernet are highly differentiated capabilities 4G LTE reinforces quality leadership Extensive fiber footprint Local management and service Consumer Combination of Wireline and wireless broadband 4G LTE reinforces quality leadership MARKET STRENGTHS
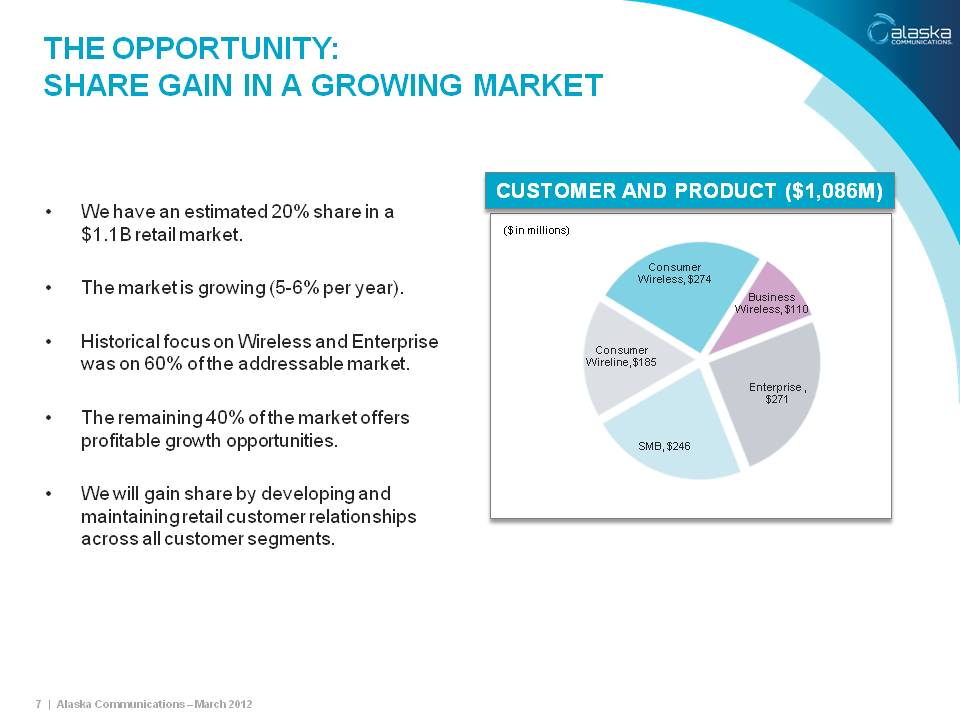
7 Alaska Communications – March 2012 THE OPPORTUNITY:SHARE GAIN IN A GROWING MARKET We have an estimated 20% share in a $1.1B retail market. The market is growing (5-6% per year). Historical focus on Wireless and Enterprise was on 60% of the addressable market. The remaining 40% of the market offers profitable growth opportunities. We will gain share by developing and maintaining retail customer relationships across all customer segments. Consumer Wireline, $185 Consumer Wireless, $274 Business Wireless, $110 Enterprise , $271 SMB, $246 CUSTOMER AND PRODUCT ($1,086M) ($ in millions)
8 Alaska Communications – March 2012 BUILDING BLOCKS FOR OUR BUSINESS PLAN Investment in our employees: Adding focused sales and increasing service teams for Enterprise, SMB and Consumer segments. A recognition that an engaged workforce is a prerequisite for performance. Leading customer experience: Improving process, systems and training across all sales. Developing the right teams to improve service delivery and service assurance. Leveraging our network and products: Maintaining our differentiation with continued investments in our network – 4G LTE, upgrading our Metro Ethernet and MPLS networks to the latest standards. Developing products and solutions that leverage our network, with greater emphasis on bundling and solution selling. Simplifying our business to reduce long term operating cost structures: Improve process to simplify how work gets done.

9 Alaska Communications – March 2012 OUR BUSINESS PLAN –KEY TAKEAWAYS 1.Robust Market: $1.1B retail telecom market in Alaska, growing 5-6% annually. 2.Opportunity: Our current market share is 20%. Historically, we have focused on 60% of this market –Wireless and Enterprise. We under-served the remaining 40% of the market –Small Medium Business and Consumer Broadband. Gaining a 5 point share in this overall market over a few years is $55-$60M in top line growth. 3.Focused on Growth: We do not intend to play defense. We intend to play offense, invest in our business and grow. We will invest in customer service, and our network and our products. 4.Reducing Debt: We will de-lever and strengthen our balance sheet. 5.Measures of success: Retail Revenue growth, and Free Cash Flow performance. 6.Build Shareholder Value: We are executing to this plan today.
10 Alaska Communications – March 2012