Attached files
Table of Contents
UNITED STATES
SECURITIES AND EXCHANGE COMMISSION
Washington, D.C. 20549
Form 10-K
| (Mark | One) |
| x | ANNUAL REPORT PURSUANT TO SECTION 13 OR 15(d) OF THE SECURITIES EXCHANGE ACT OF 1934 |
For the fiscal year ended December 31, 2011
or
| ¨ | TRANSITION REPORT PURSUANT TO SECTION 13 OR 15(d) OF THE SECURITIES EXCHANGE ACT OF 1934 |
For the transition period from to
Commission file number 1-34736
SEMGROUP CORPORATION
(Exact name of registrant as specified in its charter)
| Delaware | 20-3533152 | |
| (State or other jurisdiction of incorporation or organization) |
(I.R.S. Employer Identification No.) |
Two Warren Place
6120 S. Yale Avenue, Suite 700
Tulsa, OK 74136-4216
(918) 524-8100
(Address, including zip code, and telephone number, including area code, of registrant’s principal executive offices)
Securities registered pursuant to Section 12(b) of the Act:
| Title of Each Class |
Name of Each Exchange on Which Registered | |
| Class A Common Stock, par value $0.01 per share Common Share Purchase Rights Warrants to Purchase Common Stock |
New York Stock Exchange New York Stock Exchange New York Stock Exchange |
Securities registered pursuant to Section 12(g) of the Act:
None
Indicate by check mark if the registrant is a well-known seasoned issuer, as defined in Rule 405 of the Securities Act. Yes x No ¨
Indicate by check mark if the registrant is not required to file reports pursuant to Section 13 or Section 15(d) of the Act. Yes ¨ No x
Indicate by check mark whether the registrant (1) has filed all reports required to be filed by Section 13 or 15(d) of the Securities Exchange Act of 1934 during the preceding 12 months (or for such shorter period that the registrant was required to file such reports), and (2) has been subject to such filing requirements for the past 90 days. Yes x No ¨
Indicate by check mark whether the registrant has submitted electronically and posted on its corporate Web site, if any, every Interactive Data File required to be submitted and posted pursuant to Rule 405 of Regulation S-T (§232.405 of this chapter) during the preceding 12 months (or for such shorter period that the registrant was required to submit and post such files). Yes x No ¨
Indicate by check mark if disclosure of delinquent filers pursuant to Item 405 of Regulation S-K (§229.405 of this chapter) is not contained herein, and will not be contained, to the best of registrant’s knowledge, in definitive proxy or information statements incorporated by reference in Part III of this Form 10-K or any amendment to this Form 10-K. x
Indicate by check mark whether the registrant is a large accelerated filer, an accelerated filer, a non-accelerated filer, or a smaller reporting company. See the definitions of “large accelerated filer,” “accelerated filer” and “smaller reporting company” in Rule 12b-2 of the Exchange Act. (Check one):
| Large Accelerated Filer | x | Accelerated Filer | ¨ | |||||
| Non-Accelerated Filer | ¨ | (Do not check if a smaller reporting company) | Smaller Reporting Company | ¨ | ||||
Indicate by check mark whether the registrant is a shell company (as defined in Rule 12b-2 of the Exchange Act). Yes ¨ No x
The aggregate market value of the registrant’s Class A and Class B common stock held by non-affiliates at June 30, 2011, was $1,059,026,939, based on the closing price of the Class A common stock on the New York Stock Exchange on June 30, 2011.
Indicate by check mark whether the registrant has filed all documents and reports required to be filed by Section 12, 13 or 15(d) of the Securities Exchange Act of 1934 subsequent to the distribution of securities under a plan confirmed by a court. Yes x No ¨
At January 31, 2012, there were 41,798,893 shares of Class A Common Stock and 162,361 shares of Class B Common Stock outstanding.
DOCUMENTS INCORPORATED BY REFERENCE
Portions of the registrant’s Proxy Statement to be filed pursuant to Regulation 14A of the Securities Exchange Act of 1934, in connection with the registrant’s Annual Stockholders’ Meeting to be held on May 23, 2012, are incorporated by reference into Part III of this Form 10-K.
Table of Contents
SEMGROUP CORPORATION AND SUBSIDIARIES
FORM 10-K—2011 ANNUAL REPORT
Table of Contents
Table of Contents
Cautionary Note Regarding Forward-Looking Statements
Certain matters contained in this Form 10-K include “forward-looking statements” within the meaning of Section 27A of the Securities Act of 1933, as amended (the “Securities Act”), and Section 21E of the Securities Exchange Act of 1934, as amended (the “Exchange Act”). We make these forward-looking statements in reliance on the safe harbor protections provided under the Private Securities Litigation Reform Act of 1995.
All statements, other than statements of historical fact, included in this Form 10-K regarding the prospects of our industry, our anticipated financial performance, the anticipated performance of NGL Energy Partners LP, management’s plans and objectives for future operations, business prospects, outcome of regulatory proceedings, market conditions, and other matters, may constitute forward-looking statements. In addition, forward-looking statements generally can be identified by the use of forward-looking words such as “may,” “will,” “expect,” “intend,” “estimate,” “foresee,” “project,” “anticipate,” “believe,” “plans,” “forecasts,” “continue” or “could” or the negative of these terms or variations of them or similar terms. Although we believe that the expectations reflected in these forward-looking statements are reasonable, we cannot assure you that these expectations will prove to be correct. These forward-looking statements are subject to certain known and unknown risks, and uncertainties, as well as assumptions that could cause actual results to differ materially from those reflected in these forward-looking statements. Factors that might cause actual results to differ include, but are not limited to, those discussed in Item 1A of this Form 10-K, entitled “Risk Factors,” risk factors discussed in other reports that we file with the Securities and Exchange Commission (“SEC”), and the following:
| • | Our ability to generate sufficient cash flow from operations to enable us to pay our debt obligations or to fund our other liquidity needs; |
| • | Our ability to comply with the covenants contained in, and maintain certain financial ratios required by, our credit facilities; |
| • | Our ability to obtain additional capital on terms that are favorable to us; |
| • | The ability of our subsidiary, Rose Rock Midstream, L.P., to make minimum quarterly distributions to its unitholders, including us; |
| • | The operations of NGL Energy Partners LP, which we do not control; |
| • | The possibility that our hedging activities may result in losses or may have a negative impact on our financial results; |
| • | Any sustained reduction in demand for the petroleum products we gather, transport, process, and store; |
| • | Our ability to obtain new sources of supply of petroleum products; |
| • | Our failure to comply with new or existing environmental laws or regulations or cross border laws or regulations; |
| • | The possibility that the construction or acquisition of new assets may not result in the corresponding anticipated revenue increases; |
| • | The effects of having recently filed for and emerged from bankruptcy protection; |
| • | Any future impairment to goodwill resulting from the loss of customers or business; |
| • | Changes in currency exchange rates; and |
| • | The risks and uncertainties of doing business outside of the U.S., including political and economic instability and changes in local governmental laws, regulations and policies. |
New factors that could cause actual results to differ materially from those described in forward-looking statements emerge from time to time, and it is not possible for us to predict all such factors, or the extent to which any such factor or combination of factors may cause actual results to differ from those contained in any forward-looking statement.
Table of Contents
Readers are cautioned not to place undue reliance on any forward-looking statements contained in this Form 10-K, which reflect management’s opinions only as of the date hereof. Except as required by law, we undertake no obligation to revise or publicly release the results of any revision to any forward-looking statements.
As used in this Form 10-K, and unless the context indicates otherwise, the terms the “Company,” “SemGroup,” “we,” “us,” “our,” “ours,” and similar terms refer to SemGroup® Corporation, its consolidated subsidiaries, and its predecessors. We sometimes refer to crude oil, natural gas, natural gas liquids (natural gas liquids, or “NGLs,” include ethane, propane, normal butane, iso-butane, and natural gasoline), refined petroleum products, and liquid asphalt cement, collectively, as “petroleum products” or “products.”
Table of Contents
PART I
Items 1 and 2. Business and Properties
Overview
Our business is to provide gathering, transportation, storage, distribution, marketing, and other midstream services primarily to independent producers, refiners of petroleum products, and other market participants located in the Midwest and Rocky Mountain regions of the United States of America (the “U.S.”), Canada and the West Coast of the United Kingdom (the “U.K.”). We, or our significant equity method investees, have an asset base consisting of pipelines, gathering systems, storage facilities, terminals, processing plants, and other distribution assets located between North American production and supply areas, including the Gulf Coast, Midwest, Rocky Mountain and Western Canadian regions. We also maintain and operate storage, terminal and marine facilities at Milford Haven in the U.K. that enable customers to supply petroleum products to markets in the Atlantic Basin. We also operate a network of liquid asphalt cement terminals throughout Mexico. Our operations are conducted directly and indirectly through our primary operating segments.
Company Information
Our website is located at www.semgroupcorp.com. Our Annual Report on Form 10-K, quarterly reports on Form 10-Q, current reports on Form 8-K and all amendments to those reports filed or furnished pursuant to Section 13(a) or 15(d) of the Exchange Act, as well as proxy statements and other information we file with, or furnish to, the SEC are available free of charge on our website. We make these documents available as soon as reasonably practicable after we electronically file them with, or furnish them to, the SEC. The information contained on our website, or available by hyperlink from our website, is not incorporated into this Form 10-K or other documents we file with, or furnish to, the SEC. We intend to use our website as a means of disclosing material non-public information and for complying with our disclosure obligations under Regulation FD. Such disclosures will be included on our website in the “Investor Relations” sections. Accordingly, investors should monitor such portions of our website, in addition to following our press releases, SEC filings and public conference calls and webcasts.
Our History
SemGroup Corporation is a Delaware corporation. We were founded in February 2000 and are based in Tulsa, Oklahoma. During the period from February 2000 through July 2008, our asset and revenue base grew through a series of strategic acquisitions and capital expansion projects. During this time period, we made 64 acquisitions at an aggregate purchase price of approximately $1.1 billion, excluding amounts paid for working capital, and spent approximately $732 million on capital expansion projects.
Historically, we conducted significant physical and financial marketing and trading activities to take advantage of price differences related to time, location and quality of various energy commodity products and to utilize our transportation and storage assets. We also provided midstream energy related services such as gathering, storage, transportation, processing and distribution of petroleum products, both to third party customers and to ourselves.
As a result of trading losses incurred and other negative economic conditions, we faced a liquidity crisis and on July 22, 2008, we filed voluntary petitions for reorganization under Chapter 11 of the U.S. Bankruptcy Code, as well as applications for creditor protection under the Companies’ Creditors Arrangement Act in Canada (collectively, the “Bankruptcy”). During the Bankruptcy, we continued to operate our midstream energy-related businesses, exited certain non-core businesses and activities, disposed of certain assets and continued certain energy infrastructure construction projects. Certain of our business units also continued marketing activities to fulfill contractual obligations and to utilize their asset bases.
During the Bankruptcy, we took steps to restructure our business portfolio and to rebalance to a business heavily weighted toward fee-based asset activities and away from trading activities. As part of these steps, and
1
Table of Contents
subject to the terms of our debtor in possession credit facility, we attempted to sell certain assets. Due to the economic environment and a lack of available financing, bids for various assets came in below valuation expectations. In some cases, assets were not sold for strategic reasons. However, the assets of two business units, SemFuel and SemMaterials, were sold in a series of transactions during the divestiture process. For additional information relating to our recent divestitures, refer to Notes 6 and 7 of our consolidated financial statements beginning on page F-1 of this Form 10-K. Additionally, we ceased the operations of two other businesses, SemCanada Energy and SemEuro Supply. Also during the Bankruptcy, certain creditors foreclosed on our ownership interests in SemGroup Energy Partners G.P., L.L.C., the general partner of Blueknight Energy Partners, L.P., formerly known as SemGroup Energy Partners, L.P. (“Blueknight”), and also on our subordinated units in Blueknight. As a result, we no longer had, and we no longer have, any direct or indirect ownership interest in Blueknight.
On November 30, 2009, we emerged from the Bankruptcy as a newly reorganized company. We continue to provide midstream energy services in North America and the U.K. from an asset base consisting of pipelines, gathering systems, storage facilities, terminals, processing plants and other distribution assets. Midstream services are provided to independent producers, refiners of petroleum products and other market participants. We also selectively engage in marketing activities geared toward serving our customers and maximizing the value of our asset base.
As part of the reorganization, and in conjunction with approval from our creditors and the U.S. Bankruptcy Court, we appointed a new Board of Directors and senior management team. Norman Szydlowski was hired as Chief Executive Officer and brings considerable industry experience, management and leadership skills. Additionally, Robert Fitzgerald was hired as Senior Vice President and Chief Financial Officer and Candice Cheeseman was hired as General Counsel.
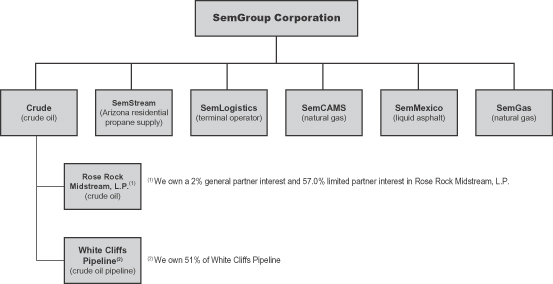
We conduct our operations through six primary business segments: Crude, SemStream®, SemLogistics, SemCAMS, SemMexico and SemGas®. The following diagram is a simplified organizational chart of our business segments:
We previously had a seventh business segment, SemCanada Crude, which aggregated and blended crude oil in Western Canada. Due to adverse market conditions impacting this segment, we sold the property, plant and equipment of SemCanada Crude in late 2010 and began winding down its operations.
2
Table of Contents
On November 1, 2011, we contributed the primary operating assets of our SemStream segment to NGL Energy Partners LP in exchange for cash and equity interests. We retained our ownership interest in SemStream’s Arizona residential business. (See Item 7. Management’s Discussion and Analysis of Financial Condition and Results of Operations for additional information.)
Rose Rock Midstream, L.P. (“Rose Rock”) was formed in August 2011. On November 29, 2011, SemGroup Corporation contributed a wholly-owned subsidiary, SemCrude, L.P., to Rose Rock, in return for limited partner interests, general partner interests, and certain incentive distribution rights in Rose Rock. On December 14, 2011, Rose Rock completed an initial public offering (“IPO”) in which it sold 7,000,000 common units representing limited partner interests. Based on our control of, and ownership interest in, Rose Rock, we continue to consolidate Rose Rock and account for other partnership interest in Rose Rock as non-controlling interest.
We previously referred to the crude business segment as SemCrude, but following the contribution of SemCrude, L.P. to Rose Rock, we decided to change the name of the segment to “Crude”. The Crude business segment holds a 51% ownership interest in White Cliffs Pipeline L.L.C. and a 2% general partner interest and a 57.0% limited partner interest in Rose Rock.
Industry Overview
We move petroleum products throughout the U.S., Canada, Mexico and the U.K. We provide gathering, transportation, storage, distribution, marketing and other midstream services to producers and refiners of petroleum products. The market we serve, which begins at the point of purchase at the source of production and extends to the point of distribution to the end-user customer, is commonly referred to as the “midstream” market.
Regional Production of Petroleum Products in the U.S.
The U.S. Department of Energy divides the continental U.S. into five geographic regions called Petroleum Administration for Defense Districts, or “PADDs”. PADD 2 is the Midwest region of the U.S. PADD 2 is the second largest PADD in terms of refinery production, surpassed only by PADD 3. As a result of the flow of petroleum products across and throughout the Midwest region, we believe PADD 2 is an important crude oil production, logistics and refining center.
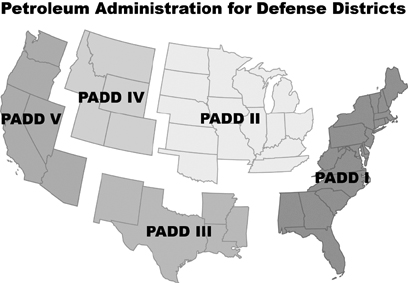
According to Energy Information Administration (“EIA”) data, as of November 2011, approximately 21%, or 3.7 million barrels per day (“Bpd”), of total U.S. daily refining capacity was in PADD 2. Also, according to November 2011 EIA reports, PADD 2 produces approximately 14%, or 0.8 million Bpd, of total U.S. daily crude oil production and imports approximately 13.6%, or 1.7 million Bpd, of total U.S. daily imports.
3
Table of Contents
PADD 2 refiners source crude oil from the Gulf Coast, Rocky Mountain, Canada’s Western Canadian Sedimentary Basin, which includes Alberta and parts of Saskatchewan to the East and British Columbia to the West, and major commodity hubs in the U.S. The production of petroleum products by PADD 2 refiners and processors historically has been less than the demand for petroleum products within that region, with the shortfall being supplied via common carrier pipelines primarily from the Gulf Coast, Canada and, to a lesser extent, the Rocky Mountain and East Coast regions. Additional petroleum product supply is available via barge transport up the Mississippi River with significant deliveries into local markets along the Ohio River.
Increased Importance of Independents and Specialization
In the 1990s, the major oil companies began focusing primarily on large-scale oil and gas projects. Until recently, this resulted in the major oil companies focusing more on foreign and deep-water exploration and production activities. As a result, they sold many of their North American integrated oil and gas assets, including producing properties, proprietary transportation systems, storage and distribution networks and refineries to independent operators. Whereas the major oil companies typically owned and operated proprietary networks that handled every aspect of the production, refining, storage, transportation and marketing of petroleum products, independent operators have generally focused on a single activity. As a result, the North American market is increasingly characterized by independent oil and gas producers and refiners that are generally without their own gathering, transportation, storage and distribution infrastructure. We focus on providing these services, using our asset base and distribution, processing and marketing expertise to provide independent operators with a stable source of supply and market access for their petroleum products.
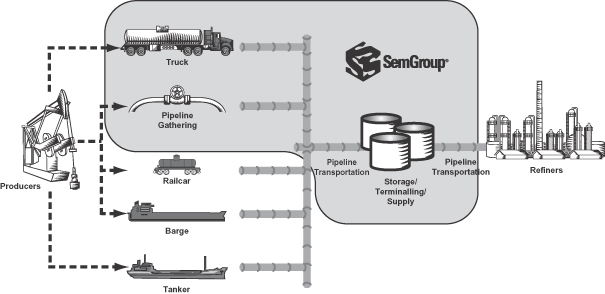
Crude Oil Industry Overview
Refined petroleum products, such as jet fuel, gasoline and distillate fuel oil, are all sources of energy derived from crude oil. According to 2010 data compiled by the EIA, petroleum currently accounts for about 44% of the nation’s total annual energy consumption. Growth in petroleum consumption is expected to keep pace with growth in overall energy consumption over the next 20 to 25 years. The EIA expects U.S. annual petroleum consumption to grow 13.5% from 17.1 million barrels per day in 2009 to 19.4 million barrels per day in 2035. The diagram below depicts the segments of the crude oil value chain and our participation in the crude oil industry.
4
Table of Contents
Our crude oil business operates primarily in Colorado, Kansas, North Dakota, Oklahoma and Texas where there are extensive crude oil production operations. Our assets extend from gathering systems in and around producing fields to transportation pipelines carrying crude oil to logistics hubs, such as the Cushing Interchange, where we have terminalling and storage facilities that aid our customers in managing the delivery of crude oil.
Gathering and Transportation
Pipeline transportation is generally the lowest cost method for shipping crude oil and transports about two-thirds of the petroleum shipped in the U.S. Crude oil pipelines transport oil from the wellhead to logistics hubs and/or refineries. Crude oil gathering assets generally consist of a network of smaller diameter pipelines that are connected directly to the well site or central receipt points delivering into larger diameter trunk lines. Logistic hubs like the Cushing Interchange provide storage and connections to other pipeline systems and modes of transportation, such as tankers, railroads and trucks. Trucking complements pipeline gathering systems by gathering crude oil from operators at remote wellhead locations not served by pipeline gathering systems. Trucking is generally limited to low volume, short haul movements because trucking costs escalate sharply with distance, making trucking the most expensive mode of crude oil transportation.
Storage Terminals and Supply
Storage terminals complement the crude oil pipeline gathering and transportation systems and address a fundamental imbalance in the energy industry wherein crude oil is often produced in different locations and at different times than it is ultimately consumed. Within the U.S., there are also geographical imbalances, as a substantial majority of the petroleum refining that occurs in the U.S. east of the Rocky Mountains is concentrated in the Gulf Coast region, particularly Louisiana and Texas which, according to the EIA, accounts for approximately 48% of all refining capacity in the United States. Over time, the crude oil storage business has evolved from its beginnings as a component of integrated production processes into a mature, stand-alone operation.
Terminals are facilities in which crude oil is transferred to or from a storage facility or transportation system, such as a gathering pipeline, to another transportation system, such as trucks or another pipeline. Terminals play a key role in moving crude oil to end-users, such as refineries, by providing the following services:
| • | inventory management; |
| • | distribution; and |
| • | upgrading to achieve marketable grades or qualities of crude oil. |
Overview of Cushing Interchange
The Cushing Interchange is one of the largest crude oil marketing hubs in the U.S. and is the designated point of delivery specified in all NYMEX crude oil futures contracts. As the NYMEX delivery point and a cash market hub, the Cushing Interchange serves as a significant source of refinery feedstock for Midwest refiners and plays an integral role in establishing and maintaining markets for many varieties of foreign and domestic crude oil.
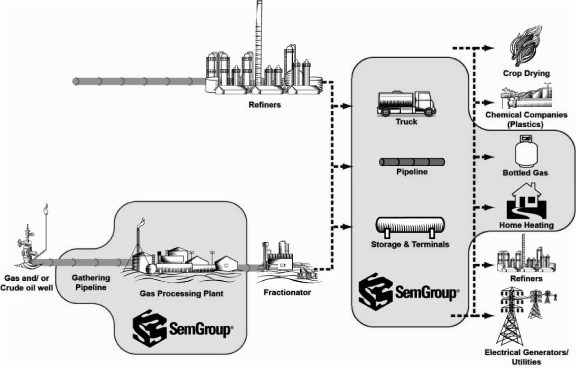
Natural Gas Industry Overview
In 2010, according to EIA data, natural gas was the second largest source of primary energy, accounting for 30% of total U.S. energy use in 2010. While the primary use for natural gas in the U.S. is for residential heating, it also has a number of commercial, industrial and electric generation uses across several different customer bases. The EIA forecasts that natural gas consumption will increase from 23.3 quadrillion BTU in 2009 to 27.24 quadrillion BTU in 2035.
5
Table of Contents
Since mid-2008, North American natural gas prices have declined significantly as a result of drilling technology improvements and the recent development of shale. Demand for natural gas and NGLs has historically been higher during the winter and lower during the summer, as gas is used primarily for heating and the need for it increases in cold months.
Natural gas passes through many stages before reaching end-users. First, exploration and production companies locate and produce natural gas. Second, gathering companies collect the natural gas, sometimes sending it to processing plants where liquids and other elements are removed. Third, transmission companies transport the gas through pipelines to storage units or areas of high demand. Finally, distributors deliver the gas to customers. The midstream natural gas industry is the link between upstream exploration and production activities and downstream end-use markets. The diagram below depicts the segments of the natural gas value chain and our participation in the natural gas industry.
We operate in the pipeline gathering and processing segments of the natural gas midstream industry in the U.S. and Canada. The operating fundamentals of Canadian natural gas processing operations differ somewhat from those in the U.S. The most significant difference is that, unlike U.S. natural gas processing facilities where the purchaser often purchases and owns the natural gas that it gathers and processes, in Canadian natural gas processing operations, the processor typically does not take title to the natural gas it gathers and processes. The processor, instead, receives fee income from transporting and processing natural gas owned by others.
As natural gas is processed to remove unwanted elements that interfere with pipeline transportation, higher value hydrocarbon liquids such as NGLs and condensate are separated from the raw natural gas stream. NGLs are obtained during the production and processing of natural gas or are a by-product from the crude oil distillation process within refineries. Supplies of NGLs are determined by the level of natural gas production, the amount of liquids in the gas, refining capacity utilization and by imports of NGLs. Condensate is a mixture of petroleum products consisting primarily of pentanes and heavier liquids extracted from natural gas. It is used to make gasoline, jet fuel and as a diluent used to dilute crude bitumen so that it can be transported by pipeline. We are engaged in residential propane supply operations in Page and Payson in Arizona.
6
Table of Contents
Gas Gathering
The natural gas gathering process begins with the drilling of wells into gas bearing rock formations. Once a well has been completed, the well is connected to a gathering system. Gathering systems typically consist of a network of small diameter pipelines and, if necessary, compression systems that collect natural gas from points near producing wells and transport it to larger pipelines for further transmission.
Gas Dehydration
Wellhead gas is generally fully saturated with water vapor. This water vapor must be removed from the gas stream to prevent formation of hydrates and condensation of free water in downstream facilities, to prevent corrosion and to meet downstream pipeline quality specifications. Dehydration is generally performed at central points along an upstream gathering system utilizing either a glycol absorption process or a solid desiccant adsorption process.
Gas Treating
In addition to water vapor, wellhead gas contains impurities such as carbon dioxide, nitrogen, hydrogen sulfide, helium, oxygen and other inert components. These impurities must be removed from the gas stream to protect downstream equipment, prevent corrosion and meet downstream pipeline quality specifications. They are removed through a variety of processes utilizing chemical reaction, absorption, adsorption or permeation.
Gas Processing
Natural gas delivered to the burner tip is almost pure methane. However, natural gas is produced from the reservoir containing impurities and heavier hydrocarbons entrained in the gas stream. The heavier hydrocarbons of NGLs must be removed from the wellhead gas stream before the gas is transported to market. These heavier hydrocarbons are removed by “processing” the gas at plants, either through temperature and pressure manipulation or absorption. The extracted heavier hydrocarbons have a high value and are sold separately to petrochemical manufacturers or wholesale marketers.
NGL Terminalling, Storage and Supply
The production of NGLs by gas processing plants and refineries is fairly constant throughout the year, whereas demand is seasonal. NGL terminalling and storage serves to balance this constant production or supply with the seasonal demand. Supply and marketing agreements are entered into with gas processors and refiners to market production on the supply side. This supply is then marketed to petrochemical plants and retail customers, as well as other consumers of NGLs.
Overview of North American NGL Hubs
There are four major North American NGL trading centers located at Edmonton, Alberta; Sarnia, Ontario; Conway, Kansas; and Mont Belvieu, Texas. These locations have substantial underground storage and are connected to NGL supply, transmission and distribution systems. Edmonton and Conway serve the U.S. midwest market while Sarnia and Mont Belvieu serve the U.S. northeast market. Mont Belvieu is the price reference point for North American NGL markets as it is the largest consuming region. Its strategic location on the Gulf Coast allows access to supplies from Europe, Africa and the Middle East. Mont Belvieu also has significant storage and pipelines to transport liquids to market and is close to large crude oil refineries. Petrochemical demand is approximately 42% of NGL demand and is the main factor affecting Mont Belvieu NGL prices. The two largest contributors to overall demand are weather, since propane is used in home heating and crop drying, and the petrochemical industry’s requirement for ethane. In general, NGLs are priced higher than natural gas to cover the cost for extraction.
7
Table of Contents
Mexican Asphalt Industry
Mexico is the 14th largest country in the world based on land area and the 11th largest country in terms of population. Although its land area is only one-fifth the size of the U.S., Mexico has a population of roughly one-third that of the U.S. Mexico has a large and diverse road network in place. Mexico’s land transportation network is one of the most extensive in Latin America with over 220,000 miles of paved roads. Roads are a critically important component of Mexico’s transportation infrastructure, with 99% of its passengers and 59% of its cargo being transported over road surfaces. The use of rail and water transportation in Mexico, in most cases, is either not practical or not available. As a result, roads are a high priority item of the country. The total current demand for road asphalt products in Mexico is roughly 2.1 million metric tons per year, requiring approximately 1.8 million metric tons of asphalt, either as a raw material or for end-use.
Mexico’s national highway infrastructure is comprised of three main components: the federal network (which includes both toll and toll-free roads) accounting for approximately 13% of all roads, the regional network accounting for approximately 21%, and the rural network consisting of approximately 66%. The federal road system is the responsibility of the Secretary of Communications and Transportation (SCT), while the regional network of roads is the responsibility of state governments. Rural and state roads and low-volume roads are also improved by the states. These networks help establish the annual demand for asphalt. Asphalt demand can increase, or decline, at a pace comparable to the level of on-going highway expansion and/or maintenance projects. Such projects rely on the availability of government concessions, continued public-private partnership undertakings and locally funded ventures.
European Petroleum Products Storage Industry
Storage for refined products and crude oil is critical to the European economy. Fluctuations in demand for crude oil and transportation fuels, combined with changing flows of petroleum product production and refining capacity, means storage is necessary to balance demand. Additionally, supply and demand disruptions due to weather, industry upsets, political tensions and terrorism have forced industry participants to understand the significance that access to storage, and the availability of storage, will have over the future years.
The independent storage industry has experienced fluctuating demand for its services over recent years from major oil companies, oil traders and strategic storage agencies (government entities that store fuel to protect against significant fluctuations in supply or demand as mandated by the European Union and the International Energy Agency). The construction of new tank storage facilities has historically been restricted, resulting in a supply shortage. However, high crude oil prices and backwardated market conditions (i.e., prices for future deliveries are lower than current prices) have had a negative effect on storage economics. As a result, demand for such storage facilities is currently weak.
Our Business
We provide gathering, transportation, storage, distribution, marketing and other midstream services primarily to independent producers, refiners of petroleum products and other market participants located in the Midwest and Rocky Mountain regions of the U.S., Canada and the West Coast of the U.K. We, or our significant equity method investees, have an asset base consisting of pipelines, gathering systems, storage facilities, terminals, processing plants and other distribution assets located between North American production and supply areas, including the Gulf Coast, Midwest, Rocky Mountain and Western Canadian regions. We also maintain and operate storage, terminal and marine facilities at Milford Haven in the U.K. that enable customers to supply petroleum products to markets in the Atlantic Basin. We also operate a network of liquid asphalt terminals throughout Mexico.
We gather, purchase, transport, store, distribute and market petroleum products to markets primarily in the Midwest, ensuring that our customers have consistent access to petroleum products supply and markets. Our strategically located pipelines, terminals and storage tanks, with access to North American transportation pipeline interconnects, are well positioned to benefit from the continuing need to transport and gather petroleum products from areas of supply to areas of demand.
8
Table of Contents
Our Property, Plant and Equipment
Assets include:
| • | a 51% ownership interest in White Cliffs Pipeline, which owns a 527-mile pipeline that transports crude oil from Platteville, Colorado to Cushing, Oklahoma (Crude operates White Cliffs); |
| • | a 2% general partner interest and a 57.0% limited partner interest in Rose Rock, which owns an approximately 640-mile crude oil pipeline network in Kansas and Oklahoma and a crude oil storage facility in Cushing, Oklahoma with a capacity of over 5.0 million barrels; |
| • | 8.93 million common units of NGL Energy Partners LP (32.2% of the common units outstanding at December 31, 2011) and a 7.5% interest in NGL Energy Holdings LLC, the general partner of NGL Energy Partners LP; |
| • | more than 1,700 miles of natural gas and NGL transportation, gathering and distribution pipelines in Arizona, Kansas, Oklahoma and Texas and Alberta, Canada; |
| • | 8.7 million barrels of owned multi-product storage capacity located in the United Kingdom; |
| • | 14 asphalt terminals in Mexico; |
| • | majority interest in four natural gas processing plants located in Alberta, Canada, with a combined operating capacity of 654 MMcf/d; and |
| • | three natural gas processing plants located in Oklahoma and Texas, with a combined operating capacity of 78 MMcf/d. |
We believe that the variety of our petroleum product assets creates opportunities for us and our customers year round.
Business Strategy
Our principal business strategy is to utilize our assets and operational expertise to:
| • | move petroleum products throughout the U.S., Canada, Mexico and the U.K.; |
| • | provide consistently reliable high-quality midstream services under predominantly fee and margin based contractual arrangements; |
| • | mitigate commodity price risk exposure; |
| • | aggressively manage operating costs to maintain and improve operating margins; |
| • | expand business by improving, enhancing and expanding services at existing facilities and gaining new customers; |
| • | pursue complementary “bolt-on” growth opportunities having acceptable risks and returns; and |
| • | generate consistent operating margins, earnings and cash flows. |
Our Business Segments
We conduct our business through six business segments:
| • | Crude; |
| • | SemStream; |
| • | SemLogistics; |
| • | SemCAMS; |
9
Table of Contents
| • | SemMexico; and |
| • | SemGas |
For information relating to revenue and total assets for each segment, refer to Note 10 of our consolidated financial statements beginning on page F-1 of this Form 10-K.
The following sections present an overview of our business segments, including information regarding the principal business and services rendered, assets and operations and markets and competitive strengths. Our results of operations and financial condition are subject to a variety of risks. For information regarding our key risk factors, see “Item 1A. Risk Factors.”
Crude
Crude’s business operations are conducted through its 51% ownership interest in White Cliffs Pipeline, L.L.C. (which Crude operates) and a 2% general partner interest and 57.0% limited partner interest in Rose Rock. These operations include crude oil transportation, storage, terminalling, gathering and marketing in Colorado, Kansas, Montana, North Dakota, Oklahoma and Texas for third party customers as well as for itself. The Crude business unit consists of three primary operations: (i) Kansas and Oklahoma pipeline system (Rose Rock); (ii) Cushing storage (Rose Rock); and (iii) the White Cliffs Pipeline. A majority of Crude’s revenue is generated from fee-based contractual arrangements that, in some instances, are fixed and not dependent on usage. For purposes of this discussion of Crude’s operations, all Rose Rock and White Cliffs Pipeline operations will be referred to as “Crude”.
Assets and Operations
Cushing Storage. Crude owns and operates over 5.0 million barrels of crude oil storage in Cushing, Oklahoma, with an additional 1.95 million barrels of crude oil storage under construction. Crude directly utilizes, and provides to customers, fee-based storage and terminal services from owned assets in Cushing. Currently, most of our owned operating storage capacity at Cushing is leased to third-party customers. Crude also owns and operates a delivery/receipt pipeline to connect its storage operations to Enterprise Products Partners, LP’s facility in Cushing, which is the hub where all NYMEX barrels are delivered. We have additional acreage and infrastructure in place to significantly expand storage capacity at Cushing.
Kansas and Oklahoma Pipeline. Crude owns and operates an approximately 640-mile crude oil gathering and transportation pipeline system and related pipeline storage tanks in Kansas and northern Oklahoma. The pipeline system connects to several third party trunk pipelines in Kansas, several refineries, and storage terminals located at Cushing, Oklahoma. The Kansas and Oklahoma pipeline system can currently transport approximately 40,000 barrels of crude oil per day.
White Cliffs Pipeline. Crude owns and operates a modern, ten-lane crude oil truck unloading facility in Platteville, Colorado, which connects to the origination point of the White Cliffs Pipeline, which was first placed into service in 2009. Substantially all of the crude oil production from the DJ Basin and nearby Niobrara Shale must initially be transported by truck due to a shortage of gathering capacity, and the White Cliffs Pipeline is the only direct pipeline out of the DJ Basin to the Cushing market and to Mid-Continent refineries. Throughput at the facility averaged 32,400 barrels per day and 25,800 barrels per day for the years ended December 31, 2011 and 2010, respectively. The facility includes 220,000 barrels of crude oil storage capacity.
Crude also owns 51% of, and operates, a 527-mile common carrier, crude oil pipeline system that originates in Colorado and terminates in Cushing, Oklahoma (the “White Cliffs Pipeline”). The White Cliffs Pipeline provides the Denver-Julesburg Basin (“DJ Basin”) producers in Colorado direct access to the Cushing market and to refiners in the Midwest area. The White Cliffs Pipeline also includes a 100,000 barrel crude oil storage tank and a truck unloading facility owned and operated by Crude and located and connected at the White Cliffs Pipeline’s origination point at Platteville, Colorado. The White Cliffs Pipeline’s capacity is 70,000 barrels of
10
Table of Contents
crude oil per day. The White Cliffs Pipeline became fully operational on June 1, 2009. Crude currently owns 51% of the White Cliffs Pipeline. The other 49% is owned as follows: 34% by Plains Pipeline, L.P. (“Plains”), 10% by Anadarko Wattenberg Company, LLC (“AWC”) and 5% by Samedan Pipe Line Corporation (“Noble Energy”). AWC and Noble Energy have each entered into throughput agreements with us for the shipment of their product on the White Cliffs Pipeline. (See Note 5 of our consolidated financial statements beginning on page F-1 of this Form 10-K for additional information.)
In addition to these operations, Crude conducts a crude oil aggregation, marketing and blending business in the Bakken shale play area in North Dakota, utilizing two truck unloading facilities. Crude oil is purchased, transported via owned trucks, shipped on an Enbridge Pipeline (utilizing a historical pipeline allocation) or via rail and marketed. (This part of the Crude business was previously conducted by SemCanada Crude, but prior to the sale of the SemCanada Crude assets, as previously noted, this activity was transferred to Crude.) There are currently more rigs working in this shale play than any other in the U.S. As more volume moves southeast from the Bakken to Cushing, our assets are very well positioned to benefit in an upsurge in activity.
Revenue and Marketing
A majority of Crude’s revenue is derived from fee-based contractual arrangements with third party customers. The White Cliffs Pipeline has two throughput contracts that require each shipper to pay a minimum fixed monthly payment for the capacity allocated to it on the pipeline, regardless of the capacity actually utilized. The agreements run through May 2014, although they could end sooner if the contracted volumes are shipped before that date. In addition, other parties may ship on White Cliffs Pipeline at FERC based rates. The Kansas and Oklahoma pipeline system provides transportation and storage services to customers on fee-based arrangements, typically based on usage with varying term lengths. Cushing storage capacity is provided to customers under fixed fee contractual arrangements, typically based on the amount of storage capacity reserved for each customer.
In addition to third party customer revenue, Crude generates revenue from limited marketing activities. Crude’s U.S. marketing includes purchasing crude oil for its own account from producers and aggregators and selling crude oil to traders and/or refiners.
We mitigate the commodity price exposure of our crude oil marketing operations by limiting our net open positions through (i) the concurrent purchase and sale of like quantities of crude oil to create “back-to-back” transactions intended to lock in positive margins based on the timing, location or quality of the crude oil purchased and delivered, or (ii) derivative contracts. All of our marketing activities are subject to our comprehensive risk management policy which establishes limits in order to manage risk and mitigate financial exposure. Our marketing activities account for a portion of the revenue we generate on our Kansas and Oklahoma pipeline system and through our Bakken Shale operations.
Market and Competitive Strengths
Crude’s pipelines are located in areas where they have the ability to move crude oil to Cushing. The Cushing Interchange is one of the largest crude oil marketing hubs in the U.S. and the designated point of delivery specified in all NYMEX crude oil futures contracts. As the NYMEX delivery point and a cash market hub, the Cushing Interchange serves as a significant source of refinery feedstock for PADD 2 refiners and plays an integral role in establishing and maintaining markets for many varieties of foreign and domestic crude oil. The White Cliffs Pipeline is the only direct route out of the DJ Basin in Colorado to Cushing. The Kansas/Oklahoma pipeline system allows Kansas producers and purchasers access to local refineries and Cushing.
SemStream
SemStream is engaged in the residential propane supply business through its wholly-owned subsidiary, SemStream Arizona Propane, L.L.C. (“SemStream Arizona”), with operations in Page and Payson, Arizona and holds our interests in NGL Energy Partners LP.
11
Table of Contents
Assets and Operations
| • | A regulated underground utility business and a non-regulated propane bulk business with over 200 miles of associated NGL pipeline and aggregate total of approximately 12,000 customers; and |
| • | SemStream holds SemGroup’s ownership interests in NGL Energy Partners LP (“NGL Energy”), a master limited partnership, publicly traded on the New York Stock Exchange (“NYSE”) as “NGL”. NGL Energy is a diversified partnership engaged in retail propane operations from coast to coast as well as midstream propane terminal operations. |
SemStream Arizona is engaged in retail sales and downstream distribution of propane. It includes a regulated underground utility business and a non-regulated propane bulk business, serving approximately 12,000 residential customers in Arizona. The regulated business serves approximately 10,000 customers through two regulated utilities operating underground vapor systems in and around Payson and Page, Arizona. The non-regulated operations include the retail distribution of bulk propane to approximately 2,000 customers in these same Arizona communities and in certain Utah/Arizona border communities. SemStream Arizona’s assets include over 200 miles of underground pipelines, propane storage and other equipment.
Revenue and Marketing
Through our regulated utility in Arizona, we market propane directly to approximately 10,000 residential customers connected through a low pressure pipeline delivery system. Non-regulated operations in Arizona provide retail distribution to an additional 2,000 customers.
SemLogistics
SemLogistics owns the largest independent petroleum products storage facility in the U.K. The main activities of SemLogistics are the receipt, storage and redelivery of clean petroleum products and crude oil at the Milford Haven site.
Assets and Operations
SemLogistics operates a tank storage business and offers build-bulk (importing small cargos, building volume and exporting larger cargos) and break-bulk (importing larger cargos and exporting smaller cargos) operations to its customers that transport products from the Middle East to Europe, the east coast of the U.S. and the west coast of Africa. The terminal is strategically located to access the U.K. market and to service numerous global markets.
SemLogistics’ storage facility includes approximately 8.7 million barrels of above ground storage tanks and has received approval from Pembrokeshire County Council to build nine new tanks with a total storage capacity of 1.5 million barrels. The construction of new tankage is dependent on, and will commence when, the supply and demand for additional product storage is prudent. The terminal has two deep water jetties, one of which can accommodate vessels of up to 165,000 dead weight tons. It also has access to Mainline Pipeline Limited (pipeline from Milford Haven to Manchester and Nottingham), which is owned by four major oil companies.
Over 40% of SemLogistics’ storage capacity is multi-product, providing customers with tank storage for clean petroleum products, including gasoline, gasoline blendstocks, jet fuel, gas oil and diesel. The remaining tankage is either dedicated to crude oil or dual-purpose tankage for at least two clean petroleum products (gasoline/jet fuel or gasoline/gas oil or jet fuel/gas oil). SemLogistics also provides related services, e.g., tank-to-tank transfers, mixing of gasoline blendstocks, and kerosene marking.
12
Table of Contents
Revenue and Marketing
SemLogistics generates revenue from fixed-fee storage tank leasing and related services by making available to third parties all of the terminal’s available tank capacity for the storage of crude oil and refined products. Customers fall into three broad categories: trading, structural marketing storage and compulsory strategic storage.
Markets and Competitive Strength
SemLogistics’ ability to handle multiple products provides flexibility to change its operations in response to market conditions. Demand for independent storage terminals can be impacted by a wide range of influences such as the forward price curve, expanding oil production, security of supply concerns, European compulsory stock holding requirements, and mismatches in regional production and consumption of oil and refined petroleum products.
SemLogistics’ terminal size (approximately 23% of the total independent storage in the U.K.) and its vessel handling capabilities make it unique compared with other terminals. In addition to being the only independent U.K. facility that serves the bulk trans-shipment sector, it is also the only facility capable of handling crude oil, with the only other comparable facility in the British Isles being a terminal in Ireland. However, the owner of this other facility, a major oil company, uses its terminal exclusively for proprietary storage and storage of Irish strategic stocks.
SemCAMS
We own and operate four natural gas processing and gathering facilities in Alberta, Canada. The principal process performed at the processing plants is to “sweeten” sour natural gas by removing sulfur. Approximately two-thirds of the total natural gas throughput at our processing plants is sour gas. All of SemCAMS’ assets are located in West-Central Alberta, in the heart of the Western Canadian Sedimentary Basin, which accounts for approximately 80% of Canada’s sour natural gas production.
Assets and Operations
SemCAMS owns and operates varying working interests in (i) two sour natural gas processing plants known as the Kaybob South No. 3 plant (the “K3 Plant”), and the Kaybob Amalgamated plant (the “KA Plant”); (ii) two sweet gas plants known as the West Fox Creek plant and the West Whitecourt plant (the “WW Plant”), and (iii) a network of more than 600 miles of natural gas gathering and transportation pipelines. The sour gas plants are dually connected to two major long-haul natural gas pipelines that serve Canada and the U.S. The plants also have the ability to load product for transportation by truck and railcar.
Revenue and Marketing
SemCAMS generates revenue from the processing plants through volumetric fees for services under contractual arrangements with working interest owners and third party customers. SemCAMS does not have direct exposure to commodity prices. In addition, SemCAMS generates fee-based revenue from volume throughput on its pipelines. SemCAMS’ customers include producers of varying sizes.
SemCAMS also derives revenue as the operator of pipeline gathering systems that gather gas from multiple wells located in the same production unit and as the operator of pipeline transportation systems that deliver the gathered gas to each plant.
To support operations at our plants, several producers have committed to process all of their current and future natural gas production from lands owned by them, or their subsequent assignees, within a “dedicated area” comprised of approximately 180 townships located in and around our plants. The “dedicated area” covers approximately 27% of the volumes in the area surrounding our plants. This dedication continues until field depletion.
13
Table of Contents
Market and Competitive Strengths
SemCAMS’ natural gas gathering and processing operations are located in an area that generates more than 95% of Canada’s total natural gas production and approximately 80% of Canada’s total sour gas production. Natural gas is used for a variety of purposes in Canada including heating, electricity production and other industrial processes.
SemMexico
SemMexico provides a variety of liquid asphalt cement products and product application services to the Mexican market. SemMexico purchases, produces, stores and distributes asphalt products throughout Mexico. SemMexico’s primary supplier of asphalt is Pemex, Mexico’s state-owned petroleum company. SemMexico is the largest asphalt distributer in Mexico and, in addition to direct asphalt cement sales, further processes asphalt materials in combination with other raw materials to produce value-added products. These products, such as polymer modified asphalts and asphalt emulsions, are then sold to road contractors and government agencies.
Assets and Operations
SemMexico currently operates an in-country network of 12 asphalt cement terminals and modification facilities, two emulsion distribution terminals and one portable rail unloading facility to import asphalt from the U.S. SemMexico’s national technical center and headquarters are located in the city of Puebla, Mexico.
Revenue and Marketing
SemMexico generates revenues through the sale of asphalt product to customers. In general, SemMexico’s sales and purchases of asphalt cement are matched; SemMexico procures product on an as-needed basis, thereby limiting exposure to price movements of inventory. SemMexico’s focus is to maintain its reputation as a quality supplier of asphalt products by consistently producing high quality products and introducing technologically advanced products and solutions to Mexico’s asphalt market, while simultaneously increasing production capacity and product distribution availability.
Market and Competitive Strengths
SemMexico is a leader in asphalt pavement technologies and capabilities. It is the only liquid asphalt cement company with a national footprint in Mexico. These factors have resulted in a long-term supply relationship with Pemex and continuous business transactions with its customers. SemMexico is exposed to market risk, such as the sustainability of road construction and maintenance funds from the Mexican government. However, we believe that SemMexico’s significant market position, reputation, technology and long-term relationships with suppliers and customers are strategic strengths that will benefit SemMexico if funding or demand should increase.
SemGas
SemGas provides natural gas gathering and processing services. It has gathering and processing plants and assets in Kansas, Oklahoma and Texas. SemGas aggregates gas supplies from the wellhead and provides various services to producers that condition the wellhead gas production for downstream markets.
Assets and Operations
SemGas currently owns and operates over 800 miles of gathering pipelines in Kansas, Oklahoma and Texas. SemGas has one processing plant located in Sherman, Texas, with a processing capacity of 23 million cubic feet per day and over 400 miles of low pressure gathering lines. SemGas also has two plants in Northern Oklahoma (Nash and Hopeton) located roughly 20 miles apart, with a combined processing capacity of approximately 55 million cubic feet per day. This area, also called the Mississippi Zone, has emerged into a key oil resource
14
Table of Contents
play with associated gas. There are approximately 690,000 acres dedicated to SemGas, from several area producers, with about 60,000 acres in the core of the emerging Mississippian play.
Additionally, SemGas owns a Eufaula gathering system which gathers, dehydrates and compresses gas in eastern Oklahoma, and a gathering system in Kansas.
Revenue and Marketing
SemGas generates revenue from a portfolio of contracts. Initial contract terms can range from two years to the life of the reserves and, upon expiration, continue to renew on a month-to-month or year-to-year evergreen basis. The majority of the contracts provide upside potential by providing SemGas participation in commodity price and processing margin upswings through percent-of-proceeds and percent-of-index contracts. On these contracts, SemGas is generally responsible for marketing the gas and NGLs for both its and the producers’ share of the products. Percent-of-proceeds contracts are based on SemGas paying the producers a percentage of the sale proceeds from the products and percent-of-index contracts are based on SemGas paying the producers a percentage of the sale proceeds based on an index price. SemGas also has fee-based contracts for processing and gathering services. SemGas’ customers include producers, operators, marketers and traders.
Market and Competitive Strengths
SemGas’ gathering and processing volumes can be impacted by market demand for the products it handles, as well as the price for crude oil because the Mississippi Zone is primarily a crude oil play with associated natural gas and natural gas liquids. Gathering and processing activities are also reliant on continued drilling and production activity by producers in our areas of operation. While price increases in natural gas might lead to increased drilling and supply, price increases can also adversely affect demand.
We face competition in acquiring new natural gas supplies. The natural gas gathering and processing industry is generally characterized by regional competition, based on the proximity of gathering systems and processing plants to natural gas producing wells. SemGas’ gathering and processing assets tend to have relatively long-term contracts and, in some instances, are the only assets that can provide the offered services to the customers.
SemGas generally sells all natural gas and NGLs it obtains under its percentage-of-proceeds and percentage-of-index contracts immediately in the spot market and, therefore, has little commodity price risk with respect to inventory or other physical commodity positions. SemGas’ percentage-of-proceeds and percentage-of-index processing contracts intrinsically have commodity price risk since SemGas’ fees, with respect to these contracts, vary with the level of natural gas and commodity prices. SemGas may elect to use financial derivatives to hedge this risk. SemGas is limited in the amount, and in the time period, for which it may hedge its commodity price risk associated with its contracts pursuant to our Comprehensive Risk Management Policy. More generally, all of our marketing and hedging activities are subject to our Comprehensive Risk Management Policy which establishes a set of limits, both at the SemGas and the SemGroup Corporation levels, to manage risk and mitigate financial exposure.
Risk Governance and Comprehensive Risk Management Policy
We expect to generate the majority of our earnings from owning and operating strategic assets while endeavoring to prudently manage all risks, including commodity price risk, associated with the ownership and operations of our assets. We have a Comprehensive Risk Management Policy that reflects an enterprise-wide approach to risk management and considers both financial and non-financial risks.
Our Board of Directors is responsible for the oversight of our enterprise-wide risk and has approved our Comprehensive Risk Management Policy. The Comprehensive Risk Management Policy is designed to ensure we:
| • | identify and communicate our risk appetite and risk tolerances; |
15
Table of Contents
| • | establish an organizational structure that prudently separates responsibilities for executing, valuing and reporting our business activities; |
| • | value (where appropriate), report and manage all material business risks in a timely and accurate manner; |
| • | effectively delegate authority for committing our resources; |
| • | foster the efficient use of capital and collateral; and |
| • | minimize the risk of a material adverse event. |
The Audit Committee of our Board of Directors has oversight responsibilities for the implementation of, and compliance with, our Comprehensive Risk Management Policy.
Our Executive Management Committee, comprised of corporate officers, oversees the financial and non-financial risks associated with all activities governed by our Comprehensive Risk Management Policy including:
| • | asset operations; |
| • | marketing and trading; |
| • | investments, divestitures, and other capital expenditures and dispositions; |
| • | credit risk management; and |
| • | other strategic activities. |
We also have a Risk Management Group that is assigned responsibility for independently monitoring compliance with, reporting on, and enforcing the provisions of our Comprehensive Risk Management Policy.
Our Comprehensive Risk Management Policy provides a set of limits or thresholds for activities related to owned assets, physical commodities, and derivatives and capital transactions involving market and credit risk. Our limits monitor these risks for each individual segment and on a consolidated basis. Our Comprehensive Risk Management Policy also specifies the types of transactions that may be executed by incumbents of named positions without specific approval of our Board of Directors or our Executive Management Committee. It also restricts proprietary trading activities within limits significantly more restrictive than the corporate market risk management limits.
Competition
We face intense competition in the operations of each of our segments. Our competitors include other midstream companies, major integrated oil companies and their marketing affiliates, crude oil pipeline companies and independent gatherers, brokers and marketers of petroleum products of widely varying sizes, financial resources and experience. Some of these competitors have capital resources many times greater than ours and control greater supplies of crude oil and petroleum products. Competition for customers of petroleum products is based primarily on price, access to supply, access to logistics assets, distribution capabilities, the ability to meet regulatory requirements, and maintenance of quality of service and customer relationships.
Operational Hazards and Insurance
Pipelines, terminals, storage tanks, processing plants or other facilities may experience damage as a result of an accident, natural disaster or deliberate act. These hazards can also cause personal injury and loss of life, severe damage to, and destruction of, property and equipment, pollution or environmental damage and suspension of operations. Through the services of a major national insurance broker, we have maintained insurance of various
16
Table of Contents
types and varying levels of coverage similar to that maintained by other companies in the industry and which we consider adequate, under the circumstances, to cover our operations and properties, including coverage for natural catastrophes, pollution related events and acts of terrorism and sabotage. The limit of operational insurance maintained covering loss of, or damage to, property and products is $300 million per loss and includes business interruption loss. For claims arising under general liability, automobile liability and excess liability, the limits maintained total $250 million per occurrence/claim. Primary and excess liability insurance limits maintained for pollution liability claims vary by location for claims arising from gradual pollution with limits ranging from $20 million to $40 million in the aggregate. The combined primary and excess liability insurance limits for claims arising from sudden and accidental pollution total $270 million per claim and $290 million in the aggregate. This insurance does not cover every potential risk associated with the operating pipelines, terminals and other facilities. We have a favorable claims history enabling us to self-insure the “working layer” of loss activity utilizing deductibles and self-insured retentions commensurate with our financial abilities and in line with industry standards, in order to create a more efficient and cost effective program and a consistent risk profile. The working layer consists of high frequency/low severity losses that are best retained and managed in-house. Sizeable or difficult self-insured claims or losses may be handled by professional adjusting firms hired by us. We will continue to monitor the appropriateness of our deductibles and retentions as they relate to the overall cost and scope of our risk and insurance program.
With a few limited exceptions, our customers have not agreed to indemnify us for losses arising from a release of crude oil, and we may instead be required to indemnify our customers in the event of a release or other incident.
Regulation
General
Our operations are subject to extensive regulation. The following discussion of certain laws and regulations affecting our operations should not be relied on as an exhaustive review of all regulatory considerations affecting us, due to the myriad of complex federal, state, provincial, foreign and local regulations that may affect our business.
Regulation of U.S. Pipeline and Storage Operations
Interstate Storage and Transportation
White Cliffs Pipeline is subject to regulation by the Federal Energy Regulatory Commission (“FERC”) because the rates charged to shippers on the pipeline system are required to be filed with, and accepted by, FERC. Under the Interstate Commerce Act (the “ICA”), FERC has authority to regulate companies that provide interstate petroleum based products pipeline transportation services, including pipeline operational transportation related storage services. FERC’s authority to regulate those interstate services includes the rates charged for services, terms and conditions of service, maintenance of accounts and records and various related ancillary matters. Regulated companies may not charge rates that have been determined not to be “just and reasonable” by FERC. The rates, terms and conditions for our service are found in FERC-approved tariffs. Pursuant to FERC’s jurisdiction over rates, existing rates may be challenged by complaint and proposed rate increases and proposed changes in terms and conditions of service may be challenged by protest. In addition, FERC prohibits petroleum and NGL based products transportation from unduly preferring, or unreasonably discriminating against, any person with respect to pipeline rates or terms and conditions of service.
Gathering and Intrastate Pipeline Regulation
The ICA, the Natural Gas Act (the “NGA”) and the Natural Gas Policy Act of 1978 do not apply to intrastate petroleum and natural gas based products facilities and activities, i.e., those that are not used or usable in the conduct of interstate commerce. FERC has ruled that intrastate petroleum and natural gas gathering
17
Table of Contents
systems are exempt from regulation by the Commission. We own a number of natural gas pipelines that we believe operate wholly intrastate and are, therefore, exempt from FERC regulation. We also own a number of intrastate crude oil gathering systems that are subject to state and local, but not federal regulation. These gathering systems are currently operated as proprietary systems and may be subject to regulation by FERC in the future.
In the states in which we operate, regulation of intrastate natural gas and crude oil gathering facilities and intrastate crude oil pipeline service generally includes various safety, environmental and, in some circumstances, nondiscriminatory take requirements and complaint-based rate regulation. For example, our natural gas gathering facilities are, in some cases, subject to state ratable take and common purchaser statutes. Ratable take statutes generally require gatherers to take, without undue discrimination, natural gas production that may be tendered to the gatherer for handling. Common purchaser statutes generally require gatherers to purchase without undue discrimination as to source of supply or producer. These statutes are designed to prohibit discrimination in favor of one producer over another producer or one source of supply over another source of supply. These statutes have the effect of restricting our right, as an owner of gathering facilities, to decide with whom we contract to purchase or transport natural gas.
Department of Transportation
All crude oil and liquefied petroleum gases interstate pipelines, and certain intrastate crude oil and liquefied petroleum gases pipelines and storage facilities, are subject to regulation by the Department of Transportation (the “DOT”) with respect to the design, construction, operation and maintenance of the pipeline systems and storage facilities. The DOT routinely conducts audits of the regulated assets and we must make certain records and reports available to the DOT for review as required by the Secretary of Transportation. In some states, the DOT has given a state agency authority to assume all or part of the regulatory and enforcement responsibility over the intrastate assets.
Regulation of NGL Terminals, Distribution and Utility Operations
SemStream’s Arizona non-regulated and regulated propane distribution operations are subject to the code set forth in the National Fire Protection Association Standard #58 (“NFPA 58”), Standard for the Storage and Handling of Liquefied Petroleum Gases. Arizona state agencies routinely conduct physical audits to ensure compliance with such regulations.
SemStream Arizona’s utility operations are subject to regulation by the Arizona Corporation Commission (“ACC”). The ACC regulates the sale price of propane gas to customers connected to our underground propane gas systems in Payson and Page, Arizona. The ACC also conducts annual inspections of the Payson and Page utility underground pipeline systems under authority delegated to it from the DOT.
Trucking Regulation
Through our interest ownership in Rose Rock, we operate a fleet of trucks to transport crude oil. We are licensed to perform both intrastate and interstate motor carrier services and are subject to certain safety regulations issued by the DOT. DOT regulations cover, among other things, driver operations, maintaining log books, truck manifest preparations, the placement of safety placards on the trucks and trailer vehicles, drug and alcohol testing, safety of operation and equipment and many other aspects of truck operations. We are also subject to Occupational Safety and Health Administration (“OSHA”) regulations with respect to our trucking operations.
Cross-Border Regulation
We are subject to regulatory matters specific to border crossing, which include export licenses, tariffs, customs and tax issues and toxic substance certifications. Regulations include the Short Supply Controls of the
18
Table of Contents
Export Administration Act, the North American Free Trade Agreement, National Energy Board Reporting and Certification and the Toxic Substances Control Act. Violations of license, tariff and tax reporting requirements under these regulations could result in the imposition of significant administrative, civil and criminal penalties. Furthermore, the failure to materially comply with applicable tax requirements could lead to the imposition of additional taxes, interest and penalties.
Regulation of Canadian Gathering, Processing, Transportation and Marketing Businesses
National Energy Board (“NEB”)
Our Canadian assets are not currently regulated by the NEB. The importation and exportation of natural gas and crude oil to and from Canada, however, are regulated by the NEB. The Government of Alberta tracks volumes exported from Alberta and, although it has not previously done so, reserves the right to limit the volume of natural gas that may be removed from Alberta in the event of domestic supply constraint.
Energy Resources Conservation Board (“ERCB”)
The ERCB’s purpose is to ensure that the discovery, development and delivery of Alberta’s resources take place in an orderly and efficient manner and in the public interest.
Among other matters, the ERCB has the authority to regulate the exploration, production, gathering, processing, transmission and distribution of natural gas within the province. With respect to natural gas gathering and processing activities, the ERCB’s primary role is to serve as a licensing authority for the construction and operation of the facilities used in those activities.
While the ERCB has jurisdiction to regulate the rates and fees charged for services provided by these types of facilities using a public complaint process, this authority is discretionary and historically has not commonly been exercised. Generally, the complaint-based method of regulation has meant that parties have had the opportunity to use alternative means to resolve disputes without resorting to the ERCB.
Sulphur Recovery Standards
In 2001, the ERCB set more stringent sulphur recovery standards for older sour gas processing plants, as set out in ID 2001-3. This interim directive directed older, “grandfathered” plants to either gradually increase their sulphur recovery to current standards or accept a reduction in their licensed capacity.
The K3 Plant and the KA Plant are capable of meeting “de-grandfathered” recovery requirements. The K3 Plant was “de-grandfathered” in 2006 after installation of a new Super Claus Sulphur recovery process. The KA Plant can be “de-grandfathered” via simple administrative application.
Other Provincial Regulatory Agencies
The Alberta Boilers Safety Association (“ABSA”) is the regulatory agency in Alberta of pressure systems with a mandate to ensure that pressure equipment is constructed and operated in a manner that protects public safety. SemCAMS maintains an approved program to meet all requirements.
Regulation of U.K. Operations
In the U.K., the Department of Energy and Climate Change’s Energy Resources Development Unit is responsible for the regulation of a number of relevant areas, including licensing, fiscal policy, national oil stocks policy (including their compulsory oil stocking obligations as a member of the European Union and International Energy Agency), policy on oil disposal, offshore environmental policy, oil sharing arrangements and
19
Table of Contents
decommissioning. Other regulatory bodies include the Health and Safety Executive, which regulates health and safety in the upstream and downstream oil industry (among others) and the Hazardous Installations Directorate, which is responsible for inspection and enforcement of health and safety regulation with respect to the downstream oil industry (among others). There is no regulator dedicated specifically to the oil industry. The activities of SemLogistics may also be regulated as a result of the European Union’s participation in the International Carriage of Dangerous Goods by Road and Rail agreements, as well as the International Maritime Dangerous Goods Code, which governs the safe transport of dangerous goods (including oil) by sea and, in due course, by the Marine Management Organization when it comes into being pursuant to the Marine and Coastal Access Bill.
The Department for Environment Food and Rural Affairs is responsible for setting legislation, policy, regulations and guidance for a number of environmental issues. There are also several European and international laws and policies that apply. SemLogistics’ activities are regulated by the Environment Agency Wales (“EAW”). EAW also oversees spills and their cleanup, as well as new construction of tanks, bunds (spill prevention berms in the U.S.) and other improvements, and whose regulations require us to maintain a Pollution Prevention and Control permit.
At a local level, SemLogistics’ storage facility falls within the jurisdiction of the Milford Haven Port Authority (the “MHPA”). Under the Milford Haven Port Authority Act 2002, the MHPA has the power to publish directions for the purpose of promoting or securing conditions conducive to the ease, convenience or safety of navigation in Milford Haven and the approaches to it. MHPA is currently consulting on the Milford Haven Port Authority General Directions (2006). MHPA also has powers and obligations under various regulations, including, among others, the Dangerous Substances in Harbour Areas Regulations 1987 and the Harbour Docks and Piers Clauses Act 1847, as well as responsibility for the enforcement of the Port Marine Safety Code.
Regulation of Mexican Operations
SemMexico is primarily engaged in the purchasing, production, modification, storage and distribution of liquid asphalt cement products throughout Mexico. These activities are subject to compliance with environmental laws and regulations under Mexican technical “Official Standards” and other provisions that establish minimum technical requirements. Companies are required to obtain, from the corresponding federal, local and/or municipal authorities, the relevant permits and authorizations to construct and operate asphalt modification plants and carry out the activities described above.
Mexico’s Ministry of Communications and Transportation has published several construction standards establishing the specifications required for asphalt surfaces in connection with infrastructure projects, as well as certain manuals identifying the procedures for verifying compliance therewith.
Asphalt treatment, storage and distribution activities are considered hazardous under applicable environmental laws and regulations and are subject to the scrutiny of the Ministry of the Environment and Natural Resources, which is the governmental agency in charge of granting the authorization for the handling, transportation, treatment, storage, importation, exportation and final disposal of asphalt, among others. These authorizations are essential for SemMexico to be able to perform its activities in Mexico.
Coupled with the authorizations and permits that may be granted by the Ministry of the Environment and Natural Resources, asphalt transportation activities within Mexico are subject to having obtained a number of other federal and local permits, including federal licenses for the operators of transportation units mobilizing SemMexico’s liquid asphalt cement products.
20
Table of Contents
Environmental, Health and Safety Regulation
General
Our operations, including Canadian, U.K. and Mexican operations, are subject to varying degrees of stringent and complex laws and regulations by multiple levels of government relating to the production, transportation, storage, processing, release and disposal of petroleum and natural gas based products and other materials or otherwise relating to protection of the environment. As with the industry generally, compliance with current and anticipated environmental laws and regulations increases our overall costs of business, including our capital costs to construct, maintain and upgrade pipelines, equipment and facilities. The failure to comply with these laws and regulations may result in the assessment of administrative, civil and criminal penalties, the imposition of removal or remedial obligations and the issuance of injunctions limiting or prohibiting our activities.
The clear trend in environmental regulation, particularly with respect to petroleum product facilities, is the placement of more restrictions and limitations on activities that may affect the environment and, thus, any changes in environmental laws and regulations or re-interpretations of enforcement policies that result in costly waste handling, storage, transport, disposal or remediation requirements could have a material adverse effect on our operations and financial condition. We may be unable to pass on such increased costs to our customers. Moreover, accidental releases, leaks or spills may occur in the course of our operations and we may incur significant costs and liabilities as a result, including those related to claims for damage to property, natural resources or persons. While we believe that we are in substantial compliance with existing applicable environmental laws and regulations and that continued compliance with existing requirements would not have a material adverse effect on us, there is no assurance that the current conditions will continue in the future.
The following is a summary of the more significant current environmental, health and safety laws and regulations to which our operations are subject.
Water Discharges
Our operations can result in the discharge of pollutants, including oil. The Oil Pollution Act (“OPA”) was enacted in 1990 and amends provisions of the Federal Water Pollution Control Act of 1972, as amended, the Clean Water Act, as amended, and other statutes as they pertain to prevention of, and response to, oil spills. The OPA, the Clean Water Act and analogous state, provincial and local laws, subject owners of facilities to strict, joint and potentially unlimited liability for containment and removal costs, natural resource damages and certain other consequences of an oil spill, where such spill is into navigable waters, along shorelines or in the exclusive economic zone of the U.S. In the event of an oil spill from one of our facilities into navigable waters, substantial liabilities could be imposed. Spill prevention, control and countermeasure requirements of these laws require appropriate containment berms or dikes and other containment structures at storage facilities to prevent contamination of soils, surface waters and groundwater in the event of an oil overflow, rupture or leak.
The federal Clean Water Act and analogous state and local laws impose restrictions and strict controls regarding the discharge of pollutants into waters of the U.S. and state waters, including groundwater in many jurisdictions. Permits must be obtained to discharge pollutants into these waters. The Clean Water Act and analogous state and local laws provide significant penalties for unauthorized discharges and can impose liability for responding to and cleaning up spills. In addition, the Clean Water Act and analogous state and local laws require individual permits or coverage under general permits for discharges of storm water runoff from certain types of facilities. These permits may require us to monitor and sample the storm water runoff from certain of our facilities.
Similar measures are in place in Canada at both a federal and provincial level.
21
Table of Contents
In addition, national, local and European Union regulations and directives in the U.K., and federal, state and local laws in Mexico, impose similar, but not necessarily always as stringent and detailed, requirements as in the U.S. concerning water resources and the protection of water quality, including those that regulate the discharge of pollutants and other harmful substances into water, require permits, impose clean-up obligations for spills and releases and impose fines and penalties for non-compliance. However, these countries continue to implement stricter requirements that approach the requirements in the U.S.
Air Emissions
Our operations are subject to the federal Clean Air Act, as amended, and comparable state and local laws, as well as the federal, provincial and local Canadian, U.K., European Union and Mexican laws applicable to our Canadian, U.K. and Mexican operations, although not necessarily always as stringent as found in the U.S., at least not presently. These laws and regulations regulate emissions of air pollutants from various sources, including certain of our plants, compression stations and other facilities, and impose various monitoring and reporting requirements. Pursuant to these laws and regulations, we may be required to obtain environmental agency pre-approval for the construction or modification of certain projects or facilities expected to produce or significantly increase air emissions, obtain and comply with the terms of air permits containing various emissions and operational limitations and utilize specific emission control technologies to limit emissions. We may be required to incur certain capital expenditures in the future for air pollution control equipment and leak detection and monitoring systems in connection with obtaining or maintaining operating permits and approvals for air emissions. There are significant potential monetary fines for violating air emission standards and permit provisions.
SemCAMS conducts on-going air, soil and ground water monitoring in accordance with license requirements. SemCAMS is required to annually report all specified emissions from its major facilities to a publically accessible National Pollutant Release Inventory database.
Sour Gas
SemCAMS operates facilities which process and transport sour gas (gas containing hydrogen sulfide, generally at concentrations of 10 parts per million or more). Due to the highly toxic and corrosive nature of sour gas, sour gas handling is regulated in Canada, at both the provincial and federal level, from the wellhead to the point of disposal of the sulfur content removed from processing the sour gas. Environmental legislation can also affect the operations of facilities and limit the extent to which facility expansion is permitted. Proposed facilities are facing increased resistance from community groups which are, in turn, increasing demand for alternate sources of sweetening. In addition, legislation requires that facility sites be abandoned and reclaimed to the satisfaction of provincial authorities and local landowners. A breach of such legislation may result in the imposition of fines and the issuance of clean-up orders.
To protect the public, pipelines transporting sour gas are required to be equipped with monitoring stations and valves that automatically shut down the flow of the pipeline in response to sudden changes in pressure or detection of sour gas in the atmosphere. SemCAMS’ sour gas pipelines are monitored 24 hours per day from a centralized pipeline control center and can be shut down by the attending operators. The distance between automatic pipeline valves is determined, based on regulated sour gas dispersion modeling, to meet approved emergency protection zone size and public exposure requirements. The integrity of the sour gas pipelines is maintained through the injection of corrosion inhibition chemicals on an on-going basis. SemCAMS’ sour gas pipelines are inspected on a regular basis to ensure the integrity of the pipelines and associated facilities.
SemCAMS’ sour gas plants have continuous sour gas detection equipment, as well as other safety systems which can automatically shut down and depressure the full plant to a controlled flare system. The plants are attended 24 hours per day and can also be shut down by attending operators.
22
Table of Contents
At SemCAMS’ sour gas processing plants, sulfur recovery and air quality are constantly monitored to ensure required sulfur recovery and emission standards are met. Existing regulations require a sliding range of recovery depending on throughput. SemCAMS’ required sulfur recovery ranges vary from 98.3% to 98.8%; operational history has shown actual recovery above license requirements at 98.7% to 99.2%. Residual sulfur that cannot be removed by processing is incinerated to meet a minimum stack top temperature based on a regulator approved dispersion model.
Climate Change
In response to concerns suggesting that emissions of certain gases, commonly referred to as greenhouse gases (“GHGs”) (including carbon dioxide (“CO2”) and methane), are contributing to the warming of the Earth’s atmosphere and other climatic changes, the United States Congress has been considering legislation to reduce such emissions. In addition, more than one-third of the states, either individually or through multi-state regional initiatives, have already begun implementing legal measures to reduce emissions of GHGs, primarily through the planned development of GHG emission inventories and/or GHG cap and trade programs. As an alternative to cap and trade programs, Congress may consider the implementation of a carbon tax program. The cap and trade programs could require major sources of emissions, such as electric power plants, or major producers of fuels, such as refineries or NGL fractionation plants, to acquire and surrender emission allowances. Depending on the particular program and scope thereof, we could be required to purchase and surrender allowances for GHG emissions resulting from our operations. Depending on the design and implementation of carbon tax programs, our operations could face additional taxes and higher cost of doing business. Although we would not be impacted to a greater degree than other similarly situated midstream energy service providers, a stringent GHG control program could have an adverse effect on our cost of doing business and could reduce demand for the natural gas and NGLs we gather and process.
On December 15, 2009, the U.S. Environmental Protection Agency (the “EPA”), issued a notice of its final finding and determination that emissions of CO2, methane, and other GHGs present an endangerment to public health and the environment because emissions of such gases contribute to warming of the earth’s atmosphere and other climatic changes. This final finding and determination allows the EPA to begin regulating GHG emissions under existing provisions of the Clean Air Act. Accordingly, the EPA has adopted regulations that require a reduction in emissions of GHGs from motor vehicles and also trigger permit review for GHG emissions from certain stationary sources. In addition, the EPA issued a final rule, effective in December 2009, requiring the reporting of GHG emissions from specified large GHG emission sources in the U.S., beginning in 2011 for emissions occurring in 2010 (EPA’s Greenhouse Gas Reporting Program (“GHGRP”)). Further, on November 8, 2010, EPA finalized new GHG reporting requirements for upstream petroleum and natural gas systems, which will be added to EPA’s GHG Reporting Rule. Facilities containing petroleum and natural gas systems that emit 25,000 metric tons or more of CO2 equivalent per year will be required to report annual GHG emissions to EPA, with the first report due on March 31, 2012. In December 2010, the EPA issued three concurrent actions related to its GHGRP which require the collection of certain additional business related data, and therefore, it is deferring the reporting of certain information.
In March 2011, the U.S. House of Representatives Energy and Power Subcommittee passed the Energy Tax Prevention Act of 2011 (H.R. 910), which would prevent the EPA from regulating greenhouse gases for the purpose of addressing climate change. Although it is not possible at this time to predict how legislation or new regulations that may be adopted to address GHG emissions would impact our business, any such new federal, state or regional restrictions on emissions of CO2 that may be imposed in areas in which we conduct business could also have an adverse effect on our cost of doing business and demand for the petroleum products we gather, process, transport, store, distribute and market.
SemCAMS has been required to file provincial GHG emissions reports annually since 2003 for its three large gas plants. GHG baselines were set based on 2003 through 2005 data. Alberta facilities that emit more than 100,000 tonnes of GHG per year have to reduce emissions intensity by 12 percent. Companies can meet this
23
Table of Contents
obligation through improvements to their operations, by purchasing Alberta-based credits, by contributing to the Climate Change and Emissions Management Fund or any combination thereof. Beginning with the last half of the 2007 reporting year, penalties (CDN $15 per tonne) are paid to the provincial government when the GHG intensity (GHG emissions per unit of production) are greater than 88% of the intensity established in the baseline data. All GHG costs paid by SemCAMS are recovered by allocation to the producers based on fuel gas use and CO2 composition in the inlet gas. Failure to comply with the regulation will result in a fine of $200 for every tonne of CO2 by which the total release of specified gases exceeds the net emissions intensity limit for the facility. Legislation to further lower the current reporting limit is pending which, if enacted, would require additional SemCAMS facilities to file provincial GHG emissions reports annually.
Hazardous Substances and Wastes
The environmental laws and regulations affecting our operations relate to the release of hazardous substances or solid wastes into soils, groundwater and surface water, and include measures to prevent and control pollution. These laws and regulations generally regulate the generation, storage, treatment, transportation and disposal of solid and hazardous wastes, and may require investigatory and corrective actions at facilities where such waste may have been released or disposed. For instance, the Comprehensive Environmental Response, Compensation and Liability Act (“CERCLA”), also known as the “Superfund” law, and comparable state laws, impose liability, without regard to fault or the legality of the original conduct, on certain classes of persons that contributed to a release of “hazardous substance” into the environment. Potentially responsible persons can include the current owner or operator of the site where a release previously occurred and companies that disposed, or arranged for the disposal, of the hazardous substances found at the site. Under CERCLA, these persons may be subject to joint and several liability for the costs of cleaning up the hazardous substances that have been released into the environment, for damages to natural resources and for the costs of certain health studies. CERCLA also authorizes the EPA and, in some cases, third parties to take actions in response to threats to the public health or the environment and to seek to recover from the potentially responsible classes of persons the costs they incur. It is not uncommon for neighboring landowners and other third parties to file claims for personal injury and property damage allegedly caused by hazardous substances or other wastes released into the environment. Although “petroleum,” as well as natural gas and NGLs, have been for the most part excluded from CERCLA’s definition of a “hazardous substance,” in the course of ordinary operations, we may generate wastes that may fall within the definition of a “hazardous substance.” In addition, there are other laws and regulations that can create liability for releases of petroleum, natural gas or NGLs. Moreover, we may be responsible under CERCLA or other laws for all or part of the costs required to clean up sites at which such wastes have been disposed. We have received notification that we are one of four companies that may be potentially responsible for any cleanup costs required under the State of Washington’s CERCLA equivalent statute with respect to a site in Spokane, Washington as result of the our having leased the site after the contamination occurred. No clean-up has yet been ordered. Our position is that, as a result of our emergence from the Bankruptcy, any potential claims against us for regulatory agency oversight costs were converted to administrative priority claims and any potential claims against us for investigation and clean-up costs were converted to unsecured claims (as they relate to other potentially responsible persons) and to administrative priority claims (as they relate to any regulatory agency).
We also generate, and may in the future generate, both hazardous and nonhazardous solid wastes that are subject to requirements of the federal Resource Conservation and Recovery Act (“RCRA”) and/or comparable state laws. We are not currently required to comply with a substantial portion of the RCRA requirements because our operations generate minimal quantities of hazardous wastes as currently defined under RCRA. From time to time, the EPA and state regulatory agencies have considered the adoption of stricter disposal standards for nonhazardous wastes, including crude oil and natural gas wastes. Moreover, it is possible that some wastes generated by us that are currently classified as nonhazardous may in the future be designated as “hazardous wastes,” resulting in the wastes being subject to more rigorous and costly management and disposal requirements. Changes in applicable laws or regulations may result in an increase in our capital expenditures, facility operating expenses or otherwise impose limits or restrictions on our operations.
24
Table of Contents
National, provincial and local laws of Canada, Mexico, the U.K. and the European Union that are applicable to our operations also regulate the release of hazardous substances or solid wastes into soils, groundwater and surface water, and include measures to prevent and control pollution as well as the handling of hazardous waste. Some of the requirements are similar to those found under CERCLA and RCRA and some are not yet as stringent, but are becoming more so as the focus on these issues increases.
We currently own or lease, and have in the past owned or leased, and in the future we may own or lease, properties that have been used over the years for petroleum product operations. Solid waste disposal practices within the oil and natural gas and related industries have improved over the years with the passage and implementation of various environmental laws and regulations. Nevertheless, some petroleum products and other solid wastes have been disposed of on, or under, various properties owned or leased by us during the operating history of those facilities. In addition, a number of these properties may have been operated by third parties over whom we had no control as to such entities’ handling of petroleum products or other wastes and the manner in which such substances may have been disposed of or released. These properties and wastes disposed thereon may be subject to CERCLA, RCRA and analogous state laws. Under these laws, we could be required to remove or remediate previously disposed wastes or property contamination, including groundwater contamination, or to take action to prevent future contamination. In some instances, any such requirements may have been dealt with in the Bankruptcy proceeding.
Employee Safety
We are subject to the requirements of OSHA, as well as to comparable national, state, provincial and local, Canadian, Mexican, U.K. and European Union laws that are applicable to our Canadian, Mexican and U.K. operations, the purposes of which are to protect the health and safety of workers. In addition, the OSHA hazard communication standard and comparable state, Canadian federal and provincial statutes require us to organize and disclose information concerning hazardous materials used, produced or transported in our operations. Some of our facilities are subject to the OSHA Process Safety Management regulations that are designated to prevent or minimize the consequences of catastrophic releases of toxic, reactive, flammable or explosive chemicals.
SemCAMS facilities are also subject to regulation by ABSA. SemCAMS maintains its own compliance program, audited by ABSA, which addresses integrity, inspection and process safety management elements as required by legislation.
Hazardous Materials Transportation Requirements
The DOT regulations affecting pipeline safety require pipeline operators to implement measures designed to reduce the environmental impact of oil discharge from onshore oil pipelines. These regulations require operators to maintain comprehensive spill response plans, including extensive spill response training for pipeline personnel. In addition, the DOT regulations contain detailed specifications for pipeline operation and maintenance.
Similar requirements are in effect in Canada.
Anti-Terrorism Measures
The federal Department of Homeland Security Appropriations Act of 2007 requires the Department of Homeland Security (“DHS”), to issue regulations establishing risk-based performance standards for the security of chemical and industrial facilities, including oil and gas facilities that are deemed to present “high levels of security risk.” The DHS issued an interim final rule in April 2007 regarding risk-based performance standards to be attained pursuant to this act and, on November 20, 2007, further issued an Appendix A to the interim rules that establish chemicals of interest and their respective threshold quantities that will trigger compliance with the interim rules. To the extent our facilities are subject to existing or new rules, it is possible that the costs to comply with such rules could be substantial.
25
Table of Contents
Title to Properties
Substantially all of our pipelines are constructed on rights-of-way granted by the record owners of the property. Lands over which pipeline rights-of-way have been obtained may be subject to prior liens that have not been subordinated to the right-of-way grants. We have obtained, where necessary, easement agreements from public authorities and railroad companies to cross over or under, or to lay facilities in or along, watercourses, county roads, municipal streets, railroad properties and state highways, as applicable. In some cases, property on which our pipeline was built was purchased in fee. Our processing plants and terminals are on real property owned or leased by us.
We believe that we have satisfactory title to all of the assets we own. Although title to such properties is subject to encumbrances in certain cases, such as customary interests generally retained in connection with acquisition of real property, liens related to environmental liabilities associated with historical operations, liens for current taxes and other burdens and minor easements, restrictions and other encumbrances to which the underlying properties were subject at the time of acquisition by us, we believe that none of these burdens will materially detract from the value of such properties or from our interest therein or will materially interfere with their use in the operation of our business.
Office Facilities
In addition to our gathering, storage, terminalling and processing facilities discussed above, we maintain corporate office headquarters located in Tulsa, Oklahoma. All of the U.S. business segments utilize Tulsa as their center of operations, except for Crude, whose primary operations are located in Oklahoma City. Foreign business segments utilize their centers of operations, which are Calgary, Alberta for SemCAMS; Puebla, Mexico for SemMexico; and Milford Haven, Wales for SemLogistics. Many of our business segments also have satellite offices located throughout North America. The current lease for our Tulsa headquarters expires in May 2019, and the other office leases have varying expiration dates. While we may require additional office space as our business expands, we believe that our existing facilities are adequate to meet our needs for the immediate future, and that additional facilities will be available on commercially reasonable terms as needed.
Employees
As of December 31, 2011, we had approximately 710 employees, including approximately 480 employees outside the U.S. in Canada, Mexico and the U.K. Approximately 106 of our employees in Canada and Mexico are represented by labor unions and subject to collective bargaining agreements governing their employment with us. Of that number, approximately 55 employees have collective bargaining agreements that will expire in 2012 and approximately 51 with collective bargaining agreements expiring in 2013. We have never had a labor related work stoppage and believe our employee relations are good.
26
Table of Contents
| Item 1A. | Risk Factors |
Our business faces many risks. We believe the risks described below identify the material risks we face. However, the risks described below may not be the only risks we face. Additional unknown risks or risks that we currently consider immaterial may also impair our business operations. If any of the events or circumstances described below actually occurs, our business, financial condition or results of operations could suffer, and the trading price of our shares of Class A Common Stock and warrants could decline significantly. Investors should consider the specific risk factors discussed below, together with other information contained in this report on Form 10-K and the other documents that we will file from time to time with the Securities and Exchange Commission (the “SEC”).
Risks Related to Our Business
Our credit facilities require us to maintain certain financial ratios and place other operating and financial restrictions on us.
Our credit facilities have covenants which require us to satisfy and maintain certain financial ratios and place certain other restrictions on us. These covenants and restrictions limit our ability to respond to changing business and economic conditions and may prevent us from engaging in transactions that might otherwise be considered beneficial to us. For example, our credit facilities limit our ability to:
| • | incur additional indebtedness; |
| • | incur liens; |
| • | pay dividends over a certain amount; |
| • | make certain restricted payments; |
| • | consummate certain asset sales; |
| • | enter into certain transactions with affiliates; and |
| • | merge, consolidate and/or sell or dispose of all, or substantially all, of our assets. |
Any failure to comply with the restrictions of our credit facilities, or any other such subsequent financing agreements, may result in an event of default. An event of default may allow the creditors to accelerate the repayment of the related debt, as well as any other debt to which a cross-acceleration or cross-default provision applies. If we are unable to repay amounts outstanding under our credit facilities when due, the lenders thereunder could, subject to the terms of the relevant agreements, seek to sell or otherwise transfer our assets granted to them as collateral to secure the indebtedness outstanding under those facilities. Substantially all of our assets have been pledged as collateral to secure our credit facilities. In addition, the lenders under our revolving credit facilities may choose to terminate any commitments they then have made to supply us with further funds.
Under certain economic conditions, our access to credit markets may be limited, which may adversely impact our liquidity.
We may require additional capital from outside sources from time to time. Our ability to arrange financing or renew existing facilities, along with the cost of such capital, is dependent upon a number of variables, including:
| • | general economic, financial and business conditions; |
| • | industry specific conditions; |
| • | credit availability from banks and other financial institutions; |
| • | investor confidence in us; |
27
Table of Contents
| • | cash flow and EBITDA (earnings before interest, taxes, depreciation and amortization) levels; |
| • | competitive, legislative and regulatory matters; and |
| • | provisions of tax and securities laws that may impact raising capital. |
In addition, volatility in the capital markets may adversely affect our ability to access any available borrowing capacity under our revolving credit facilities. Our access to these funds is dependent on the ability of the lenders to meet their funding obligations under these revolving facilities. Lenders may not be able to meet their funding commitments if they experience shortages of capital and liquidity, resulting in a reduction of our available borrowing capacity.
Our cash flow depends in part on the available cash and distributions of Rose Rock.
Our partnership interests in Rose Rock are significant cash-generating assets. Therefore, our cash flow is dependent to some extent upon the ability of Rose Rock to make a minimum quarterly distribution to its unitholders, including us. Rose Rock may not have sufficient available cash from operating surplus each quarter to enable it to pay the minimum quarterly distribution, which would have a corresponding negative impact on us. The amount of cash Rose Rock can distribute on its units principally depends upon the amount of cash it generates from its operations, which will fluctuate from quarter to quarter based on, among other things:
| • | the price of crude oil and the level of production of, and demand for, crude oil in the markets it serves; |
| • | the volume of crude oil that it gathers, transports, stores and markets; |
| • | the fees with respect to volumes that it handles; |
| • | the profitability of its marketing operations; |
| • | damage to pipelines, facilities, related equipment and surrounding properties caused by earthquakes, floods, fires, severe weather, explosions and other natural disasters and acts of terrorism or inadvertent damage to pipelines from construction, farm and utility equipment; |
| • | leaks or accidental releases of crude oil or other materials into the environment, whether as a result of human error or otherwise; |
| • | demand charges and volumetric fees associated with its transportation services; |
| • | the level of competition from other midstream energy companies; |
| • | the level of its operating, maintenance and general and administrative costs; |
| • | regulatory action affecting the supply of or demand for crude oil, the rates it can charge, how it contracts for services, its existing contracts, its operating costs or its operating flexibility; |
| • | changes in tax laws; and |
| • | prevailing economic conditions. |
In addition, the actual amount of cash Rose Rock will have available for distribution will depend on other factors, some of which are beyond its control, including:
| • | the level of capital expenditures it makes; |
| • | the cost of acquisitions; |
| • | its debt service requirements and other liabilities; |
| • | fluctuations in its working capital needs; |
| • | its ability to borrow funds and access capital markets; |
| • | restrictions contained in debt agreements to which it is a party; and |
28
Table of Contents
| • | the amount of cash reserves established by its general partner. |
For further information on the risk factors inherent in the business of Rose Rock, see the other risk factors included in this Form 10-K that are applicable to Rose Rock and “Item 1A. Risk Factors” in Rose Rock’s Annual Report on Form 10-K.
Our operations could be adversely affected if third-party pipelines or other facilities interconnected to our facilities become partially or fully unavailable, or if the volumes we gather do not meet the quality requirements of such pipelines or facilities.
Our facilities connect to other pipelines or facilities, some of which are owned by third parties. The continuing operation of such third-party pipelines or facilities is not within our control. These pipelines and other facilities may become unavailable because of testing, turnarounds, line repair, reduced operating pressure, lack of operating capacity, curtailments of receipt or deliveries due to insufficient capacity, or for any other reason. If any of these pipelines or facilities becomes unable to transport the products we gather, or if the volumes we gather or transport do not meet the quality requirements of such pipelines or facilities, our results of operations and cash flows could be adversely affected.
As a public company, we are subject to financial and other reporting and corporate governance requirements that may be difficult for us to satisfy, will raise our costs, and may divert resources and management attention from operating our business.
Following the effectiveness of our registration statement on Form 10 in November 2010, we are required to file with the SEC annual and quarterly information and other reports that are specified in the Exchange Act and SEC regulations. Thus, we need to ensure that we maintain the ability to prepare, on a timely basis, reports that comply with SEC requirements. We are also subject to other reporting and corporate governance requirements, including the listing standards of the NYSE, the provisions of the Sarbanes-Oxley Act of 2002 (the “Sarbanes-Oxley Act”), the Dodd-Frank Wall Street Reform and Consumer Protection Act of 2010 and the regulations promulgated thereunder.
The adequacy of our internal control over financial reporting must be assessed by management and audited by an independent registered public accounting firm each year. If we are unable to maintain adequate internal control over financial reporting or otherwise to comply with Section 404, we may be unable to report financial information on a timely basis, may suffer adverse regulatory consequences, may have violations of the NYSE listing rules and may breach covenants under our credit facilities. There could also be a negative reaction in the financial markets due to a loss of investor confidence in us and the reliability of our financial statements.
The changes necessitated by becoming a public company require a significant commitment of resources and management oversight that increase our costs and may strain our systems and resources. As a result, our management’s attention might be diverted from other business concerns. In addition, we might not be totally successful in maintaining controls and procedures that comply with these requirements. If we fail to maintain an effective internal control environment or to comply fully with the numerous legal and regulatory requirements imposed on public companies, we could make material errors in, and be required to restate, our financial statements. Any such restatement could result in a loss of public confidence in the reliability of our financial statements and sanctions imposed on us by the SEC.
Our Comprehensive Risk Management Policy’s provisions governing our internal trading and marketing activities cannot eliminate all risks associated with the trading and marketing of commodities, nor can we ensure full compliance at all times with the Comprehensive Risk Management Policy by our employees, both of which could impact our financial and operational results.
We have in place a Comprehensive Risk Management Policy that establishes authorized commodities and transaction types, delegations of authority, and limits for trading and marketing exposures and requires that we
29
Table of Contents
restrict net open positions (e.g., positions that are not fully hedged as to commodity price risk) to specified levels at each of the consolidated and, in certain cases, subsidiary level. Our risk management policy has restrictive terms with respect to acquiring and holding physical inventory, futures contracts or derivative products for the purpose of proprietary trading activity. These policies and practices, however, cannot eliminate all risks. If we enter into derivatives contracts or sale contracts for the delivery of products at a future date, we are subject to the risk of non-delivery under product purchase contracts or the failure of gathering and transportation systems. For example, any event that disrupts our anticipated physical supply of products could create a net open position that would expose us to risk of loss resulting from price changes.
Moreover, we are exposed to price movements on products that are not hedged, including certain of our inventory, such as linefill, which must be maintained to operate pipeline and gathering lines. We are also exposed to certain price risks that cannot be readily hedged, such as price risks for “basis differentials.” “Basis differentials” can be created to the extent that our purchase or sales contracts call for delivery of a petroleum product of a grade, at a location, or at a time that differs from the specific delivery terms of offsetting purchase and sales agreements or derivative instruments. If this occurs, we may not be able to use the physical or derivative commodity markets to fully hedge our price risk. Even though we expect to maintain only limited net open positions, as permitted under the Comprehensive Risk Management Policy, we will be exposed to price risks within predefined limits and authorizations which could impact our operational and financial results.
We also have a risk that employees involved in our trading and marketing operations may not comply at all times with the risk management policy. Even with management oversight, we cannot ensure with certainty that all violations of the risk management policy, particularly if deception or other intentional misconduct is involved, will be detected prior to our businesses being materially affected.
Conventional gas operations face increased competitive pressure from shale gas production.
The U.S. Energy Information Administration reports that higher estimates of domestic shale gas resources support increasing estimates of domestic natural gas production at prices below its previous estimates.
The abundant supply of shale gas places pressure on all conventional gas production including sour gas production. In addition, facilities designed to remove hydrogen sulfide from a raw gas stream face increased pressure because sour gas is more expensive to process than gas which does not contain sulfur.
Our construction of new assets is subject to regulatory, environmental, political, legal and economic risks which could adversely affect our business.
One of the ways we intend to grow our business is through the construction of new assets. The construction of additions or modifications to our existing systems and of new assets involves numerous regulatory, environmental, political and legal uncertainties beyond our control. In addition, the construction of additions to our existing gathering and transportation assets may require us to obtain new rights-of-way prior to constructing new pipelines. We may be unable to obtain such rights-of-way to connect new petroleum product supplies to our existing gathering lines or capitalize on other attractive expansion opportunities. Additionally, it may become more expensive for us to obtain new rights-of-way or to renew existing rights-of-way. If the cost of renewing or obtaining new rights-of-way increases, or if we lose our existing rights-of-way through our inability to renew right-of-way contracts or otherwise, our results of operations, cash flows and financial condition could be adversely affected.
Actual results may vary significantly from the projections filed with the U.S. Bankruptcy Court.
In connection with our plan of reorganization, we were required to prepare projected financial information to demonstrate to the U.S. Bankruptcy Court the feasibility of our plan of reorganization and our ability to continue operations upon our emergence from the Bankruptcy. Those projections are included in the Disclosure
30
Table of Contents
Statement filed with the U.S. Bankruptcy Court on September 25, 2009. Those projections are not included in this report on Form 10-K, are not incorporated by reference into this report on Form 10-K, and they should not be relied upon. Those projections were based on numerous assumptions about our anticipated future performance and were based on anticipated market and economic conditions that were, and remain, beyond our control or inconsistent with current strategy. Projections are inherently subject to many uncertainties and a wide variety of significant business, economic and competitive risks. Our actual results of operations and financial condition will vary from those contemplated by the projections and the variations may be material.
Because our consolidated financial statements reflect fresh-start reporting adjustments made upon emergence from our Bankruptcy reorganization, and because of the effects of the transactions that became effective pursuant to our plan of reorganization, financial information in our current and future financial statements will not be comparable to our financial information from prior periods.
In connection with our Bankruptcy reorganization, we adopted fresh-start reporting effective as of the close of business on November 30, 2009, in accordance with the Financial Accounting Standards board Accounting Standards Codification (“ASC”) 852, “Reorganizations.” Our adoption of fresh-start reporting resulted in our becoming a new entity for financial reporting purposes. As required by fresh-start reporting, our assets and liabilities have been adjusted to reflect fair value at November 30, 2009. In addition to fresh-start reporting, our financial statements reflect the effects of all of the transactions implemented by our plan of reorganization. Accordingly, our financial statements for periods ending on or prior to November 30, 2009, are not comparable with our financial statements for periods ending subsequent to November 30, 2009. Furthermore, the estimates and assumptions used to implement fresh-start reporting are inherently subject to significant uncertainties and contingencies beyond our control. Accordingly, we cannot provide assurance that the estimates, assumptions, and values reflected in our valuations will be realized, and our actual results could vary materially.
An impairment of goodwill could reduce our earnings.
We recorded $188.8 million of goodwill at November 30, 2009, in connection with fresh-start reporting. Goodwill was recorded to the extent that the Company’s reorganization value exceeded amounts attributed to specific tangible or identified intangible assets. Accounting principles generally accepted in the U.S. (“GAAP”) require us to test goodwill for impairment on an annual basis, or when events or circumstances occur indicating that goodwill might be impaired. If we were to determine that any of our goodwill was impaired, we would be required to take an immediate charge to earnings.
During 2010 we revised downward our projections of the future earnings potential of the SemCanada Crude segment, following a significant loss of customers, coupled with a significant decline in profitability and an assessment by a national consultancy that certain market conditions that are adversely impacting this segment were likely to continue. In response to these events, we tested SemCanada Crude’s goodwill and other intangible assets for impairment as of March 31, 2010. Based on the results of these tests, we recorded an impairment loss of $91.8 million, representing the full amount of the goodwill and other intangible assets attributable to SemCanada Crude. Also during 2010, we sold the property, plant and equipment of the SemCanada Crude segment and began winding down its operations.
Also during 2010, we conducted our annual goodwill impairment test. We concluded that the goodwill attributable to our SemMexico segment was impaired, due primarily to lower than expected demand for asphalt resulting from a slowdown of road construction in Mexico. We recorded a loss of $8.9 million related to this impairment.
During 2011, we conducted our annual goodwill impairment test, and concluded that the goodwill and other intangible assets related to our SemStream Arizona business were impaired. We recorded a loss of $9 million related to this impairment. In addition, we concluded that the goodwill related to our SemLogistics business was impaired and, accordingly, recorded an impairment loss of $45 million.
31
Table of Contents
Changes in currency exchange rates could adversely affect our operating results.
A portion of our revenue is generated from our operations in Canada, the U.K. and Mexico, which use the Canadian dollar, British pound and Mexican peso, respectively, as the functional currency. Therefore, changes in the exchange rate between the U.S. dollar and any of such foreign currencies could adversely affect our financial and operational results.
We are exposed to the creditworthiness and performance of our customers, suppliers and transactional counterparties, and any material nonpayment or nonperformance by one or more of these parties could adversely affect our financial and operational results.
There can be no assurance we have adequately assessed the creditworthiness of each of our existing or future customers, suppliers or transactional counterparties or that there will not be a rapid or unanticipated deterioration in their creditworthiness, which may have an adverse impact on our financial condition and results of operations. There is no certainty that our counterparties will perform or adhere to existing or future contractual arrangements.
We manage our exposure to credit risk through credit analysis and credit monitoring procedures and policies, including credit support requirements for customers and counterparties to which we extend no or limited unsecured credit, such as letters of credit, prepayments, and guarantees. However, these procedures and policies cannot fully eliminate counterparty credit risks, and to the extent our procedures and policies prove to be inadequate, our financial and operational results may be negatively impacted.
Some of our counterparties may be highly leveraged or have limited financial resources and will be subject to their own operating and regulatory risks and, even if our credit review and analysis mechanisms work properly, we may experience financial losses in our dealings with such parties. In addition, volatility in commodity prices might have an impact on many of our counterparties, which, in turn, could have a negative impact on their ability to meet their obligations to us and may also increase the magnitude of these obligations.
Any material nonpayment or nonperformance by our counterparties could require us to pursue substitute counterparties for the affected operations, reduce operations or provide alternative services. There can be no assurance that any such efforts would be successful or would provide similar financial and operational results.
Our business involves many hazards and operational risks, some of which may not be covered by insurance.
Sudden leaks are possible in operations involving pipelines and tanks. Other possible operating risks include the breakdown or failure of equipment, information systems or processes; the performance of equipment at levels below those originally intended (whether due to misuse, unexpected degradation or design, construction or manufacturing defects); failure to maintain adequate inventories of spare parts; operator error; labor disputes; disputes with interconnected facilities and carriers; and catastrophic events such as natural disasters, fires, explosions, fractures, acts of terrorism and other similar events, many of which are beyond our control.
These risks could result in substantial losses due to personal injury or loss of life, severe damage to, and destruction of, property and equipment and pollution or other environmental damage, and may result in curtailment or suspension of our related operations. We are not fully insured against all risks incident to our business. In addition, as a result of market conditions, premiums for our insurance could increase significantly. In some instances, insurance could become unavailable or available only for reduced amounts of coverage. If a significant accident or event occurs that is not fully insured, it could adversely affect our results of operations, cash flows and financial condition. Even if a significant accident or event is covered by insurance, we may still have responsibility for applicable deductibles, and in addition, the proceeds of any such insurance may not be paid in a timely manner.
32
Table of Contents
Any acquisition involves risks that may adversely affect our business.
Any acquisition involves potential risks, including:
| • | performance from the acquired businesses or assets that is below the forecasts we used in evaluating the acquisition; |
| • | a significant increase in our indebtedness and working capital requirements; |
| • | the inability to timely and effectively integrate the operations of recently acquired businesses or assets; |
| • | the incurrence of substantial unforeseen environmental and other liabilities arising out of the acquired businesses or assets, including liabilities arising from the operation of the acquired businesses or assets prior to our acquisition; |
| • | risks associated with operating in lines of business that are distinct and separate from our historical operations; |
| • | loss of customers or key employees from the acquired businesses; and |
| • | the diversion of management’s attention from other business concerns. |
Any of these factors could adversely affect our ability to achieve anticipated levels of cash flows from our acquisitions, realize other anticipated benefits and meet our debt service requirements.
We are subject to the risks of doing business outside of the U.S.
The success of our business depends, in part, on continued performance in our non-U.S. operations. We currently have operations in Canada, Mexico and the U.K. In addition to the other risks described in this report on Form 10-K, there are numerous risks and uncertainties that specifically affect our non-U.S. operations. These risks and uncertainties include political and economic instability, changes in local governmental laws, regulations and policies, including those related to tariffs, investments, taxation, exchange controls, employment regulations and repatriation of earnings, and enforcement of contract and intellectual property rights. International transactions may also involve increased financial and legal risks due to differing legal systems and customs, including risks of non-compliance with U.S. and local laws affecting our activities abroad, including compliance with the U.S. Foreign Corrupt Practices Act and the U.K. Bribery Act of 2010. While these factors and the impact of these factors are difficult to predict, any one or more of them could adversely affect our financial and operational results.
We may incur significant costs and liabilities resulting from pipeline integrity programs and related repairs.
Pursuant to the Pipeline Safety Improvement Act of 2002, as reauthorized and amended by the Pipeline Inspection, Protection, Enforcement and Safety Act of 2006, the DOT, through the DOT’s Pipeline and Hazardous Materials Safety Administration, has adopted regulations requiring pipeline operators to develop integrity management programs for transmission pipelines located where a leak or rupture could do the most harm in “high consequence areas,” including high population areas, areas that are sources of drinking water, ecological resource areas that are unusually sensitive to environmental damage from a pipeline release and commercially navigable waterways, unless the operator effectively demonstrates by risk assessment that the pipeline could not affect the area. The Pipeline Inspection, Protection, Enforcement and Safety Act of 2006 expired on September 30, 2010, and was operating under the continuing resolution that expired on March 4, 2011. The reauthorization of the Pipeline Safety Act being considered by Congress could result in new and more costly compliance requirements. Current regulations require operators of covered pipelines to:
| • | perform on-going assessments of pipeline integrity on a recurring frequency schedule; |
| • | identify and characterize applicable potential threats to pipeline segments that could impact a high consequence area; |
33
Table of Contents
| • | improve data collection, integration and analysis; |
| • | repair and remediate the pipeline as necessary; and |
| • | implement preventive and mitigating actions. |
In addition, states have adopted regulations similar to existing DOT regulations for intrastate gathering and transmission lines. We currently estimate that we will incur an aggregate cost of approximately $2.9 million for years 2011 through 2012 to implement necessary pipeline integrity management program testing along certain segments of our pipelines required by existing DOT and state regulations. This estimate does not include the costs, if any, of any repair, remediation, preventative or mitigating actions that may be determined to be necessary as a result of the testing program, which costs could be substantial. At this time, we cannot predict the ultimate cost of compliance with these regulations, as the cost will vary significantly depending on the number and extent of any repairs found to be necessary as a result of the pipeline integrity testing. Following the initial round of testing and repairs, we will continue our pipeline integrity testing programs on an on-going basis to assess and maintain the integrity of our pipelines. The results of these tests could cause us to incur significant and unanticipated capital and operating expenditures for repairs or upgrades deemed necessary to ensure the continued safe and reliable operations of our pipelines and, consequently, result in a reduction in our revenue and cash flows from shutting down our pipelines during the pendency of such repairs or upgrades.
Some of our operations cross the U.S./Canada border and are subject to cross border regulation.
Our cross border activities with our Canadian subsidiaries and certain customers subject us to regulatory matters, including import and export licenses, tariffs, Canadian and U.S. customs and tax issues and toxic substance certifications. Such regulations include the Short Supply Controls of the Export Administration Act, the North American Free Trade Agreement and the Toxic Substances Control Act. Violations of these licensing, tariff and tax reporting requirements could result in the imposition of significant administrative, civil and criminal penalties.
We may fail to realize the anticipated benefits from our recent acquisition of a significant equity position in NGL Energy Partners LP.
On November 1, 2011, SemStream completed the sale of substantially all of its assets to NGL Supply Terminal Company LLC, a subsidiary of NGL Energy, in exchange for, among other things, 8,932,031 common units (32.2% of the common units outstanding at December 31, 2011) representing limited partnership interests in NGL Energy (the “NGL Common Units”). NGL Energy owns and operates a vertically integrated propane business with three operating segments: midstream; wholesale supply and marketing; and retail propane.
We do not control NGL Energy’s assets and operations and the value of, and benefits from, our investment in the NGL Common Units are subject to all of the risks and uncertainties inherent in NGL Energy’s business including, without limitation, the following:
| • | NGL Energy may not have sufficient cash to enable it to pay minimum quarterly distributions on its common units, including the NGL Common Units; |
| • | The amount of cash NGL Energy has available for distribution to its unitholders, including us, depends primarily on its cash flow rather than on its profitability, which may prevent it from making distributions, even during periods in which it realizes net income; |
| • | Current conditions in the global capital and credit markets, and general economic pressures, may adversely affect NGL Energy’s financial position and results of operations; |
| • | Widely fluctuating propane prices could adversely affect NGL Energy’s ability to finance its working capital needs; |
34
Table of Contents
| • | If NGL Energy does not successfully identify acquisition candidates, complete accretive acquisitions on economically acceptable terms, or adequately integrate the acquired operations into its existing operations, its future financial performance may be adversely affected and its growth may be limited; |
| • | Increases in interest rates could adversely impact NGL Energy’s common unit price, its ability to issue equity or incur debt for acquisitions or other purposes, and its ability to make cash distributions at its intended levels; |
| • | NGL Energy’s operations are subject to all the operating hazards and risks incident to handling, storing, transporting, and providing customers with combustible liquids such as propane; |
| • | NGL Energy’s partnership agreement limits the fiduciary duties of NGL Energy’s general partner to NGL Energy’s unitholders, including us, and restricts the remedies available to the unitholders for actions taken by its general partner that might otherwise be breaches of fiduciary duty; |
| • | Cost reimbursements to NGL Energy’s general partner may be substantial and could reduce its cash available to make quarterly distributions on the common units, including the NGL Common Units; |
| • | NGL Energy’s partnership agreement requires that NGL Energy distribute all of its available cash, which could limit its ability to grow and make acquisitions; and |
| • | Other factors discussed in NGL Energy’s Annual Report on Form 10-K and as are included from time to time in NGL Energy’s public announcements and other filings with the SEC. |
As part of our transaction with NGL Energy, we waived ordinary course cash distributions from NGL Energy on 3,932,031 of the NGL Common Units (the “Distribution Waiver Units”) until August 30, 2012. We may not transfer or sell any of the Distribution Waiver Units prior to September 30, 2012, unless the purchaser of these units enters into a forbearance agreement with NGL Energy relating to the units purchased. When these restrictions end, to the extent that we desire to sell any of the NGL Common Units, our ability to sell units could be severely limited, both as to timing and amount, and as a result of factors beyond our control. Also, the market price of the NGL Common Units may decline substantially before we sell the units.
For the reasons described above, we may not realize an adequate return on our investment and we may incur losses on any sales of our investment.
In addition, our equity in earnings or losses of NGL Energy will be reported in our consolidated statement of operations, which could result in volatility in our earnings. Future declines in the fair value of our investment in NGL Energy could, under certain circumstances, require us to record impairment losses on our investment.
One of our subsidiaries acts as the general partner of a publicly traded limited partnership, Rose Rock. As such, this subsidiary’s operations may involve a greater risk of liability than ordinary business operations.
One of our subsidiaries acts as the general partner of Rose Rock, a publicly-traded limited partnership. This subsidiary may be deemed to have undertaken fiduciary obligations with respect to Rose Rock as the general partner and to the limited partners of Rose Rock. Activities determined to involve fiduciary obligations to other persons or entities typically involve a higher standard of conduct than ordinary business operations and therefore may involve a greater risk of liability, particularly when a conflict of interests is found to exist. Our control of the general partner of Rose Rock may increase the possibility of claims of breach of fiduciary duties, including claims brought due to conflicts of interest (including conflicts of interest that may arise between Rose Rock, on the one hand, and its general partner and that general partner’s affiliates, including us, on the other hand). Any liability resulting from such claims could be material.
A prolonged decline in index prices at Cushing relative to other index prices could reduce the demand for our transportation to, and storage in, Cushing.
Shifts in the overall supply of, and demand for, crude oil in regional, national and global markets, over which we have no control, can have an adverse impact on crude oil index prices in the markets we serve relative
35
Table of Contents
to other index prices. For example, Cushing has experienced a shortfall in takeaway pipeline capacity, which has in turn led to an oversupply of crude oil at Cushing. This has been cited as a principal reason for the decline in the West Texas Intermediate Index (“WTI Index”) price used at Cushing relative to other crude oil price indexes, including the Brent Crude index. A prolonged decline in the WTI Index price relative to other index prices may cause reduced demand for our transportation to, and storage in, Cushing, which could have a material adverse effect on our business, results of operations and financial condition.
Adverse developments in our existing areas of operation could adversely impact our results of operations, cash flows and financial condition.
Our operations are focused on gathering, transporting, storing, processing, and treating petroleum products utilizing our assets which are principally located in the Midwest and Rocky Mountain supply region of the U.S. and in Alberta, Canada. As a result, our results of operations, cash flows, and financial condition depend upon the demand for our services in these regions. Due to our current lack of broad diversification in industry type and geographic location, adverse developments in our current segment of the midstream industry, or our existing areas of operation, could have a significantly greater impact on our results of operations, cash flows, and financial condition than if our operations were more diversified.
The nature and degree of regulation may adversely affect fee structures or operations.
Our operations are subject to substantial regulation from foreign and domestic federal, state, provincial and local authorities. These authorities regulate numerous aspects of our operations, including our interstate natural gas storage operations, certain crude oil gathering systems, construction and maintenance of facilities, and certain rate structures among other things. We cannot predict the impact of any future revisions or changes in interpretation of existing laws or regulations or the adoption of new laws and regulations applicable to our businesses. Revisions, interpretation changes or additional regulations could influence our operating environment and may result in increased costs.
White Cliffs Pipeline is subject to FERC rules and regulations. The FERC’s regulatory authority extends to:
| • | transportation of crude oil in interstate commerce; |
| • | rates, operating terms and conditions of service; |
| • | accounts and records; and |
| • | depreciation and amortization policies. |
Regulatory actions in these areas can similarly affect new or expanded pipeline operations.
We may incur significant costs and liabilities in the future resulting from a failure to comply with new or existing environmental laws or regulations or an accidental release of hazardous substances, petroleum products or wastes into the environment.
Our operations are subject to federal and foreign, state, provincial and local environmental laws and regulations governing the discharge of materials into the environment or otherwise relating to environmental protection. These laws include, for example:
| • | federal and comparable state and foreign laws that impose obligations related to air emissions; |
| • | federal and comparable state and foreign laws that impose requirements for the handling, storage, treatment or disposal of solid and hazardous waste from our facilities; |
| • | federal and comparable state and foreign laws that regulate the cleanup of hazardous substances that may have been released at properties currently or previously owned or operated by us or at locations to which our hazardous substances have been transported for disposal; and |
36
Table of Contents
| • | federal and comparable state and foreign laws that regulate discharges of wastewater from our facilities require spill protection planning and preparation and set requirements for other actions for protection of waters. |
Failure to comply with these laws and regulations, or newly adopted laws or regulations, may trigger a variety of administrative, civil and criminal enforcement measures, including the assessment of monetary penalties, the imposition of remedial requirements and the issuance of orders enjoining future operations or imposing additional compliance requirements on such operations. Claims pursued under certain environmental laws impose strict, joint and several liability for costs required to clean up and restore sites where hazardous substances or petroleum products have been disposed or otherwise released. Provisions also exist that may require remediation or other compensation to pay for damages to natural resources. Moreover, it is not uncommon for individuals to file claims for personal injury and property damage allegedly caused by the release of hazardous substances, petroleum products or waste products in the environment.
There is an inherent risk of incurring environmental costs and liabilities in connection with our operations due to our handling of crude oil and natural gas, air emissions and water discharges related to our operations and historical industry operations and waste disposal practices. For example, an accidental release from one of our facilities could subject us to substantial liabilities for environmental cleanup and restoration costs, claims made by individuals for personal injury, natural resource and property damages and fines or penalties for related violations of environmental laws or regulations. Moreover, the possibility exists that stricter laws, regulations or enforcement policies could significantly increase our operational or compliance costs and the cost of any remediation that may become necessary. We may not be able to recover all or any of these costs from insurance and fines or penalties paid for compliance violations, whether alleged or proven, will not be covered by insurance.
Derivatives regulations included in current financial reform legislation could impede our ability to manage business and financial risks by restricting our use of derivative instruments as hedges against fluctuating commodity prices and interest rates.
In July 2010, the Dodd-Frank Wall Street Reform and Consumer Protection Act (the “Act”) was passed by Congress and signed into law. The Act contains significant derivatives regulations, including a requirement that certain transactions be cleared on exchanges and a requirement to post cash collateral (commonly referred to as “margin”) for such transactions. The Act provides for a potential exception from these clearing and cash collateral requirements for commercial end-users and includes a number of defined terms that will be used in determining how this exception applies to particular derivative transactions and the parties to those transactions. The Act requires the Commodity Futures Trading Commission (the “CFTC”) to promulgate rules to define these terms; however, we neither know the rules the CFTC will promulgate nor the definitions that will apply to us.
We use crude oil and other energy derivative instruments in connection with our Crude activities, and may use natural gas related derivative instruments in connection with our SemGas activities, principally to hedge the commodity price risk associated with these businesses. We may also use energy derivatives in conjunction with the activities of our other businesses and may use interest rate derivative instruments to minimize the impact of interest rate fluctuations associated with our debt. At present, we post collateral with clearing brokers with respect to substantially all our commitments and potential obligations under these derivative instruments. Depending on the regulations adopted by the CFTC, we may be required to post additional collateral for our energy and interest rate derivative transactions in excess of present levels. Such a requirement is not anticipated to have a significant impact on our business, but may increase costs and decrease profitability. Moreover, a requirement for our counterparties to post collateral could result in additional costs being passed on to us, thereby decreasing our profitability.
37
Table of Contents
Our storage operations are influenced by the overall forward market for crude oil, and certain market conditions may adversely affect our financial and operating results.
Our storage operations are influenced by the overall forward market for crude oil. A contango market (meaning that the price of crude oil for future delivery is higher than the current price) is associated with greater demand for crude oil storage capacity, because a party can simultaneously purchase crude oil at current prices for storage and sell at higher prices for future delivery. A backwardated market (meaning that the price of crude oil for future delivery is lower than the current price) is associated with lower demand for crude oil storage capacity, because a party can capture a premium for prompt delivery of crude oil rather than storing it for future sale. A prolonged backwardated market or other adverse market conditions could have an adverse impact on our ability to negotiate favorable prices under new or renewing storage contracts, which could have an adverse impact on our storage revenues. Finally, higher absolute levels of crude oil prices increase the costs of financing and insuring crude oil in storage, which negatively affects storage economics. As a result, the overall forward market for crude oil may have an adverse effect on our business, results of operations, and financial condition.
An increase in interest rates could impact demand for our storage capacity.
There is a financing cost for a storage capacity user to own crude oil while it is stored. That financing cost is impacted by the cost of capital or interest rate incurred by the storage user in addition to the commodity cost of the crude oil in inventory. Absent other factors, a higher financing cost adversely impacts the economics of storing crude oil for future sale. As a result, a significant increase in interest rates could adversely affect the demand for our storage capacity independent of other market factors.
We are subject to regulation by multiple governmental agencies, which could adversely impact our business, results of operations and financial condition.
Our business activities are subject to regulation by multiple federal, state and local governmental agencies. Our historical and projected operating costs reflect the recurring costs resulting from compliance with these regulations, and we do not anticipate material expenditures in excess of these amounts in the absence of future acquisitions, or changes in regulation, or discovery of existing but unknown compliance issues. Additional proposals and proceedings that affect the midstream industry are regularly considered by Congress, as well as by state legislatures and federal and state regulatory commissions, agencies and courts. We cannot predict when or whether any such proposals may become effective or the magnitude of the impact changes in laws and regulations may have on our business. However, additions to the regulatory burden on our industry generally increase our cost of doing business and affect our profitability.
Climate change legislation and related regulatory initiatives could result in increased operating costs and reduced demand for our services.
In December 2009, the EPA published its findings that emissions of carbon dioxide, methane and other GHGs present an endangerment to public health and the environment because emissions of such gases are contributing to warming of the earth’s atmosphere and other climatic changes. These findings by the EPA allow the agency to proceed with the adoption and implementation of regulations that would restrict emissions of GHGs under existing provisions of the federal Clean Air Act. In anticipation of those findings, the EPA had previously proposed regulations that would require a reduction in emissions of GHGs from motor vehicles and that could lead to the imposition of GHG emission limitations in Clean Air Act permits for certain stationary sources. In addition, the EPA issued a final rule, effective in December 2009, requiring the reporting of GHG emissions from specified large GHG emission sources in the U.S., beginning in 2011 for emissions occurring in 2010. In March 2010, the EPA proposed revisions to these reporting requirements to apply to all oil and gas production, transmission, processing and other facilities exceeding certain emission thresholds. The adoption and implementation of any regulations imposing reporting obligations on, or limiting emissions of GHGs from, our equipment and operations could require us to incur additional costs to reduce emissions of GHGs associated with
38
Table of Contents
our operations or could adversely affect demand for the petroleum products we gather, treat or otherwise handle in connection with our services.
In March 2011, the U.S. House of Representatives Energy and Power Subcommittee passed the Energy Tax Prevention Act of 2011 (H.R. 910), which would prevent the EPA from regulating greenhouse gases for the purpose of addressing climate change. However, both President Obama and the Administrator of the EPA have repeatedly indicated their preference for comprehensive legislation to address this issue and create the framework for a clean energy economy, with the Obama Administration supporting an emission allowance system. Past proposed legislation in Congress has included an economy-wide cap and trade program to reduce GHG emissions. Although it is not possible at this time to predict how legislation or new regulations that may be adopted to address GHG emissions would impact our business, any such new federal, state or regional restrictions on emission of CO2 that may be imposed in areas in which we conduct business could also have an adverse effect on our cost of doing business and demand for the petroleum products we gather process, transport, store, distribute and market.
Some states are also looking at similar types of laws and regulations. If one or more states in which our operations are located were to adopt such laws and implement GHGs programs and/or cap-and-trade programs, we could incur increased operating costs and/or face decreased demand for our services.
Canada does not currently have any federal legislation pending relating to the regulation of GHG emissions. It is widely expected that Canadian federal legislation will be proposed and voted on in the next couple of years once the U.S. GHG mechanisms are decided. The adoption and implementation of any regulations imposing reporting obligations on, or limiting emissions of GHGs from, our equipment and operations could require us to incur additional costs to reduce emissions of GHGs associated with our operations or could adversely affect demand for the petroleum products we gather, treat or otherwise handle in connection with our services.
Although Canada has not yet enacted federal GHG legislation, the province of Alberta has set GHG baselines based on 2003-2005 data which requires a reduction of 12% in GHG emissions intensity from certain facilities, including several of SemCAMS’ facilities. Beginning with the second half of 2007, penalties are assessed for failure to comply with required reductions. Further limitations may be imposed in the future which could require additional SemCAMS’ facilities to have to file annual GHG emissions reports.
The potential increase in the costs of our operations resulting from any legislation or regulation to restrict emissions of GHGs could include new or increased costs to operate and maintain our facilities, install new emission controls on our facilities, acquire allowances to authorize our GHG emissions, pay any taxes related to our GHG emissions and administer and manage a GHG emissions program. While we may be able to include some or all of such increased costs in the rates charged by our pipelines or other facilities, such recovery of costs is uncertain. Moreover, incentives to conserve energy or use alternative energy sources could reduce demand for petroleum products, resulting in a decrease in the demand for our services.
Loss of key employees can significantly reduce capability to execute strategies.
Much of our future success depends on the continued availability and service of key personnel including the executive team and skilled employees in technical, operational and staff positions. Experienced personnel in the midstream industry are in high demand and competition for their talents is high. We depend on current and new key officers and employees to meet the challenges and complexities of our businesses. If any such officers or employees resign, or become unable to continue in their present roles and are not adequately replaced, or if we are unable to fill currently vacant positions, our business operations could be materially adversely affected. There can be no assurance that we will continue to attract and retain key personnel.
39
Table of Contents
The threat or attack of terrorists aimed at our facilities could adversely affect our business.
Since the September 11, 2001 terrorist attacks, the U.S. government has issued warnings that energy assets, specifically the nation’s pipeline infrastructure, may be future targets of terrorist organizations. These developments have subjected our operations to increased risks. Any future terrorist attack that may target our facilities, those of our customers or those of certain other pipelines could have a material adverse effect on our businesses. In addition, any governmental body mandated actions to prepare for, or protect against, potential terrorist attacks could require us to expend money or modify our operations.
We face intense competition in our gathering, transportation, storage and marketing activities. Competition from other providers of those services that are able to supply our customers with those services at a lower price or on otherwise better terms could adversely affect our business and operating results.
We are subject to competition from other gathering, transportation, storage and marketing operations that may be able to supply our customers with the same or comparable services at a lower price or otherwise on better terms. We compete with national, regional and local gathering, transportation and storage companies of widely varying sizes, financial resources and experience, including the major integrated oil companies. Our ability to compete could be harmed by numerous factors, including:
| • | price competition; |
| • | the perception that another company can provide better service; |
| • | a reluctance to contract with us due to our Bankruptcy filing; and |
| • | the availability of alternative supply points, or supply points located closer to the operations of our customers. |
Some of our competitors have greater financial, managerial and other resources than we do, and control substantially more storage or transportation capacity than we do. Our competitors may expand their assets or operations, creating additional competition for the services we provide to our customers. In addition, our customers may develop their own gathering, transportation and storage systems or marketing operations in lieu of using ours. Our ability to renew or replace existing contracts with our customers at rates sufficient to maintain current revenues and cash flow could be adversely affected by the activities of our competitors and our customers.
Our profitability depends on the demand for the products we gather, transport, process and store in the markets we serve.
Any sustained reduction in demand for petroleum products in markets served by our midstream assets could result in a significant reduction in the volume of petroleum products that we gather, transport, process and store, thereby adversely affecting our results of operations, cash flows and financial condition. A reduction in demand can result from a number of factors including:
| • | an increase in the price of products derived from petroleum products; |
| • | higher taxes, including federal excise taxes, crude oil severance taxes or sales taxes or other governmental or regulatory actions that increase, directly or indirectly, the cost of petroleum and natural gas based products; |
| • | adverse economic conditions which result in lower spending by consumers and businesses on products derived from petroleum products; |
| • | higher fuel taxes or other governmental or regulatory actions that increase the cost of the products we handle; |
| • | effects of weather, natural phenomena, terrorism, war, or other similar acts; |
40
Table of Contents
| • | an increase in fuel economy, whether as a result of a shift by consumers to more fuel efficient vehicles, technological advances by manufacturers or federal or state regulations; |
| • | decision by our customers or suppliers to use alternate service providers for a portion of all of their needs, operate in different markets not served by us, reduce operations or cease operations entirely; and |
| • | an increase in the use of alternative fuel sources such as ethanol, biodiesel, fuel cells, solar and wind power. |
Because of the natural decline in production from existing wells in our areas of operation, our success depends on our ability to obtain new sources of supply of petroleum products, which is dependent on factors beyond our control. Any decrease in the volumes of these products that we gather could adversely affect our business and operating results.
The volumes that support our business are dependent on the level of production from wells connected to our gathering systems, the production from which may be less than we expect as a result of a natural decline of producing wells over time and the shut-in of wells for economic or other reasons. As a result, our cash flows associated with these wells will also decline over time. In order to maintain or increase throughput levels on our gathering systems, we must obtain new sources of petroleum products. The primary factors affecting our ability to obtain sources of these products include the level of successful drilling activity near our systems and our ability to compete for volumes from successful new wells.
We have no control over the level of drilling activity in our areas of operation, the amount of reserves associated with wells connected to our gathering systems or the rate at which production from a well declines. In addition, we have no control over producers or their drilling or production decisions, which are affected by, among other things, the availability and cost of capital, prevailing and projected energy prices, demand for petroleum products, levels of reserves, geological considerations, environmental or other governmental regulations, the availability of drilling permits, the availability of drilling rigs, and other drilling, production and development costs.
Fluctuations in energy prices can also greatly affect the development of new petroleum product reserves and, to a lesser extent, production from existing wells. In general terms, energy prices fluctuate in response to changes in supply and demand, market uncertainty and a variety of additional factors that are beyond our control. Declines in energy prices could have a negative impact on exploration, development and production activity and, if sustained, could lead to a material decrease in such activity. Sustained reductions in exploration or production activity in our areas of operation would lead to reduced utilization of our gathering and treating assets. Because of these factors, even if new reserves are known to exist in areas served by our assets, producers may choose not to develop those reserves. If reductions in drilling activity result in our inability to maintain levels of throughput on our systems, it could have a material adverse effect on our business, results of operations and financial condition.
Our construction of new assets may not result in the anticipated revenue increases.
One of the ways we intend to grow our business is through the construction of new assets. If we undertake such projects, they may not be completed on schedule or at the budgeted cost, or at all. Moreover, our revenue may not increase immediately upon the expenditure of funds on a particular project. For instance, if we expand a pipeline, the construction may occur over an extended period of time and we will not receive any material increases in revenue until the project is completed. Moreover, we may construct facilities to capture anticipated future growth in production in a region in which such growth does not materialize. Since we are not engaged in the exploration for, and the development of, natural gas and crude oil reserves, we do not possess reserve expertise and we often do not have access to third party estimates of potential reserves in an area prior to constructing facilities in such area. To the extent we rely on estimates of future production in our decision to construct additions to our system, such estimates may prove to be inaccurate because of numerous uncertainties
41
Table of Contents
inherent in estimating quantities of future production. As a result, new facilities may not be able to attract enough throughput to achieve our expected investment return which could adversely affect our results of operations, cash flows and financial condition.
We may not be able to renew or replace expiring storage contracts.
We have significant exposure to market risk at the time our existing storage contracts expire and are subject to renegotiation and renewal. The extension or replacement of existing contracts depends on a number of factors beyond our control, including the:
| • | level of existing and new competition to provide storage services to our markets; |
| • | macroeconomic factors affecting crude oil storage economics for our current and potential customers; |
| • | balance of supply and demand, on a short-term, seasonal and long-term basis, in our markets; |
| • | extent to which the customers in our markets are willing to contract on a long-term basis; and |
| • | effects of federal, state or local regulations on the contracting practices of our customers. |
Any failure to extend or replace a significant portion of our existing contracts, or extend or replace them at comparable rates, could have a material adverse effect on our business, results of operations, financial condition and Rose Rock’s ability to make cash distributions to its unitholders, including us.
A change in the jurisdictional characterization of some of our assets by federal, state or local regulatory agencies or a change in policy by those agencies could result in increased regulation of our assets, which could affect existing costs and rates.
Interstate transportation and gathering pipelines that do not provide interstate services are not subject to regulation by FERC. However, the distinction between FERC-regulated interstate pipeline transportation on the one hand, and intrastate pipeline transportation, on the other hand, is a fact-based determination. The classification and regulation of our crude oil pipelines are subject to change based on future determinations by FERC, federal courts, Congress or regulatory commissions, courts or legislatures in the states in which we operate.
Our Kansas and Oklahoma gathering pipeline system carries crude oil owned by us and by third parties. We own all of the crude oil shipped on our pipeline system across state lines. We believe that the pipeline segments on which we provide service to third parties and the services we provide to third parties on the gathering pipeline system meet the traditional tests that FERC has used to determine that the pipeline services provided are not interstate commerce. We believe that the pipeline segments on which we transport only crude oil owned by us should not be subject to regulation by FERC under the ICA, or that these pipeline segments would qualify for waiver from FERC’s regulatory requirements, if applicable. However, we cannot provide assurance that FERC will not in the future, either at the request of other entities or on its own initiative, determine that some or all of our Kansas and Oklahoma gathering pipeline system and the services we provide on that system are within its jurisdiction, or that such a determination would not adversely affect our results of operations. If some or all of the gathering system were subject to FERC jurisdiction, and not otherwise exempt from any applicable regulatory requirements, for that portion of the gathering pipeline system we would be required to file a tariff with FERC, and if our tariff rates were subject to protest, provide a cost justification for the transportation rate subject to protest and provide service to all potential shippers without undue discrimination. In addition, if the services we provide on any segment(s) of our gathering system become regulated by FERC under the ICA, our services could be subject to a protest and/or complaint before FERC. If FERC were to determine, in response to a complaint, that our rates are unjust and unreasonable, we could be required to pay reparations and refunds dating to two years before the filing of the complaint. Furthermore, if in the future our services become subject to state regulation, they could be subject to a protest and/or complaint before a state commission with jurisdiction.
42
Table of Contents
Increased regulation of hydraulic fracturing could result in reductions or delays in crude oil production in our areas of operation, which could adversely impact our business and results of operations.
An increasing percentage of crude oil production is being developed from unconventional sources such as shale. These reservoirs require hydraulic fracturing completion processes to release the crude oil from the rock so it can flow through casing to the surface. Hydraulic fracturing involves the injection of water, sand and chemicals under pressure into the formation to stimulate crude oil production. The EPA has commenced a study of the potential environmental impacts of hydraulic fracturing activities, including on water quality and public health, with results of the study anticipated to be available by late 2012. At the same time, certain environmental groups have suggested that additional laws may be needed to more closely and uniformly regulate the hydraulic fracturing process, and legislation has been proposed by some members of Congress to provide for such regulation. For instance, the U.S. Congress is currently considering legislation to amend the federal Safe Drinking Water Act to subject hydraulic fracturing operations to regulation under that act. Sponsors of bills currently pending before the U.S. Senate and House of Representatives have asserted that chemicals used in the fracturing process could adversely affect drinking water supplies. Proposed legislation would require, among other things, the reporting and public disclosure of chemicals used in the fracturing process, which could make it easier for third parties opposing the hydraulic fracturing process to initiate legal proceedings against producers and service providers. In addition, these bills, if adopted, could establish an additional level of regulation and permitting of hydraulic fracturing operations at the federal level, which could lead to operational delays, increased operating and compliance costs and additional regulatory burdens that could make it more difficult or commercially impracticable to perform hydraulic fracturing, delaying the development of unconventional resources from shale formations which are not commercial without the use of hydraulic fracturing. The Department of Energy, at the direction of the President, is also studying hydraulic fracturing in order to provide recommendations and identify best practices and other steps to enhance companies’ safety and environmental performance in their hydraulic fracturing operations. In addition, several states have already passed, or are considering, legislation that is intended to regulate hydraulic fracturing. We cannot predict what effect such legislation will have on the production of crude oil in our areas of operation. The imposition of additional regulations and permit requirements could lead to delays or increased operating costs for crude oil producers. A reduction in the production of crude oil in our areas of operation could have an adverse effect on our business, results of operations and financial condition.
Risks Related to Our Class A Common Stock and Warrants
Our Class A Common Stock and warrants may experience significant price and volume fluctuations.
The market price of our Class A Common Stock may fluctuate significantly in response to various factors and events beyond our control, including the following:
| • | the risk factors described in this report on Form 10-K; |
| • | our operating and financial results differing from that expected by securities analysts and investors; |
| • | the financial and stock price performance of our competitors or companies in our industry generally; |
| • | changes in accounting standards, policies, interpretations or principles; |
| • | changes in laws or regulations which adversely affect our industry or us; |
| • | general conditions in our customers’ industries; and |
| • | general economic conditions and conditions in the securities markets. |
Our warrants are publicly traded on the NYSE. We believe that the market price of the warrants will be primarily affected by the market price of our Class A Common Stock and, consequently, may fluctuate significantly in response to the various factors and events affecting the market price of our Class A Common Stock.
43
Table of Contents
We currently do not intend to pay cash dividends on our Class A Common Stock and, consequently, your only opportunity to achieve a return on our Class A Common Stock is if the price of our common stock appreciates.
We have never declared or paid any cash dividends on our Class A Common Stock and do not currently plan to pay any cash dividends on our Class A Common Stock. The terms of our credit facilities restrict our ability to pay dividends. Any future payments of cash dividends on our Class A Common Stock will depend upon contractual restrictions limiting our ability to pay dividends, our earnings and cash flows, our capital requirements, our financial condition and other factors deemed relevant by our Board of Directors. Consequently, your only opportunity to achieve a return on our Class A Common Stock will be if the market price of such stock appreciates and you sell your shares at a profit.
44
Table of Contents
| Item 1B. | Unresolved Staff Comments |
None.
| Item 3. | Legal Proceedings |
For information regarding legal proceedings, see the discussion under the captions “Bankruptcy matters”, “Other matters” and “Environmental” in Note 18 of our consolidated financial statements beginning on page F-1 of this Form 10-K, which information is incorporated by reference into this Item 3.
| Item 4. | Mine Safety Disclosures |
Not applicable.
Executive Officers of the Registrant
Our executive officers are elected annually by, and serve at the discretion of, our Board of Directors. Set forth below is information concerning our executive officers.
| Name |
Age | Position | ||||
| Norman J. Szydlowski |
60 | President and Chief Executive Officer and Director | ||||
| Robert N. Fitzgerald |
52 | Senior Vice President and Chief Financial Officer | ||||
| Candice L. Cheeseman |
56 | General Counsel and Secretary | ||||
| Timothy O’Sullivan |
55 | Vice President, Corporate Planning and Strategic Initiatives | ||||
| Peter L. Schwiering |
67 | Vice President and President of SemCrude, L.P. | ||||
Norman J. Szydlowski has served as a director and as President and Chief Executive Officer of SemGroup since November 2009. Mr. Szydlowski has also served as Chairman of the Board of Directors, President and Chief Executive Officer of our subsidiary Rose Rock Midstream GP, LLC, the general partner of Rose Rock, since August 2011. From January 2006 until January 2009, Mr. Szydlowski served as president and chief executive officer of Colonial Pipeline Company, an interstate common carrier of petroleum products. From 2004 to 2005, he served as a senior consultant to the Iraqi Ministry of Oil in Baghdad on behalf of the U.S. Department of Defense, where he led an advisory team in the rehabilitation, infrastructure security and development of future strategy of the Iraqi oil sector. From 2002 until 2004, he served as vice president of refining for Chevron Corporation (formerly ChevronTexaco), one of the world’s largest integrated energy companies. Mr. Szydlowski joined Chevron in 1981 and served in various capacities of increasing responsibility in sales, planning, supply chain management, refining and plant operations, transportation and construction engineering. Mr. Szydlowski serves on the board of directors of NGL Energy Holdings LLC, the general partner of NGL Energy Partners LP, an owner and operator in the midstream, wholesale supply and marketing and retail propane business. Mr. Szydlowski graduated from Indiana University in Bloomington with a master’s degree in business administration. He also holds a Bachelor of Science degree in mechanical engineering from Kettering University.
Robert N. Fitzgerald joined SemGroup in November 2009 and serves as Senior Vice President and Chief Financial Officer. Mr. Fitzgerald has also served as a director, Senior Vice President and Chief Financial Officer of our subsidiary Rose Rock Midstream GP, LLC, the general partner of Rose Rock, since August 2011. Prior to joining SemGroup, Mr. Fitzgerald served as chief financial officer from February 2008 to November 2009 of Windsor Energy Group, a private independent oil and gas exploration and development company. He has also served from December 2006 until February 2008 as executive vice president of LinkAmerica Corp. and from January 2003 until December 2006 as chief operating officer and chief financial officer of Arrow Trucking Company, both commodity transportation companies. From January 2000 until January 2003, he served as vice president, finance of Williams Communications Group, a global communication company. Prior to that, Mr. Fitzgerald was with BP Amoco and Amoco Corporation for 20 years, working in various financial and operations positions in Tulsa, Oklahoma; Houston, Texas; Denver, Colorado; and Chicago, Illinois.
45
Table of Contents
Mr. Fitzgerald received a master’s degree in business administration from the University of Tulsa and a Bachelor of Business Administration degree from Western Illinois University. He is currently a member of the American Institute of Certified Public Accountants, the Institute of Management Accountants and the Institute of Internal Auditors. He is a certified public accountant.
Candice L. Cheeseman joined SemGroup in February 2010 and serves as General Counsel and Secretary. Ms. Cheeseman has also served as General Counsel and Secretary of our subsidiary Rose Rock Midstream GP, LLC, the general partner of Rose Rock since August 2011. Prior to joining our company, Ms. Cheeseman served as general counsel of Global Power Equipment Group Inc., a comprehensive provider of power generation equipment and maintenance services for energy customers, since May 2004. In September 2006, Global Power Equipment Group Inc. and its domestic subsidiaries filed voluntary petitions for relief under Chapter 11 of the U.S. Bankruptcy Code in the U.S. Bankruptcy Court for the District of Delaware. Global Power Equipment Group and its subsidiaries emerged from bankruptcy protection in January 2008. Prior to Global Power, she was employed by WilTel Communications Group, an internet, data, voice and video service provider, where she served in a variety of capacities, including general counsel and secretary, commencing in November 2002. Ms. Cheeseman has been a practicing attorney for two decades serving in various capacities for Williams Communications, Marriott International and law firms in the Washington D.C. area. Ms. Cheeseman received her juris doctorate degree from the University of Tulsa College of Law. She also holds a Bachelor of Arts degree from the University of Delaware.
Timothy O’Sullivan serves as Vice President, Corporate Planning and Strategic Initiatives of SemGroup, a position he has held since April 2010. Mr. O’Sullivan has also served as a director and Vice President of our subsidiary Rose Rock Midstream GP, LLC, the general partner of Rose Rock, since August 2011. From February 2005 until April 2010, he served as President and Chief Operating Officer of SemGas, L.P. From 2001 until joining our company, Mr. O’Sullivan worked for Williams Power Company where he was director of global gas and power origination. He was previously employed with Koch Industries, Inc. for 19 years where he served in various capacities in its natural gas division, including business development, marketing and trading, and executive management. Mr. O’Sullivan began his career as a staff accountant for Main Hurdman. Mr. O’Sullivan graduated from Wichita State University with a bachelor’s degree in accounting. He also is a certified public accountant. Mr. O’Sullivan was a member of the board of directors of the Gas Processors Association and served on its Executive and Finance Committee.
Peter L. Schwiering has served as Vice President of SemGroup since February 2012. Mr. Schwiering has also served as the Chief Operating Officer and a director of our subsidiary, Rose Rock Midstream GP, LLC, the general partner of Rose Rock, since August 2011. He also serves as President of SemCrude, L.P., a position he has held since August 2009. Mr. Schwiering joined SemCrude, L.P. in 2000 as Vice President of Operations. Prior to joining SemCrude, L.P., Mr. Schwiering worked for Dynegy Pipeline as manager of pipeline and commercial business. He also served with Sun Company for 25 years in various positions, last serving as the company’s manager of business development—Western Region, based in Oklahoma. Mr. Schwiering has over 40 years of experience in the energy industry.
46
Table of Contents
PART II
Item 5. Market for Registrant’s Common Equity, Related Stockholder Matters and Issuer Purchases of Equity Securities
Market Information
Our Class A Common Stock commenced trading on the New York Stock Exchange on November 11, 2010, under the ticker symbol “SEMG.” Prior to November 11, 2010, there was no established public trading market for our Class A Common Stock. There is no established public trading market for our Class B Common Stock. At January 31, 2012, we had 1,614 holders of record of our Class A Common Stock and one holder of record of our Class B Common Stock. The following table sets forth the high and low closing sales prices of our Class A Common Stock (New York Stock Exchange composite transactions) during the periods indicated.
| High | Low | |||||||
| For the year ended December 31, 2011: |
||||||||
| First quarter |
$ | 34.28 | $ | 26.00 | ||||
| Second quarter |
$ | 29.53 | $ | 23.79 | ||||
| Third quarter |
$ | 25.65 | $ | 16.55 | ||||
| Fourth quarter |
$ | 29.57 | $ | 18.34 | ||||
| For the year ended December 31, 2010: |
||||||||
| Fourth quarter (from November 11) |
$ | 29.07 | $ | 24.05 | ||||
47
Table of Contents
Performance Graph
Set forth below is a line graph comparing the cumulative total stockholder return on our Class A Common Stock with the cumulative total return of the S&P 500 Stock Index and the Alerian MLP Infrastructure Index (AMZIX) for the period from November 11, 2010 to December 31, 2011. The Alerian MLP Infrastructure Index is a liquid, midstream-focused subset of the Alerian MLP index, comprised of 25 energy infrastructure master limited partnerships.
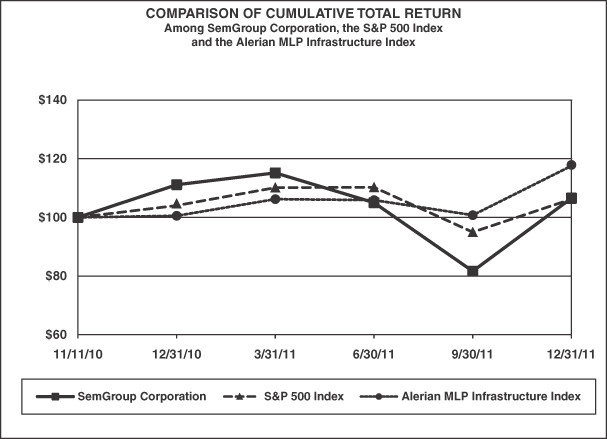
The above performance graph and related information shall not be deemed “soliciting material” or be deemed to be “filed” with the SEC, nor shall such information be incorporated by reference into any filing under the Securities Act or the Exchange Act, except to the extent that we specifically incorporate it by reference into such filing.
Dividends
We have not paid any cash dividends on our common stock to date and do not currently intend to pay any cash dividends. In addition, the terms of our current credit facilities restrict the payment of cash dividends on our common stock. See “Management’s Discussion and Analysis of Financial Condition and Results of Operations—Liquidity and Capital Resources—Sources and Uses of Cash” in Item 7 of this Form 10-K.
48
Table of Contents
Item 6. Selected Financial Data
Selected Historical Consolidated Financial Data
The following table provides selected historical consolidated financial data as of and for the periods shown. The balance sheet data as of December 31, 2011, 2010, 2009 and 2008 and as of November 30, 2009, and the statement of operations data for the years ended December 31, 2011, 2010, 2008 and 2007 and the one month ended December 31, 2009 and the eleven months ended November 30, 2009, have been derived from our audited financial statements for those dates and periods. The balance sheet data as of December 31, 2007 has been derived from our unaudited financial statements. The selected financial data provided below should be read in conjunction with “Item 7. Management’s Discussion and Analysis of Financial Condition and Results of Operations” and our consolidated financial statements and related notes included in this Form 10-K.
Balance sheet data in the following table as of December 31, 2011, 2010, 2009 and November 30, 2009 and statement of operations data for the years ended December 31, 2011 and 2010 and the one month ended December 31, 2009, are that of SemGroup Corporation. Balance sheet and statement of operations data as of all other dates and for all other periods are that of our predecessor, SemGroup, L.P. As described in Note 8 of our consolidated financial statements, we applied fresh-start reporting as of November 30, 2009. As a result, our financial data is not comparable to that of our predecessor. Earnings per share in the following table is only presented for the periods subsequent to our emergence from the Bankruptcy, since the limited partner units of SemGroup, L.P. were cancelled upon emergence from the Bankruptcy.
The following table presents the non-GAAP financial measures of adjusted gross margin and adjusted EBITDA, which we use in our business and view as important supplemental measures of our performance. Adjusted gross margin and adjusted EBITDA are not calculated or presented in accordance with GAAP. For definitions of adjusted gross margin and adjusted EBITDA and a reconciliation of adjusted gross margin to operating income (loss) and of adjusted EBITDA to net income (loss), their most directly comparable financial measures calculated and presented in accordance with GAAP, please see Item 7. Management’s Discussion and Analysis of Financial Condition and Results of Operations—How We Evaluate our Operations.
49
Table of Contents
| Successor | Predecessor | |||||||||||||||||||||||||
| Year Ended December 31, 2011 |
Year Ended December 31, 2010 |
One Month Ended December 31, 2009 |
Eleven Months Ended November 30, 2009 |
Year Ended December 31, 2008 |
Year Ended December 31, 2007 |
|||||||||||||||||||||
| (amounts in U.S. $ thousands, except per share amounts) | ||||||||||||||||||||||||||
| Statement of operations data: |
||||||||||||||||||||||||||
| Total revenues |
$ | 1,479,510 | $ | 1,630,334 | $ | 157,328 | $ | 901,235 | $ | 6,706,648 | $ | 7,146,951 | ||||||||||||||
| Operating income (loss) |
$ | 45,625 | $ | (50,258 | ) | $ | (39,395 | ) | $ | 12,908 | $ | (1,239,589 | ) | $ | (338,573 | ) | ||||||||||
| Reorganization items gain (loss) |
$ | — | $ | — | $ | — | $ | 3,532,443 | $ | (411,601 | ) | — | ||||||||||||||
| Income (loss) from continuing operations |
$ | 2,822 | $ | (134,506 | ) | $ | (38,132 | ) | $ | 3,535,692 | $ | (1,810,106 | ) | $ | (362,095 | ) | ||||||||||
| Income (loss) from discontinued operations |
(10 | ) | 2,434 | 215 | (141,613 | ) | (1,018,921 | ) | (236,235 | ) | ||||||||||||||||
|
|
|
|
|
|
|
|
|
|
|
|
|
|||||||||||||||
| Net income (loss) |
$ | 2,812 | $ | (132,072 | ) | $ | (37,917 | ) | $ | 3,394,079 | $ | (2,829,027 | ) | $ | (598,330 | ) | ||||||||||
| Net income (loss) attributable to noncontrolling interests |
435 | 225 | (25 | ) | (505 | ) | 22,855 | 6,854 | ||||||||||||||||||
|
|
|
|
|
|
|
|
|
|
|
|
|
|||||||||||||||
| Net income (loss) attributable to SemGroup |
$ | 2,377 | $ | (132,297 | ) | $ | (37,892 | ) | $ | 3,394,584 | $ | (2,851,882 | ) | $ | (605,184 | ) | ||||||||||
| Income (loss) from continuing operations per share of common stock: Basic |
$ | 0.06 | $ | (3.20 | ) | $ | (0.92 | ) | — | — | — | |||||||||||||||
| Diluted |
$ | (0.06 | ) | $ | (3.20 | ) | $ | (0.92 | ) | — | — | — | ||||||||||||||
| Other financial data: |
||||||||||||||||||||||||||
| Adjusted gross margin |
$ | 316,728 | $ | 247,961 | $ | 1,285 | $ | 167,554 | $ | 106,354 | $ | 910,404 | ||||||||||||||
| Adjusted EBITDA |
$ | 116,098 | $ | 152,799 | $ | 9,984 | $ | 94,871 | $ | (412,732 | ) | $ | 510,352 | |||||||||||||
| Successor | Predecessor | |||||||||||||||||||||||||
| As of December 31, 2011 |
As of December 31, 2010 |
As of December 31, 2009 |
As of November 30, 2009 |
As of December 31, 2008 |
As of December 31, 2007 (unaudited) |
|||||||||||||||||||||
| (amounts in U.S. $ thousands) | ||||||||||||||||||||||||||
| Balance sheet data: |
||||||||||||||||||||||||||
| Total assets |
$ | 1,491,181 | $ | 1,667,188 | $ | 2,210,013 | $ | 2,272,512 | $ | 2,777,036 | $ | 5,244,434 | ||||||||||||||
| Long-term debt, including current portion (excluding debt subject to compromise) |
$ | 109,335 | $ | 348,443 | $ | 519,932 | $ | 535,351 | $ | 180,146 | $ | 2,579,980 | ||||||||||||||
| Owners’ equity: |
||||||||||||||||||||||||||
| SemGroup Corporation owners’ equity |
$ | 851,096 | $ | 855,068 | $ | 976,686 | $ | 1,017,678 | $ | — | $ | — | ||||||||||||||
| SemGroup, L.P. partners’ capital |
— | — | — | (3,422,693 | ) | (342,142 | ) | |||||||||||||||||||
| Noncontrolling interest |
127,569 | — | 1,571 | 1,621 | 2,212 | 319,611 | ||||||||||||||||||||
|
|
|
|
|
|
|
|
|
|
|
|
|
|||||||||||||||
| Total owners’ equity |
$ | 978,665 | $ | 855,068 | $ | 978,257 | $ | 1,019,299 | $ | (3,420,481 | ) | $ | (22,531 | ) | ||||||||||||
50
Table of Contents
We have experienced many changes in our business during the periods shown in the table above, which significantly limits the comparability of the financial data. Such changes include, but are not limited to:
| • | the de-consolidation in July 2008, and the reconsolidation in November 2009, of SemCAMS and SemCanada Crude, as described in Note 5 of our consolidated financial statements; |
| • | the de-consolidation in July 2008 of SemCanada Energy and Blueknight, as described in Note 5 of our consolidated financial statements; |
| • | our Bankruptcy, which resulted in significant professional fee expenses and losses on the disposal or impairment of long-lived assets; |
| • | our emergence from the Bankruptcy during 2009, which resulted in reorganization gains on the extinguishment of debt and on the application of fresh-start reporting; |
| • | the deconsolidation of White Cliffs at the end of September 2010; |
| • | various impairments of long-lived assets and gains/losses on disposal of long-lived assets; |
| • | the sale of SemStream assets to NGL Energy Partners on November 1, 2011; and |
| • | the initial public offering for Rose Rock in December 2011. |
51
Table of Contents
Item 7. Management’s Discussion and Analysis of Financial Condition and Results of Operations
Overview of Business
We provide gathering, transportation, storage, distribution, marketing and other midstream services primarily to independent producers, refiners of petroleum products and other market participants located in the Midwest and Rocky Mountain regions of the U.S., Canada and the West Coast of the U.K. We, or our significant equity method investees, have an asset base consisting of pipelines, gathering systems, storage facilities, terminals, processing plants and other distribution assets located between North American production and supply areas, including the Gulf Coast, Rocky Mountain and Western Canadian regions and areas of high demand such as the Midwest region of the U.S. We maintain and operate storage, terminal and marine facilities at Milford Haven in the U.K. that enable customers to supply products to markets in the Atlantic Basin. We also operate a network of liquid asphalt cement terminals throughout Mexico.
Our strategically located pipelines, terminals and storage tanks, with access to North American transportation pipeline interconnects, are well positioned to benefit from the continuing need to transport and gather petroleum products from areas of supply to areas of demand.
How We Evaluate Our Operations
Our management uses a variety of financial and operational metrics to analyze our performance. We view these metrics as important factors in evaluating our profitability and review these measurements on at least a monthly basis for consistency and trend analysis. These metrics include financial measures such as adjusted gross margin, operating expenses and adjusted EBITDA.
Adjusted Gross Margin
We view adjusted gross margin as an important performance measure of the core profitability of our operations, as well as our operating performance as compared to that of other companies in our industry, without regard to financing methods, historical cost basis, capital structure or the impact of fluctuating commodity prices. We define adjusted gross margin as total revenues minus cost of products sold and unrealized gain (loss) on derivatives. Adjusted gross margin allows us to make a meaningful comparison of the operating results between our fee-based activities, which do not involve the purchase or sale of petroleum products, and our fixed-margin and marketing operations, which do. In addition, adjusted gross margin allows us to make a meaningful comparison of the results of our fixed-margin and marketing operations across different commodity price environments because it measures the spread between the product sales price and costs of products sold.
Operating Expenses
Our management seeks to maximize the profitability of our operations, in part, by minimizing operating expenses. These expenses are comprised of salary and wage expense, utility costs, insurance premiums, taxes and other operating costs, some of which are independent of the volumes we handle.
The current high levels of crude oil exploration, development and production activities are increasing competition for personnel and equipment. This increased competition is placing upward pressure on the prices we pay for labor, supplies and miscellaneous equipment. To the extent we are unable to procure necessary services or offset higher costs, our operating results will be negatively impacted.
Adjusted EBITDA
We define adjusted EBITDA as net income (loss) before interest expense, income tax expense (benefit), depreciation and amortization and adjusted for selected items that SemGroup believes impact the comparability
52
Table of Contents
of financial results between reporting periods. We use adjusted EBITDA as a supplemental performance measure to assess:
| • | our operating performance as compared to that of other companies in our industry, without regard to financing methods, historical cost basis, capital structure or the impact of fluctuating commodity prices; and |
| • | the viability of acquisitions and other capital expenditure projects and the returns on investment of various investment opportunities. |
Note About Non-GAAP Financial Measures
Adjusted gross margin and adjusted EBITDA are not financial measures presented in accordance with GAAP. We believe that the presentation of these non-GAAP financial measures will provide useful information to investors in assessing our financial condition and results of operations.
Operating income (loss) is the GAAP measure most directly comparable to adjusted gross margin, and net income (loss) is the GAAP measure most directly comparable to adjusted EBITDA. Our non-GAAP financial measures should not be considered as alternatives to the most directly comparable GAAP financial measures. Each of these non-GAAP financial measures has important limitations as an analytical tool because it excludes some, but not all, items that affect the most directly comparable GAAP financial measure. You should not consider adjusted gross margin or adjusted EBITDA in isolation or as a substitute for analysis of our results as reported under GAAP. Because adjusted gross margin and adjusted EBITDA may be defined differently by other companies in our industry, our definitions of these non-GAAP financial measures may not be comparable to similarly titled measures of other companies, thereby diminishing their utility.
Management compensates for the limitations of adjusted gross margin and adjusted EBITDA as an analytical tool by reviewing the comparable GAAP measures, understanding the difference between adjusted gross margin and adjusted EBITDA, on the one hand, and operating income (loss) and net income (loss), on the other hand, and incorporating this knowledge into its decision-making processes. We believe that investors benefit from having access to the same financial measures that our management uses in evaluating our operating results.
53
Table of Contents
The following table presents a reconciliation of operating income (loss) to adjusted gross margin and net income (loss) to adjusted EBITDA, the most directly comparable GAAP financial measures, on a historical basis for each of the periods indicated.
| Successor | Predecessor | |||||||||||||||||||||||||
| Year Ended December 31, 2011 |
Year Ended December 31, 2010 |
Month Ended December 31, 2009 |
Eleven Months Ended November 30, 2009 |
Year Ended December 31, 2008 |
Year Ended December 31, 2007 |
|||||||||||||||||||||
| (Unaudited; in thousands) | ||||||||||||||||||||||||||
| Reconciliation of operating income (loss) to adjusted gross margin: |
||||||||||||||||||||||||||
| Operating income (loss) |
$ | 45,625 | $ | (50,258 | ) | $ | (39,395 | ) | $ | 12,908 | $ | (1,239,589 | ) | $ | (338,573 | ) | ||||||||||
| Add: |
||||||||||||||||||||||||||
| Unrealized (gain) loss on derivatives |
(14,114 | ) | (13,340 | ) | 7,112 | 24,118 | 677,755 | 692,839 | ||||||||||||||||||
| Operating expense |
157,013 | 153,440 | 16,765 | 47,307 | 468,377 | 265,948 | ||||||||||||||||||||
| General and administrative expense |
77,015 | 87,237 | 8,012 | 44,248 | 112,821 | 199,728 | ||||||||||||||||||||
| Depreciation and amortization expense |
51,189 | 70,882 | 8,791 | 38,974 | 86,990 | 90,462 | ||||||||||||||||||||
|
|
|
|
|
|
|
|
|
|
|
|
|
|||||||||||||||
| Adjusted gross margin |
$ | 316,728 | $ | 247,961 | $ | 1,285 | $ | 167,555 | $ | 106,354 | $ | 910,404 | ||||||||||||||
|
|
|
|
|
|
|
|
|
|
|
|
|
|||||||||||||||
54
Table of Contents
| Successor | Predecessor | |||||||||||||||||||||||||
| Year Ended December 31, 2011 |
Year Ended December 31, 2010 |
Month Ended December 31, 2009 |
Eleven Months Ended November 30, 2009 |
Year Ended December 31, 2008 |
Year Ended December 31, 2007 |
|||||||||||||||||||||
| Reconciliation of net income (loss) to adjusted EBITDA: |
||||||||||||||||||||||||||
| Net income (loss) attributable to SemGroup |
$ | 2,377 | $ | (132,297 | ) | $ | (37,892 | ) | $ | 3,394,584 | $ | (2,851,882 | ) | $ | (605,184 | ) | ||||||||||
| Add: |
||||||||||||||||||||||||||
| Interest expense |
60,208 | 86,133 | 7,169 | 12,041 | 110,789 | 105,169 | ||||||||||||||||||||
| Income tax expense (benefit) |
(2,416 | ) | (6,223 | ) | (7,209 | ) | 6,310 | 48,497 | (6,493 | ) | ||||||||||||||||
| Depreciation and amortization |
51,189 | 70,882 | 8,791 | 38,974 | 86,990 | 90,462 | ||||||||||||||||||||
| (Gain) loss on impairment or sale of assets |
9,497 | 105,050 | 23,119 | 13,625 | 71,718 | 15,261 | ||||||||||||||||||||
| Reorganization items (gain) loss |
— | — | — | (3,532,443 | ) | 411,601 | — | |||||||||||||||||||
| Loss (income) from discontinued operations |
10 | (2,434 | ) | (215 | ) | 141,613 | 1,018,921 | 236,235 | ||||||||||||||||||
| Foreign currency transaction (gain)/loss |
(3,450 | ) | 2,899 | (678 | ) | (3,950 | ) | 12,879 | (17,937 | ) | ||||||||||||||||
| Employee severance expense |
4,374 | 1,558 | — | — | — | — | ||||||||||||||||||||
| Impact of change in basis of NGL inventory in fresh-start reporting |
— | 27,821 | 8,681 | — | — | — | ||||||||||||||||||||
| Unrealized (gain) loss on derivatives |
(14,114 | ) | (13,340 | ) | 7,112 | 24,117 | 677,755 | 692,839 | ||||||||||||||||||
| Change in fair value of warrants |
(5,012 | ) | 283 | 872 | — | — | — | |||||||||||||||||||
| Reversal of allowance on goods and services tax receivable |
(4,144 | ) | — | — | — | — | — | |||||||||||||||||||
| Depreciation and amortization included within equity in earnings of White Cliffs |
10,630 | 2,897 | — | — | — | — | ||||||||||||||||||||
| Defense costs |
1,000 | — | — | — | — | — | ||||||||||||||||||||
| Allowance on (recovery of) receivable from AGE Refining |
(2,692 | ) | 3,340 | — | — | — | — | |||||||||||||||||||
| Restricted stock expense |
8,641 | 6,230 | 234 | — | — | — | ||||||||||||||||||||
|
|
|
|
|
|
|
|
|
|
|
|
|
|||||||||||||||
| Adjusted EBITDA |
$ | 116,098 | $ | 152,799 | $ | 9,984 | $ | 94,871 | $ | (412,732 | ) | $ | 510,352 | |||||||||||||
|
|
|
|
|
|
|
|
|
|
|
|
|
|||||||||||||||
55
Table of Contents
Business and Performance Drivers
We operate our business through six primary business segments: Crude, SemStream, SemLogistics, SemCAMS, SemMexico and SemGas. We generate revenue in these segments by utilizing our assets to provide products and services to third parties and by selectively using our assets to support our marketing activities. For certain products, the relationship between current and future price is generally seasonal. We believe that the variety of our petroleum product assets creates opportunities for us and our customers year round.
Certain factors are key to our operations. These include the safe, reliable and efficient operation of the pipelines and facilities that we own and operate while meeting the regulations that govern the operation of our assets and the costs associated with such regulations. Our revenue is impacted by several factors, including:
Throughput and processing fees
Throughput and processing fees are fees charged to third parties based on volumes of product run through our processing facilities or pipeline gathering systems.
Service, Storage and Terminalling Fees
Storage and terminalling fees are fees charged to third parties for petroleum product storage or terminalling services provided by us and are based on leased shell capacity and/or volumes moved through our terminal facilities.
Tariffs
Tariffs are fees charged to third parties for the transportation of their petroleum products on our regulated White Cliffs Pipeline.
Petroleum Product Marketing
We intend to capture the normalized gross margin associated with the purchase and sale of petroleum products. Purchases, sales and derivative transactions related to this activity are tracked in our systems to the ultimate realization of profit. We seek to maintain limited net open positions to manage our exposure to commodity prices. Marketing transactions may only be entered into by persons delegated such authority by senior management, as provided in our Comprehensive Risk Management Policy. Each person authorized to make transactions is subject to internal volume and dollar limits, portfolios are subject to net open position and stop loss limits, and counterparties are subject to credit limits and provisions as approved by our credit department. See “Business—Risk Governance and Comprehensive Risk Management Policy” for more information on our Comprehensive Risk Management Policy.
Revenue
Our revenue is generated from third-party fees earned through the gathering, pipeline transporting and storing of petroleum products principally in the Midwest region. Our customers pay us fees based on volumes gathered, transported and stored; through the sale of petroleum products based upon contract or index rates per barrel, million Btu or gallon. We generate additional revenue through selected marketing of petroleum products. Marketing operations consist primarily of aggregating petroleum products purchased at the lease along pipeline systems or trucked, and arranging the necessary transportation logistics for the ultimate sale or delivery of the petroleum products to customers or other end-users. Gathering and transportation revenue is recognized as petroleum products are delivered to customers. Storage revenue is recognized upon leasing of shell capacity on a take or pay basis. Marketing revenue is accrued at the time title to the petroleum product sold transfers to the purchaser, which typically occurs upon receipt of the petroleum product by the purchaser.
We utilize futures, swaps and options contracts to manage our exposure to market changes in commodity prices, to protect our gross margins on our purchased petroleum products and to manage our liquidity risk
56
Table of Contents
associated with margin deposit requirements on our overall derivative positions. When purchasing petroleum products, we seek to manage our exposure to commodity price risk. As we purchase inventory from suppliers, we may establish a fixed or variable margin with future sales utilizing one of the following methods:
| • | we have already sold that product for physical delivery pursuant to sales contracts at a market index price, |
| • | we sell the product for future physical delivery pursuant to effectively back-to-back sales contracts, or |
| • | we enter into futures and swaps contracts on the NYMEX or over the counter (“OTC”) markets. |
In addition, we may purchase put options or derivatives other than futures or swaps to hedge our inventory of petroleum products prior to our sale of such inventory.
ASC 845-10-15, “Nonmonetary Transactions,” requires certain transactions – those where inventory is purchased from a customer then resold to the same customers – to be presented in the income statement on a net basis, resulting in a reduction of revenue and costs of products sold by the same amount, but has no effect on operating income (loss). However, changes in the level of such purchase and sale activity between periods can have an effect on the comparison between those periods.
Volumes
Generally, we expect revenue to increase or decrease in conjunction with increases or decreases in total volumes. Our total volumes are affected by different factors including our physical storage or transportation capacity, our working capital and credit availability under our credit facilities to support petroleum product purchases and the availability of the supply of petroleum product available for purchase, which is determined based primarily upon producer activity in market areas contiguous with our asset base.
Commodity Prices
Our business is primarily fee based. As a result, our financial results are typically not correlated with increases and decreases in commodity prices. Our financial results, however, are positively correlated with the absolute difference between current (prompt) and future month petroleum product prices. That is, wide contango (when the prices for future deliveries are higher than current prices) spreads generally have a favorable impact on our results relative to a slightly contango, flat market, or backwardated (when the prices for future deliveries are lower than current prices).
Timing of Purchase and Sales
Our financial results are affected by the timing of the purchase and sale of petroleum products, such that financial results may not be comparable between periods. When we enter into an arrangement to purchase product, place the product in storage and resell the product in the future, our financial results do not reflect any related margin until the settlement of the product sale. Prior to the settlement of the product sale, our results reflect the cost of the product in our inventory. Differences in the timing of our product purchases and sales, especially if they extend over fiscal years or quarters, may result in sizeable differences between our results over the comparable period.
Analysis of Business Segments
The following provides an overview of the makeup of revenue at each of our respective business segments.
Crude
Rose Rock was formed in August 2011. In November 2011, SemGroup contributed SemCrude, L.P. to Rose Rock in exchange for limited partner interests, general partner interests and certain incentive distribution rights.
57
Table of Contents
In December 2011, Rose Rock completed an initial public offering in which it sold 7,000,000 common units representing limited partner interests. SemGroup consolidates the accounts of Rose Rock as a result of the level of its ownership interests and control over the entity.
Crude conducts business through its 51% ownership interest in White Cliffs Pipeline (which it operates) and a 2% general partner interest and 57.0% limited partner interest in Rose Rock. These operations include crude oil transportation, storage, terminalling, gathering and marketing in Colorado, Kansas, Montana, North Dakota, Oklahoma and Texas, for third party customers as well as for itself. The Crude business unit consists of three primary operations: (i) Kansas and Oklahoma pipeline system (Rose Rock); (ii) Cushing storage (Rose Rock); and (iii) White Cliffs Pipeline. A majority of Crude’s revenue is generated from fee-based contractual arrangements that, in some instances, are fixed and not dependent on usage.
Fee-Based Services
Crude charges a capacity or volume-based fee for the unloading, transportation and storage of crude oil and related ancillary services. Crude’s fee-based services include substantially all of its operations in Cushing and Platteville and a portion of the transportation services it provides on its Kansas and Oklahoma pipeline system. Some of Crude’s fee-based contracts are take-or-pay contracts whereby the customer is required to pay Crude a fixed minimum monthly fee regardless of usage. For the years ended December 31, 2011 and 2010, approximately 56% and 80% of Crude’s adjusted gross margin, respectively, was generated by providing fee-based services to customers.
Fixed-Margin Transactions
Crude purchases crude oil from a producer or supplier at a designated receipt point at an index price less a transportation fee, and simultaneously sells an identical volume of crude oil at a designated delivery point to the same party at the same index price, thereby locking in a fixed margin that is in effect economically equivalent to a transportation fee. We refer to these arrangements as “fixed-margin” or “buy/sell” transactions. These fixed-margin transactions account for a portion of the adjusted gross margin Crude generates on its Kansas and Oklahoma pipeline system and through its Bakken Shale operations. For the years ended December 31, 2011 and 2010, approximately 14% and 5% of its adjusted gross margin, respectively, was generated through fixed-margin transactions.
Marketing Activities
Crude conducts marketing activities by purchasing crude oil for its own account from producers, aggregators and traders and selling crude oil to traders and refiners. Crude’s marketing activities account for a portion of the adjusted gross margin it generates on its Kansas and Oklahoma pipeline system and through its Bakken Shale operations. For the years ended December 31, 2011 and 2010, approximately 30% and 15% of its adjusted gross margin, respectively, was generated through marketing activities.
We mitigate the commodity price exposure of our crude oil marketing operations by limiting our net open positions through (i) the concurrent purchase and sale of like quantities of crude oil to create “back-to-back” transactions intended to lock in positive margins based on the timing, location or quality of the crude oil purchased and delivered or (ii) derivative contracts. All of our marketing activities are subject to our comprehensive risk management policy, which establishes limits to manage risk and mitigate financial exposure.
More specifically, we utilize futures and swap contracts to manage our exposure to market changes in commodity prices, to protect our adjusted gross margin on our purchased crude oil and to manage our liquidity risk associated with margin deposit requirements on our overall derivative positions. As we purchase inventory from suppliers, we may establish a fixed or variable margin with future sales by:
| • | selling a like quantity of crude oil for future physical delivery to create an effective back-to-back transaction; or |
58
Table of Contents
| • | entering into futures and swaps contracts on the NYMEX or over-the-counter markets. |
SemStream
On November 1, 2011, SemStream contributed the primary operating assets of this business segment to NGL Energy in exchange for cash and equity interests. As part of this transaction, we agreed to waive our distribution rights on certain units until the third quarter of 2012. In exchange, we received additional common units. We own 32.2% of the common units outstanding at December 31, 2011, 7.5% of NGL Energy’s general partner and exercise significant influence through two general partner board seats. As a result, we account for our ownership as an investment using the equity method. Going forward, we will include our share of NGL Energy earnings on a one quarter lag because we will not receive their financial statements in sufficient time to apply the equity method currently. SemStream holds SemGroup’s ownership interest in NGL Energy, a company engaged in coast-to-coast retail propane operations as well as midstream terminal operations.
SemStream also, through its wholly-owned subsidiary, SemStream Arizona Propane, L.L.C. (“SemStream Arizona”), is engaged in retail sales and downstream distribution of propane in Page and Payson, Arizona, including a regulated underground utility business and a non-regulated propane bulk business.
SemLogistics
SemLogistics owns the largest independent petroleum products storage facility in the U.K. The facility is located on the north bank of the Milford Haven Waterway on the west coast of Wales. The main activities of SemLogistics are the receipt, storage and redelivery of clean petroleum and crude oil products via sea-going vessels at the Milford Haven site. SemLogistic’s revenue is based on fixed-fee storage tank leases and related services.
SemCAMS
SemCAMS operates majority-owned gathering assets and natural gas processing plants. We acquired the Canadian natural gas processing and gathering operations of Central Alberta Midstream, or CAMS, in March 2005. All of SemCAMS’ assets are located in West-Central Alberta, in the heart of the Western Canadian Sedimentary Basin, which accounts for approximately 80% of Canada’s sour natural gas production. SemCAMS’ revenue is based on fee-based throughput arrangements and profit sharing from plant operations.
SemMexico
SemMexico operates a network of liquid asphalt terminals in Mexico. Operations include purchasing, producing, storing and distributing liquid asphalt cement products. SemMexico purchases asphalt from local refineries in Mexico. SemMexico’s revenue is based on margin from contractual arrangements with customers and suppliers for liquid asphalt cement. In general, SemMexico’s sales and purchases of liquid asphalt cement are matched and SemMexico carries limited exposure to price movements.
SemGas
SemGas provides gathering, processing and storage services to the natural gas markets in the U.S. SemGas owns and operates gathering systems and processing plants in Kansas, Oklahoma and Texas. SemGas aggregates gas supplies from the wellhead and provides various services to producers that condition the wellhead gas production for downstream markets. SemGas’ performance is largely based on percent-of-proceeds and percent-of-index contractual arrangements where SemGas receives a portion of product sales as well as fee-based gathering service payments.
We previously had another business segment, SemCanada Crude, which aggregated and blended crude oil in Western Canada, North Dakota and Montana. During 2010, we transferred certain of SemCanada Crude’s activities to Crude and we began winding down the remaining operations of SemCanada Crude.
59
Table of Contents
Results of Operations
Overview
On July 22, 2008, SemGroup, L.P. and certain of its U.S. subsidiaries filed petitions for reorganization under Chapter 11 of the U.S. Bankruptcy Code (the “Petition Date”). Also on July 22, 2008, SemGroup, L.P.’s Canadian subsidiaries filed applications for creditor protection under the Companies’ Creditors Arrangement Act. Later during 2008, certain other U.S. subsidiaries filed petitions for reorganization. While under bankruptcy protection, SemGroup, L.P. sold or liquidated certain of its subsidiaries. All remaining subsidiaries emerged from the Bankruptcy on November 30, 2009 (the “Emergence Date”). We emerged as a newly reorganized company named SemGroup Corporation.
We lost control of several of our subsidiaries as a direct, or indirect, result of the Bankruptcy petitions, including all Canadian subsidiaries, SemGroup Holdings, L.P. (which directly held our limited partnership interests in Blueknight Energy Partners, L.P., formerly SemGroup Energy Partners, L.P., and indirectly held our general partnership interests in Blueknight), and Wyckoff Gas Storage Company, LLC (“Wyckoff”). These subsidiaries were de-consolidated during 2008 and subsequently accounted for as cost method investments, and not included in results of operations subsequent to deconsolidation. We regained control of SemCAMS and SemCanada Crude on the Emergence Date, and consolidated these subsidiaries again beginning on that date. We ceased operations of SemCanada Energy near the time of the bankruptcy filing in July 2008.
As part of the process of reorganizing to emerge from bankruptcy protection, we determined the need to dispose of certain operations. SemFuel, SemMaterials and SemEuro Supply met the criteria to be classified as discontinued operations.
We applied fresh-start reporting on November 30, 2009. We recorded individual assets and liabilities based on their fair values at November 30, 2009, using the assistance of a valuation advisor to determine the values of certain assets. We adjusted deferred tax liabilities, where appropriate, to reflect the change in the financial reporting basis of assets.
As a result of these factors (the Bankruptcy, deconsolidation and reconsolidation of certain subsidiaries, sale of subsidiary assets and fresh-start reporting) and other factors, comparison of the results of operations between 2009 and 2010 shown below is not useful as a guide to future results of operations. The financial performance for the first 11 months of 2009 are presented for historical perspective and do not give pro forma results as if the consummation of the plan of reorganization and the related fresh-start reporting and other adjustments had occurred at the beginning of the period presented. Additionally, our post-emergence financial statements are not comparable with our pre-emergence financial statements.
Recent Developments
On February 21, 2012, SemGroup, Gavilon Midstream Energy, LLC, a subsidiary of The Gavilon Group, LLC, and an affiliate of Chesapeake Energy Corporation (NYSE:CHK) announced plans to form a joint venture that will construct a 210-mile pipeline in western and north central Oklahoma which will deliver crude oil to a 1-million-barrel storage facility in Cushing, Oklahoma. The pipeline and storage facility will meet growing midstream requirements resulting from the burgeoning drilling activity in western Oklahoma and the Mississippi Lime play.
The pipeline will consist of two laterals, one originating near the town of Alva in Woods County, Oklahoma, and the other near the town of Arnett in Ellis County, Oklahoma. The laterals will intersect near Cleo Springs in Major County, Oklahoma, where the pipeline will increase in diameter and continue east to storage at Cushing. The pipeline will have an initial capacity of 140,000 barrels per day, and following the addition of more horsepower, a maximum operating capacity of 180,000 barrels per day. Construction of the pipeline is planned to begin in July 2012, and it is expected to be in service in the third quarter of 2013.
60
Table of Contents
Consolidated Results of Operations
| Successor | Predecessor | |||||||||||||||||
| (U.S. $ in thousands) |
Year Ended December 31, 2011 |
Year Ended December 31, 2010 |
One Month Ended December 31, 2009 |
Eleven Months Ended November 30, 2009 |
||||||||||||||
| Revenues: |
$ | 1,479,510 | $ | 1,630,334 | $ | 157,328 | $ | 901,235 | ||||||||||
| Expenses: |
||||||||||||||||||
| Costs of products sold |
1,154,175 | 1,265,932 | 140,036 | 744,173 | ||||||||||||||
| Operating |
157,013 | 153,440 | 16,765 | 47,307 | ||||||||||||||
| General and administrative |
77,015 | 87,237 | 8,012 | 44,248 | ||||||||||||||
| Depreciation and amortization |
51,189 | 70,882 | 8,791 | 38,974 | ||||||||||||||
| Loss on disposal or impairment |
9,497 | 105,050 | 23,119 | 13,625 | ||||||||||||||
|
|
|
|
|
|
|
|
|
|||||||||||
| Total expenses |
1,448,889 | 1,682,541 | 196,723 | 888,327 | ||||||||||||||
| Earnings from equity method investments |
15,004 | 1,949 | — | — | ||||||||||||||
|
|
|
|
|
|
|
|
|
|||||||||||
| Operating income (loss) |
45,625 | (50,258 | ) | (39,395 | ) | 12,908 | ||||||||||||
|
|
|
|
|
|
|
|
|
|||||||||||
| Other expense (income) |
||||||||||||||||||
| Interest expense |
60,208 | 86,133 | 7,169 | 12,041 | ||||||||||||||
| Other expense (income), net |
(14,989 | ) | 4,338 | (1,223 | ) | (8,692 | ) | |||||||||||
|
|
|
|
|
|
|
|
|
|||||||||||
| Total other expenses |
45,219 | 90,471 | 5,946 | 3,349 | ||||||||||||||
|
|
|
|
|
|
|
|
|
|||||||||||
| Income (loss) from continuing operations before reorganization items and income taxes |
406 | (140,729 | ) | (45,341 | ) | 9,559 | ||||||||||||
| Reorganization items gain |
— | — | — | 3,532,443 | ||||||||||||||
|
|
|
|
|
|
|
|
|
|||||||||||
| Income (loss) from continuing operations before income tax |
406 | (140,729 | ) | (45,341 | ) | 3,542,002 | ||||||||||||
| Income tax expense (benefit) |
(2,416 | ) | (6,223 | ) | (7,209 | ) | 6,310 | |||||||||||
|
|
|
|
|
|
|
|
|
|||||||||||
| Income (loss) from continuing operations |
2,822 | (134,506 | ) | (38,132 | ) | 3,535,692 | ||||||||||||
| Income (loss) from discontinued operations |
(10 | ) | 2,434 | 215 | (141,613 | ) | ||||||||||||
|
|
|
|
|
|
|
|
|
|||||||||||
| Net income (loss) |
$ | 2,812 | $ | (132,072 | ) | $ | (37,917 | ) | $ | 3,394,079 | ||||||||
|
|
|
|
|
|
|
|
|
|||||||||||
Revenue and expenses
Revenue and expenses are analyzed by operating segment below.
General and administrative expenses
For the eleven months ended November 30, 2009, corporate general and administrative expenses were allocated to the segments based on percentages established by SemGroup management. At the beginning of each year, management estimated corporate general and administrative costs and assigned the segments a flat monthly charge of that amount. From time to time, the monthly charges were reviewed and adjusted. In addition to the flat monthly charge, the segments would also be allocated a portion of the over or under allocation of actual corporate general and administrative expense from the prior month. This monthly “true up” was based on each segment’s year to date allocation as a percentage of the total year to date corporate general and administrative expense.
Beginning in December 2009, the general and administrative expenses of each corporate department has been allocated to the segments based on criteria such as actual usage, headcount and estimates of effort or benefit. The method for allocating cost is based on the type of service being provided. For example, internal audit costs are based on an estimate of effort attributable to a segment. In contrast, accounting department costs are allocated based on the number of transactions processed for a given segment compared to the total number processed.
61
Table of Contents
During bankruptcy, certain costs related to the reorganization and governance of the Company were classified as reorganization items; however, after emergence such costs were classified as general and administrative.
Interest expense
Interest expense decreased in 2011 to $60 million from $86 million in 2010. About $12 million of this decrease is attributable to the refinancing of a credit facility in June of 2011 and the repayment of two term loans in the fourth quarter of 2011. An additional $11 million of the decrease is attributable to the repayment of a term loan in September 2010. Finally, $2 million of the decrease relates to the refinancing of a credit facility in December 2010.
During the time we were in bankruptcy, we recorded interest expense only to the extent such interest was expected to be paid. Interest obligations that were expected to be compromised in the reorganization process were not recorded as expenses. The total amount of interest that we would have been contractually obligated to pay, but which was compromised in the reorganization process and not recorded as an expense, was $221 million for the period January 1, 2009 through November 30, 2009.
Other expense (income)
The net of other expense (income) changed in 2011 to income of $15 million from expense of $4 million in 2010. This is primarily the result of changes in foreign exchange rates ($6 million), a decline in the fair value of outstanding warrants ($5 million), insurance recoveries ($2 million) and the absence of a 2010 expense item ($5 million) in 2011.
Reorganization gain
Reorganization gain includes revenue, expenses, realized gains and losses and provisions for losses resulting from the reorganization and restructuring of the business. The reorganization gain of $3,532 million in the eleven months ended November 30, 2009 is primarily composed of $2,544 million gain on extinguishment of debt, $614 million gain on the disposal of Blueknight and $353 million gain on asset revaluation in fresh-start reporting.
Discontinued operations
SemMaterials, SemFuel and SemEuro Supply are presented as discontinued operations. During 2008, we decided to sell the assets of SemMaterials and to cease the operations of SemEuro Supply, due to their losses from operations and working capital requirements. During 2009, we decided to sell the assets of SemFuel due to its working capital requirements. By December 31, 2009, the majority of the assets of SemMaterials and SemFuel had been sold.
62
Table of Contents
Results of Operations by Reporting Segment
Crude
| Successor | Predecessor | |||||||||||||||||
| (U.S. $ in thousands) |
Year Ended December 31, 2011 |
Year Ended December 31, 2010 |
One Month Ended December 31, 2009 |
Eleven Months Ended November 30, 2009 |
||||||||||||||
| Revenues: |
$ | 431,321 | $ | 245,854 | $ | 14,015 | $ | 256,931 | ||||||||||
| Expenses: |
||||||||||||||||||
| Costs of products sold |
366,265 | 149,383 | 6,317 | 178,705 | ||||||||||||||
| Operating |
17,470 | 25,498 | 907 | 17,716 | ||||||||||||||
| General and administrative |
9,757 | 10,525 | 2,012 | 7,436 | ||||||||||||||
| Depreciation and amortization |
11,379 | 27,643 | 4,937 | 10,878 | ||||||||||||||
| Loss on disposal or impairment |
64 | 6,895 | — | — | ||||||||||||||
|
|
|
|
|
|
|
|
|
|||||||||||
| Total expenses |
404,935 | 219,944 | 14,173 | 214,735 | ||||||||||||||
| Earnings from equity method investment |
15,004 | 1,949 | — | — | ||||||||||||||
|
|
|
|
|
|
|
|
|
|||||||||||
| Operating income (loss) |
$ | 41,390 | $ | 27,859 | $ | (158 | ) | $ | 42,196 | |||||||||
|
|
|
|
|
|
|
|
|
|||||||||||
2011 versus 2010
Revenue
| Successor | ||||||||
| Year Ended December 31, 2011 |
Year Ended December 31, 2010 |
|||||||
| ($ in thousands) | ||||||||
| Product revenue |
$ | 1,084,262 | $ | 559,639 | ||||
| ASC 845-10-15 |
(688,575 | ) | (397,447 | ) | ||||
| Net realized loss on derivatives |
(1,174 | ) | (1,166 | ) | ||||
|
|
|
|
|
|||||
| Net product revenue |
$ | 394,513 | $ | 161,026 | ||||
| Service revenue |
35,801 | 84,297 | ||||||
| Other |
220 | 1,294 | ||||||
| Net unrealized gain (loss) on derivatives |
787 | (763 | ) | |||||
|
|
|
|
|
|||||
| Total revenue |
$ | 431,321 | $ | 245,854 | ||||
|
|
|
|
|
|||||
Product revenue increased in 2011 to $1,084 million from $560 million in 2010. The increase was primarily due to an increase in the volume sold to 11.6 million barrels at an average sales price of $94 per barrel in 2011 from 7.0 million barrels at an average sales price of $79 per barrel in 2010.
The increase in sales volume was primarily the result of an increase in buy/sell transactions (as defined above) to 6.8 million barrels in 2011 compared to 1.4 million barrels in 2010. The buy/sell transactions are used to achieve a transportation margin. The increase in buy/sell activity was offset, in part, by a decrease of 1.0 million barrels of marketing activity.
Revenue was reduced by $689 million in 2011 and $397 million in 2010, in accordance with ASC 845-10-15.
Service revenue decreased to $36 million in 2011 from $84 million in 2010. Of this decrease $36 million relates to the fact that White Cliffs Pipeline was consolidated until the end of September 2010, but has been
63
Table of Contents
accounted for under the equity method since then. (See Note 5 to our consolidated financial statements in this Form 10-K for additional information related to White Cliffs Pipeline.) In addition, transportation revenue decreased $6.5 million in 2011 compared to 2010. This decrease reflects increased use of buy/sell transactions (as described above) to achieve transportation margin and the completion of a take-or-pay contract. Also, storage revenue decreased $5.1 million in 2011 from 2010 as a result of a decrease in storage rates to levels which are expected to continue until 2015.
Costs of products sold
Costs of products sold increased in 2011 to $366 million from $149 million in 2010. Costs of products sold were reduced by $689 million and $397 million in 2011 and 2010, respectively, in accordance with ASC 845-10-15. Costs of products sold increased in 2011 as a result of an increase in the average cost of crude oil per barrel to $91 from $77 in 2010 and an increase in the volume sold to 11.6 million barrels in 2011 from 7.0 million barrels in 2010.
Adjusted gross margin
Adjusted gross margin in this segment is generated by providing fee-based services, by entering into fixed-margin transactions and through marketing activities. Revenues from fee-based services are included in service revenue, and revenues from fixed-margin and marketing activities are included in product revenue.
The following table shows the adjusted gross margin generated by this segment’s fee-based services, fixed-margin transactions and marketing activities for the year ended December 31, 2011:
| Storage | Transportation | Marketing Activities |
Other | Total | ||||||||||||||||
| Revenues |
$ | 24,381 | $ | 14,833 | $ | 386,252 | $ | 5,855 | $ | 431,321 | ||||||||||
| Less: Costs of products sold, exclusive of depreciation |
— | — | (366,265 | ) | — | (366,265 | ) | |||||||||||||
| Less: Unrealized (gain) loss on derivatives |
— | — | (787 | ) | — | (787 | ) | |||||||||||||
|
|
|
|
|
|
|
|
|
|
|
|||||||||||
| Adjusted gross margin |
$ | 24,381 | $ | 14,833 | $ | 19,200 | $ | 5,855 | $ | 64,269 | ||||||||||
|
|
|
|
|
|
|
|
|
|
|
|||||||||||
The following table shows the adjusted gross margin generated by this segment’s fee-based services, fixed-margin transactions and marketing activities for the year ended December 31, 2010:
| Storage | Transportation | Marketing Activities |
Other | Total | ||||||||||||||||
| Revenues |
$ | 29,496 | $ | 56,221 | $ | 154,927 | $ | 5,210 | $ | 245,854 | ||||||||||
| Less: Costs of products sold, exclusive of depreciation |
— | — | (149,383 | ) | — | (149,383 | ) | |||||||||||||
| Less: Unrealized (gain) loss on derivatives |
— | — | 763 | — | 763 | |||||||||||||||
|
|
|
|
|
|
|
|
|
|
|
|||||||||||
| Adjusted gross margin |
$ | 29,496 | $ | 56,221 | $ | 6,307 | $ | 5,210 | $ | 97,234 | ||||||||||
|
|
|
|
|
|
|
|
|
|
|
|||||||||||
64
Table of Contents
The following table presents a reconciliation of operating income (loss) to adjusted gross margin, the most directly comparable GAAP financial measure for each of the periods indicated.
| Successor | ||||||||
| Year Ended December 31, | ||||||||
| 2011 | 2010 | |||||||
| ($ in thousands) | ||||||||
| Reconciliation of operating income (loss) to adjusted gross margin: |
||||||||
| Operating income (loss) |
$ | 41,390 | $ | 27,859 | ||||
| Add: |
||||||||
| Unrealized (gain) loss on derivatives |
(787 | ) | 763 | |||||
| Operating expense |
17,470 | 25,498 | ||||||
| General and administrative expense |
9,757 | 10,525 | ||||||
| Depreciation and amortization expense |
11,379 | 27,643 | ||||||
| Loss on disposal or impairment |
64 | 6,895 | ||||||
| Less: |
||||||||
| Earnings from equity method investment |
15,004 | 1,949 | ||||||
|
|
|
|
|
|||||
| Adjusted gross margin |
$ | 64,269 | $ | 97,234 | ||||
|
|
|
|
|
|||||
Operating expense
Operating expense decreased in 2011 to $17 million from $25 million in 2010. Of this decrease, $6.3 million related to operating expenses of White Cliffs Pipeline, which was a consolidated subsidiary until September 2010 after which it was accounted for under the equity method. An additional $6.0 million of the decrease is attributable to a $3.3 million 2010 bad debt expense of which $2.7 million was recovered in 2011.
Depreciation and amortization
Depreciation and amortization expenses decreased in 2011 to $11 million from $28 million in 2010. This decrease relates to expenses of White Cliffs Pipeline which was a consolidated subsidiary until September 2010 after which it was accounted for under the equity method.
Loss on disposal or impairment
We sold a portion of our ownership interests in White Cliffs during September 2010 and received $141 million of proceeds from these transactions. Upon closing, we deconsolidated White Cliffs and recorded our investment at fair value, which approximated 51% of the net book value of White Cliffs (the book value of White Cliffs had been adjusted to fair value on November 30, 2009, in connection with fresh-start reporting). We recorded a loss of $6.8 million upon conversion to the equity method.
Earnings from equity method investment
Crude’s only equity method investment is in White Cliffs. Prior to the end of September 2010, we consolidated White Cliffs; after September 2010, we account for our investment in White Cliffs under the equity method.
2010 versus Eleven Months ended November 30, 2009
Revenue
Revenue decreased in 2010 to $246 million from $257 million in the eleven months ended November 30, 2009.
65
Table of Contents
| Successor | Predecessor | |||||||||
| Year Ended December 31, 2010 |
Eleven Months Ended November 30, 2009 |
|||||||||
| ($ in thousands) | ||||||||||
| Product revenue |
$ | 559,639 | $ | 383,626 | ||||||
| ASC 845-10-15 |
(397,447 | ) | (186,816 | ) | ||||||
| Net realized gain (loss) on derivatives |
(1,166 | ) | 139 | |||||||
|
|
|
|
|
|||||||
| Net product revenue |
$ | 161,026 | $ | 196,949 | ||||||
| Service revenue |
84,297 | 60,000 | ||||||||
| Other |
1,294 | (272 | ) | |||||||
| Net unrealized gain (loss) on derivatives |
(763 | ) | 254 | |||||||
|
|
|
|
|
|||||||
| Total revenue |
$ | 245,854 | $ | 256,931 | ||||||
|
|
|
|
|
|||||||
Product revenue increased in 2010 to $560 million from $384 million as a result of an increase in sales volume to 7.1 million barrels from 6.7 million barrels and an increase in the average sales price to $79 per barrel from $54 per barrel.
Revenue was reduced by $397 million and $187 million in 2010 and the eleven months ended November 30, 2009, respectively, in accordance with ASC 845-10-15.
Costs of products sold
Costs of products sold decreased in 2010 to $149 million from $179 million in the eleven months ended November 30, 2009. Costs of products sold were reduced by $397 million and $187 million in 2010 and the eleven months ended November 30, 2009, respectively, in accordance with ASC 845-10-15. Except for this reduction, costs of products sold increased in 2010 primarily as a result of an increase in the average cost of crude oil per barrel to $77 from $52 per barrel in 2009.
Operating expense
Operating expense increased in 2010 to $25 million from $18 million in the eleven months ended November 30, 2009. The increase is due primarily to $4 million in expenses related to White Cliffs Pipeline, which became operational in June 2009, and bad debt expense of $3 million related to a customer that declared bankruptcy.
General and administrative expense
General and administrative expense increased in 2010 to $11 million from $7 million in the eleven months ended November 30, 2009. Approximately $3 million of this increase is due to an allocation of corporate overhead to White Cliffs Pipeline, which was not made in the first half of 2009. The remainder of the increase is due primarily to incentive compensation and restricted stock expense.
Depreciation and amortization
Depreciation and amortization expense increased in 2010 to $28 million from $11 million in the eleven months ended November 30, 2009. This increase is due primarily to higher depreciation as a result of higher fixed asset values which were recorded as part of fresh-start reporting. In addition, the increase also includes the amortization of intangible assets which were recorded as part of fresh-start reporting.
Loss on disposal or impairment
We sold a portion of our ownership interests in White Cliffs during September 2010. We received $141 million of proceeds from these transactions, which were used to retire the SemCrude Pipeline credit facility and
66
Table of Contents
to make payments on our revolving credit facility and term loan. Upon closing, we deconsolidated White Cliffs and recorded our investment at fair value, which approximated 51% of the net book value of White Cliffs (the book value of White Cliffs had been adjusted to fair value on November 30, 2009, in connection with fresh-start reporting).
We recorded our investment in White Cliffs at fair value at the date of deconsolidation. We recorded a loss of $6.8 million upon conversion to the equity method, which is included within loss on disposal or impairment of long-lived assets.
Equity earnings
At the end of September 2010, we sold a portion of our ownership interests in White Cliffs to two unaffiliated parties. Upon closing of this sale, the other owners received substantive rights to participate in the management of White Cliffs. Because of this, we deconsolidated White Cliffs at the end of September 2010, and began accounting for it under the equity method. The equity in earnings of White Cliffs for the three months ended December 31, 2010 was $1.9 million.
December 2009 versus average of Eleven Months ended November 30, 2009
General
The Company desires to provide a meaningful comparison of the Results of Operations of the Successor (December 2009) to that of the Predecessor (eleven months ended November 30, 2009). In order to make this comparison as useful as possible, we have based the comparison on the average of the eleven months ended November 30, 2009. In this way, any significant changes from the average can be identified and become the subject of explanation.
Revenue
Revenue in December 2009 is approximately 40 percent less than the average of the eleven months ended November 30, 2009, primarily because certain marketing activity that occurred in the first ten months of 2009 did not occur in December. The marketing activity stopped in October 2009 because of the Company’s assessment of the spread between current prices and forward prices for crude oil.
Costs of products sold
Costs of products sold in December 2009 is approximately 60 percent less than the average of the eleven months ended November 30, 2009, because certain marketing activity that occurred in the first ten months of 2009 did not occur in December. This percentage decline is higher than what is shown in the Revenue explanation above because the marketing activity has a significant costs of products sold component in contrast to transportation or storage revenue, which do not.
Operating expense
Operating expense in December 2009 is approximately 44 percent lower than the average of the eleven months ended November 30, 2009, primarily because of an adjustment to property tax expense recorded in December.
General and administrative expense
General and administrative expense in December 2009 is approximately three times the average of the eleven months ended November 30, 2009. During bankruptcy, certain costs related to the reorganization and governance of the Company were classified as reorganization items; however, after emergence such costs were classified as general and administrative expenses.
67
Table of Contents
Depreciation and amortization
Depreciation and amortization in December 2009 is approximately five times the average of the eleven months ended November 30, 2009. This increase is due primarily to the amortization of intangible assets recorded as part of fresh-start reporting. In addition, the increase reflects higher depreciation as a result of higher fixed asset values which also were recorded as part of fresh-start reporting
SemStream
On November 1, 2011, we contributed the primary operating assets of our SemStream segment to NGL Energy. The assets we contributed included the majority of SemStream’s inventory, derivative assets, other current assets, property, plant, and equipment, goodwill, other intangible assets, and other noncurrent assets. As part of this transaction, NGL Energy assumed certain liabilities of the SemStream segment including its derivative liabilities. We did not contribute any of the assets or liabilities of SemStream’s Arizona residential business to NGL Energy.
In return for this contribution, we received the following:
| • | 8.9 million common units of NGL Energy (32.2% of the common units outstanding at December 31, 2011); |
| • | a 7.5% interest in NGL Energy Holdings LLC, the general partner of NGL Energy; |
| • | a cash payment of $93 million subject to post-closing adjustments; and |
| • | two seats on the board of directors of NGL Energy Holdings LLC |
Also, as part of this transaction, we agreed to waive our distribution rights on approximately 3.9 million units until the third quarter of 2012. In exchange, we received an additional 204,000 common units. We estimate that the fair value of the ownership interests in NGL Energy that we received in this transaction was approximately $184 million at November 1, 2011. The cash proceeds we received were subject to post-closing adjustments. Those adjustments have been completed and we have recorded a gain on this transaction of $44.3 million.
Results of operations for 2011 include no earnings from our equity method investment in NGL Energy. Going forward, we will include our share of NGL Energy’s earnings on a one quarter lag because we will not receive their financial statements in sufficient time to apply the equity method to the current period. As a result of this transaction, analysis of the 2011 operating results compared to 2010 is of no value in assessing the future prospects of this business unit.
| Successor | Predecessor | |||||||||||||||||
| (U.S. $ in thousands) |
Year Ended December 31, 2011 |
Year Ended December 31, 2010 |
One Month Ended December 31, 2009 |
Eleven Months Ended November 30, 2009 |
||||||||||||||
| Revenues: |
$ | 622,598 | $ | 718,296 | $ | 64,023 | $ | 428,859 | ||||||||||
| Expenses: |
||||||||||||||||||
| Costs of products sold |
605,170 | 690,970 | 75,593 | 425,470 | ||||||||||||||
| Operating |
8,420 | 9,074 | 1,642 | 9,006 | ||||||||||||||
| General and administrative |
8,904 | 9,511 | 1,435 | 5,410 | ||||||||||||||
| Depreciation and amortization |
4,867 | 6,764 | 509 | 4,813 | ||||||||||||||
| Loss (gain) on disposal or impairment |
(36,625 | ) | (35 | ) | — | — | ||||||||||||
|
|
|
|
|
|
|
|
|
|||||||||||
| Total expenses |
590,736 | 716,284 | 79,179 | 444,699 | ||||||||||||||
|
|
|
|
|
|
|
|
|
|||||||||||
| Operating income (loss) |
$ | 31,862 | $ | 2,012 | $ | (15,156 | ) | $ | (15,840 | ) | ||||||||
|
|
|
|
|
|
|
|
|
|||||||||||
68
Table of Contents
2011 versus 2010
Revenue
| Successor | ||||||||
| Year Ended December 31, 2011 |
Year Ended December 31, 2010 |
|||||||
| ($ in thousands) | ||||||||
| Product revenue |
$ | 746,508 | $ | 844,466 | ||||
| ASC 845-10-15 |
(128,469 | ) | (118,927 | ) | ||||
| Net realized loss on derivatives |
(10,725 | ) | (24,407 | ) | ||||
|
|
|
|
|
|||||
| Net product revenue |
$ | 607,314 | $ | 701,132 | ||||
| Service revenue |
1,717 | 2,109 | ||||||
| Other |
320 | 863 | ||||||
| Net unrealized gain on derivatives |
13,247 | 14,192 | ||||||
|
|
|
|
|
|||||
| Total revenue |
$ | 622,598 | $ | 718,296 | ||||
|
|
|
|
|
|||||
Product revenue decreased in 2011 to $747 million from $844 million in 2010. The effect of lower volume (506 million gallons versus 656 million gallons) was only partially offset by higher prices ($1.48 per gallon versus $1.29 per gallon). The decrease in volume reflects the timing of the NGL Energy transaction described above, which reduced the length of the period in which certain sales were made by two months compared to the prior year.
Revenue was reduced by $128 million and $119 million during 2011 and 2010, respectively, in accordance with ASC 845-10-15.
We recorded $11 million in realized losses on derivatives in 2011 compared to $24 million of such losses in 2010. There was less derivative activity during 2011 in anticipation of the NGL Energy transaction described above.
Costs of products sold
Costs of products sold decreased in 2011 to $605 million from $691 million in 2010. The decrease is primarily a result of a decline in volume between the periods. The decrease in volume is a result of the NGL transaction described above. Costs of products sold were reduced by $128 million and $119 million in 2011 and 2010, respectively, in accordance with ASC 845-10-15.
Gain on disposal or impairment
The gain on disposal or impairment of $36 million recorded in 2011 is the net of $44.3 million gain on the disposal of SemStream assets in the NGL Energy transaction, offset, in part, by a $9 million impairment of goodwill and other intangible assets of SemStream’s Arizona residential propane business. (The Arizona residential propane business was not contributed to NGL Energy.)
Equity earnings
As mentioned above, we record our equity in earnings or losses of NGL Energy on a one-quarter lag. Because of this, we have not recorded any equity in earnings or losses of NGL Energy during 2011 (our ownership interests in NGL Energy were acquired on November 1, 2011).
69
Table of Contents
2010 versus Eleven Months ended November 30, 2009
Revenue
Revenue increased in 2010 to $718 million from $429 million in the eleven months ended November 30, 2009.
| Successor | Predecessor | |||||||||
| Year Ended December 31, 2010 |
Eleven Months Ended November 30, 2009 |
|||||||||
| ($ in thousands) | ||||||||||
| Product revenue |
$ | 844,466 | $ | 468,774 | ||||||
| ASC 845-10-15 |
(118,927 | ) | (10,219 | ) | ||||||
| Net realized gain (loss) on derivatives |
(24,407 | ) | (8,148 | ) | ||||||
|
|
|
|
|
|||||||
| Net product revenue |
$ | 701,132 | $ | 450,407 | ||||||
| Service revenue |
2,109 | 2,236 | ||||||||
| Other |
863 | 588 | ||||||||
| Net unrealized gain (loss) on derivatives |
14,192 | (24,372 | ) | |||||||
|
|
|
|
|
|||||||
| Total revenue |
$ | 718,296 | $ | 428,859 | ||||||
|
|
|
|
|
|||||||
Product revenue increased in 2010 to $844 million from $469 million. Approximately 53 percent of the increase is due to volume and approximately 47 percent of the increase is due to higher sales prices.
Revenue was reduced by $119 million and $10 million in 2010 and the eleven months ended November 30, 2009, respectively, in accordance with ASC 845-10-15.
Costs of products sold
Costs of products sold increased in 2010 to $691 million from $425 million in the eleven months ended November 30, 2009. Costs of products sold were reduced by $119 million and $10 million in 2010 and the eleven months ended November 30, 2009, respectively, in accordance with ASC 845-10-15. The increase in the costs of products sold is primarily a result of increased volume and higher product prices.
General and administrative expense
General and administrative expense increased in 2010 to $10 million from $5 million in the eleven months ended November 30, 2009. This increase is primarily the result of an increase in corporate overhead allocated to this reporting segment. The amount of corporate overhead allocated to this reporting segment increased because during bankruptcy certain costs related to the reorganization and governance of the Company were classified as reorganization items; however, after emergence such costs were classified as general and administrative expense. In addition, a portion of the increase is due to incentive compensation and restricted stock expense.
Depreciation and amortization
Depreciation and amortization increased in 2010 to $7 million from $5 million in the eleven months ended November 30, 2009. This increase is due primarily to the amortization of intangible assets recorded as part of fresh-start reporting.
December 2009 versus average of Eleven Months ended November 30, 2009
Revenue
Revenue in December 2009 is approximately 64 percent higher than the average of the eleven months ended November 30, 2009. Propane is the principal product sold. Propane sales are seasonal with most sales occurring
70
Table of Contents
in the winter heating season. In addition, the sales price of propane in December 2009 was approximately $1.20 per gallon which was the high for the year.
Costs of products sold
Costs of products sold in December 2009 was approximately 95 percent higher than the average of the eleven months ended November 30, 2009. As a result of fresh-start reporting, inventory was revalued from historical weighted average cost to current market value on November 30, 2009. This revaluation increased the costs of products sold in December by approximately $9 million over what would have otherwise been the case.
Operating expense
Operating expense in December 2009 is approximately double the average of the eleven months ended November 30, 2009. The increase is due primarily to bad debt expense recorded in December.
General and administrative expense
General and administrative expense in December 2009 is approximately three times the average of the eleven months ended November 30, 2009. During bankruptcy, certain costs related to the reorganization and governance of the Company were classified as reorganization items; however, after emergence such costs were classified as general and administrative expenses.
SemLogistics
| Successor | Predecessor | |||||||||||||||||
| (U.S. $ in thousands) |
Year Ended December 31, 2011 |
Year Ended December 31, 2010 |
One Month Ended December 31, 2009 |
Eleven Months Ended November 30, 2009 |
||||||||||||||
| Revenues: |
$ | 23,314 | $ | 38,371 | $ | 3,297 | $ | 33,393 | ||||||||||
| Expenses: |
||||||||||||||||||
| Costs of products sold |
152 | — | 11 | 565 | ||||||||||||||
| Operating |
6,206 | 8,406 | 657 | 7,186 | ||||||||||||||
| General and administrative |
6,712 | 5,286 | 575 | 4,353 | ||||||||||||||
| Depreciation and amortization |
9,271 | 7,881 | 655 | 8,615 | ||||||||||||||
| Loss (gain) on disposal or impairment |
44,663 | — | — | — | ||||||||||||||
|
|
|
|
|
|
|
|
|
|||||||||||
| Total expenses |
67,004 | 21,573 | 1,898 | 20,719 | ||||||||||||||
|
|
|
|
|
|
|
|
|
|||||||||||
| Operating income (loss) |
$ | (43,690 | ) | $ | 16,798 | $ | 1,399 | $ | 12,674 | |||||||||
|
|
|
|
|
|
|
|
|
|||||||||||
2011 versus 2010
Revenue
Revenue decreased in 2011 to $23 million from $38 million in 2010. The decline in revenue is a result of a decline in the volume of storage leased. High crude oil prices and backwardated market conditions (i.e., prices for future deliveries are lower than current prices) and are forecast to continue into 2012. These factors have a negative effect on storage economics. As a result, the demand for storage is depressed and we have experienced difficulty securing contract renewals. We are uncertain when market conditions will improve.
Operating expense
Operating expense decreased in 2011 to $6 million from $8 million in 2010. This decline is due primarily to a reduction in employee related expenses such as the elimination of the short-term incentive program.
71
Table of Contents
Loss on disposal or impairment
During the fourth quarter of each year, we perform a goodwill impairment test for each of our segments that has goodwill. SemLogistics passed the 2011 test initially, however, a review of the sensitivity of the test results indicated that a ten percent reduction in the estimated revenue in 2012 and 2013 would result in a test failure. The sensitivity of the test results to loss of revenue, led us to conclude that impairment of the goodwill of SemLogistics was required. Accordingly, we impaired the full amount of goodwill which was $44.7 million on October 1, 2011.
General and administrative expense
General and administrative expense increased in 2011 to $7 million from $5 million in 2010. This increase is due to an increase in employee related expenses such as costs related to deferred capital projects and severance costs.
2010 versus Eleven Months ended November 30, 2009
Revenue
Revenue increased in 2010 to $38 million from $33 million in the eleven months ended November 30, 2009. All available storage capacity was leased throughout 2010. This increase is due primarily to a larger volume of products in storage in 2010 compared to 2009. In addition, storage fees and terminalling revenues were higher in 2010 compared to 2009.
General
In every category of expense, the amounts for the year 2010 are roughly equivalent to those of the eleven months ended November 30, 2009.
December 2009 versus average of Eleven Months ended November 20, 2009
General
In each case, the December 2009 amount is roughly equivalent to the average of the eleven months ended November 30, 2009.
SemCAMS
| Successor | Predecessor | |||||||||||||||||
| (U.S. $ in thousands) |
Year Ended December 31, 2011 |
Year Ended December 31, 2010 |
One Month Ended December 31, 2009 |
Eleven Months Ended November 30, 2009 |
||||||||||||||
| Revenues: |
$ | 163,367 | $ | 144,754 | $ | 12,930 | $ | — | ||||||||||
| Expenses: |
||||||||||||||||||
| Costs of products sold |
218 | 67 | — | — | ||||||||||||||
| Operating |
110,814 | 95,072 | 11,345 | — | ||||||||||||||
| General and administrative |
16,816 | 18,942 | 1,726 | — | ||||||||||||||
| Depreciation and amortization |
10,233 | 9,556 | 962 | — | ||||||||||||||
| Loss (gain) on disposal or impairment |
(8 | ) | (14 | ) | 23,119 | — | ||||||||||||
|
|
|
|
|
|
|
|
|
|||||||||||
| Total expenses |
138,073 | 123,623 | 37,152 | — | ||||||||||||||
|
|
|
|
|
|
|
|
|
|||||||||||
| Operating income (loss) |
$ | 25,294 | $ | 21,131 | $ | (24,222 | ) | $ | — | |||||||||
|
|
|
|
|
|
|
|
|
|||||||||||
72
Table of Contents
2011 versus 2010
Revenue
Revenue increased in 2011 to $163 million from $145 million in 2010. This increase results from increased costs passed through ($10 million), settlement of two disputes ($8 million), foreign exchange gain ($7 million) and higher capital fees ($3 million), offset, in part, by plant outages ($4 million) and gas volume withheld by two producers ($4 million).
Operating expense
Operating expense increased in 2011 to $111 million from $95 million in 2010. This increase results from higher power costs ($7 million), higher outside services and materials ($6 million), plant outage repairs ($6 million), foreign exchange loss ($4 million), turnaround planning and general maintenance ($3 million) and severance costs ($2 million), offset in part by recovery of previously written off receivables ($4 million), reductions in accruals ($3 million), reduced salary expense due to staff reductions ($3 million) and settlements of various disputes ($2 million).
General and administrative expense
General and administrative expense decreased in 2011 to $17 million from $19 million in 2010. This decrease results primarily from reduced employee costs ($5 million) offset in part by severance costs ($2 million).
2010 versus Eleven Months ended November 30, 2009
General
On July 22, 2008, the Company filed petitions for reorganization under Chapter 11 of the U.S. Bankruptcy Code. Also on July 22, 2008, the Company’s Canadian subsidiaries filed applications for creditor protection in Canada under the Companies’ Creditors Arrangement Act. As a result of the Bankruptcy petitions, the Company lost control of this subsidiary and it was deconsolidated on that date. The Company regained control of this subsidiary upon emergence from the Bankruptcy on November 30, 2009, and consolidated this subsidiary again beginning on that date.
As a result of the deconsolidation between July 22, 2008, and the reconsolidation on November 30, 2009, it is not possible to make any meaningful comparisons of results of operations for 2010 and 2009.
December 2009
Loss on disposal or impairment
During December 2009, SemCAMS committed to a plan to cease processing sour gas at one of its facilities based on a decision by a customer to send its sour gas to a different SemCAMS processing facility. As a result, SemCAMS recorded a reduction of $18.4 million to the value of property, plant and equipment and a $4.7 million increase to the related asset retirement obligation.
73
Table of Contents
SemMexico
| Successor | Predecessor | |||||||||||||||||
| (U.S. $ in thousands) |
Year Ended December 31, 2011 |
Year Ended December 31, 2010 |
One Month Ended December 31, 2009 |
Eleven Months Ended November 30, 2009 |
||||||||||||||
| Revenues: |
$ | 218,187 | $ | 149,557 | $ | 12,079 | $ | 167,063 | ||||||||||
| Expenses: |
||||||||||||||||||
| Costs of products sold |
192,068 | 129,449 | 10,242 | 144,142 | ||||||||||||||
| Operating |
5,006 | 4,742 | 1,142 | 3,983 | ||||||||||||||
| General and administrative |
11,560 | 10,352 | 1,310 | 7,129 | ||||||||||||||
| Depreciation and amortization |
6,502 | 6,183 | 304 | 2,942 | ||||||||||||||
| Loss (gain) on disposal or impairment |
(200 | ) | 8,837 | — | — | |||||||||||||
|
|
|
|
|
|
|
|
|
|||||||||||
| Total expenses |
214,936 | 159,563 | 12,998 | 158,196 | ||||||||||||||
|
|
|
|
|
|
|
|
|
|||||||||||
| Operating income (loss) |
$ | 3,251 | $ | (10,006 | ) | $ | (919 | ) | $ | 8,867 | ||||||||
|
|
|
|
|
|
|
|
|
|||||||||||
2011 versus 2010
Revenue
Revenue increased in 2011 to $218 million from $150 million in 2010. Higher volume (378 thousand tons versus 295 thousand tons) accounts for 61 percent of this increase and higher sales prices ($570/ton versus $500/ton) accounts for the remaining 39 percent of the increase. These increases reflect both successful marketing efforts, in general, and a slight increase in sales volume of higher priced polymer modified asphalt and emulsions.
Costs of products sold
Costs of products sold increased in 2011 to $192 million from $129 million in 2010. On a per ton basis, 2011 was $507 compared to $438 in 2010. The increase in cost per ton is essentially the same as the increase in revenue per ton described above.
2010 versus Eleven Months ended November 30, 2009
Revenue
Revenue decreased in 2010 to $150 million from $167 million in the eleven months ended November 30, 2009. Lower volume reduced revenue by $38 million and was partially offset by higher prices, which increased revenue by $21 million. The decline in volume reflects weak demand as a result of a slowdown in the issuance of government contracts for road construction projects in Mexico.
Costs of products sold
Costs of products sold decreased in 2010 to $129 million from $144 million in the eleven months ended November 30, 2009. The decrease in the costs of products sold reflects a decline in volume offset, in part, by higher prices.
General and administrative
General and administrative expense increased in 2010 to $10 million from $7 million in the eleven months ended November 30, 2009. This increase is due primarily to an allocation of corporate overhead. Prior to emergence from bankruptcy, no corporate overhead was allocated to this business segment. Upon emergence, the decision was made to include SemMexico as a recipient of the allocation of corporate overhead.
74
Table of Contents
Depreciation and amortization
Depreciation and amortization increased in 2010 to $6 million from $3 million in the eleven months ended November 30, 2009. This increase is primarily due to intangible asset values which were written up as a result of fresh-start reporting.
Loss on disposal or impairment
During the 2010 annual test of goodwill for impairment, it was determined that goodwill for this reporting segment was impaired by approximately $9 million. This impairment is due primarily to a slowdown in road construction projects in Mexico.
December 2009 versus average of Eleven Months ended November 30, 2009
Revenue
Revenue in December 2009 is approximately 20 percent lower than the average of the eleven months ended November 30, 2009. The primary reason for the decline in volume is that December is usually a low volume month due to the holiday season. In addition, prices were down approximately 4 percent compared to the eleven month average primarily as a result of product mix.
Costs of products sold
Costs of products sold in December 2009 was approximately 22 percent lower than the average of the eleven months ended November 30, 2009. This decline is primarily related to volume as explained above.
Operating expense
Operating expense in December 2009 is approximately three times the average of the eleven months ended November 30, 2009. The increase is due primarily to bad debt expense recorded in December.
General and administrative expense
General and administrative expense in December 2009 is approximately twice the average of the eleven months ended November 30, 2009. This increase is due primarily to an allocation of corporate overhead. Prior to emergence from bankruptcy, no corporate overhead was allocated to this business segment. Upon emergence, the decision was made to include SemMexico as a recipient of the allocation of corporate overhead.
SemGas
| Successor | Predecessor | |||||||||||||||||
| (U.S. $ in thousands) |
Year Ended December 31, 2011 |
Year Ended December 31, 2010 |
One Month Ended December 31, 2009 |
Eleven Months Ended November 30, 2009 |
||||||||||||||
| Revenues: |
$ | 105,248 | $ | 75,790 | $ | 6,644 | $ | 55,230 | ||||||||||
| Expenses: |
||||||||||||||||||
| Costs of products sold |
75,066 | 50,800 | 4,495 | 37,700 | ||||||||||||||
| Operating |
9,027 | 6,342 | 921 | 9,002 | ||||||||||||||
| General and administrative |
6,521 | 6,626 | 975 | 4,371 | ||||||||||||||
| Depreciation and amortization |
5,986 | 5,480 | 427 | 8,296 | ||||||||||||||
| Loss on disposal or impairment |
4 | 12 | — | 13,625 | ||||||||||||||
|
|
|
|
|
|
|
|
|
|||||||||||
| Total expenses |
96,604 | 69,260 | 6,818 | 72,994 | ||||||||||||||
|
|
|
|
|
|
|
|
|
|||||||||||
| Operating income (loss) |
$ | 8,644 | $ | 6,530 | $ | (174 | ) | $ | (17,764 | ) | ||||||||
|
|
|
|
|
|
|
|
|
|||||||||||
75
Table of Contents
2011 versus 2010
Revenue
Revenue increased in 2011 to $105 million from $76 million in 2010. Higher volume (19,692 MMcf versus 15,697 MMcf) accounts for 65 percent of this increase and higher sales prices ($5.35/Mcf versus $4.83/Mcf) account for the remaining 35 percent of the increase. The price per Mcf shown is the revenue derived from the sale of natural gas and natural gas liquids divided by total wellhead volume during the period.
Costs of products sold
Costs of products sold increased in 2011 to $75 million from $51 million in 2010. The increase is primarily related to higher volume and prices as described above. In addition, certain contracts were revised to be more favorable to producers which resulted in higher costs of products sold expressed as a percentage of revenue.
Adjusted gross margin
| Year Ended December 31, | ||||||||
| 2011 | 2010 | |||||||
| Revenue |
$ | 105,248 | $ | 75,790 | ||||
| Less: cost of products sold, exclusive of depreciation |
75,066 | 50,800 | ||||||
| Less: Unrealized (gain) loss on derivatives |
— | — | ||||||
|
|
|
|
|
|||||
| Adjusted gross margin |
$ | 30,182 | $ | 24,990 | ||||
|
|
|
|
|
|||||
The following table presents a reconciliation of operating income (loss) to adjusted gross margin, the most directly comparable GAAP financial measure for each of the periods indicated.
| Successor | ||||||||
| Year Ended December 31, | ||||||||
| 2011 | 2010 | |||||||
| ($ in thousands) | ||||||||
| Reconciliation of operating income (loss) to adjusted gross margin: |
||||||||
| Operating income (loss) |
$ | 8,644 | $ | 6,530 | ||||
| Add: |
||||||||
| Unrealized (gain) loss on derivatives |
— | — | ||||||
| Operating expense |
9,027 | 6,342 | ||||||
| General and administrative expense |
6,521 | 6,626 | ||||||
| Depreciation and amortization expense |
5,986 | 5,480 | ||||||
| Loss on disposal or impairment |
4 | 12 | ||||||
|
|
|
|
|
|||||
| Adjusted gross margin |
$ | 30,182 | $ | 24,990 | ||||
|
|
|
|
|
|||||
Operating expense
Operating expense increased in 2011 to $9 million from $6 million in 2010. This increase is primarily a reflection of higher volume processed resulting in higher field expenses, labor costs, property taxes, maintenance and outside services.
2010 versus Eleven Months ended November 30, 2009
Revenue
Revenue increased in 2010 to $76 million from $55 million in the eleven months ended November 30, 2009. This increase is due almost entirely to price as volume is flat between the periods.
76
Table of Contents
Costs of products sold
Costs of products sold increased in 2010 to $51 million from $38 million in the eleven months ended November 30, 2009. The increase is due to higher prices of natural gas processed in 2010 compared to 2009. The change in volume between the periods is immaterial.
Operating expense
Operating expense decreased in 2010 to $6 million from $9 million in the eleven months ended November 30, 2009. This decline reflects a reduction in compression costs, property taxes, various field costs such as electricity and lubricants and the collection of an account receivable which had been fully reserved.
General and administrative expense
General and administrative expense increased in 2010 to $7 million from $4 million in the eleven months ended November 30, 2009. The amount of corporate overhead allocated to this reporting segment increased because during bankruptcy certain costs related to the reorganization and governance of the Company were classified as reorganization items; however, after emergence such costs were classified as general and administrative expense. In addition, incentive compensation expense contributed to the increase in general and administrative expense.
Depreciation and administrative expense
Depreciation and amortization expense decreased in 2010 to $5 million from $8 million in the eleven months ended November 30, 2009. This reduction reflects higher asset valuations in 2009 prior to the write down of certain assets in November 2009.
December 2009 versus average of Eleven Months ended November 30, 2009
Revenue
Revenue in December 2009 is approximately 32 percent higher than the average of the eleven months ended November 30, 2009. This increase is a result of significantly higher sales prices in December offset in part, by lower volumes of natural gas processed in December.
Costs of products sold
Costs of products sold in December 2009 was approximately 31 percent higher than the average of the eleven months ended November 30, 2009. This increase is a result of significantly higher purchase prices in December offset, in part, by lower volumes of natural gas processed in December.
General and administrative expense
General and administrative expense in December 2009 is approximately two and a half times the average of the eleven months ended November 30, 2009. During bankruptcy, certain costs related to the reorganization and governance of the Company were classified as reorganization items; however, after emergence such costs were classified as general and administrative expenses.
77
Table of Contents
Other and Eliminations
| Successor | Predecessor | |||||||||||||||||
| (U.S. $ in thousands) |
Year Ended December 31, 2011 |
Year Ended December 31, 2010 |
One Month Ended December 31, 2009 |
Eleven Months Ended November 30, 2009 |
||||||||||||||
| Revenues: |
$ | (84,525 | ) | $ | 257,712 | $ | 44,340 | $ | (40,241 | ) | ||||||||
| Expenses: |
||||||||||||||||||
| Costs of products sold |
(84,764 | ) | 245,263 | 43,378 | (42,409 | ) | ||||||||||||
| Operating |
70 | 4,306 | 151 | 414 | ||||||||||||||
| General and administrative |
16,745 | 25,995 | (21 | ) | 15,549 | |||||||||||||
| Depreciation and amortization |
2,951 | 7,375 | 997 | 3,430 | ||||||||||||||
| Loss on disposal or impairment |
1,599 | 89,355 | — | — | ||||||||||||||
|
|
|
|
|
|
|
|
|
|||||||||||
| Total expenses |
(63,399 | ) | 372,294 | 44,505 | (23,016 | ) | ||||||||||||
|
|
|
|
|
|
|
|
|
|||||||||||
| Operating loss |
$ | (21,126 | ) | $ | (114,582 | ) | $ | (165 | ) | $ | (17,225 | ) | ||||||
|
|
|
|
|
|
|
|
|
|||||||||||
Other and Eliminations is not an operating segment. This table is included to permit the reconciliation of segment information to that of the consolidated Company. We sold the property, plant and equipment of SemCanada Crude during fourth quarter 2010 and began winding down its operations. SemCanada Crude ceased to be an operating segment during fourth quarter 2010, and its results of operations for the year ended December 31, 2010, and the month ended December 31, 2009, are included in the table above.
Liquidity and Capital Resources
Sources and Uses of Cash
Revolving Credit Facility
On June 20, 2011, we entered into a $325 million revolving credit facility, which can be utilized by our SemStream, SemCAMS and SemGas segments. On July 25, 2011, this credit facility was increased to a total of $350 million. Later, on December 14, 2011, this credit facility was decreased to $320 million. This revolving credit facility expires in 2016. There was $82.0 million outstanding on the revolving credit facility at December 31, 2011. The interest rate in effect was 5.13% on $7.0 million and 3.16% on $75.0 million. On January 13, 2012, the capacity on this facility was reduced to $300 million. In connection with the revolving credit facility, we paid $5.1 million of financing fees that were capitalized and will be amortized over the life of the facility. This facility may, under certain conditions, be increased by up to an additional $100.0 million.
The revolving credit facility includes a $250.0 million sub-limit for the issuance of letters of credit for the account of SemGroup or its loan parties in U.S. Dollars, and within this sublimit, $10.0 million may be utilized for the issuance of letters of credit for the account of our Canadian subsidiary, SemCAMS ULC. Letters of credit bear interest from 2.5% to 4.0%, based on a leverage ratio, and are charged a fronting fee of 0.25%. At December 31, 2011, there was $12.5 million in letters of credit outstanding and the interest rate in effect was 2.88%.
At our option, amounts borrowed under the revolving credit facility will bear interest at either the Eurodollar rate or an alternate base rate (“ABR”), plus, in each case, an applicable margin. The applicable margin will range from 2.50% to 4.00% in the case of a Eurodollar rate loan, and from 1.50% to 3.00% in the case of an ABR loan, based on a leverage ratio. We elect the alternate base rate primarily for short-term borrowings. A three-day notice is required to initiate a Eurodollar-based borrowing.
We are required to pay a commitment fee of 0.50% on the unused portion of the revolving line of credit, which was $225.5 million at December 31, 2011. Additionally, we pay an administrative fee of $0.1 million
78
Table of Contents
annually. Alternative base rate interest and bank fees are paid quarterly; Eurodollar interest is paid at the end of each interest period. For the year ended December 31, 2011, interest expense related to the revolving credit facility was $2.8 million, of which $1.1 million related to amortization of capitalized financing costs and write offs of capitalized financing costs due to reduction in overall revolver capacity.
All outstanding borrowings under the revolving credit facility will be due and payable on June 20, 2016. All letters of credit will expire on June 13, 2016.
The agreement for the credit facilities (which encompass the revolving credit facility and the term loans) contains various covenants that limit, among other things, the ability of SemGroup Corporation, as the borrower, with its restricted subsidiaries, to incur indebtedness, grant certain liens supporting indebtedness, merge or consolidate, sell all or substantially all of its assets, enter into certain affiliate transactions, make certain distributions, and allow any material change in the nature of its business. Significant financial covenants under the credit facilities include:
| • | Leverage Ratio—ratio of consolidated net debt to EBITDA (each as defined in the credit facilities, with EBITDA measured on a rolling four-quarter basis) must be no greater than 4.5 to 1. The leverage ratio was 0.74 to 1.0 at December 31, 2011. |
| • | Interest Coverage Ratio—ratio of EBITDA to cash interest expense (each as defined in the credit facilities, measured on a rolling four-quarter basis, with the first full year of cash interest expense measured on an annualized basis) must be no less than 2.5 to 1. The interest coverage ratio was 11.34 to 1.0 at December 31, 2011. |
Each of the above ratios will be tested, beginning September 30, 2011, at the end of each fiscal quarter. As of December 31, 2011, we were in compliance with our covenants under the credit facilities.
The revolver loan includes customary events of default, including events of default relating to non-payment of principal and other amounts owing under the credit facilities from time to time, including in respect of letter of credit disbursement obligations, inaccuracy of representations and warranties in any material respect when made or when deemed made, violation of covenants, cross payment-defaults of SemGroup and its restricted subsidiaries to any material indebtedness, cross acceleration to any material indebtedness, bankruptcy and insolvency events, the occurrence of a change of control, certain unsatisfied judgments, certain ERISA events, certain environmental matters and certain assertions of or actual invalidity of certain loan documents. A default under the credit facilities would permit the participating banks to terminate commitments, require immediate repayment of any outstanding loans with interest and any unpaid accrued fees, and require the cash collateralization of outstanding letter of credit obligations. In addition, the credit facilities prohibit any commodity transactions that are not permitted by our Comprehensive Risk Management Policy.
The credit facilities restrict our ability to make certain types of payments relating to our capital stock, including the declaration or payment of dividends. Dividends are limited to $10 million plus an allowable amount as defined by the credit facilities. At December 31, 2011, dividends are limited to $10 million. The credit facilities are:
| • | guaranteed by all of SemGroup’s material domestic subsidiaries; and |
| • | secured by a lien on substantially all of the property and assets of SemGroup and the loan parties, subject to customary exceptions. |
The credit facilities permit, with certain conditions, the sale or transfer of assets into Rose Rock, a master limited partnership.
Term Loan A
On June 20, 2011, we entered into a five-year Term Loan A credit facility with a principal balance of $75.0 million. On September 30, 2011, we made a required quarterly principal payment of $0.9 million on this term loan. On November 1, 2011, we paid down $25.2 million in principal with the proceeds from a transaction with
79
Table of Contents
NGL Energy. Proceeds received on December 14, 2011, from the Rose Rock IPO were used to pay down the remaining principal balance of $48.9 million plus accrued interest. No principal or accrued interest remains outstanding under the Term Loan A credit facility and the Term Loan A credit facility has been terminated. For the year ended December 31, 2011, interest expense related to the Term Loan A facility was $2.7 million, of which $1.5 million related to the amortization of capitalized financing costs and write offs of capitalized financing costs due to repayment of the Term Loan A facility.
Term Loan B
On June 20, 2011, we entered into a seven-year Term Loan B credit facility with a principal balance of $200.0 million. This facility, along with the Term Loan A described above, replaced the previous term loan facility of $308.0 million, which was paid in full on June 20, 2011.
On September 30, 2011, we made a required principal payment of $0.5 million on this Term Loan B. On November 1, 2011, we paid down $67.9 million in principal with the proceeds from a transaction with NGL Energy. Proceeds received on December 14, 2011 from the Rose Rock IPO were used to pay down the remaining principal balance of $131.6 million plus accrued interest. No principal or accrued interest remains outstanding under the Term Loan B credit facility and the Term Loan B credit facility has been terminated. For the year ended December 31, 2011, interest expense related to the Term Loan B facility was $10.4 million, of which $5.2 million related to the amortization of capitalized financing costs and write offs of capitalized financing costs due to repayment of the Term Loan B facility.
Rose Rock Revolving Credit Facility
On November 10, 2011, Rose Rock entered into a $150.0 million senior secured revolving credit agreement with The Royal Bank of Scotland, as administrative agent, and a syndicate of lenders. The credit facility is available to fund working capital, for the issuance of up to $75 million of letters of credit, to finance capital expenditures and other permitted payments and for other lawful corporate purposes and will allow Rose Rock to request that the maximum amount of the credit facility be increased by up to an additional $200 million, subject to receiving increased commitments from lenders or commitments from other financial institutions. At December 31, 2011, Rose Rock had no outstanding borrowings on the revolving credit facility and had $22.6 million outstanding in letters of credit. Rose Rock’s obligations under the credit facility are secured by a first priority lien on substantially all of its material assets. The credit facility matures on December 14, 2016. Borrowings under the credit facility bear interest at either an alternate base rate or an adjusted Eurodollar rate, in each case plus an applicable margin. The applicable margin varies based upon Rose Rock’s Leverage Ratio, as defined in the credit facility. At December 31, 2011, had there been any borrowings under the revolving credit, the interest rate applicable would have been 4.50% and the interest rate applicable to Eurodollar rate borrowings would have been the Eurodollar margin of 2.25% plus the applicable LIBOR rate.
Fees are charged on any outstanding letters of credit at a rate that ranges from 2.25% to 3.25% depending on a leverage ratio specified in the credit agreement. In addition, a fronting fee of 0.25% is charged on outstanding letters of credit.
A commitment fee that ranges from 0.375% to 0.50%, depending on a leverage ratio specified in the credit agreement is charged on any unused capacity of the revolving credit facility. In addition, Rose Rock is charged an annual administrative fee of $0.1 million. The credit facility also allows for the use of secured bilateral letters of credit. At December 31, 2011, we had $17.0 million of bilateral letters of credit outstanding and the interest in effect was 1.75%.
The credit facility contains representations and warranties and affirmative and negative covenants customary for transactions of this nature. The negative covenants limit or restrict Rose Rock’s ability (as well as the ability of its Restricted Subsidiaries, as defined in the credit facility) to:
| • | permit the ratio of its consolidated EBITDA to its consolidated cash interest expense at the end of any fiscal quarter, for the immediately preceding four quarter period, to be less than 2.50 to 1.00; |
80
Table of Contents
| • | permit the ratio of its consolidated net debt to its consolidated EBITDA at the end of any fiscal quarter, for the immediately preceding four quarter period, to be greater than 4.50 to 1.00 (or 5.00 to 1.00 during a temporary period from the date of funding of the purchase price of certain acquisitions (as described in the credit facility) until the last day of the third fiscal quarter following such acquisitions); |
| • | incur additional debt, subject to customary carve outs for certain permitted additional debt, incur certain liens on assets, subject to customary carve outs for certain permitted liens, or enter into certain sale and leaseback transactions; |
| • | make investments in or make loans or advances to persons that are not Restricted Subsidiaries, subject to customary carve out for certain permitted investments, loans and advances; |
| • | make certain cash distributions, provided that it may make distributions of available cash so long as no default under the credit agreement then exists or would result therefrom; |
| • | dispose of assets in excess of an annual threshold amount; |
| • | make certain amendments, modifications or supplements to organization documents, its risk management policy, other material indebtedness documents and material contracts or enter into certain restrictive agreements or make certain payments on subordinated indebtedness; |
| • | engage in business activities other than its business as described herein, incidental or related thereto or a reasonable extension of the foregoing; |
| • | enter into hedging agreements, subject to a customary carve out for agreements entered into in the ordinary course of business for non-speculative purposes; |
| • | make changes to its fiscal year or other significant changes to its accounting treatment and reporting practices; |
| • | engage in certain mergers or consolidations and transfers of assets; and |
| • | enter into transactions with affiliates unless the terms are not less favorable, taken as a whole, than would be obtained in an arms-length transaction, subject to customary exceptions. |
As of December 31, 2011, Rose Rock was in compliance with the covenants.
The credit agreement also contains events of default customary for transactions of this nature, including the failure by SemGroup to directly or indirectly own a majority of the equity interests of the general partner of Rose Rock. Upon the occurrence and during the continuation of an event of default under the credit facility, the lenders may, among other things, terminate their revolving loan commitments, accelerate and declare the outstanding loans to be immediately due and payable and exercise remedies against Rose Rock and the collateral as may be available to the lenders under the credit facility and other loan documents.
SemLogistics Credit Facility
SemLogistics entered into a credit agreement in December 2010, which includes a £15 million term loan and a £15 million revolving credit facility (U.S. $23 million each, at December 31, 2011 exchange rates). The facility is secured by the assets of SemLogistics Milford Haven Limited. The proceeds from this new facility were used to retire SemLogistics’ previous credit facility.
At December 31, 2011, no cash borrowings were outstanding under the revolving facility and no letters of credit were utilized.
81
Table of Contents
Interest is charged on both the term loan and the revolving loans (including letters of credit) at a floating rate, which is calculated as the LIBOR plus a margin that ranges from 1.75% to 2.5%, depending on whether SemLogistics meets certain financial ratios specified in the agreement. The interest rate in effect at December 31, 2011 was 2.84%, which was calculated as 1.75% plus the LIBOR rate of 1.09%. Interest on the term loan and revolving facility are payable quarterly. A commitment fee of 0.50% is charged on any unused commitments under the facility and is payable quarterly. SemLogistics also paid fees of $1.3 million upon inception of the facility, which were recorded to other noncurrent assets and are being amortized over the life of the facility.
During February 2011, we entered into three interest swap agreements totaling £7.5 million. We pay a fixed rate on the swaps of 2.49% and they expire on March 31, 2014. We entered into these swaps to offset a portion of the variable interest rate payments due on the term loan. We receive a floating rate equal to the three month LIBOR on the same notional amount. The swaps notional amount declines to £7 million during the last year.
The facility is secured by the assets of SemLogistics. The facility contains covenants, which, among other things, restrict the ability of SemLogistics to incur additional indebtedness, create liens on assets, make investments, restricted payments, loans or advances, dispose of assets, or change the nature of its business. The facility contains covenants that require SemLogistics to maintain certain financial ratios specified in the agreement. At December 31, 2011, SemLogistics was in compliance with the covenants.
SemLogistics used the proceeds from the term loan to retire its previous credit agreement, which it had entered into on November 30, 2009. The previous facility bore interest at a floating rate which was calculated as LIBOR plus 5.5% (or 6.0%, if a specified financial target was not met). In addition, SemLogistics paid $2.1 million of fees to the lender at the inception of the agreement.
SemLogistics recorded interest expense of $1.0 million for the year ended December 31, 2011, including amortization of debt issuance costs. SemLogistics recorded interest expense of $4.0 million for year ended December 31, 2010, including amortization of debt issuance costs. SemLogistics recorded the fair value of the interest swaps as a noncurrent liability of $0.4 million at December 31, 2011, with a corresponding adjustment to other comprehensive income (net of income taxes).
At December 31, 2011, the outstanding balance of the SemLogistics credit facility has been classified as a current liability as we have committed to the banks to terminate the credit facility by March 31, 2012. The interest rate swaps will be terminated with an expected loss on closure of £250,000 (U.S. $0.4 million at the December 31, 2011 exchange rate). At December 31, 2011, unamortized capitalized loan fees of $0.8 million were included in other assets, net on the consolidated balance sheet.
SemMexico Revolving Credit Facilities
During 2010, SemMexico entered into a credit agreement that allowed SemMexico to borrow up to 80 million Mexican pesos at any time through June 2011. Borrowings on this facility are required to be repaid with monthly payments through May 2013. At December 31, 2011, borrowings of $56.7 million pesos (U.S. $4.0 million) were outstanding on this facility. Borrowings are unsecured and bear interest at the bank prime rate in Mexico plus 1.5%. At December 31, 2011, the interest rate in effect was 6.31%, calculated as 1.5% plus the bank prime rate of 4.81%.
At December 31, 2011, SemMexico also has outstanding letters of credit of 210 million Mexican pesos (U.S. $15.0 million at the December 31, 2011 exchange rate). Fees are generally charged on outstanding letters of credit at a rate of 0.40% for 196 million Mexican pesos (U.S. $14.0 million) in letters of credit and 1% for 14 million Mexican pesos (U.S. $1.0 million) in letters of credit.
During 2011, SemMexico entered into an additional credit agreement that allows SemMexico to borrow up to 56 million Mexican pesos (U.S. $4.0 million at the December 31, 2011 exchange rate) at any time during the term of the facility, which matures in August 2012. Borrowings would be unsecured and would bear interest at the bank prime rate in Mexico plus 1.7%.
82
Table of Contents
SemMexico recorded interest expense of $365,000 during the year ended December 31, 2011 related to these facilities.
SemCrude Pipeline, L.L.C. Term Loan Facility
On November 30, 2009, we entered into a $125 million SemCrude Pipeline, L.L.C. (“SemCrude Pipeline”) term loan facility (the “SCPL Term Loan Facility”). The proceeds were used to refinance SemCrude Pipeline’s pre-petition term loan and pay the associated closing costs. The SCPL Term Loan Facility was secured by SemCrude Pipeline’s equity interest in White Cliffs Pipeline, L.L.C. On September 29, 2010, approximately $107.3 million of the proceeds from the closing of the sale of ownership interests in the White Cliffs Pipeline, pursuant to the exercise of certain purchase options by two shippers that had entered into throughput agreements with us, was used to pay down all principal outstanding and accrued interest under the SCPL Term Loan Facility. No principal or accrued interest remains outstanding under the SCPL Term Loan Facility and the SCPL Term Loan Facility was retired on September 29, 2010.
Liquidity—Sources and Uses
Our primary sources of liquidity are cash flows generated from our operating activities and borrowing capacity under our credit facilities. Our primary liquidity requirements are working capital, debt service, contractual obligations and capital expenditures. The consolidated cash balance on December 31, 2011 was approximately $116 million, although approximately $40 million is considered restricted cash primarily for the settlement of pre-petition bankruptcy claims. Of the $116 million in consolidated cash, approximately $50 million was held in Canada and would be subject to tax if transferred to the United States. We expect to have adequate liquidity to fund our liquidity requirements over the foreseeable future from cash flows generated from operating activities and available borrowing capacity under our credit facilities.
The following table summarizes our changes in cash for the periods presented:
| Successor | Predecessor | |||||||||||||||||
| (U.S. $ in thousands) |
Year Ended December 31, 2011 |
Year Ended December 31, 2010 |
One Month Ended December 31, 2009 |
Eleven Months Ended November 30, 2009 |
||||||||||||||
| Statement of cash flow data: |
||||||||||||||||||
| Cash flows provided by (used for): |
||||||||||||||||||
| Operating activities |
$ | 74,041 | $ | 122,567 | $ | (3,193 | ) | $ | (549,452 | ) | ||||||||
| Investing activities |
36,922 | 121,243 | (7,968 | ) | 5,017 | |||||||||||||
| Financing activities |
(124,683 | ) | (191,756 | ) | (13,978 | ) | 6,339 | |||||||||||
|
|
|
|
|
|
|
|
|
|||||||||||
| Subtotal |
(13,720 | ) | 52,054 | (25,139 | ) | (538,096 | ) | |||||||||||
| Effect of exchange rate on cash and cash equivalents |
(34 | ) | (3,812 | ) | (642 | ) | 444 | |||||||||||
|
|
|
|
|
|
|
|
|
|||||||||||
| Change in cash and cash equivalents |
$ | (13,754 | ) | $ | 48,242 | $ | (25,781 | ) | $ | (537,652 | ) | |||||||
|
|
|
|
|
|
|
|
|
|||||||||||
Operating Activities
For the year ended December 2011, we had positive cash flows from operations of $74 million. Net income of $2.8 million included non-cash expenses of $64.8 million. Of this amount, $51.2 million related to depreciation and amortization and an additional $30.3 million to the amortization and write down of debt issuance costs. These non-cash expenses were partially offset by $14.1 million in unrealized gains on derivative instruments. Changes in operating assets and liabilities increased cash flows by $6.4 million.
83
Table of Contents
For the year ended December 2010, we had positive cash flows from operations of $122.6 million. A net loss of $132.1 million included non-cash expenses of $192.2 million. The primary non-cash expense was $105.1 million of loss on disposal or impairment of long-lived assets. Of this amount, $91.8 related to the impairment of goodwill and intangible assets in Canada and an additional $8.9 million related to the impairment of goodwill of our Mexican subsidiary. Changes in assets and liabilities increased operating cash flows by $62.4 million. The changes in assets and liabilities include a decrease in restricted cash of $182.9 million. The decrease in restricted cash of $182.9 million primarily reflects payments to pre-petition creditors. This is offset by the $217.5 million decrease in payables to pre-petition creditors as a result of payments to those creditors. The remaining elements in the changes in assets and liabilities net to positive cash flow of $97.0 million.
In the month of December 2009, we had negative cash flows from operations of $3.2 million. A net loss of $37.9 million was partially offset by non-cash expenses of $34.5 million. The most significant non-cash expense was $23.1 million which related to the impairment of a Canadian gas plant. Changes in assets and liabilities further offset the loss by $0.2 million. The most significant elements in the changes in assets and liabilities include a decrease in other current assets of $31.8 million, an increase in restricted cash of $36.9 million and a decrease in payables to pre-petition creditors of $26.8 million. The remaining elements in the changes in assets and liabilities net to positive $32.1 million.
The decrease in other current assets of $31.8 million occurred as prepaid deposits were returned to the Company by various vendors. The increase in restricted cash of $36.9 million (restricted for settlement of pre-petition claims) reflects collections of accounts receivable related to discontinued operations as well as recoveries of prepaid deposits. The decrease in payables to pre-petition creditors is a result of payments to those creditors.
For the eleven months ended November 2009, we had negative cash flows from operations of $549.5 million. Net income of $3,394.1 million was offset by non-cash adjustments of $4,173.4 million, $4,266.6 million of which related to plan of reorganization effects and fresh-start reporting and other positive non-cash adjustments netting to $93.2 million. Changes in assets and liabilities reduced that offset by $230.0 million, including a decrease in accounts receivable of $318.7 million, a decrease in accounts payable and accrued liabilities of $106.4 million and a decrease in inventory of $34.8 million. The remaining elements in the changes in assets and liabilities net to positive $17.7 million.
The decrease in accounts receivable of $318.7 million reflects the resolution of many disputes with customers who contested the receivables as a result of the Bankruptcy. Ultimately these receivables were collected, settled or written off.
The decrease of $106.4 million in accounts payable and accrued liabilities also reflects the resolution of certain disputes with customers. As part of the resolution of these disputes, certain of our accounts payable were netted against our receivables from these customers.
The decrease in inventory of $34.8 million primarily reflects a $69 million decrease at SemMaterials (a discontinued operation); a $10 million decrease at SemFuel (a discontinued operation); offset by a $41 million increase at SemStream.
Investing Activities
For the year ended December 2011, we had positive cash flows of $36.9 million, primarily as a result of $93.1 million in proceeds from the sale certain SemStream assets to NGL Energy and $12.5 million in distributions from White Cliffs in excess of equity earnings. Cash inflows were partially offset by $66.0 million in capital expenditures.
For the year ended December 2010, we had positive cash flows of $121.2 million, primarily as a result of $140.8 million received from the sale of interests in White Cliffs. Cash outflows of $48.5 million in capital expenditures were partially offset by $24.5 million of proceeds received from the sale of assets.
84
Table of Contents
In the month of December 2009, we had net outflows of $8.0 million, primarily as a result of $7.7 million in capital expenditures.
For the eleven months ended November 2009, we had net inflow of $5.0 million, primarily as a result of $75.5 in proceeds from sales of assets of discontinued operations and the cash effect of reconsolidating our Canadian subsidiaries, offset in part by capital expenditures of $90.4 million. These capital expenditures relate primarily to storage tanks at Cushing and the White Cliffs Pipeline.
Financing Activities
For the year ended December 2011, we had net outflows of $124.7 million, primarily as a result of $503.2 million of principal payments on debt and $12.5 million in debt issuance costs, offset in part by $264.0 million in borrowings and $127.1 million in proceeds received from the sale of limited partner interests in Rose Rock.
For the year ended December 2010, we had net outflows of $191.8 million, primarily as a result of $348.7 million of principal payments on debt offset in part by $159.2 million in borrowings.
In the month of December 2009, we had net outflows of $14 million as a result of principal payments on debt.
For the eleven months ended November 2009, we had net inflows of $6.3 million, primarily as a result of net borrowings of $12.7 million offset in part by $6.2 million in payment of debt issuance costs.
Off-Balance Sheet Arrangements
We do not use any off-balance sheet arrangements to enhance our liquidity and capital resources, or for any other purpose.
Capital Expenditures
The budget for capital expenditures in 2012 is $180.0 million, including $150 million for strategic projects, $26 million for maintenance projects and $4 million for environmental and regulatory projects.
Commitments
Contractual Obligations
In the ordinary course of business we enter into various contractual obligations for varying terms and amounts. The following table includes our non-cancelable contractual obligations as of December 31, 2011, and our best estimate of the period in which the obligation will be settled (in U.S. $ thousands):
| 2012 | 2013 | 2014 | 2015 | 2016 | Thereafter | |||||||||||||||||||
| Long-term debt (1) |
$ | 26,037 | $ | 1,189 | $ | — | $ | — | $ | 82,000 | $ | — | ||||||||||||
| Interest (1) |
6,292 | 5,924 | 5,803 | 5,688 | 3,236 | |||||||||||||||||||
| Capital leases |
21 | 21 | 21 | 21 | 20 | 5 | ||||||||||||||||||
| Operating leases |
5,185 | 4,674 | 2,446 | 1,774 | 1,564 | 7,920 | ||||||||||||||||||
| Purchase commitments |
1,230,832 | 868,161 | 836,200 | 206,487 | — | — | ||||||||||||||||||
| Payables to pre-petition creditors (2) |
37,800 | — | — | — | — | — | ||||||||||||||||||
|
|
|
|
|
|
|
|
|
|
|
|
|
|||||||||||||
| Total |
$ | 1,306,167 | $ | 879,969 | $ | 844,470 | $ | 213,970 | $ | 86,820 | $ | 7,925 | ||||||||||||
|
|
|
|
|
|
|
|
|
|
|
|
|
|||||||||||||
| (1) | Assumes interest rates, fee rates and letters of credit and loans outstanding are as of December 31, 2011, and remain constant thereafter until maturity except for required principal payments. |
| (2) | Of this amount, $37.5 million is held in a cash account which is restricted for this purpose. The remaining amount is associated with certain accounts receivable, and other current assets. Proceeds received from such assets will be remitted to pre-petition creditors. |
85
Table of Contents
In addition to the items in the table above, we have entered into various operational commitments and agreements related to pipeline operations and to the marketing, transportation, terminalling and storage of petroleum products. We have also entered into certain petroleum products derivative instruments, which have a net fair value of $0.2 million at December 31, 2011.
We had the right under our $300 million second lien term loan facility that we entered into pursuant to our plan of reorganization to defer certain interest payments. We elected to defer the interest payment that was due on June 30, 2010 for interest incurred during the seven-month period then ended. Because of this deferral, interest was charged at 11% during this period, instead of at 9%. We recorded an additional $3.5 million of interest expense in June 2010 to reflect the change in the interest rate upon making the decision to defer the interest payment. This term loan facility was replaced in June 2011, and the replacement term loan facilities were paid in full in December 2011.
Letters of Credit
In connection with our purchasing activities, we provide certain suppliers and transporters with irrevocable standby letters of credit to secure our obligation for the purchase of petroleum products. Our liabilities with respect to these purchase obligations are recorded as accounts payable on our balance sheet in the month the petroleum products are purchased. Generally, these letters of credit are issued for 70-day periods (with a maximum of 364-day periods) and are terminated upon completion of each transaction. At December 31, 2011 and December 31, 2010, we had outstanding letters of credit of approximately $52.1 million and $129.6 million, respectively.
Critical Accounting Policies and Estimates
Management’s Discussion and Analysis of Financial Condition and Results of Operation are based upon our consolidated financial statements, which have been prepared in accordance with accounting principles generally accepted in the U.S. The preparation of these financial statements and related disclosures requires the application of appropriate technical accounting rules and guidance, as well as the use of estimates and judgments that affect the reported amount of assets, liabilities, revenue, expenses and related disclosures of contingent assets and liabilities. The application of these policies involves judgments regarding future events, including the likelihood of success of particular projects and legal and regulatory challenges. These judgments, in and of themselves, could materially affect the financial statements and disclosures based on varying assumptions, which may be appropriate to use. In addition, the financial and operating environment may also have a significant effect, not only on the operation of the business, but on the results reported through the application of accounting measures used in preparing the financial statements and related disclosures, even if the nature of the accounting policies have not changed.
On an on-going basis, we evaluate these estimates using historical experience, consultation with experts and other methods we consider reasonable. Actual results may differ substantially from our estimates. Any effects on our business, financial position or results of operations resulting from revisions to these estimates are recorded in the period in which the facts that give rise to the revision become known.
Our significant accounting policies are summarized in Note 3 of our consolidated financial statements beginning on page F-1 of this Form 10-K. We identify our critical accounting policies as those that are the most pervasive and important to the portrayal of our financial position and results of operations, and that require the most difficult, subjective and complex judgments by management regarding estimates about matters that are inherently uncertain.
86
Table of Contents
| Accounting Policy |
Judgment/Uncertainty Affecting Application | |
| Fresh Start Reporting and Reorganization Value | Determination of reorganization value Allocation of the reorganization value to our assets based on their fair values | |
| Derivative Instruments | Instruments used in valuation techniques Market maturity and economic conditions Contract interpretation Market conditions in the energy industry, especially the effects of price volatility on contractual commitments | |
| Income Taxes and Valuation Allowance for Deferred Tax Assets | Ability to withstand legal challenges of tax authority decisions or appeals Anticipated future decisions of tax authorities Application of tax statutes and regulations to transactions Ability to use tax benefits carry forwards to future periods | |
| Impairment of Long Lived Assets | Recoverability of investment through future operations Regulatory and political environments and requirements Estimated useful lives of assets Environmental obligations and operational limitations Estimates of future cash flows Estimates of fair value Judgment about triggering effects | |
| Goodwill and Other Intangible Assets | Estimated useful lives for finite lived intangible assets Judgment about impairment triggering events Identification of reporting units Estimates of reporting unit’s fair value | |
| Contingencies | Estimated financial impact of event Judgment about the likelihood of event occurring Regulatory and political environments and requirements | |
Fresh-Start Reporting and Reorganization Value
As part of our emergence from the Bankruptcy on November 30, 2009, we implemented fresh-start reporting in accordance with ASC 852, “Reorganizations.” Accordingly, our assets, liabilities and equity were adjusted to fair value. Our consolidated financial statements for periods subsequent to November 30, 2009, reflect a new basis of accounting and are not comparable to our historical consolidated financial statements for periods prior to November 30, 2009.
Under fresh-start reporting, a reorganization value is determined and allocated to our net assets based on their relative fair values in a manner similar to the accounting provisions applied to business combinations under ASC 805, “Business Combinations.” Adjustments necessary to state our balance sheet accounts at fair value were made based on the work of management, financial consultants and independent appraisals. The estimates and assumptions used to derive the reorganization value and the allocation of that value to assets is inherently subject to significant business, economic and competitive uncertainties and contingencies, many of which are beyond our control. Modification to these assumptions could have significantly changed the reorganization value and the resultant fair values of our assets.
Derivative Instruments
We follow the guidance of ASC 815, “Derivatives and Hedging,” to account for derivative instruments. ASC 815 requires us to mark-to-market all derivative instruments on the balance sheet, and recognize changes in the fair value of non-hedge derivative instruments immediately in earnings. In certain cases, we may apply hedge accounting to our derivative instruments. The criteria used to determine if hedge accounting treatment is
87
Table of Contents
appropriate are: (i) the designation of the hedge to an underlying exposure; (ii) whether the overall risk is being reduced; and (iii) if there is a correlation between the fair value of the derivative instrument and the underlying hedged item. Changes in the fair value of derivative instruments accounted for as hedges are either recognized in earnings as an offset to the changes in the fair value of the related hedged item, or deferred and recorded as a component of other comprehensive income and subsequently recognized in earnings when the hedged transactions occur.
Certain derivative instruments that meet the criteria for derivative accounting treatment also qualify for a scope exception to derivative accounting, as they are considered to be a normal purchase normal sale (“NPNS”). The availability of this exception is based on the assumption that the Company has the ability, and it is probable, to deliver or take delivery of the underlying item. These assumptions are based on internal forecasts of sales and historical physical delivery on contracts. Derivatives that are considered to be NPNS are exempt from derivative accounting treatment and are accounted for under accrual accounting. If it is determined that a transaction designated as NPNS no longer meets the scope exception due to changes in estimates, the related contract would be recorded on the balance sheet at fair value combined with immediate recognition through earnings.
Income Taxes and Valuation Allowance for Deferred Tax Assets
As of December 31, 2011, we had a valuation allowance of $148.9 million on our deferred tax assets. Foreign tax credits of $77.3 million are the primary deferred tax asset. As of December 31, 2010, we had a valuation allowance of $162.2 million on our deferred tax assets. Foreign tax credits of $85.0 million are the primary deferred tax asset. In assessing the recognition of our deferred tax assets, we consider whether it is more likely than not that some portion or all of the deferred tax assets will be realized. The ultimate realization of deferred tax assets is dependent upon the existence of sufficient taxable income of the appropriate character within the carryback and carryforward period available under the tax law. Sources of taxable income include future reversals of existing taxable temporary differences, future earnings and available tax planning strategies.
Considerable judgment is required to determine the tax treatment of a particular item that involves interpretations of complex tax laws. We are subject to examination by taxing authorities for income tax returns filed in the U.S. federal jurisdiction and various state and foreign jurisdictions including Canada, Mexico and the United Kingdom.
Evaluation of Assets for Impairment for Other Than Temporary Decline in Value
In accordance with ASC 360, “Property, Plant and Equipment,” we evaluate property, plant and equipment and certain intangible assets for impairment whenever indicators of impairment exist. Examples of such indicators are:
| • | significant decrease in the market price of a long-lived asset; |
| • | significant adverse change in the manner an asset is used or its physical condition; |
| • | adverse business climate; |
| • | accumulation of costs significantly in excess of the amount originally expected for the construction or acquisition of an asset; |
| • | current period loss combined with a history of losses or the projection of future losses; and |
| • | change in our intent about an asset from an intent to hold such asset through the end of its estimated useful life to a greater than fifty percent likelihood that such asset will be disposed of before then. |
Recoverability of assets to be held and used is measured by comparison of the carrying amount of the assets to the future net cash flows expected to be generated by the asset. If such assets are considered to be impaired, the impairment to be recognized is measured by the amount by which the carrying amount exceeds the fair value of the assets. Generally, fair value will be determined using valuation techniques such as the present value of expected future cash flows. However, actual future market prices and costs could vary from the assumptions used in our estimates and the impact of such variations could be material.
88
Table of Contents
Goodwill and Other Intangible Assets
We apply ASC 805, “Business Combinations,” and ASC 350, “Intangibles – Goodwill and Other,” to account for goodwill and intangible assets. In accordance with these standards, we amortize all finite lived intangible assets over their respective estimated weighted average useful lives, while goodwill has an indefinite life and is not amortized. However, goodwill and all intangible assets not subject to amortization are tested for impairment at least annually, or more frequently whenever an event or change in circumstances occurs that would more likely than not reduce the fair value of a reporting unit below its carrying amount. We test for impairment at the reporting unit level using three valuation approaches: first, the income approach which measures the value of an asset by the present value of its future economic benefit; second, the market approach which measures the value of an asset through the analysis of recent sales or offerings of comparable properties; and third, the cost approach which measures the value of an asset by the cost to reconstruct or replace it with another of like utility. Estimation of future economic benefit requires management to make assumptions about numerous variables including selling prices, costs, the level of activity and appropriate discount rates. If it is determined that the fair value of a reporting unit is below its carrying amount, our goodwill or intangible assets with indefinite lives will be impaired at that time.
Contingencies
We record a loss contingency when management determines that it is probable that a liability has been incurred and the amount of the loss can be reasonably estimated. Such determinations are subject to interpretations of current facts and circumstances, forecasts of future events and estimates of the financial impacts of such events. Gain contingencies are not recorded.
| Item 7A. | Quantitative and Qualitative Disclosures About Market Risk |
This discussion on market risks represents an estimate of possible changes in future earnings that would occur assuming hypothetical future movements in commodity prices, interest rates and currency exchange rates. Our views on market risk are not necessarily indicative of actual results that may occur, and do not represent the maximum possible gains and losses that may occur since actual gains and losses will differ from those estimated based on actual fluctuations in interest rates or commodity prices and the timing of transactions.
We are exposed to various market risks, including volatility in (i) petroleum prices, (ii) interest rates and (iii) currency exchange rates. We may utilize from time-to-time various derivative instruments to manage such exposure. Our risk management policies and procedures are designed to monitor physical and financial commodity positions and the resulting outright commodity price risk as well as basis risk resulting from differences in commodity grades, purchase and sales locations and purchase and sale timing. We have a risk management function that has responsibility and authority for our Comprehensive Risk Management Policy, which governs our enterprise-wide risks, including the market risks discussed in this item. Subject to our Comprehensive Risk Management Policy, our finance and treasury function has responsibility and authority for managing exposure to interest rates and currency exchange rates. To manage the risks discussed above, we engage in price risk management activities. The following discussion addresses each category of risk. See “Business— Risk Governance and Comprehensive Risk Management Policy” for more information on our Comprehensive Risk Management Policy.
Commodity Price Risk
Commodity prices have historically been volatile and cyclical. For example, NYMEX WTI benchmark prices have ranged from an all-time high of over $145 per barrel (June/July 2008) to a low of approximately $12 per barrel (March 1986) over the last 25 years.
89
Table of Contents
The table below outlines the range of NYMEX prompt month daily settle prices for crude oil and natural gas futures, and the range of daily propane spot prices provided by an independent, third-party broker for the years ended December 31, 2011, 2010 and 2009.
| Light Sweet Crude Oil Futures ($ per Barrel) |
Mont Belvieu (Non-LDH) Spot Propane ($ per Gallon) |
Henry Hub Natural Gas Futures ($ per MMBtu) |
||||||||||
| Year Ended December 31, 2011 |
||||||||||||
| High |
$ | 113.93 | $ | 1.63 | $ | 4.85 | ||||||
| Low |
$ | 75.67 | $ | 1.30 | $ | 2.99 | ||||||
|
|
|
|
|
|
|
|||||||
| High/Low Differential |
$ | 38.26 | $ | 0.33 | $ | 1.86 | ||||||
| Year Ended December 31, 2010 |
||||||||||||
| High |
$ | 91.51 | $ | 1.43 | $ | 6.01 | ||||||
| Low |
$ | 68.01 | $ | 0.96 | $ | 3.29 | ||||||
|
|
|
|
|
|
|
|||||||
| High/Low Differential |
$ | 23.50 | $ | 0.47 | $ | 2.72 | ||||||
| Year Ended December 31, 2009 |
||||||||||||
| High |
$ | 81.37 | $ | 1.31 | $ | 6.07 | ||||||
| Low |
$ | 33.98 | $ | 0.60 | $ | 2.51 | ||||||
|
|
|
|
|
|
|
|||||||
| High/Low Differential |
$ | 47.39 | $ | 0.71 | $ | 3.56 | ||||||
Revenue from our asset-based activities is dependent on throughput volume, tariff rates, the level of fees generated from our pipeline systems, capacity leased to third parties, capacity that we use for our own operational or marketing activities and the level of other fees generated at our terminalling and storage facilities. Profit from our marketing activities is dependent on our ability to sell petroleum products at prices in excess of our aggregate cost. Margins may be affected during transitional periods between a backwardated market (when the prices for future deliveries are lower than the current prices) and a contango market (when the prices for future deliveries are higher than the current prices). Our petroleum product marketing activities within each of our segments are generally not directly affected by the absolute level of petroleum product prices, but are affected by overall levels of supply and demand for petroleum products and relative fluctuations in marked-related indices.
Based on our open derivative contracts at December 31, 2011, a 5% increase in the applicable market price or prices for each derivative contract would result in a less than $0.5 million decrease in our crude oil sales revenues. A 5% decrease in the applicable market price or prices for each derivative contract would result in a less than $0.5 million increase in our crude oil sales revenues. However, the increases or decreases in crude oil sales revenues we recognize from our open derivative contracts are substantially offset by higher or lower crude oil sales revenues when the physical sale of the product occurs. These contracts may be for the purchase or sale of crude oil or in markets different from the physical markets in which we are attempting to hedge our exposure, or may have timing differences relative to the physical markets. As a result of these factors, our hedges may not eliminate all price risks.
Margin deposits or other credit support, including letters of credit, are generally required on derivative instruments utilized to manage our price exposure. As commodity prices increase or decrease, the fair value of our derivative instruments changes, thereby increasing or decreasing our margin deposit or other credit support requirements. Although a component of our risk-management strategy is intended to manage the margin and other credit support requirements on our derivative instruments, volatile spot and forward commodity prices, or an expectation of increased commodity price volatility, could increase the cash needed to manage our commodity price exposure and thereby increase our liquidity requirements. This may limit amounts available to us through borrowing, decrease the volume of petroleum products we purchase and sell or limit our commodity price management activities.
90
Table of Contents
Interest Rate Risk
We utilize both fixed and variable rate debt and are exposed to market risk due to the floating interest rates on our credit facilities. Therefore, from time-to-time we may utilize interest rate derivatives to manage interest obligations on specific debt issuances. Our variable rate debt bears interest at LIBOR or prime, subject to certain floors, plus the applicable margin. At December 31, 2011, an increase in these base rates of 1%, above the base rate floors, would increase our interest expense by $1.1 million per year.
The average interest rates presented below are based upon rates in effect at December 31, 2011 and December 31, 2010. The carrying value of the variable rate instruments in our credit facilities approximate fair value primarily because our rates fluctuate with prevailing market rates.
The following table summarizes our debt obligations:
| Liabilities |
December 31, 2011 |
December 31, 2010 |
||||||
| Short-term debt—variable rate |
$ | 26.1 million | $ | 0.0 million | ||||
| Average interest rate |
3.22 | % | — | % | ||||
| Long-term debt—variable rate |
$ | 83.3 million | $ | 37.2 million | ||||
| Average interest rate |
3.37 | % | 4.65 | % | ||||
| Long-term debt—fixed rate |
$ | 0 million | $ | 308.7 million | ||||
| Fixed interest rate |
0.00 | % | 9.00 | % | ||||
Currency Exchange Risk
The cash flows relating to our U.K., Canada and Mexico operations are based on the U.S. dollar equivalent of such amounts measured in British pounds, Canadian dollars and Mexican pesos. Assets and liabilities of our U.K., Canadian and Mexican subsidiaries are translated to U.S. dollars using the applicable exchange rate as of the end of a reporting period. Revenue, expenses and cash flows are translated using the average exchange rate during the reporting period.
Item 8. Financial Statements and Supplementary Data
The consolidated financial statements of the Company required to be included in this Form 10-K appear immediately following the signature page to this Form 10-K beginning on page F-1.
Item 9. Changes in and Disagreements with Accountants on Accounting and Financial Disclosure
None
Item 9A. Controls and Procedures
Evaluation of Disclosure Controls and Procedures
Our Chief Executive Officer and Chief Financial Officer have concluded that our disclosure controls and procedures (as such term is defined in Rule 13a-15(e) under the Exchange Act) were effective as of December 31, 2011, based on the evaluation of these controls and procedures required by Rule 13a-15(b) under the Exchange Act.
Management’s Report on Internal Control over Financial Reporting
Our management is responsible for establishing and maintaining adequate internal control over financial reporting, as such term is defined in Exchange Act Rule 13a-15(f). Under the supervision and with the participation of our management, including our Chief Executive Officer and Chief Financial Officer, we
91
Table of Contents
evaluated the effectiveness of our internal control over financial reporting based on the framework in Internal Control-Integrated Framework issued by the Committee of Sponsoring Organizations of the Treadway Commission. Because of inherent limitations, internal control over financial reporting may not prevent or detect misstatements. Also, projections of any evaluation of effectiveness to future periods are subject to the risk that controls may become inadequate because of changes in conditions, or that the degree of compliance with the policies or procedures may deteriorate. Based on our evaluation under that framework and applicable SEC rules, our management concluded that our internal control over financial reporting was effective as of December 31, 2011.
Our internal control over financial reporting as of December 31, 2011, has been audited by BDO USA, LLP, an independent registered public accounting firm, as stated in their report that is included herein.
Changes in Internal Control over Financial Reporting
There were no changes in our internal control over financial reporting that occurred during the fiscal quarter ended December 31, 2011, that have materially affected, or that are reasonably likely to materially affect, our internal control over financial reporting.
None
92
Table of Contents
PART III
Item 10. Directors, Executive Officers and Corporate Governance.
The information required by this item concerning our directors and corporate governance matters is incorporated by reference to the information in the sections entitled “PROPOSAL ONE – ELECTION OF DIRECTORS” and “CORPORATE GOVERNANCE,” respectively, of our Proxy Statement for the 2012 Annual Meeting of Stockholders (the “Proxy Statement”). The information required by this item with respect to the Section 16 ownership reports is incorporated by reference to the section entitled “SECTION 16(a) BENEFICIAL OWNERSHIP REPORTING COMPLIANCE” in the Proxy Statement. The information required by this item with respect to our executive officers is included in Part I of this Form 10-K under the section entitled “Executive Officers of the Registrant.” A copy of our Code of Business Conduct and Ethics is posted on our website at www.semgroupcorp.com.
Item 11. Executive Compensation
The information required by this item is incorporated by reference to the information set forth in the sections entitled “EXECUTIVE COMPENSATION” and “DIRECTOR COMPENSATION” of the Proxy Statement.
Item 12. Security Ownership of Certain Beneficial Owners and Management and Related Stockholders Matters
The information required by this item regarding security ownership and equity compensation plans is incorporated by reference to the information set forth in the sections entitled “PRINCIPAL STOCKHOLDERS AND SECURITY OWNERSHIP OF MANAGEMENT” and “EQUITY COMPENSATION PLAN INFORMATION,” respectively, of the Proxy Statement.
Item 13. Certain Relationships and Related Transactions, and Director Independence
The information required by this item regarding certain relationships and related transactions and director independence is incorporated by reference to the information set forth in the sections entitled “CERTAIN RELATIONSHIPS AND RELATED TRANSACTIONS” and “CORPORATE GOVERNANCE,” respectively, of the Proxy Statement.
Item 14. Principal Accountant Fees and Services
The information required by this item regarding principal accounting fees and services is incorporated by reference to the information set forth in the sections entitled “FEES OF INDEPENDENT REGISTERED PUBLIC ACCOUNTING FIRM” and “AUDIT COMMITTEE PRE-APPROVAL POLICY” of the Proxy Statement.
93
Table of Contents
PART IV
Item 15. Exhibits and Financial Statement Schedules
| (a) |
(1) | Financial Statements. The consolidated financial statements of the Company included in this Form 10-K are listed on page F-1, which follows the signature page to this Form 10-K. |
| (2) | Financial Statement Schedules. All financial statement schedules are omitted as inapplicable or because the required information is contained in the financial statements or the notes thereto. |
| The financial statements of White Cliffs Pipeline, L.L.C., our equity method investee, are included in this filing as Exhibit 99.1 pursuant to Rule 3-09 of Regulation S-X. |
| (3) | Exhibits. The following documents are included as exhibits to this Form 10-K. Those exhibits below incorporated by reference herein are indicated as such by the information supplied in the parenthetical thereafter. If no parenthetical appears after an exhibit, such exhibit is filed herewith. |
| Exhibit |
Description | |
| 2.1 | Fourth Amended Joint Plan of Affiliated Debtors filed with the United States Bankruptcy Court for the District of Delaware on October 27, 2009 (filed as Exhibit 2.1 to our registration statement on Form 10, File No. 001-34736 (the “Form 10”)). | |
| 2.2 | Contribution Agreement dated August 31, 2011, among SemStream, L.P., a wholly-owned subsidiary of SemGroup Corporation, NGL Supply Terminal Company LLC, NGL Energy Partners LP and NGL Energy Holdings LLC (filed as Exhibit 2.1 to our current report on Form 8-K dated November 1, 2011, filed November 4, 2011). | |
| 2.3 | Second Amended and Restated Limited Liability Company Agreement of NGL Energy Holdings LLC (filed as Exhibit 2.2 to our current report on Form 8-K dated November 1, 2011, filed November 4, 2011). | |
| 2.4 | First Amended and Restated Registration Rights Agreement dated October 3, 2011, among NGL Energy Partners LP, Hicks Oil & Hicksgas, Incorporated, NGL Holdings, Inc., Krim2010, LLC, Infrastructure Capital Management, LLC, Atkinson Investors, LLC, Stanley A. Bugh, Robert R. Foster, Brian K. Pauling, Stanley D. Perry, Stephen D. Tuttle, Craig S. Jones, Daniel Post, Mark McGinty, Sharra Straight, David Eastin, AO Energy, Inc., E. Osterman, Inc., E. Osterman Gas Service, Inc., E. Osterman Propane, Inc., Milford Propane, Inc., Osterman Propane, Inc., Propane Gas, Inc., and Saveway Propane Gas Service, Inc. (filed as Exhibit 2.3 to our current report on Form 8-K dated November 1, 2011, filed November 4, 2011). | |
| 2.5 | Amendment No. 1 and Joinder to First Amended and Restated Registration Rights Agreement dated November 1, 2011, between NGL Energy Holdings LLC and SemStream, L.P. (filed as Exhibit 2.4 to our current report on Form 8-K dated November 1, 2011, filed November 4, 2011). | |
| 3.1 | Amended and Restated Certificate of Incorporation, dated as of November 30, 2009, of SemGroup Corporation (filed as Exhibit 3.1 to the Form 10). | |
| 3.2 | Amended and Restated Bylaws, dated as of October 28, 2011, of SemGroup Corporation (filed as Exhibit 3.1 to our current report on Form 8-K dated October 28, 2011, filed October 28, 2011). | |
| 4.1 | Form of stock certificate for our Class A Common Stock, par value $0.01 per share (filed as Exhibit 4.1 to the Form 10). | |
| 4.2 | Form of stock certificate for our Class B Common Stock, par value $0.01 per share (filed as Exhibit 4.2 to the Form 10). | |
| 4.3 | Warrant Agreement dated as of November 30, 2009, by and between SemGroup Corporation and Mellon Investor Services, LLC (filed as Exhibit 4.3 to the Form 10). | |
94
Table of Contents
| Exhibit |
Description | |
| 4.4 | Form of warrant certificate (filed as Exhibit 4.4 to the Form 10). | |
| 4.5 | Rights Agreement, dated as of October 28, 2011, between SemGroup Corporation and Mellon Investor Services LLC (filed as Exhibit 4.1 to our current report on Form 8-K dated October 28, 2011, filed October 28, 2011). | |
| 10.1 | Credit Agreement (the “Credit Facility”) dated as of June 17, 2011, among SemGroup Corporation, as borrower, the lenders parties thereto from time to time, and The Royal Bank of Scotland PLC, as Administrative Agent and Collateral Agent (filed as Exhibit 10 to our current report on Form 8-K dated June 17, 2011, filed June 21, 2011). | |
| 10.2 | Second Amendment to the Credit Facility, dated as of September 19, 2011 (filed as Exhibit 10 to our current report on Form 8-K dated September 19, 2011, filed September 23, 2011). | |
| 10.3* | SemGroup Corporation Board of Directors Compensation Plan (filed as Exhibit 10.6 to the Form 10). | |
| 10.4* | SemGroup Corporation Nonexecutive Directors’ Compensation Deferral Program (filed as Exhibit 10.7 to the Form 10). | |
| 10.5* | SemGroup Corporation Equity Incentive Plan (filed as Exhibit 10.8 to the Form 10). | |
| 10.6* | SemGroup Corporation Equity Incentive Plan Form of Restricted Stock Award Agreement for Directors (filed as Exhibit 10.9 to the Form 10). | |
| 10.7* | Amendment No. 1 to SemGroup Corporation Equity Incentive Plan Form of Restricted Stock Award Agreement for Directors (filed as Exhibit 10.15 to the Form 10). | |
| 10.8* | SemGroup Corporation Equity Incentive Plan Form of Restricted Stock Award Agreement for executive officers and employees in the United States (filed as Exhibit 10.10 to the Form 10). | |
| 10.9* | Amendment No. 1 to SemGroup Corporation Equity Incentive Plan Form of Restricted Stock Award Agreement for executive officers and employees in the United States (filed as Exhibit 10.16 to the Form 10). | |
| 10.10* | Amendment No. 2 to SemGroup Corporation Equity Incentive Plan Form of Restricted Stock Award Agreement for executive officers and employees in the United States. | |
| 10.11* | Employment Agreement dated as of November 30, 2009, by and among SemManagement, L.L.C., SemGroup Corporation and Norman J. Szydlowski (filed as Exhibit 10.11 to the Form 10). | |
| 10.12* | Letter Amendment dated March 18, 2010, by and among SemManagement, L.L.C., SemGroup Corporation and Norman J. Szydlowski, amending the Employment Agreement dated as of November 30, 2009 (filed as Exhibit 10.12 to the Form 10). | |
| 10.13* | Form of Severance Agreement between SemGroup Corporation and each of its executive officers other than Norman J. Szydlowski and David B. Gorte (filed as Exhibit 10.13 to the Form 10). | |
| 10.14* | Form of Amendment to Severance Agreement between SemGroup Corporation and certain of its executive officers. | |
| 10.15* | SemGroup Corporation Equity Incentive Plan Form of Retention Award Agreement for certain executive officers (filed as Exhibit 10.14 to the Form 10). | |
| 10.16* | SemGroup Corporation Equity Incentive Plan Form of Restricted Stock Award Agreement for Directors for awards granted on or after August 31, 2010 (filed as Exhibit 10.17 to the Form 10). | |
| 10.17* | SemGroup Corporation Equity Incentive Plan Form of Restricted Stock Award Agreement for executive officers and employees in the United States for awards granted on or after August 31, 2010 (filed as Exhibit 10.18 to the Form 10). | |
95
Table of Contents
| Exhibit |
Description | |
| 10.18* | Form of 2011 Performance Share Unit Award Agreement under the SemGroup Corporation Equity Incentive Plan for executive officers (filed as Exhibit 10.1 to our current report on Form 8-K dated January 24, 2011, filed January 24, 2011). | |
| 10.19* | Form of Restricted Stock Award Agreement under the SemGroup Corporation Equity Incentive Plan for executive officers and employees in the United States during 2011 (filed as Exhibit 10.2 to our current report on Form 8-K dated January 24, 2011, filed January 24, 2011). | |
| 10.20* | Form of 2012 Performance Share Unit Award Agreement under the SemGroup Corporation Equity Incentive Plan for executive officers. | |
| 10.21* | Form of Restricted Stock Award Agreement under the SemGroup Corporation Equity Incentive Plan for executive officers and employees in the United States for awards granted on or after January 1, 2012. | |
| 10.22* | SemGroup Corporation Short-Term Incentive Program (filed as Exhibit 10.1 to our current report on Form 8-K dated February 24, 2011, filed March 2, 2011). | |
| 10.23* | Consulting Services Agreement, effective as of February 2, 2012, by and between SemGroup Corporation and David B. Gorte. | |
| 10.24 | Credit Agreement dated November 10, 2011, among Rose Rock Midstream, L.P., as borrower, The Royal Bank of Scotland PLC, as administrative agent and collateral agent, the other agents party thereto and the lenders and issuing banks party thereto (filed as Exhibit 10.1 to Rose Rock Midstream, L.P.’s registration statement on Form S-1, File No. 333-176260). | |
| 10.25 | Second Amended and Restated Agreement of Limited Partnership of Rose Rock Midstream, L.P. (filed as Exhibit 3.1 to Rose Rock Midstream, L.P.’s current report on Form 8-K dated December 14, 2011, filed December 20, 2011). | |
| 10.26 | First Amended and Restated Limited Liability Company Agreement of Rose Rock Midstream GP, LLC (filed as Exhibit 3.2 to Rose Rock Midstream, L.P.’s current report on Form 8-K dated December 14, 2011, filed December 20, 2011). | |
| 10.27* | Rose Rock Midstream Equity Incentive Plan (filed as Exhibit 10.1 to Rose Rock Midstream, L.P.’s current report on Form 8-K dated December 8, 2011, filed December 14, 2011). | |
| 10.28* | Form of Restricted Unit Award Agreement (Employees) under the Rose Rock Midstream Equity Incentive Plan (filed as Exhibit 10.3.1 to Rose Rock Midstream, L.P.’s annual report on Form 10-K for the fiscal year ended December 31, 2011, filed February 29, 2012). | |
| 21 | Subsidiaries of SemGroup Corporation. | |
| 23.1 | Consent of Independent Registered Public Accounting Firm. | |
| 31.1 | Rule 13a – 14(a)/15d – 14(a) Certification of Norman J. Szydlowski, Chief Executive Officer. | |
| 31.2 | Rule 13a – 14(a)/15d – 14(a) Certification of Robert N. Fitzgerald, Chief Financial Officer. | |
| 32.1 | Section 1350 Certification of Norman J. Szydlowski, Chief Executive Officer. | |
| 32.2 | Section 1350 Certification of Robert N. Fitzgerald, Chief Financial Officer. | |
| 99.1 | White Cliffs Pipeline, L.L.C. financial statements presented pursuant to Rule 3-09 of Regulation S-X. | |
| 101** | Interactive data files pursuant to Rule 405 of Regulation S-T: (i) the Consolidated Balance Sheets at December 31, 2011 and 2010, (ii) the Consolidated Statements of Operations and Comprehensive Income (Loss) for the years ended December 31, 2011 and 2010, the month ended December 31, 2009 (Successor) and the eleven months ended November 30, 2009 (Predecessor), (iii) the Consolidated Statements of Changes in Owners’ Equity (Deficit) for the years ended December 31, 2011 and 2010, the month ended December 31, 2009 (Successor) and the eleven months ended November 30, 2009 (Predecessor), (iv) the Consolidated Statements of Cash Flows for the years ended December 31, 2011 and 2010, the month ended December 31, 2009 (Successor) and the eleven months ended November 30, 2009 (Predecessor), and (v) the Notes to Consolidated Financial Statements. | |
| * | Management contract or compensatory plan or arrangement |
| ** | To be filed by Amendment |
96
Table of Contents
SIGNATURES
Pursuant to the requirements of Section 13 or 15(d) of the Securities Exchange Act of 1934, the registrant has duly caused this report to be signed on its behalf by the undersigned, thereunto duly authorized.
| SEMGROUP CORPORATION | ||||
| Date: February 29, 2012 | ||||
| By: /s/ Robert N. Fitzgerald | ||||
| Robert N. Fitzgerald | ||||
| Senior Vice President and | ||||
| Chief Financial Officer |
Pursuant to the requirements of the Securities Exchange Act of 1934, this report has been signed below by the following persons on behalf of the registrant and in the capacities and on the date indicated.
| Signature | Title | Date | ||
| /s/ Norman J. Szydlowski Norman J. Szydlowski |
President, Chief Executive Officer and Director (Principal Executive Officer) | February 29, 2012 | ||
| /s/ Robert N. Fitzgerald Robert N. Fitzgerald |
Senior Vice President and Chief Financial Officer (Principal Financial Officer) | February 29, 2012 | ||
| /s/ Paul F. Largess Paul F. Largess |
Vice President, Chief Accounting Officer and Controller (Principal Accounting Officer) | February 29, 2012 | ||
| /s/ John F. Chlebowski John F. Chlebowski |
Chairman of the Board and Director | February 29, 2012 | ||
| /s/ Ronald A. Ballschmiede Ronald A. Ballschmiede |
Director | February 29, 2012 | ||
| /s/ Sarah M. Barpoulis Sarah M. Barpoulis |
Director | February 29, 2012 | ||
| /s/ Karl F. Kurz Karl F. Kurz |
Director | February 29, 2012 | ||
| /s/ James H. Lytal James H. Lytal |
Director | February 29, 2012 | ||
| /s/ Thomas R. McDaniel Thomas R. McDaniel |
Director | February 29, 2012 | ||
97
Table of Contents
| Page | ||||
| SemGroup Corporation and SemGroup, L.P. |
||||
| F-1 | ||||
| Consolidated Balance Sheets as of December 31, 2011 and 2010 (Successor) |
F-3 | |||
| F-4 | ||||
| F-5 | ||||
| F-6 | ||||
| F-7 | ||||
Table of Contents
Report of Independent Registered Public Accounting Firm
Board of Directors and Stockholders
SemGroup Corporation
Tulsa, Oklahoma
We have audited the accompanying consolidated balance sheets of SemGroup Corporation (formerly SemGroup, L.P.) (the “Company”) as of December 31, 2011, and 2010 (Successor) and the related consolidated statements of operations and comprehensive income (loss), owners’ equity (deficit), and cash flows for the years ended December 31, 2011 and 2010 and for the one month ended December 31, 2009 (Successor), and for the eleven months ended November 30, 2009 (Predecessor). These financial statements are the responsibility of the Company’s management. Our responsibility is to express an opinion on these financial statements based on our audits.
We conducted our audits in accordance with the standards of the Public Company Accounting Oversight Board (United States). Those standards require that we plan and perform the audit to obtain reasonable assurance about whether the financial statements are free of material misstatement. An audit includes examining, on a test basis, evidence supporting the amounts and disclosures in the financial statements, assessing the accounting principles used and significant estimates made by management, as well as evaluating the overall presentation of the financial statements. We believe that our audits provide a reasonable basis for our opinion.
In our opinion, the consolidated financial statements referred to above present fairly, in all material respects, the financial position of SemGroup Corporation (formerly SemGroup, L.P.) at December 31, 2011 and 2010 (Successor), and the results of its operations and its cash flows for the years ended December 31, 2011 and 2010 and for the one month ended December 31, 2009 (Successor) and for the eleven months ended November 30, 2009 (Predecessor), in conformity with accounting principles generally accepted in the United States of America.
As discussed in Note 1 to the consolidated financial statements, effective November 30, 2009, the Company emerged from bankruptcy and applied fresh-start accounting. As a result, the statements of consolidated operations and cash flows for the years ended December 31, 2011 and 2010 and for the one month ended December 31, 2009, are presented on a different basis than for the periods before fresh-start and, therefore, are not comparable.
We also have audited, in accordance with the standards of the Public Company Accounting Oversight Board (United States), SemGroup Corporation’s internal control over financial reporting as of December 31, 2011, based on criteria established in Internal Control—Integrated Framework issued by the Committee of Sponsoring Organizations of the Treadway Commission (COSO) and our report dated February 29, 2012, expressed an unqualified opinion thereon.
| /s/ BDO USA, LLP |
| BDO USA, LLP |
| Dallas, Texas |
| February 29, 2012 |
F-1
Table of Contents
Report of Independent Registered Public Accounting Firm
Board of Directors and Stockholders
SemGroup Corporation
Tulsa, Oklahoma
We have audited SemGroup Corporation’s internal control over financial reporting as of December 31, 2011, based on criteria established in Internal Control—Integrated Framework issued by the Committee of Sponsoring Organizations of the Treadway Commission (the COSO criteria). SemGroup Corporation’s management is responsible for maintaining effective internal control over financial reporting and for its assessment of the effectiveness of internal control over financial reporting, included in the accompanying Item 9A, Management’s Report on Internal Control Over Financial Reporting. Our responsibility is to express an opinion on the company’s internal control over financial reporting based on our audit.
We conducted our audit in accordance with the standards of the Public Company Accounting Oversight Board (United States). Those standards require that we plan and perform the audit to obtain reasonable assurance about whether effective internal control over financial reporting was maintained in all material respects. Our audit included obtaining an understanding of internal control over financial reporting, assessing the risk that a material weakness exists, and testing and evaluating the design and operating effectiveness of internal control based on the assessed risk. Our audit also included performing such other procedures as we considered necessary in the circumstances. We believe that our audit provides a reasonable basis for our opinion.
A company’s internal control over financial reporting is a process designed to provide reasonable assurance regarding the reliability of financial reporting and the preparation of financial statements for external purposes in accordance with generally accepted accounting principles. A company’s internal control over financial reporting includes those policies and procedures that (1) pertain to the maintenance of records that, in reasonable detail, accurately and fairly reflect the transactions and dispositions of the assets of the company; (2) provide reasonable assurance that transactions are recorded as necessary to permit preparation of financial statements in accordance with generally accepted accounting principles, and that receipts and expenditures of the company are being made only in accordance with authorizations of management and directors of the company; and (3) provide reasonable assurance regarding prevention or timely detection of unauthorized acquisition, use, or disposition of the company’s assets that could have a material effect on the financial statements.
Because of its inherent limitations, internal control over financial reporting may not prevent or detect misstatements. Also, projections of any evaluation of effectiveness to future periods are subject to the risk that controls may become inadequate because of changes in conditions, or that the degree of compliance with the policies or procedures may deteriorate.
In our opinion, SemGroup Corporation maintained, in all material respects, effective internal control over financial reporting as of December 31, 2011, based on the COSO criteria.
We also have audited, in accordance with the standards of the Public Company Accounting Oversight Board (United States), the consolidated balance sheets of SemGroup Corporation (formerly SemGroup, L.P.) as of December 31, 2011 and 2010 (Successor), and the related consolidated statements of operations and comprehensive income (loss), owners’ equity (deficit), and cash flows for the years ended December 31, 2011 and 2010 and for the one month ended December 31, 2009 (Successor) and for the eleven months ended November 30, 2009 (Predecessor) and our report dated February 29, 2012 expressed an unqualified opinion thereon.
| /s/ BDO USA, LLP |
| BDO USA, LLP |
| Dallas, Texas |
| February 29, 2012 |
F-2
Table of Contents
Consolidated Balance Sheets
(Dollars in thousands)
| Successor | ||||||||
| December 31, 2011 |
December 31, 2010 |
|||||||
| ASSETS |
||||||||
| Current assets: |
||||||||
| Cash and cash equivalents |
$ | 76,405 | $ | 90,159 | ||||
| Restricted cash |
39,543 | 65,455 | ||||||
| Accounts receivable (net of allowance of $3,687 and $11,178 at December 31, 2011 and 2010, respectively) |
212,479 | 238,026 | ||||||
| Receivable from affiliates |
6,408 | 337 | ||||||
| Inventories |
33,061 | 129,846 | ||||||
| Other current assets |
21,839 | 39,268 | ||||||
|
|
|
|
|
|||||
| Total current assets |
389,735 | 563,091 | ||||||
|
|
|
|
|
|||||
| Property, plant and equipment (net of accumulated depreciation of $84,880 and $45,491 at December 31, 2011 and 2010, respectively) |
743,235 | 781,815 | ||||||
| Equity method investments |
327,243 | 152,020 | ||||||
| Goodwill |
9,453 | 107,823 | ||||||
| Other intangible assets (net of accumulated amortization of $4,336 and $6,677 at December 31, 2011 and 2010, respectively) |
8,950 | 32,264 | ||||||
| Other assets, net |
12,565 | 30,175 | ||||||
|
|
|
|
|
|||||
| Total assets |
$ | 1,491,181 | $ | 1,667,188 | ||||
|
|
|
|
|
|||||
| LIABILITIES AND OWNERS’ EQUITY |
||||||||
| Current liabilities: |
||||||||
| Accounts payable |
$ | 145,236 | $ | 153,528 | ||||
| Payable to affiliates |
6,871 | 257 | ||||||
| Accrued liabilities |
55,489 | 63,355 | ||||||
| Payables to pre-petition creditors |
37,800 | 74,817 | ||||||
| Deferred revenue |
23,031 | 12,604 | ||||||
| Other current liabilities |
2,026 | 16,223 | ||||||
| Current portion of long-term debt |
26,058 | 12 | ||||||
|
|
|
|
|
|||||
| Total current liabilities |
296,511 | 320,796 | ||||||
|
|
|
|
|
|||||
| Liabilities subject to compromise |
||||||||
| Long-term debt |
83,277 | 348,431 | ||||||
| Deferred income taxes |
73,784 | 85,139 | ||||||
| Other noncurrent liabilities |
58,944 | 57,754 | ||||||
| Commitments and contingencies (Note 18) |
||||||||
| SemGroup Corporation owners’ equity: |
||||||||
| Common stock (Note 19) |
418 | 415 | ||||||
| Additional paid-in capital |
1,032,365 | 1,023,727 | ||||||
| Accumulated deficit |
(167,812 | ) | (170,189 | ) | ||||
| Accumulated other comprehensive income (loss) |
(13, 875 | ) | 1,115 | |||||
|
|
|
|
|
|||||
| Total SemGroup Corporation owners’ equity |
851,096 | 855,068 | ||||||
|
|
|
|
|
|||||
| Noncontrolling interests in consolidated subsidiaries |
127,569 | — | ||||||
|
|
|
|
|
|||||
| Total owners’ equity |
978,665 | 855,068 | ||||||
|
|
|
|
|
|||||
| Total liabilities and owners’ equity |
$ | 1,491,181 | $ | 1,667,188 | ||||
|
|
|
|
|
|||||
The accompanying notes are an integral part of these financial statements.
F-3
Table of Contents
Consolidated Statements of Operations and Comprehensive Income (Loss)
(Dollars in thousands, except per share amounts)
| Successor | Predecessor | |||||||||||||||||
| Year Ended December 31, 2011 |
Year Ended December 31, 2010 |
Month Ended December 31, 2009 |
Eleven Months Ended November 30, 2009 |
|||||||||||||||
| Revenues: |
||||||||||||||||||
| Product |
$ | 1,250,784 | $ | 1,354,765 | $ | 132,005 | $ | 800,265 | ||||||||||
| Service |
124,129 | 181,913 | 17,131 | 99,134 | ||||||||||||||
| Other |
104,597 | 93,656 | 8,192 | 1,836 | ||||||||||||||
|
|
|
|
|
|
|
|
|
|||||||||||
| Total revenues |
1,479,510 | 1,630,334 | 157,328 | 901,235 | ||||||||||||||
| Expenses: |
||||||||||||||||||
| Costs of products sold, exclusive of depreciation and amortization shown below |
1,154,175 | 1,265,932 | 140,036 | 744,173 | ||||||||||||||
| Operating |
157,013 | 153,440 | 16,765 | 47,307 | ||||||||||||||
| General and administrative |
77,015 | 87,237 | 8,012 | 44,248 | ||||||||||||||
| Depreciation and amortization |
51,189 | 70,882 | 8,791 | 38,974 | ||||||||||||||
| Loss on disposal or impairment of long-lived assets, net |
9,497 | 105,050 | 23,119 | 13,625 | ||||||||||||||
|
|
|
|
|
|
|
|
|
|||||||||||
| Total expenses |
1,448,889 | 1,682,541 | 196,723 | 888,327 | ||||||||||||||
|
|
|
|
|
|
|
|
|
|||||||||||
| Earnings from equity method investments |
15,004 | 1,949 | — | — | ||||||||||||||
|
|
|
|
|
|
|
|
|
|||||||||||
| Operating income (loss) |
45,625 | (50,258 | ) | (39,395 | ) | 12,908 | ||||||||||||
| Other expenses (income): |
||||||||||||||||||
| Interest expense (excluding compromised interest of $220,953 for the eleven months ended November 30, 2009) |
60,208 | 86,133 | 7,169 | 12,041 | ||||||||||||||
| Foreign currency transaction loss (gain) |
(3,450 | ) | 2,899 | (678 | ) | (3,950 | ) | |||||||||||
| Other expense (income), net |
(11,539 | ) | 1,439 | (545 | ) | (4,742 | ) | |||||||||||
|
|
|
|
|
|
|
|
|
|||||||||||
| Total other expenses, net |
45,219 | 90,471 | 5,946 | 3,349 | ||||||||||||||
|
|
|
|
|
|
|
|
|
|||||||||||
| Income (loss) from continuing operations before reorganization items and income taxes |
406 | (140,729 | ) | (45,341 | ) | 9,559 | ||||||||||||
| Reorganization items gain |
— | — | — | 3,532,443 | ||||||||||||||
|
|
|
|
|
|
|
|
|
|||||||||||
| Income (loss) from continuing operations before income taxes |
406 | (140,729 | ) | (45,341 | ) | 3,542,002 | ||||||||||||
| Income tax expense (benefit) |
(2,416 | ) | (6,223 | ) | (7,209 | ) | 6,310 | |||||||||||
|
|
|
|
|
|
|
|
|
|||||||||||
| Income (loss) from continuing operations |
2,822 | (134,506 | ) | (38,132 | ) | 3,535,692 | ||||||||||||
| Income (loss) from discontinued operations, net of income taxes |
(10 | ) | 2,434 | 215 | (141,613 | ) | ||||||||||||
|
|
|
|
|
|
|
|
|
|||||||||||
| Net income (loss) |
2,812 | (132,072 | ) | (37,917 | ) | 3,394,079 | ||||||||||||
| Less: net income (loss) attributable to noncontrolling interests |
435 | 225 | (25 | ) | (505 | ) | ||||||||||||
|
|
|
|
|
|
|
|
|
|||||||||||
| Net income (loss) attributable to SemGroup |
$ | 2,377 | $ | (132,297 | ) | $ | (37,892 | ) | $ | 3,394,584 | ||||||||
|
|
|
|
|
|
|
|
|
|||||||||||
| Net income (loss) |
$ | 2,812 | $ | (132,072 | ) | $ | (37,917 | ) | $ | 3,394,079 | ||||||||
| Other comprehensive income (loss): |
||||||||||||||||||
| Currency translation adjustments |
(13,075 | ) | 6,475 | (4,180 | ) | 28,109 | ||||||||||||
| Other, net of income tax |
(1,915 | ) | (2,026 | ) | 846 | — | ||||||||||||
|
|
|
|
|
|
|
|
|
|||||||||||
| Total other comprehensive income (loss) |
(14,990 | ) | 4,449 | (3,334 | ) | 28,109 | ||||||||||||
|
|
|
|
|
|
|
|
|
|||||||||||
| Comprehensive income (loss) |
(12,178 | ) | (127,623 | ) | (41,251 | ) | 3,422,188 | |||||||||||
| Less: comprehensive income (loss) attributable to noncontrolling interests |
435 | 225 | (25 | ) | (505 | ) | ||||||||||||
|
|
|
|
|
|
|
|
|
|||||||||||
| Comprehensive income (loss) attributable to SemGroup |
$ | (12,613 | ) | $ | (127,848 | ) | $ | (41,226 | ) | $ | 3,422,693 | |||||||
|
|
|
|
|
|
|
|
|
|||||||||||
| Net income (loss) per common share (Note 20): |
||||||||||||||||||
| Basic |
$ | 0.06 | $ | (3.20 | ) | $ | (0.92 | ) | — | |||||||||
| Diluted |
$ | (0.06 | ) | $ | (3.20 | ) | $ | (0.92 | ) | — | ||||||||
The accompanying notes are an integral part of these consolidated financial statements.
F-4
Table of Contents
Consolidated Statements of Changes in Owners’ Equity (Deficit)
(Dollars in thousands)
| Partners’ Capital |
Common Stock |
Additional Paid-in Capital |
Accumulated Deficit |
Accumulated Other Comprehensive Income (Loss) |
Noncontrolling Interests |
Total Owners’ Equity (Deficit) |
||||||||||||||||||||||
| Balance at December 31, 2008 (Predecessor) |
$ | (3,382,622 | ) | $ | — | $ | — | $ | — | $ | (40,071 | ) | $ | 2,212 | $ | (3,420,481 | ) | |||||||||||
| Net loss, prior to implementation of Plan of Reorganization |
(214,616 | ) | — | — | — | — | (201 | ) | (214,817 | ) | ||||||||||||||||||
| Other comprehensive income |
— | — | — | — | 28,109 | — | 28,109 | |||||||||||||||||||||
| Distributions |
— | — | — | — | — | (86 | ) | (86 | ) | |||||||||||||||||||
|
|
|
|
|
|
|
|
|
|
|
|
|
|
|
|||||||||||||||
| Balances prior to implementation of Plan of Reorganization |
(3,597,238 | ) | — | — | — | (11,962 | ) | 1,925 | (3,607,275 | ) | ||||||||||||||||||
| Cancellation of Predecessor equity, extinguishment of debt, and fresh-start reporting |
3,597,238 | — | — | — | 11,962 | (304 | ) | 3,608,896 | ||||||||||||||||||||
| Issuance of Successor equity |
— | 414 | 1,017,264 | — | — | — | 1,017,678 | |||||||||||||||||||||
|
|
|
|
|
|
|
|
|
|
|
|
|
|
|
|||||||||||||||
| Balance at November 30, 2009 (Successor) |
— | 414 | 1,017,264 | — | — | 1,621 | 1,019,299 | |||||||||||||||||||||
| Net loss |
— | — | — | (37,892 | ) | — | (25 | ) | (37,917 | ) | ||||||||||||||||||
| Other comprehensive loss |
— | — | — | — | (3,334 | ) | — | (3,334 | ) | |||||||||||||||||||
| Distributions |
— | — | — | — | — | (25 | ) | (25 | ) | |||||||||||||||||||
| Share-based compensation expense |
— | — | 234 | — | — | — | 234 | |||||||||||||||||||||
|
|
|
|
|
|
|
|
|
|
|
|
|
|
|
|||||||||||||||
| Balance at December 31, 2009 (Successor) |
— | 414 | 1,017,498 | (37,892 | ) | (3,334 | ) | 1,571 | 978,257 | |||||||||||||||||||
| Net income (loss) |
— | — | — | (132,297 | ) | — | 225 | (132,072 | ) | |||||||||||||||||||
| Other comprehensive income |
— | — | — | — | 4,449 | — | 4,449 | |||||||||||||||||||||
| Distributions |
— | — | — | — | — | (277 | ) | (277 | ) | |||||||||||||||||||
| Share-based compensation expense |
— | — | 6,230 | — | — | — | 6,230 | |||||||||||||||||||||
| Issuance of common stock under compensation plans |
— | 1 | (1 | ) | — | — | — | — | ||||||||||||||||||||
| Deconsolidation of White Cliffs |
— | — | — | — | — | (1,371 | ) | (1,371 | ) | |||||||||||||||||||
| Other |
— | — | — | — | — | (148 | ) | (148 | ) | |||||||||||||||||||
|
|
|
|
|
|
|
|
|
|
|
|
|
|
|
|||||||||||||||
| Balance at December 31, 2010 (Successor) |
— | 415 | 1,023,727 | (170,189 | ) | 1,115 | — | 855,068 | ||||||||||||||||||||
| Net income |
— | — | — | 2,377 | — | 435 | 2,812 | |||||||||||||||||||||
| Other comprehensive loss |
— | — | — | — | (14,990 | ) | — | (14,990 | ) | |||||||||||||||||||
| Share-based compensation expense |
— | — | 8,641 | — | — | — | 8,641 | |||||||||||||||||||||
| Issuance of stock under compensation plans |
— | 3 | (3 | ) | — | — | — | — | ||||||||||||||||||||
| Net proceeds from public offering of Rose Rock Midstream, L.P. interests |
— | — | — | — | — | 127,134 | 127,134 | |||||||||||||||||||||
|
|
|
|
|
|
|
|
|
|
|
|
|
|
|
|||||||||||||||
| Balance at December 31, 2011 (Successor) |
$ | — | $ | 418 | $ | 1,032,365 | $ | (167,812 | ) | $ | (13,875 | ) | $ | 127,569 | $ | 978,665 | ||||||||||||
|
|
|
|
|
|
|
|
|
|
|
|
|
|
|
|||||||||||||||
The accompanying notes are an integral part of these financial statements.
F-5
Table of Contents
Consolidated Statements of Cash Flows
(Dollars in thousands)
| Successor | Predecessor | |||||||||||||||||
| Year Ended December 31, 2011 |
Year Ended December 31, 2010 |
Month Ended December 31, 2009 |
Eleven Months Ended November 30, 2009 |
|||||||||||||||
| Cash flows from operating activities: |
||||||||||||||||||
| Net income (loss) |
$ | 2,812 | $ | (132,072 | ) | $ | (37,917 | ) | $ | 3,394,079 | ||||||||
| Adjustments to reconcile net income (loss) to net cash provided by (used in) operating activities: |
||||||||||||||||||
| Net unrealized (gain) loss related to derivative instruments |
(14,114 | ) | (13,339 | ) | 7,113 | 24,118 | ||||||||||||
| Depreciation and amortization |
51,189 | 70,882 | 8,792 | 45,022 | ||||||||||||||
| Loss on disposal or impairment of long-lived assets, net |
9,497 | 105,050 | 23,119 | 13,493 | ||||||||||||||
| Amortization and write down of debt issuance costs |
30,338 | 23,601 | 1,028 | 1,618 | ||||||||||||||
| Non-cash reorganization items |
— | — | — | (4,266,588 | ) | |||||||||||||
| Deferred tax benefit |
(9,847 | ) | (13,719 | ) | (5,692 | ) | (1,350 | ) | ||||||||||
| Non-cash compensation expense |
8,641 | 6,230 | 234 | — | ||||||||||||||
| Provision for uncollectible accounts receivable, net of recoveries |
(7,421 | ) | 10,613 | — | 16,648 | |||||||||||||
| Currency (gain) loss |
(3,450 | ) | 2,901 | (68 | ) | (6,445 | ) | |||||||||||
| Changes in operating assets and liabilities (Note 24) |
6,396 | 62,420 | 198 | 229,953 | ||||||||||||||
|
|
|
|
|
|
|
|
|
|||||||||||
| Net cash provided by (used in) operating activities |
74,041 | 122,567 | (3,193 | ) | (549,452 | ) | ||||||||||||
|
|
|
|
|
|
|
|
|
|||||||||||
| Cash flows from investing activities: |
||||||||||||||||||
| Capital expenditures |
(65,995 | ) | (48,468 | ) | (7,700 | ) | (90,382 | ) | ||||||||||
| Proceeds from sale of long-lived assets |
1,125 | 24,497 | — | 75,486 | ||||||||||||||
| Investments in non-consolidated subsidiaries |
(3,717 | ) | (867 | ) | — | — | ||||||||||||
| Proceeds from sale of non-consolidated affiliate |
— | 140,765 | — | 3,901 | ||||||||||||||
| Proceeds from the sale of SemStream assets |
93,054 | — | — | — | ||||||||||||||
| Distributions from White Cliffs in excess of equity in earnings |
12,455 | 3,819 | — | — | ||||||||||||||
| Reconsolidation (deconsolidation) of subsidiaries (Note 5) |
— | (5,519 | ) | — | 17,541 | |||||||||||||
| Proceeds from surrender of life insurance |
— | 7,016 | — | — | ||||||||||||||
| Other |
— | — | (268 | ) | (1,529 | ) | ||||||||||||
|
|
|
|
|
|
|
|
|
|||||||||||
| Net cash provided by (used in) investing activities |
36,922 | 121,243 | (7,968 | ) | 5,017 | |||||||||||||
|
|
|
|
|
|
|
|
|
|||||||||||
| Cash flows from financing activities: |
||||||||||||||||||
| Debt issuance costs |
(12,533 | ) | (1,958 | ) | — | (6,228 | ) | |||||||||||
| Borrowings on debt and other obligations |
263,905 | 159,213 | — | 114,529 | ||||||||||||||
| Principal payments on debt and other obligations |
(503,189 | ) | (348,734 | ) | (13,953 | ) | (101,876 | ) | ||||||||||
| Net proceeds from sale of limited partner interests in Rose Rock Midstream, L.P. |
127,134 | — | — | — | ||||||||||||||
| Distributions |
— | (277 | ) | (25 | ) | (86 | ) | |||||||||||
|
|
|
|
|
|
|
|
|
|||||||||||
| Net cash provided by (used in) financing activities |
(124,683 | ) | (191,756 | ) | (13,978 | ) | 6,339 | |||||||||||
|
|
|
|
|
|
|
|
|
|||||||||||
| Effect of exchange rate changes on cash and cash equivalents |
(34 | ) | (3,812 | ) | (642 | ) | 444 | |||||||||||
| Net increase (decrease) in cash and cash equivalents |
(13,754 | ) | 48,242 | (25,781 | ) | (537,652 | ) | |||||||||||
| Cash and cash equivalents at beginning of period |
90,159 | 41,917 | 67,698 | 605,350 | ||||||||||||||
|
|
|
|
|
|
|
|
|
|||||||||||
| Cash and cash equivalents at end of period |
$ | 76,405 | $ | 90,159 | $ | 41,917 | $ | 67,698 | ||||||||||
|
|
|
|
|
|
|
|
|
|||||||||||
The accompanying notes are an integral part of these financial statements.
F-6
Table of Contents
Notes to Consolidated Financial Statements
| 1. | OVERVIEW |
SemGroup Corporation is a Delaware corporation headquartered in Tulsa, Oklahoma that provides diversified services for end-users and consumers of crude oil, natural gas, natural gas liquids, refined products and asphalt. SemGroup Corporation began operations on November 30, 2009, as the successor entity of SemGroup, L.P., which was an Oklahoma limited partnership.
On July 22, 2008 (the “Petition Date”), SemGroup, L.P. and certain subsidiaries filed petitions for reorganization under Chapter 11 of the U.S. Bankruptcy Code. Also on July 22, 2008, SemGroup, L.P.’s Canadian subsidiaries filed applications for creditor protection in Canada under the Companies’ Creditors Arrangement Act (the “CCAA”). Later during 2008, certain other U.S. subsidiaries filed petitions for reorganization. While in bankruptcy, SemGroup, L.P. filed a Plan of Reorganization with the court, which was confirmed on October 28, 2009. The Plan of Reorganization determined, among other things, how pre-Petition Date obligations would be settled, the equity structure of the reorganized company upon emergence, and the financing arrangements upon emergence. SemGroup Corporation emerged from bankruptcy on November 30, 2009 (the “Emergence Date”).
The accompanying consolidated financial statements include the activities of SemGroup Corporation (the “Successor”) from November 30, 2009 through December 31, 2011, and the activities of SemGroup, L.P. (the “Predecessor”) from January 1, 2009 through November 30, 2009. The terms “we,” “our,” “us,” “the Company” and similar language used in these notes to consolidated financial statements refer to SemGroup Corporation, SemGroup, L.P. and their subsidiaries. As described in Note 3, we applied fresh-start reporting on the Emergence Date. As a result, the financial statements of the Successor are not comparable to the financial statements of the Predecessor.
Our reportable segments include the following:
| • | We previously referred to our crude business as SemCrude, but following the contribution of SemCrude, L.P. to Rose Rock, we have decided to refer to this reportable business as “Crude”. Crude conducts crude oil transportation, storage, terminalling, gathering, blending, and marketing operations in the United States. Crude’s assets include |
| • | a 2% general partner interest and a 57.0% limited partner interest in Rose Rock Midstream, L.P. (“Rose Rock”), which owns an approximate 640-mile crude oil pipeline network in Kansas and Oklahoma, a crude oil gathering, storage and marketing business in the Bakken Shale in North Dakota and Montana and a crude oil storage facility in Cushing, Oklahoma with a capacity of 5.0 million barrels; and |
| • | a 51% ownership interest in White Cliffs Pipeline, L.L.C., (“White Cliffs”) which owns a 527-mile pipeline that transports crude oil from Platteville, Colorado to Cushing, Oklahoma (“White Cliffs Pipeline”). |
| • | SemStream, which owns 8,932,031 common units representing 32.2% of the total limited partner interests, as of December 31, 2011, in NGL Energy Partners LP (“NGL Energy”), which markets, transports and stores natural gas liquids in the United States, and a 7.5% interest in the general partner of NGL Energy. SemStream also owns and operates a residential propane supply business in Page and Payson, Arizona. |
| • | SemCAMS, which provides natural gas gathering and processing services in Alberta, Canada. SemCAMS owns working interests in, and operates, four natural gas processing plants and a network of 600 miles of natural gas gathering and transportation pipelines. |
F-7
Table of Contents
SEMGROUP CORPORATION
Notes to Consolidated Financial Statements
| 1. | OVERVIEW, Continued |
| • | SemGas, which provides natural gas gathering and processing services in the United States. SemGas owns and operates over 800 miles of gathering pipelines in Kansas, Oklahoma, and Texas and three processing plants in Oklahoma and Texas. |
| • | SemLogistics, which provides refined product and crude oil storage services in the United Kingdom. SemLogistics owns a facility in Wales that has a storage capacity of approximately 8.7 million barrels. |
| • | SemMexico, which purchases, produces, stores, and distributes liquid asphalt cement products in Mexico. SemMexico operates twelve manufacturing plants and two emulsion distribution terminals. |
We previously had a seventh segment, SemCanada Crude, which aggregated and blended crude oil in Western Canada. Due to adverse market conditions impacting this segment, we sold the property, plant and equipment of SemCanada Crude in late 2010 and began winding down its operations (Note 6).
We disposed of numerous assets while in bankruptcy, including (Notes 6 and 7):
| • | SemFuel, a refined products marketing and storage business in the United States; |
| • | SemMaterials, an asphalt processing, storage, and marketing business in the United States; |
| • | SemEuro Supply, a refined products marketing business in Europe; |
| • | SemCanada Energy, a natural gas marketing business in Canada; |
| • | SemGroup Energy Partners, L.P. (“SemGroup Energy Partners” or “SGLP”), a crude oil and asphalt storage business in the United States (currently known as Blueknight Energy Partners, L.P.); and |
| • | certain other businesses, none of which were significant to these consolidated financial statements. |
| 2. | CONSOLIDATION AND BASIS OF PRESENTATION |
The accompanying consolidated financial statements have been prepared in accordance with accounting principles generally accepted in the United States.
Consolidated subsidiaries
Our consolidated financial statements include the accounts of our controlled subsidiaries, including Rose Rock Midstream, L.P. All significant transactions between our consolidated subsidiaries have been eliminated. Outside ownership interests in consolidated subsidiaries are reported as non-controlling interests in the consolidated financial statements.
Proportionally consolidated assets
Our SemCAMS segment owns undivided interests in certain natural gas gathering and processing assets, for which we record only our proportionate share of the assets on the consolidated balance sheets. The net book value of the property, plant and equipment recorded by us associated with these undivided interests is approximately $167.4 million at December 31, 2011. We serve as operator of these facilities and incur the costs of operating the facilities (recorded as operating expenses in the consolidated statements of operations) and charge the other owners for their proportionate share of the costs (recorded as other revenue in the consolidated statements of operations).
Equity method investments
At the end of September 2010, we sold a portion of our ownership interests in White Cliffs to two unaffiliated parties, which reduced our ownership interest in White Cliffs from approximately 99% to 51%.
F-8
Table of Contents
SEMGROUP CORPORATION
Notes to Consolidated Financial Statements
| 2. | CONSOLIDATION AND BASIS OF PRESENTATION, Continued |
Upon closing of this sale, the other owners received substantive rights to participate in the management of White Cliffs. Because of this, we deconsolidated White Cliffs at the end of September 2010, and began accounting for it under the equity method.
On November 1, 2011, we contributed the long-lived assets and certain working capital of our SemStream segment to NGL Energy in return for limited partner interests in NGL Energy, an interest in the general partner of NGL Energy, and cash for working capital. We hold two seats on the board of directors of the general partner of NGL Energy, and we account for our investment in NGL Energy and its general partner under the equity method.
Cost method investments
We lost control of several of our subsidiaries as a direct or indirect result of the bankruptcy petitions, including all Canadian subsidiaries, SemGroup Holdings, L.P. (which held our ownership interests in SemGroup Energy Partners), and Wyckoff Gas Storage Company, L.L.C. These subsidiaries were de-consolidated during 2008 and subsequently accounted for as cost method investments. We regained control of SemCAMS and SemCanada Crude on the Emergence Date, and consolidated these subsidiaries again beginning on that date.
Discontinued operations
As part of the process of reorganizing to emerge from bankruptcy, we disposed of certain of our operations. As described in Note 7, SemFuel, SemMaterials, and SemEuro Supply met the criteria to be classified as discontinued operations in the consolidated financial statements.
| 3. | SUMMARY OF SIGNIFICANT ACCOUNTING POLICIES |
USE OF ESTIMATES—The preparation of financial statements in conformity with accounting principles generally accepted in the United States requires management to make estimates and assumptions that affect the amounts and disclosures in the financial statements. Our significant estimates include, but are not limited to: (1) allowances for doubtful accounts receivable; (2) estimated useful lives of assets, which impact depreciation; (3) estimated fair values of long-lived assets recorded in fresh-start reporting; (4) estimated fair values of long-lived assets used in impairment tests; (5) fair values of derivative instruments; and (6) accrual and disclosure of contingent losses. Although management believes these estimates are reasonable, actual results could differ materially from these estimates.
FRESH-START REPORTING—We adopted fresh-start reporting on the Emergence Date. In connection with fresh-start reporting, we recorded the following at the Emergence Date:
| • | assets, at their estimated fair values; |
| • | goodwill, to the extent our reorganization value (described in Note 8) exceeded the amounts attributed to specific tangible or identified intangible assets; |
| • | liabilities, at their fair values; and |
| • | deferred tax liabilities, based on the adjusted balances of the assets to which they relate. |
CASH AND CASH EQUIVALENTS—Cash includes currency on hand and demand and time deposits with banks or other financial institutions. Cash equivalents include highly liquid investments with maturities of three months or less at the date of purchase. Balances at financial institutions may exceed federally insured limits.
F-9
Table of Contents
SEMGROUP CORPORATION
Notes to Consolidated Financial Statements
| 3. | SUMMARY OF SIGNIFICANT ACCOUNTING POLICIES, Continued |
RESTRICTED CASH—As described in Note 8, our Plan of Reorganization specified the total amount of consideration we would provide to all pre-petition creditors in settlement of their claims. At December 31, 2011, we had not yet completed the process of disbursing funds to settle pre-petition claims, as we had not yet completed the process of resolving all of the claims. The restricted cash balance at December 31, 2011 includes $37.5 million of cash that is restricted for this purpose. The December 31, 2011 restricted cash balance also includes $2.0 million of cash that is restricted for other purposes.
ACCOUNTS RECEIVABLE—Accounts receivable are reported net of the allowance for doubtful accounts. Our assessment of the allowance for doubtful accounts is based on several factors, including the overall creditworthiness of our customers, existing economic conditions, and the amount and age of past due accounts. We enter into netting arrangements with certain counterparties to help mitigate credit risk. Receivables subject to netting are presented as gross receivables (with the related accounts payable also presented gross) until such time as the balances are settled. Receivables are considered past due if full payment is not received by the contractual due date. Past due accounts are written off against the allowance for doubtful accounts only after all collection attempts have been exhausted.
At the Emergence Date, as part of fresh-start reporting, we recorded accounts receivable at fair value. This was accomplished by reducing the allowance for doubtful accounts to $-0- and recording a corresponding reduction to accounts receivable. We report any amounts we have collected in excess of the estimated Emergence Date fair value as reductions to operating expenses in the consolidated statements of operations.
INVENTORIES—Inventories primarily consist of natural gas and natural gas liquids, crude oil, and asphalt. Inventories are valued at the lower of cost or market, with cost generally determined using the weighted-average method. The cost of inventory includes applicable transportation costs.
We enter into exchanges with third parties whereby we acquire products that differ in location, grade, or delivery date from products we have available for sale. These exchanges are valued at cost, and although a transportation, location or product differential may be recorded, generally no gain or loss is recognized.
PROPERTY, PLANT AND EQUIPMENT—Property, plant and equipment is recorded at cost (although, as described above, property, plant and equipment was adjusted to fair value at November 30, 2009 upon adoption of fresh-start reporting). We capitalize costs that extend or increase the future economic benefits of property, plant and equipment, and expense maintenance costs that do not. When assets are disposed of, their cost and related accumulated depreciation are removed from the balance sheet, and any resulting gain or loss is recorded as a gain or loss on disposal or impairment of long-lived assets in the consolidated statements of operations.
Depreciation is calculated primarily on the straight-line method over the following estimated useful lives:
| Pipelines and related facilities |
10 – 31 years | |||
| Storage and terminal facilities |
10 – 25 years | |||
| Natural gas gathering and processing facilities |
10 – 31 years | |||
| Office and other property and equipment |
3 – 31 years |
LINEFILL—Pipelines and storage facilities generally require a minimum volume of product in the system to enable the system to operate. Such product, known as linefill, is generally not available to be withdrawn from the system. Linefill owned by us in facilities operated by us is recorded at historical cost, is included in property, plant and equipment in the consolidated balance sheets, and is not depreciated. We also own linefill in third party facilities, which is included in inventory or in other noncurrent assets on the consolidated balance sheets.
F-10
Table of Contents
SEMGROUP CORPORATION
Notes to Consolidated Financial Statements
| 3. | SUMMARY OF SIGNIFICANT ACCOUNTING POLICIES, Continued |
IMPAIRMENT OF LONG-LIVED ASSETS—We test long-lived asset groups for impairment when events or circumstances indicate that the net book value of the asset group may not be recoverable. We test an asset group for impairment by estimating the undiscounted cash flows expected to result from its use and eventual disposition. If the estimated undiscounted cash flows are lower than the net book value of the asset group, we then estimate the fair value of the asset group and record a reduction to the net book value of the assets and a corresponding impairment loss.
GOODWILL—We test goodwill for impairment on an annual basis, or more often if circumstances warrant, by estimating the fair value of the asset group to which the goodwill relates and comparing this fair value to the net book value of the asset group. If fair value is less than net book value, we estimate the implied fair value of goodwill, reduce the book value of the goodwill to the implied fair value, and record a corresponding impairment loss. Prior to the Emergence Date, SemGroup L.P.’s policy was to test goodwill for impairment on December 31 of each year. Subsequent to the Emergence Date, SemGroup Corporation’s policy is to test goodwill for impairment on October 1 of each year. See Note 6 for discussion of goodwill impairment.
During September 2011, the Financial Accounting Standards Board (“FASB”) issued Accounting Standards Update (“ASU”) No. 2011-08, “Testing Goodwill for Impairment”. This ASU is designed to simplify how entities test goodwill for impairment. Under the new standard, an entity may first assess qualitative factors to determine whether it is more likely than not that the fair value of an asset group is less than the carrying amount, for the purpose of determining whether it is necessary to estimate the fair value of the asset group to which the goodwill relates. We plan to adopt this new standard in 2012.
EQUITY METHOD INVESTMENTS—We account for an investment under the equity method when we have significant influence over, but not control of, the significant operating decisions of the investee. Under the equity method, we record in the consolidated statements of operations our share of the earnings or losses of the investee, with a corresponding adjustment to the investment balance on our consolidated balance sheet. When we receive a distribution from an equity method investee, we record a corresponding reduction to the investment balance.
For equity method investments for which we do not expect earnings information to be consistently available to record earnings in the quarter in which they are generated, our policy is to record equity earnings on a one-quarter lag. This does not have a material impact on our financial statements.
DEBT ISSUANCE COSTS—Costs incurred in connection with the issuance of long-term debt are reported as other noncurrent assets and are amortized to interest expense using the straight-line method over the term of the related debt. Use of the straight-line method of amortization does not differ materially from the “effective interest” method.
COMMODITY DERIVATIVE INSTRUMENTS—We generally record the fair value of commodity derivative instruments on the consolidated balance sheets and the change in fair value as an increase or decrease to product revenue.
As shown in Note 15, the fair value of commodity derivatives at December 31, 2011 and 2010 are recorded to other current assets or other current liabilities on the consolidated balance sheets. Related margin deposits are recorded to other current assets or other current liabilities on the consolidated balance sheets. Margin deposits are not generally netted against derivative assets or liabilities.
The fair value of a derivative contract is determined based on the nature of the transaction and the market in which the transaction was executed. Quoted market prices, when available, are used to value derivative transactions. In situations where quoted market prices are not readily available, we estimate the fair value
F-11
Table of Contents
SEMGROUP CORPORATION
Notes to Consolidated Financial Statements
| 3. | SUMMARY OF SIGNIFICANT ACCOUNTING POLICIES, Continued |
using other valuation techniques that reflect the best information available under the circumstances. Fair value measurements of derivative assets include consideration of counterparty credit risk. Fair value measurements of derivative liabilities include consideration of our creditworthiness.
We have elected “normal purchase” and “normal sale” treatment for certain commitments to purchase or sell petroleum products at future dates. This election is only available when a transaction that would ordinarily meet the definition of a derivative but instead is expected to result in physical delivery of product over a reasonable period in the normal course of business and is not expected to be net settled. Agreements accounted for under this election are not recorded at fair value; instead, the transaction is recorded when the product is delivered.
PAYABLES TO PRE-PETITION CREDITORS—As described in Note 8, our Plan of Reorganization specified the total amount of consideration we would provide to all pre-petition creditors in settlement of their claims. At December 31, 2011, we had not yet completed the process of disbursing funds to settle pre-petition claims, as we had not yet completed the process of resolving all of the claims. We recorded a liability of $38.7 million at December 31, 2011 associated with these obligations, $0.9 million of which is associated with discontinued operations and is reported within other current liabilities. Of this amount, $37.5 million is held in cash accounts which are restricted for this purpose. The remaining amount is associated with certain accounts receivable and other current assets. Any proceeds received from these assets will be remitted to pre-petition creditors.
CONTINGENT LOSSES—We record a liability for a contingent loss when it is probable that a loss has been incurred and the amount of the loss can be reasonably estimated. We record attorneys’ fees incurred in connection with a contingent loss at the time the fees are incurred. We do not record liabilities for attorneys’ fees that are expected to be incurred in the future.
ASSET RETIREMENT OBLIGATIONS—Asset retirement obligations include legal or contractual obligations associated with the retirement of long-lived assets, such as requirements to incur costs to dispose of equipment or to remediate the environmental impacts of the normal operation of the assets. We record liabilities for asset retirement obligations when a known obligation exists under current law or contract and when a reasonable estimate of the value of the liability can be made.
DISCONTINUED OPERATIONS—SemMaterials, SemFuel, and SemEuro Supply are presented as discontinued operations in the consolidated financial statements. We classify a component of our business as a discontinued operation when we commit to a plan to sell the component and believe it is probable that a sale will be completed within one year. A component that is disposed of in a manner other than by sale is classified as discontinued when the component is actually disposed. Investments accounted for under the equity method, or the cost method, do not qualify for treatment as discontinued operations. A component that is disposed of may not qualify for treatment as a discontinued operation if we have significant continuing involvement in the operations of the component after the disposal.
Once a component meets the requirements to be classified as a discontinued operation, previous financial statements are retrospectively adjusted to reflect the component as a discontinued operation for all periods presented. Income and losses of discontinued operations (excluding corporate general and administrative expense allocations) are combined into one line on the consolidated statements of operations. The cash flows from discontinued operations are not separately identified in the consolidated statements of cash flows.
REVENUE RECOGNITION—Sales of product, as well as gathering and marketing revenues, are recognized at the time title to the product transfers to the purchaser, which typically occurs upon receipt of the product by the purchaser. Terminal and storage revenues are recognized at the time the service is
F-12
Table of Contents
SEMGROUP CORPORATION
Notes to Consolidated Financial Statements
| 3. | SUMMARY OF SIGNIFICANT ACCOUNTING POLICIES, Continued |
performed. Revenue for the transportation of product is recognized upon delivery of the product to its destination. Certain revenue transactions are reported on a net basis, including derivative instruments considered held for trading purposes and certain buy/sell transactions (see “Purchases and Sales of Inventory with the Same Counterparty”). Taxes collected from customers and remitted to governmental authorities are recorded on a net basis (excluded from revenue).
COSTS OF PRODUCTS SOLD—Costs of products sold consists of the cost to purchase the product, the cost to transport the product to the point of sale, and the cost to store the product until it is sold.
PURCHASES AND SALES OF INVENTORY WITH THE SAME COUNTERPARTY—We routinely enter into transactions to purchase inventory from, and sell inventory to, the same counterparty. Such transactions that are entered into in contemplation of one another are recorded on a net basis.
INTEREST EXPENSE DURING REORGANIZATION—While we were in bankruptcy, we only recorded interest expense to the extent such interest was expected to be paid. Interest obligations that were expected to be compromised in the reorganization process (i.e., not paid in full) were not recorded as expenses. The total amount of interest that we would have been contractually obligated to pay, but which was compromised in the reorganization process and not recorded as an expense, was $221.0 million for the eleven months ended November 30, 2009.
CURRENCY TRANSLATION—The consolidated financial statements are presented in U.S. dollars. Our segments operate in four countries, and each segment has identified a “functional currency,” which is the primary currency in the environment in which the segment operates. The functional currencies include the U.S. dollar, the Canadian dollar, the British pound sterling, and the Mexican peso.
At the end of each reporting period, the assets and liabilities of each segment are translated from its functional currency to U.S. dollars using the exchange rate at the end of the month. The monthly results of operations of each segment are generally translated from its functional currency to U.S. dollars using the average exchange rate during the month. Changes in exchange rates result in currency translation gains and losses, which are recorded within other comprehensive income (loss).
Certain segments also enter into transactions in currencies other than their functional currencies. At the end of each reporting period, each segment re-measures the related receivables, payables, and cash to its functional currency using the exchange rate at the end of the period. Changes in exchange rates between the time the transactions were entered into and the end of the reporting period result in currency transaction gains or losses, which are recorded in the consolidated statements of operations.
INCOME TAXES—Deferred income taxes are accounted for under the liability method, which takes into account the differences between the basis of the assets and liabilities for financial reporting purposes and amounts recognized for income tax purposes. We record valuation allowances on deferred tax assets when, in the opinion of management, it is more likely than not that the asset will not be recovered.
We monitor uncertain tax positions and we recognize tax benefits only when management believes the relevant tax positions would more likely than not be sustained upon examination. We record any interest and any penalties related to income taxes within income tax expense in the consolidated statements of operations.
REORGANIZATION ITEMS—As described in Note 1, we operated as a debtor-in-possession subject to the jurisdiction of the bankruptcy court during the eleven months ended November 30, 2009. Revenues, expenses, realized gains and losses, and provisions for losses resulting from the reorganization and restructuring of the business during that period are reported as reorganization items in the consolidated statement of operations. The effects of the adjustments to the reported amounts of assets and liabilities
F-13
Table of Contents
SEMGROUP CORPORATION
Notes to Consolidated Financial Statements
| 3. | SUMMARY OF SIGNIFICANT ACCOUNTING POLICIES, Continued |
resulting from the adoption of fresh-start reporting and the effects of the forgiveness of debt in the reorganization are reported within reorganization items in the consolidated statement of operations for the eleven months ended November 30, 2009.
RECLASSIFICATIONS—Certain reclassifications have been made to conform prior year balances to the current year presentation.
EQUITY-BASED COMPENSATION—We grant certain of our employees equity-based compensation awards which vest contingent on continued service of the recipient or on their achievement of specific performance targets. We record compensation expense for these outstanding awards over applicable service or performance periods based on their grant date fair value with a corresponding increase to additional paid-in capital.
COMPREHENSIVE INCOME (LOSS) AND ACCUMULATED OTHER COMPREHENSIVE INCOME (LOSS)—Comprehensive income (loss) is defined as a change in equity of a business enterprise during a period from transactions and other events and circumstances from non-owner sources and includes all changes in equity during a period except those resulting from investments by owners and distributions to owners. Our comprehensive income (loss) consists of currency translation adjustments, changes in the funded status of pension benefit plans and changes in the fair value of interest rate swaps.
During June 2011, the FASB issued ASU No. 2011-05, “Presentation of Comprehensive Income”. This ASU is designed to improve the comparability, consistency and transparency of financial reporting and to increase the prominence of items reported in other comprehensive income. The amendments require that all non-owner changes in stockholders’ equity be presented either in a single continuous statement of comprehensive income or in two separate but consecutive statements. This standard is complied with in these consolidated financial statements.
In December 2011, the FASB issued ASU 2011-12, “Deferral of the Effective Date for Amendments to the Presentation of Reclassifications of Items Out of Accumulated Other Comprehensive Income in Accounting Standards Update No. 2011-05,” which deferred certain presentation requirements in ASU 2011-05 for items reclassified out of accumulated other comprehensive income. We plan to adopt this standard in 2012.
| 4. | ROSE ROCK MIDSTREAM, L.P. |
On December 14, 2011, our subsidiary Rose Rock Midstream, L.P. completed an initial public offering in which it sold 7,000,000 common units representing limited partner interests. We received proceeds of $127.1 million from this offering, net of underwriter discounts and other fees associated with the offering. We used these proceeds to make principal payments on long-term debt.
Subsequent to the initial public offering, we own 59% of the partnership consisting of 57% limited partner interests that include 1,389,709 common units and 8,389,709 subordinated units and the entire 2% general partner interest (342,437 units) of Rose Rock. We also own certain incentive distribution rights, which are described below. We control the operations of Rose Rock through our ownership of the general partner interest, and we continue to consolidate Rose Rock. The outside ownership interests in Rose Rock are reflected in “non-controlling interests in consolidated subsidiaries” on our consolidated balance sheet at December 31, 2011. The portion of the net income of Rose Rock subsequent to the initial public offering that is attributable to outside owners is reflected within “net income attributable to non-controlling interests” in our consolidated statement of operations for the year ended December 31, 2011.
F-14
Table of Contents
SEMGROUP CORPORATION
Notes to Consolidated Financial Statements
| 4. | ROSE ROCK MIDSTREAM, L.P., Continued |
Rose Rock intends to pay a minimum quarterly distribution of $0.3625 per unit to the extent it has sufficient available cash, as defined in Rose Rock’s partnership agreement. Rose Rock’s partnership agreement requires Rose Rock to distribute all of its available cash each quarter in the following manner:
| • | first, 98.0% to the holders of common units and 2.0% to the general partner, until each common unit has received the minimum quarterly distribution of $0.3625, plus any arrearages from prior quarters; |
| • | second, 98.0% to the holders of subordinated units and 2.0% to the general partner, until each subordinated unit has received the minimum quarterly distribution of $0.3625; and |
| • | third, 98.0% to all unitholders, pro rata, and 2.0% to the general partner, until each unit has received a distribution of $0.416875. If cash distributions to the unitholders exceed $0.416875 per unit in any quarter, the general partner will receive, in addition to distributions on its 2.0% general partner interest, increasing percentages, up to 48.0%, of the cash Rose Rock distributes in excess of that amount. |
On January 23, 2012, Rose Rock declared a distribution of $0.0670 per unit. This distribution is the first declared by Rose Rock and the prorated amount corresponds to its minimum quarterly cash distribution of $0.3625 per unit, or $1.45 per unit on an annualized basis. The proration period began immediately after the closing of Rose Rock Midstream’s initial public offering, December 14, 2011, and continued through December 31, 2011. The distribution was paid on February 13, 2012 to all unitholders of record on February 3, 2012. Of this distribution, $0.7 million was paid to us and $0.5 million was paid to outside owners.
Certain summarized balance sheet information of Rose Rock as of December 31, 2011 is shown below (in thousands):
| Cash |
$ | 9,709 | ||
| Other current assets |
156,873 | |||
| Property, plant and equipment |
276,246 | |||
| Other noncurrent assets |
2,666 | |||
|
|
|
|||
| Total assets |
$ | 445,494 | ||
|
|
|
|||
| Current liabilities |
$ | 140,553 | ||
| Long-term debt |
87 | |||
| Partners’ capital attributable to SemGroup |
177,323 | |||
| Partners’ capital attributable to noncontrolling interests |
127,531 | |||
|
|
|
|||
| Total liabilities and partners’ capital |
$ | 445,494 | ||
|
|
|
| 5. | INVESTMENTS IN NON-CONSOLIDATED SUBSIDIARIES |
White Cliffs
Until the end of September 2010, we owned 99.17% of White Cliffs, and the remaining interests were held by two unaffiliated parties. During 2010, both of these parties exercised their rights under an agreement to purchase additional ownership interests in White Cliffs. Subsequent to the closing of these transactions, we own 51% of White Cliffs. After purchasing these ownership interests, the other owners have substantive rights to participate in the management of White Cliffs; because of this, we deconsolidated White Cliffs at the end of September 2010, and began accounting for it under the equity method.
F-15
Table of Contents
SEMGROUP CORPORATION
Notes to Consolidated Financial Statements
| 5. | INVESTMENTS IN NON-CONSOLIDATED SUBSIDIARIES, Continued |
Certain summarized balance sheet information of White Cliffs is shown below (in thousands):
| December 31, 2011 |
(unaudited) December 31, 2010 |
|||||||
| Current assets |
$ | 11,653 | $ | 9,797 | ||||
| Property, plant and equipment, net |
222,473 | 234,300 | ||||||
| Goodwill |
17,000 | 17,000 | ||||||
| Other intangible assets, net |
33,073 | 40,848 | ||||||
|
|
|
|
|
|||||
| Total assets |
$ | 284,199 | $ | 301,945 | ||||
|
|
|
|
|
|||||
| Current liabilities |
$ | 3,259 | $ | 3,824 | ||||
| Members’ equity |
280,940 | 298,121 | ||||||
|
|
|
|
|
|||||
| Total liabilities and members’ equity |
$ | 284,199 | $ | 301,945 | ||||
|
|
|
|
|
|||||
Under the equity method, we do not report the individual assets and liabilities of White Cliffs on our consolidated balance sheets. Instead, our ownership interest is reflected in one line as a noncurrent asset on our consolidated balance sheets.
Certain summarized income statement information of White Cliffs for the year ended December 31, 2011 and the three months ended December 31, 2010 is shown below (in thousands):
| Year Ended December 31, 2011 |
(unaudited) Three Months Ended December 31, 2010 |
|||||||
| Revenue |
$ | 66,097 | $ | 13,619 | ||||
| Operating, general and administrative expenses |
12,746 | 3,294 | ||||||
| Depreciation and amortization expense |
20,842 | 5,680 | ||||||
| Net income |
32,509 | 4,645 | ||||||
The equity in earnings of White Cliffs for the year ended December 31, 2011 reported in our consolidated statement of operations is less than 51% of the net income of White Cliffs for the same period. This is due to certain general and administrative expenses we incur in managing the operations of White Cliffs that the other owners are not obligated to share. Such expenses are recorded by White Cliffs, and are allocated to our ownership interests. White Cliffs recorded $3.2 million of such general and administrative expense during the year ended December 31, 2011 and $0.9 million during the three months ended December 31, 2010.
Our ownership percentage of White Cliffs is significant as defined by Securities and Exchange Commission’s Regulation S-X Rule 1-02(w). Accordingly, as required by Regulation S-X Rule 3-09, we have included the audited financial statements of White Cliffs as of and for the year ended December 31, 2011 and the unaudited financial statements of White Cliffs as of, and for the three months ended December 31, 2010 as an exhibit to this Form 10-K.
NGL Energy
On November 1, 2011, we acquired 8,932,031 common units representing limited partner interests in NGL Energy (which represents approximately 32.2% of the total 27,715,599 limited partner units of NGL Energy outstanding at December 31, 2011) and a 7.5% interest in the general partner of NGL Energy. As part of this transaction, we agreed to waive our distribution rights on certain of the common units for a specified period
F-16
Table of Contents
SEMGROUP CORPORATION
Notes to Consolidated Financial Statements
| 5. | INVESTMENTS IN NON-CONSOLIDATED SUBSIDIARIES, Continued |
of time. We recorded our investment in NGL Energy at the acquisition date fair value, estimated to be $184.0 million. We derived our estimate of the fair value of our limited partner interests in NGL Energy using the closing price of limited partner units on October 31, 2011, adjusted to reflect the waiver of certain distribution rights. At December 31, 2011, the aggregate value of our limited partner interests in NGL Energy was approximately $177.0 million, calculated based on the closing price of the limited partner units on December 30, 2011, adjusted to reflect the waiver of distribution rights on approximately 3.9 million units until the third quarter of 2012.
The excess of the recorded amount of our investment over the book value of our share of the underlying net assets primarily represents equity method goodwill.
At December 31, 2011, the value of our 8,932,031 common units in NGL Energy was $184.3 million, based on a December 30, 2011 closing price of $20.63 per common unit. This does not reflect our 7.5% interest in the general partner of NGL Energy and does not include any valuation adjustment related to our agreement to waive our distribution rights on certain of the common units for a specified period of time. Certain unaudited summarized balance sheet information of NGL Energy is shown below (in thousands):
| (unaudited) December 31, 2011 |
||||
| Current assets |
$ | 332,144 | ||
| Property plant and equipment, net |
227,893 | |||
| Goodwill |
92,930 | |||
| Intangible and other assets, net |
102,238 | |||
|
|
|
|||
| Total assets |
$ | 755,205 | ||
|
|
|
|||
| Current liabilities |
$ | 269,073 | ||
| Long-term debt |
117,590 | |||
| Other noncurrent liabilities |
222 | |||
| Partners’ equity |
368,320 | |||
|
|
|
|||
| Total liabilities and partners’ equity |
$ | 755,205 | ||
|
|
|
|||
Our policy is to record our equity in earnings of NGL Energy on a one-quarter lag, as we do not expect information on the earnings of NGL Energy to always be available in time to consistently record the earnings in the quarter in which they are generated. Accordingly, we have not recorded any equity in earnings of NGL Energy for the period from November 1, 2011 to December 31, 2011 in our consolidated statement of operations and comprehensive income (loss) for the year ended December 31, 2011. Certain unaudited summarized income statement information of NGL Energy for the nine months ended December 31, 2011 is shown below (in thousands):
| (unaudited) Nine Months Ended December 31, 2011 |
||||
| Revenue |
$ | 871,544 | ||
| Operating, general and administrative expenses |
869,143 | |||
| Depreciation and amortization expense |
8,480 | |||
| Net loss |
(6,079 | ) | ||
F-17
Table of Contents
SEMGROUP CORPORATION
Notes to Consolidated Financial Statements
| 5. | INVESTMENTS IN NON-CONSOLIDATED SUBSIDIARIES, Continued |
Canadian subsidiaries
On the Petition Date, our Canadian subsidiaries, which included SemCanada Crude, SemCAMS, and SemCanada Energy (collectively, the “Canadian Subsidiaries”), filed applications for creditor protection under the CCAA in Canada. Since the CCAA proceedings were administered in a different jurisdiction than that of our petition for relief under Chapter 11 of the United States Bankruptcy Code, we ceased to control the Canadian Subsidiaries, and accordingly we deconsolidated them on July 22, 2008. We regained control of SemCAMS and SemCanada Crude on the Emergence Date, and consolidated them again on that date.
SemGroup Energy Partners
Near the Petition Date, we lost control of SemGroup Energy Partners when certain creditors exercised their right to designate the members of the board of directors of its general partner. Also during 2008, SemGroup Holdings, L.P. (“SemGroup Holdings”), a wholly-owned subsidiary that held our ownership interests in SemGroup Energy Partners, filed for bankruptcy protection. SemGroup Holdings’ bankruptcy case was administered separately from our bankruptcy case, and therefore we deconsolidated SemGroup Holdings and SemGroup Energy Partners. During 2009, creditors seized all of our ownership interests in SemGroup Energy Partners. SemGroup Holdings has not emerged from bankruptcy.
| 6. | DISPOSALS AND IMPAIRMENTS OF LONG-LIVED ASSETS |
Year Ended December 31, 2011 (Successor)
Gains (losses) recorded during the year ended December 31, 2011 related to the disposal or impairment of long-lived assets included the following (in thousands):
| Event |
Segment | Pre-Tax Gain (Loss) |
||||
| Contribution of SemStream assets to NGL Energy (a) |
SemStream | $ | 44,266 | |||
| SemStream residential division impairment (b) |
SemStream | (8,684 | ) | |||
| SemLogistics goodwill impairment (c) |
SemLogistics | (44,663 | ) | |||
| (a) | On November 1, 2011, we contributed certain assets and liabilities of our SemStream segment to NGL Energy. On that date these assets and liabilities had the net book values (in thousands) below. However, these values were subject to post closing adjustments, which have since been completed, and resulted in a $2.1 million working capital adjustment. |
| Inventory |
$ | 107,858 | ||
| Other current assets |
11,263 | |||
| Property plant and equipment |
47,756 | |||
| Goodwill |
50,071 | |||
| Other intangible assets |
12,408 | |||
| Other noncurrent assets |
2,818 | |||
| Other current liabilities |
(2,947 | ) | ||
| Other noncurrent liabilities |
(172 | ) | ||
|
|
|
|||
| Net assets contributed |
$ | 229,055 | ||
|
|
|
In return for this contribution, we received $93.0 million of cash and ownership interests in NGL Energy and its general partner with an estimated fair value of $184.0 million. We recorded a gain of $44.3 million on this transaction, which includes the impact of a $2.1 million working capital
F-18
Table of Contents
SEMGROUP CORPORATION
Notes to Consolidated Financial Statements
| 6. | DISPOSALS AND IMPAIRMENTS OF LONG-LIVED ASSETS, Continued |
adjustment and the write-off of $1.6 million of software. Additionally, $2.2 million of capitalized loan fees were written-off as a result of long-term debt payments made from the proceeds of this transaction.
| (b) | We test all of our goodwill for impairment as of October 1 of each year. Upon completing this impairment test for 2011, we concluded that the goodwill and other intangible assets attributable to the Arizona residential business of our SemStream segment (which was not contributed to NGL Energy) were impaired. To calculate the impairment loss, we estimated the fair value of this reporting unit using the present value of estimated future cash flows, discounted at a rate of 9.4%, and recorded a full impairment of the $3.6 million balance of goodwill and the $5.0 million balance of other intangible assets associated with customer relationships. No impairment was recorded related to the regulated assets of the Arizona residential business in accordance with FASB ASC Topic 980 – Regulated Operations. |
| (c) | High crude oil prices and backwardated market conditions in 2011 had a negative effect on SemLogistic’s storage economics. As a result, the demand for storage is depressed and SemLogistics has had difficulty securing contract renewals. SemLogistics successfully passed the initial 2011 goodwill impairment test. However, a review of the sensitivity of the test results indicated that a ten percent reduction in the estimated revenue in 2012 and 2013 would result in a test failure. In addition, we received notice in late January 2012 from two customers that their intentions were not to renew their storage contracts upon expiration. These notifications, coupled with the sensitivity of the test results to loss of revenue, led us to conclude that impairment of the goodwill of SemLogistics was required. Accordingly, we impaired the full amount of goodwill which was $44.7 million at October 1, 2011. |
Year Ended December 31, 2010 (Successor)
Losses recorded during the year ended December 31, 2010 related to the disposal or impairment of long-lived assets included the following (in thousands):
| Event |
Segment | Loss | ||||
| SemCanada Crude impairment (a) |
Corporate and other | $ | (91,756 | ) | ||
| Deconsolidation of White Cliffs (b) |
SemCrude | (6,828 | ) | |||
| SemMexico goodwill impairment (c) |
SemMexico | (8,863 | ) | |||
| (a) | During the year ended December 31, 2010, we revised downward our projections of the future earnings potential of the SemCanada Crude segment, following a significant loss of customers, coupled with a significant decline in profitability and an assessment by a national consultancy firm that certain market conditions that are adversely impacting this segment were likely to continue. In response to these events, we tested SemCanada Crude’s goodwill and other intangible assets for impairment as of May 31, 2010. |
During December 2010, we completed the sale of the property, plant and equipment of the SemCanada Crude segment. The proceeds from the sale were not significantly different than the net book value of the assets sold. Certain marketing operations in the Northern United States that were previously conducted with the participation of the SemCanada Crude segment are now being conducted in their entirety by the SemCrude segment, and the remaining operations of the SemCanada Crude segment were wound down.
F-19
Table of Contents
SEMGROUP CORPORATION
Notes to Consolidated Financial Statements
| 6. | DISPOSALS AND IMPAIRMENTS OF LONG-LIVED ASSETS, Continued |
| (b) | As described in Note 5, we sold a portion of our ownership interests in White Cliffs during September 2010. We received $140.8 million of proceeds from these transactions, which were used to make principal payments on long-term debt. These proceeds may be adjusted upward upon final resolution of certain post-closing adjustments. |
| Accounts receivable |
$ | 4,625 | ||
| Other current assets |
143 | |||
| Property, plant and equipment, net |
237,506 | |||
| Goodwill |
17,000 | |||
| Other intangible assets |
43,267 | |||
| Accounts payable and accrued liabilities |
(3,736 | ) | ||
| Payables to affiliates |
(659 | ) | ||
|
|
|
|||
| Net assets |
$ | 298,146 | ||
|
|
|
| (c) | We test goodwill for impairment as of October 1 of each year. Upon completing this impairment test for 2010, we concluded that the goodwill attributable to our SemMexico segment was impaired, due primarily to a decline in demand for asphalt resulting from a slowdown in road construction. To calculate the impairment loss, we estimated the fair value of the SemMexico segment using the present value of estimated future cash flows, discounted at a rate of 13.84%. |
Month ended December 31, 2009 (Successor)
During December 2009, SemCAMS committed to a plan to cease processing sour gas at one of its facilities, based on the decision by a customer to send its sour gas to a different SemCAMS processing facility. SemCAMS recorded a reduction of $18.4 million to the value of property, plant and equipment, and a $4.7 million increase to the related asset retirement obligation.
Eleven months ended November 30, 2009 (Predecessor)
Gains (losses) recorded during the eleven months ended November 30, 2009 related to the disposal or impairment of long-lived assets included the following (in thousands):
| Event |
Segment | Gain (Loss) |
||||
| Impairment of natural gas gathering and processing assets (a) |
SemGas | $ | (13,625 | ) | ||
| Loss of SemGroup Energy Partners (b) |
Corporate and other | 613,918 | * | |||
| Settlement with SemGroup Energy Partners (c) |
SemCrude | (11,677 | )* | |||
| * | Reported within reorganization items in the consolidated statement of operations |
| (a) | We had certain natural gas gathering and processing assets that were idle or had a low volume of activity. We analyzed these assets and concluded that they were not likely to become significantly utilized unless market conditions improved, and accordingly we recorded an impairment to reduce these assets to estimated net realizable value. This impairment reduced property, plant and equipment by $7.6 million and reduced other intangible assets by $6.0 million. |
| (b) | As described in Note 5, our ownership interests in SemGroup Energy Partners were seized by creditors. Our investment balance in SemGroup Energy Partners was in a liability position, due in part to deferred gains on previous sales of limited partner interests. |
F-20
Table of Contents
SEMGROUP CORPORATION
Notes to Consolidated Financial Statements
| 6. | DISPOSALS AND IMPAIRMENTS OF LONG-LIVED ASSETS, Continued |
| (c) | We reached an agreement with SemGroup Energy Partners to settle a variety of outstanding matters. As part of this settlement, we surrendered property, plant and equipment with a net book value of $11.7 million. |
| 7. | DISCONTINUED OPERATIONS |
SemFuel, SemMaterials, and SemEuro Supply are classified as discontinued operations in the consolidated statements of operations. During 2008, we decided to sell the assets of SemMaterials and to cease the operations of SemEuro Supply, due to their losses from operations and high working capital requirements. During 2009, we decided to sell the assets of SemFuel, due to its high working capital requirements. By December 31, 2009, the majority of the assets of SemMaterials and SemFuel had been sold.
Certain summarized information on the results of discontinued operations is shown below (in thousands):
| Successor | Predecessor | |||||||||||||||||
| Year Ended December 31, 2011 |
Year Ended December 31, 2010 |
Month Ended December 31, 2009 |
Eleven Months Ended November 30, 2009 |
|||||||||||||||
| External revenue |
$ | — | $ | — | $ | 2,335 | $ | 114,591 | ||||||||||
|
|
|
|
|
|
|
|
|
|||||||||||
| Gain on disposal of long-lived assets, net |
$ | — | $ | — | $ | — | $ | 16,846 | ||||||||||
|
|
|
|
|
|
|
|
|
|||||||||||
| Income (loss) from discontinued operations before income taxes |
$ | (8 | ) | $ | 2,668 | $ | 215 | $ | (141,586 | ) | ||||||||
| Income tax expense |
2 | 234 | — | 27 | ||||||||||||||
|
|
|
|
|
|
|
|
|
|||||||||||
| Income (loss) from discontinued operations, net of income taxes |
$ | (10 | ) | $ | 2,434 | $ | 215 | $ | (141,613 | ) | ||||||||
|
|
|
|
|
|
|
|
|
|||||||||||
Gains (losses) on disposal of long-lived assets classified as discontinued operations included the following for the eleven months ended November 30, 2009 (in thousands):
| Event |
Proceeds | Net Book Value |
Gain (Loss) |
|||||||||
| Sale of SemFuel terminals (a) |
$ | 64,332 | $ | 53,119 | $ | 11,213 | ||||||
| Sale of SemFuel retail assets (b) |
1,665 | 538 | 1,127 | |||||||||
| Sale of SemFuel storage tank (c) |
2,900 | 6,030 | (3,130 | ) | ||||||||
| Sale of SemMaterials intellectual property (d) |
6,500 | — | 6,500 | |||||||||
| Sale of investment in Vulcan (e) |
3,900 | 8,043 | (4,143 | ) | ||||||||
| Sale of SemMaterials residual fuel division (f) |
2,500 | — | 2,500 | |||||||||
| Sale of various SemMaterials assets (g) |
6,077 | 3,298 | 2,779 | |||||||||
| (a) | We sold substantially all of the SemFuel refined product terminal assets in September 2009. |
| (b) | We sold the assets of SemFuel’s retail petroleum business in November 2009. |
| (c) | Represents the sale of a product storage tank owned by SemFuel. |
| (d) | Represents the sale of SemMaterials intellectual property and laboratory equipment. |
| (e) | SemMaterials sold its 50% interest in an asphalt marketing business. |
| (f) | Represents the sale of the SemMaterials residual fuel division. |
| (g) | Represents the sale or disposal of the remaining assets of SemMaterials through a series of transactions. |
F-21
Table of Contents
SEMGROUP CORPORATION
Notes to Consolidated Financial Statements
| 8. | REORGANIZATION |
On July 22, 2008, we, and many of our subsidiaries, filed voluntary petitions for reorganization under Chapter 11 of the U.S. Bankruptcy Code and applications for creditor protection under the CCAA in Canada. On October 22, 2008, two more of our subsidiaries filed petitions for protection under the U.S. Bankruptcy Code. During the reorganization process, certain claims against us in existence prior to the filing of the petitions for relief under the federal bankruptcy laws were stayed while we continued business operations as a debtor-in-possession. We received approval from the court to pay or otherwise honor certain of our obligations incurred before the Petition Date. The court also approved our use of cash on hand at the Petition Date and cash subsequently generated through business operations to meet our post Petition Date obligations. The court also authorized us to obtain debtor-in-possession financing.
While in bankruptcy, we filed a Plan of Reorganization with the court, which was confirmed on October 28, 2009. The Plan of Reorganization determined, among other things, how pre-Petition Date obligations would be settled, our equity structure upon emergence, and our financing arrangements upon emergence.
Determination of reorganization value
An essential element in negotiating a reorganization plan with the various classes of creditors is the determination of reorganization value by the parties in interest. In the event that the parties in interest cannot agree on the reorganization value, the court may be called upon to determine the reorganization value of the entity before a plan of reorganization can be confirmed.
During the reorganization process, a reorganization value was proposed. This reorganization value was ultimately agreed to by the creditors and confirmed by the court. The proposed reorganization value was determined by applying the following valuation methods:
| • | a “guideline company” approach, in which valuation multiples observed from industry participants were considered and comparisons were made between our expected performance relative to other industry participants to determine appropriate multiples to apply our financial metrics; |
| • | analysis of recent transactions involving companies determined to be similar to us; and |
| • | a calculation of the present value of our estimated future cash flows. |
After completing this analysis, the reorganization value was determined to be $1.5 billion. This proposed reorganization value was determined using numerous projections and assumptions. These estimates are subject to significant uncertainties, many of which are beyond our control, including, but not limited to, the following:
| • | changes in the economic environment; |
| • | changes in supply or demand for petroleum products; |
| • | changes in prices of petroleum products; |
| • | our ability to successfully implement expansion projects; |
| • | our ability to improve relationships with customers and suppliers, as these relationships were adversely impacted by the bankruptcy filing; |
| • | our ability to renew certain business operations that were limited during the bankruptcy due to limitations on access to capital; and |
| • | our ability to manage the additional costs associated with being a public company. |
F-22
Table of Contents
SEMGROUP CORPORATION
Notes to Consolidated Financial Statements
| 8. | REORGANIZATION, Continued |
The use of different estimates could have resulted in a materially different proposed reorganization value, and there can be no assurance that actual results will be consistent with the estimates that were used to determine the proposed reorganization value. The reorganization value confirmed by the court was utilized in the application of fresh-start reporting.
Valuation of assets and liabilities
We recorded individual assets and liabilities based on their fair values at the Emergence Date and adjusted deferred tax liabilities where appropriate to reflect the change in the financial reporting basis of assets. We recorded approximately $188.8 million of goodwill, which represented the excess of the reorganization value over the fair value of the identifiable assets.
F-23
Table of Contents
SEMGROUP CORPORATION
Notes to Consolidated Financial Statements
| 8. | REORGANIZATION, Continued |
November 30, 2009 balance sheet
The following table shows the effects of our emergence from bankruptcy on the November 30, 2009 consolidated balance sheet (in thousands):
| SemGroup, L.P. (Predecessor) |
Reconsolidation of SemCAMS and SemCanada Crude(a) |
Reorganization Adjustments |
Fresh Start Adjustments |
SemGroup Corporation (Successor) |
||||||||||||||||||||||||
| ASSETS |
||||||||||||||||||||||||||||
| Current assets: |
||||||||||||||||||||||||||||
| Cash and cash equivalents |
$ | 793,126 | $ | 132,813 | $ | (858,241 | ) | (b | ) | $ | — | $ | 67,698 | |||||||||||||||
| Restricted cash |
15,082 | 15,692 | 182,818 | (c | ) | — | 213,592 | |||||||||||||||||||||
| Accounts receivable |
79,392 | 139,712 | (230 | ) | — | 218,874 | ||||||||||||||||||||||
| Receivable from affiliates |
86,560 | (84,842 | ) | (1,718 | ) | (d | ) | — | — | |||||||||||||||||||
| Inventories |
121,958 | 12,569 | — | 36,521 | (p | ) | 171,048 | |||||||||||||||||||||
| Current assets of discontinued operations |
10,593 | — | — | — | 10,593 | |||||||||||||||||||||||
| Other current assets |
49,487 | 93,732 | — | 1,785 | (p | ) | 145,004 | |||||||||||||||||||||
|
|
|
|
|
|
|
|
|
|
|
|||||||||||||||||||
| Total current assets |
1,156,198 | 309,676 | (677,371 | ) | 38,306 | 826,809 | ||||||||||||||||||||||
|
|
|
|
|
|
|
|
|
|
|
|||||||||||||||||||
| Property, plant and equipment |
707,628 | 202,879 | — | 150,588 | (p | ) | 1,061,095 | |||||||||||||||||||||
| Goodwill |
46,729 | 52,787 | — | 89,296 | (p | ) | 188,812 | |||||||||||||||||||||
| Other intangible assets |
14,081 | 42,100 | — | 78,271 | (p | ) | 134,452 | |||||||||||||||||||||
| Investments in non-consolidated subsidiaries |
102,598 | (29,098 | ) | (73,500 | ) | (e | ) | — | — | |||||||||||||||||||
| Note receivable from affiliate |
139,109 | (139,109 | ) | — | — | — | ||||||||||||||||||||||
| Other assets, net |
8,574 | 767 | 46,057 | (f | ) | 5,946 | (p | ) | 61,344 | |||||||||||||||||||
|
|
|
|
|
|
|
|
|
|
|
|||||||||||||||||||
| Total assets |
$ | 2,174,917 | $ | 440,002 | $ | (704,814 | ) | $ | 362,407 | $ | 2,272,512 | |||||||||||||||||
|
|
|
|
|
|
|
|
|
|
|
|||||||||||||||||||
| LIABILITIES AND OWNERS’ EQUITY (DEFICIT) |
||||||||||||||||||||||||||||
| Current liabilities: |
||||||||||||||||||||||||||||
| Accounts payable |
$ | 101,295 | $ | 93,374 | $ | (21,102 | ) | (g | ) | $ | — | $ | 173,567 | |||||||||||||||
| Accrued liabilities |
93,188 | 17,143 | (77,938 | ) | (h | ) | (267 | ) | 32,126 | |||||||||||||||||||
| Payables to pre-petition creditors |
— | 8,221 | 302,212 | (h | ) | — | 310,433 | |||||||||||||||||||||
| Other current liabilities |
25,239 | 454 | — | 4,909 | (p | ) | 30,602 | |||||||||||||||||||||
| Current liabilities of discontinued operations |
3,663 | — | 10,559 | (i | ) | — | 14,222 | |||||||||||||||||||||
| Current portion of long-term debt |
197,727 | — | (176,734 | ) | (j | ) | — | 20,993 | ||||||||||||||||||||
|
|
|
|
|
|
|
|
|
|
|
|||||||||||||||||||
| Total current liabilities |
421,112 | 119,192 | 36,997 | 4,642 | 581,943 | |||||||||||||||||||||||
|
|
|
|
|
|
|
|
|
|
|
|||||||||||||||||||
| Liabilities subject to compromise |
4,707,994 | — | (4,707,994 | ) | (m | ) | — | — | ||||||||||||||||||||
| Long-term debt |
90 | — | 514,001 | (j | ) | 267 | 514,358 | |||||||||||||||||||||
| Deferred income taxes |
36,802 | 64,096 | — | 4,845 | (q | ) | 105,743 | |||||||||||||||||||||
| Other noncurrent liabilities |
2,276 | 32,856 | 16,037 | (k | ) | — | 51,169 | |||||||||||||||||||||
| Investment in SemGroup Holdings |
613,918 | — | (613,918 | ) | (l | ) | — | — | ||||||||||||||||||||
| Predecessor Equity |
||||||||||||||||||||||||||||
| SemGroup, L.P. partners’ capital (deficit): |
||||||||||||||||||||||||||||
| Partners’ capital (deficit) |
(3,597,238 | ) | 223,858 | 3,373,380 | (n | ) | — | — | ||||||||||||||||||||
| Accumulated other comprehensive income (loss) |
(11,962 | ) | — | — | 11,962 | (r | ) | — | ||||||||||||||||||||
|
|
|
|
|
|
|
|
|
|
|
|||||||||||||||||||
| Total SemGroup, L.P. partners’ capital (deficit) |
(3,609,200 | ) | 223,858 | 3,373,380 | 11,962 | — | ||||||||||||||||||||||
|
|
|
|
|
|
|
|
|
|
|
|||||||||||||||||||
| Successor Equity |
||||||||||||||||||||||||||||
| SemGroup Corporation: |
||||||||||||||||||||||||||||
| Common stock |
— | — | 414 | (o | ) | — | 414 | |||||||||||||||||||||
| Additional paid in capital |
— | — | 676,269 | (o | ) | 340,995 | (r | ) | 1,017,264 | |||||||||||||||||||
|
|
|
|
|
|
|
|
|
|
|
|||||||||||||||||||
| Total SemGroup Corporation equity |
— | — | 676,683 | 340,995 | 1,017,678 | |||||||||||||||||||||||
|
|
|
|
|
|
|
|
|
|
|
|||||||||||||||||||
| Noncontrolling interests in consolidated subsidiaries |
1,925 | — | — | (304 | ) | (r | ) | 1,621 | ||||||||||||||||||||
|
|
|
|
|
|
|
|
|
|
|
|||||||||||||||||||
| Total owners’ equity (deficit) |
(3,607,275 | ) | 223,858 | 4,050,063 | 352,653 | 1,019,299 | ||||||||||||||||||||||
|
|
|
|
|
|
|
|
|
|
|
|||||||||||||||||||
| Total liabilities and owners’ equity (deficit) |
$ | 2,174,917 | $ | 440,002 | $ | (704,814 | ) | $ | 362,407 | $ | 2,272,512 | |||||||||||||||||
|
|
|
|
|
|
|
|
|
|
|
|||||||||||||||||||
F-24
Table of Contents
SEMGROUP CORPORATION
Notes to Consolidated Financial Statements
| 8. | REORGANIZATION, Continued |
| (a) | As described in Note 5, we regained control of SemCAMS and SemCanada Crude on the Emergence Date. This column reflects the reconsolidation of these entities at November 30, 2009, with their assets and liabilities reported at fair value at that date. |
| (b) | Represents disbursements made pursuant to the Plan of Reorganization for distributions to creditors, cash transferred to a restricted account for future distributions to creditors, cure payments resulting from assumption of certain contracts, and the funding of a trust for the benefit of pre-petition creditors. The adjustment to cash also includes the issuance of new debt and the repayment of existing debt. |
| (c) | Represents cash set aside for payments to pre-petition creditors in settlement of liabilities subject to compromise. |
| (d) | Certain amounts receivable from SemCanada Energy were determined to be uncollectable and were written off. |
| (e) | Represents the write-off of our investment in SemCanada Energy. |
| (f) | Represents debt issuance costs and deferred charges related to new financing agreements. |
| (g) | In the reorganization process, we elected not to cancel certain contracts that were in effect prior to the Petition Date. For the contracts we assumed, we were required to make payments to the other parties on the contracts to cure defaults on the contracts. |
| (h) | Payables to pre-petition creditors include accruals for payments to be made to pre-petition creditors in settlement of liabilities subject to compromise. In addition, $77.0 million of liabilities for professional fees and $0.9 million of interest payable were transferred into this account. |
| (i) | Pursuant to the Plan of Reorganization, we were obligated to remit funds to pre-petition creditors once SemMaterials and SemFuel sold certain specified inventory and collected certain specified accounts receivable. |
| (j) | The net change in long-term debt results from the repayment of debtor-in-possession financing, the refinancing of SemCrude Pipeline and SemLogistics credit facilities, and the issuance of new debt, as summarized below (in thousands): |
| Issuance of SemGroup term loan |
$ | 300,000 | ||
| Borrowings on SemGroup revolving credit facility |
68,321 | |||
| Refinancing of SemCrude Pipeline credit facility |
1,300 | |||
| Refinancing of SemLogistics credit facility |
(3,214 | ) | ||
| Repayment of debtor-in-possession financing |
(29,140 | ) | ||
|
|
|
|||
| $ | 337,267 | |||
|
|
|
| (k) | As described in Note 19, we issued warrants to settle certain liabilities subject to compromise. |
| (l) | As described in Note 5, we surrendered all of our ownership interests in SemGroup Energy Partners in the reorganization process. |
| (m) | Upon filing for bankruptcy protection, certain claims against us were stayed, pending resolution of the amount of consideration the claimants would receive in the reorganization process. We recorded as liabilities subject to compromise our estimate of the total amount of valid claims that were expected not to be paid in full. Liabilities subject to compromise were settled or extinguished in the reorganization process. |
| (n) | Reflects the gain on extinguishment of debt and the cancellation of partnership interests in SemGroup, L.P. pursuant to the Plan of Reorganization. |
| (o) | SemGroup Corporation issued shares of new common stock in settlement of liabilities subject to compromise. |
| (p) | Reflects adjustments to the recorded values of assets and liabilities resulting from fresh-start reporting. |
| (q) | Reflects the impact of fresh-start reporting on deferred taxes. |
F-25
Table of Contents
SEMGROUP CORPORATION
Notes to Consolidated Financial Statements
| 8. | REORGANIZATION, Continued |
| (r) | Reflects the elimination of SemGroup, L.P.’s accumulated other comprehensive income and the gain on revaluation of assets and liabilities resulting from fresh-start reporting. |
The following table reconciles the reorganization value to the November 30, 2009 equity of the reorganized SemGroup Corporation (in thousands). The November 30, 2009 equity balances of the reorganized SemGroup Corporation include the shares required to be issued in settlement of pre-petition claims as the process of resolving these claims progresses.
| Reorganization value |
$ | 1,500,000 | ||
| less: SemGroup term loan |
(300,000 | ) | ||
| less: SemCrude Pipeline credit facility |
(125,000 | ) | ||
| less: SemLogistics credit facility |
(41,285 | ) | ||
| less: warrants (Note 19) |
(16,037 | ) | ||
|
|
|
|||
| SemGroup Corporation equity |
$ | 1,017,678 | ||
|
|
|
The reorganization items gain of the Predecessor shown in the consolidated statement of operations consists of the following for the eleven months ended November 30, 2009 (in thousands):
| Gain on extinguishment of debt (a) |
$ | 2,544,218 | ||
| Gain on disposal of SemGroup Energy Partners (b) |
613,918 | |||
| Gain on asset revaluation in fresh-start reporting (c) |
352,653 | |||
| Gain from Canadian plan effects and reconsolidation (d) |
244,281 | |||
| Professional fees (e) |
(164,964 | ) | ||
| Uncollectable accounts expense (f) |
(38,757 | ) | ||
| Loss on settlement with SemGroup Energy Partners (g) |
(11,677 | ) | ||
| Employment costs (h) |
(6,706 | ) | ||
| Other |
(523 | ) | ||
|
|
|
|||
| Reorganization items gain |
$ | 3,532,443 | ||
|
|
|
| (a) | Represents the gain on the forgiveness of debt pursuant to the Plan of Reorganization. Also includes refinements to the estimated amount of valid claims by pre-petition creditors. During 2008, we recorded an estimate for the total amount of claims subject to compromise. During 2009, we refined this estimate as we reviewed the claims, and reversed some of the amounts that had been accrued in 2008. |
| (b) | As described in Note 5, we surrendered all of our ownership interests in SemGroup Energy Partners in the reorganization process. At the time SemGroup Energy Partners was deconsolidated, our investment balance was in a liability position, due in part to deferred gains on previous sales of limited partner interests. |
| (c) | As described earlier in this Note, we revalued our assets and liabilities in fresh-start reporting, and recorded a reorganization gain for the increase in fair value of net assets over the previously recorded value. |
| (d) | As described earlier in this Note, we reconsolidated SemCAMS and SemCanada Crude on the Emergence Date. The reorganization gain includes the excess of the fair value of SemCAMS and SemCanada Crude upon reconsolidation over the recorded value of our investment in SemCAMS and SemCanada Crude. In addition, the reorganization gain includes the restoration of certain receivables from SemCAMS and SemCanada Crude pursuant to their plans of reorganization. |
F-26
Table of Contents
SEMGROUP CORPORATION
Notes to Consolidated Financial Statements
| 8. | REORGANIZATION, Continued |
| (e) | Professional fees include a variety of services related to the restructuring of the business, including, among others: |
| • | legal fees related to the reorganization process, including those related to bankruptcy court filings and hearings, negotiation of credit agreements, settlements of disputes with claimants, and other matters; |
| • | general management consulting services relating to the disposal of assets, the reconciliation and negotiation of pre-petition claims, preparation for emergence from bankruptcy, and other matters; |
| • | valuation advisory fees for the determination of the reorganization value of the business required for the Plan of Reorganization and the valuation of long-lived assets required by fresh-start reporting; |
| • | accounting fees for assistance with fresh-start reporting and preparation for public company financial reporting obligations; and |
| • | fees paid to the United States Trustee. |
| (f) | Represents the write-off of receivables in situations where we believe the customer non-payment was related to our bankruptcy. This amount includes recovery of certain receivables from SemGroup Energy Partners. |
| (g) | We reached an agreement with SemGroup Energy Partners to settle a variety of outstanding matters. As part of this settlement, we surrendered property, plant and equipment with a net book value of $11.7 million. |
| (h) | Employment costs include severance related to the termination of employment relationships and bonuses paid to retain personnel during the reorganization process. |
| 9. | CONDENSED COMBINED FINANCIAL STATEMENTS OF U.S. DEBTORS |
The condensed combined financial statements shown below include SemGroup, L.P. and its subsidiaries that filed for bankruptcy in the United States (the “U.S. Debtors”). Transactions and balances between the U.S. Debtors have been eliminated in the condensed combined financial statements below. The condensed combined financial statements below are presented on the same basis as our consolidated financial statements, except as described below.
Condensed combined statement of operations of U.S. Debtors for the eleven months ended November 30, 2009 (in thousands):
| Revenue |
$ | 677,046 | ||
| Costs of products sold, exclusive of depreciation and amortization |
598,882 | |||
| Operating expenses |
64,775 | |||
| General and administrative expense |
30,193 | |||
|
|
|
|||
| Operating loss |
(16,804 | ) | ||
| Interest expense |
11,189 | |||
| Other income, net |
(4,899 | ) | ||
| Equity in earnings of subsidiaries other than U.S. Debtors (*) |
(140,516 | ) | ||
| Reorganization items gain |
(3,417,712 | ) | ||
|
|
|
|||
| Income from continuing operations |
3,535,134 | |||
| Loss from discontinued operations |
(140,550 | ) | ||
|
|
|
|||
| Net income |
$ | 3,394,584 | ||
|
|
|
F-27
Table of Contents
SEMGROUP CORPORATION
Notes to Consolidated Financial Statements
| 9. | CONDENSED COMBINED FINANCIAL STATEMENTS OF U.S. DEBTORS, Continued |
| (*) | Represents the equity in the earnings of entities that are included in our consolidated statements of operations, but which are not U.S. Debtors. These are accounted for under the equity method in this condensed combined statement of operations of the U.S. Debtors. |
Condensed combined statement of cash flows of U.S. Debtors for the eleven months ended November 30, 2009 (in thousands):
| Net cash provided by (used in): |
||||
| Operating activities |
$ | (610,832 | ) | |
| Investing activities |
28,284 | |||
| Financing activities |
14,655 | |||
|
|
|
|||
| Net decrease in cash and cash equivalents |
(567,893 | ) | ||
| Cash and cash equivalents, beginning of period |
590,250 | |||
|
|
|
|||
| Cash and cash equivalents, end of period |
$ | 22,357 | ||
|
|
|
| 10. | SEGMENTS |
As described in Note 1, our businesses are organized based on the nature and location of the services they provide. Certain summarized information related to our reportable segments is shown in the tables below. None of the operating segments have been aggregated, other than White Cliffs Pipeline, which has been included within the Crude segment. Although “corporate and other” does not represent an operating segment, it is included in the tables below to reconcile segment information to that of the consolidated Company. We sold the property, plant and equipment of SemCanada Crude during fourth quarter 2010 and began winding down its operations. SemCanada Crude ceased to be an operating segment during fourth quarter 2010, and is therefore included within “Corporate and other” in the tables below. Eliminations of transactions between segments are also included within “Corporate and other” in the tables below.
The accounting policies of each segment are the same as the accounting policies of the consolidated Company. Transactions between segments are generally recorded based on prices negotiated between the segments. Certain general and administrative and interest expenses incurred at the corporate level were allocated to the segments, based on our allocation policies in effect at the time. During 2010, we completed a detailed study of these expenses and developed a more refined allocation methodology, which we applied to the general and administrative and interest expense allocations for the years ended December 31, 2010 and 2011.
F-28
Table of Contents
SEMGROUP CORPORATION
Notes to Consolidated Financial Statements
| 10. | SEGMENTS, Continued |
| Successor | ||||||||||||||||||||||||||||||||
| Year Ended December 31, 2011 | ||||||||||||||||||||||||||||||||
| Crude | SemStream | SemCAMS | SemGas | SemLogistics | SemMexico | Corporate and Other |
Consolidated | |||||||||||||||||||||||||
| (in thousands) | ||||||||||||||||||||||||||||||||
| Revenues: |
||||||||||||||||||||||||||||||||
| External |
$ | 431,321 | $ | 575,860 | $ | 163,367 | $ | 66,660 | $ | 23,314 | $ | 218,187 | $ | 801 | $ | 1,479,510 | ||||||||||||||||
| Intersegment |
— | 46,738 | — | 38,588 | — | — | (85,326 | ) | — | |||||||||||||||||||||||
|
|
|
|
|
|
|
|
|
|
|
|
|
|
|
|
|
|||||||||||||||||
| Total revenues |
431,321 | 622,598 | 163,367 | 105,248 | 23,314 | 218,187 | (84,525 | ) | 1,479,510 | |||||||||||||||||||||||
| Expenses: |
||||||||||||||||||||||||||||||||
| Costs of products sold, exclusive of depreciation and amortization shown below |
366,265 | 605,170 | 218 | 75,066 | 152 | 192,068 | (84,764 | ) | 1,154,175 | |||||||||||||||||||||||
| Operating |
17,470 | 8,420 | 110,814 | 9,027 | 6,206 | 5,006 | 70 | 157,013 | ||||||||||||||||||||||||
| General and administrative |
9,757 | 8,904 | 16,816 | 6,521 | 6,712 | 11,560 | 16,745 | 77,015 | ||||||||||||||||||||||||
| Depreciation and amortization |
11,379 | 4,867 | 10,233 | 5,986 | 9,271 | 6,502 | 2,951 | 51,189 | ||||||||||||||||||||||||
| Loss (gain) on disposal or impairment of long-lived assets, net |
64 | (36,625 | ) | (8 | ) | 4 | 44,663 | (200 | ) | 1,599 | 9,497 | |||||||||||||||||||||
|
|
|
|
|
|
|
|
|
|
|
|
|
|
|
|
|
|||||||||||||||||
| Total expenses |
404,935 | 590,736 | 138,073 | 96,604 | 67,004 | 214,936 | (63,399 | ) | 1,448,889 | |||||||||||||||||||||||
| Earnings from equity method investments |
15,004 | — | — | — | — | — | — | 15,004 | ||||||||||||||||||||||||
|
|
|
|
|
|
|
|
|
|
|
|
|
|
|
|
|
|||||||||||||||||
| Operating income (loss) |
41,390 | 31,862 | 25,294 | 8,644 | (43,690 | ) | 3,251 | (21,126 | ) | 45,625 | ||||||||||||||||||||||
|
|
|
|
|
|
|
|
|
|
|
|
|
|
|
|
|
|||||||||||||||||
| Other expenses (income), net Interest expense |
3,749 | 17,222 | 24,685 | 2,346 | 1,005 | 365 | 10,836 | 60,208 | ||||||||||||||||||||||||
| Other expense (income), net |
(1,600 | ) | (2,112 | ) | (2,811 | ) | (10 | ) | 46 | (173 | ) | (8,329 | ) | (14,989 | ) | |||||||||||||||||
|
|
|
|
|
|
|
|
|
|
|
|
|
|
|
|
|
|||||||||||||||||
| Total other expenses (income) |
2,149 | 15,110 | 21,874 | 2,336 | 1,051 | 192 | 2,507 | 45,219 | ||||||||||||||||||||||||
|
|
|
|
|
|
|
|
|
|
|
|
|
|
|
|
|
|||||||||||||||||
| Income (loss) from continuing operations before income taxes |
$ | 39,241 | $ | 16,752 | $ | 3,420 | $ | 6,308 | $ | (44,741 | ) | $ | 3,059 | $ | (23,633 | ) | $ | 406 | ||||||||||||||
|
|
|
|
|
|
|
|
|
|
|
|
|
|
|
|
|
|||||||||||||||||
| Additions to long-lived assets |
$ | 32,397 | $ | 2,197 | $ | 4,874 | $ | 14,952 | $ | 5,313 | $ | 4,667 | $ | 2,080 | $ | 66,480 | ||||||||||||||||
|
|
||||||||||||||||||||||||||||||||
| Total assets at December 31, 2011 (excluding intersegment receivables) |
$ | 586,882 | $ | 205,394 | $ | 258,306 | $ | 94,960 | $ | 183,179 | $ | 89,239 | $ | 73,221 | $ | 1,491,181 | ||||||||||||||||
| Equity investments at December 31, 2011 |
$ | 143,259 | $ | 183,984 | $ | — | $ | — | $ | — | $ | — | $ | — | $ | 327,243 | ||||||||||||||||
F-29
Table of Contents
SEMGROUP CORPORATION
Notes to Consolidated Financial Statements
| 10. | SEGMENTS, Continued |
| Successor | ||||||||||||||||||||||||||||||||
| Year Ended December 31, 2010 | ||||||||||||||||||||||||||||||||
| Crude | SemStream | SemCAMS | SemGas | SemLogistics | SemMexico | Corporate and Other |
Consolidated | |||||||||||||||||||||||||
| (in thousands) | ||||||||||||||||||||||||||||||||
| Revenues: |
||||||||||||||||||||||||||||||||
| External |
$ | 222,927 | $ | 664,673 | $ | 144,754 | $ | 48,402 | $ | 38,371 | $ | 149,557 | $ | 361,650 | $ | 1,630,334 | ||||||||||||||||
| Intersegment |
22,927 | 53,623 | — | 27,388 | — | — | (103,938 | ) | — | |||||||||||||||||||||||
|
|
|
|
|
|
|
|
|
|
|
|
|
|
|
|
|
|||||||||||||||||
| Total revenues |
245,854 | 718,296 | 144,754 | 75,790 | 38,371 | 149,557 | 257,712 | 1,630,334 | ||||||||||||||||||||||||
| Expenses: |
||||||||||||||||||||||||||||||||
| Costs of products sold, exclusive of depreciation and amortization shown below |
149,383 | 690,970 | 67 | 50,800 | — | 129,449 | 245,263 | 1,265,932 | ||||||||||||||||||||||||
| Operating |
25,498 | 9,074 | 95,072 | 6,342 | 8,406 | 4,742 | 4,306 | 153,440 | ||||||||||||||||||||||||
| General and administrative |
10,525 | 9,511 | 18,942 | 6,626 | 5,286 | 10,352 | 25,995 | 87,237 | ||||||||||||||||||||||||
| Depreciation and amortization |
27,643 | 6,764 | 9,556 | 5,480 | 7,881 | 6,183 | 7,375 | 70,882 | ||||||||||||||||||||||||
| Loss (gain) on disposal or impairment of long-lived assets, net |
6,895 | (35 | ) | (14 | ) | 12 | — | 8,837 | 89,355 | 105,050 | ||||||||||||||||||||||
|
|
|
|
|
|
|
|
|
|
|
|
|
|
|
|
|
|||||||||||||||||
| Total expenses |
219,944 | 716,284 | 123,623 | 69,260 | 21,573 | 159,563 | 372,294 | 1,682,541 | ||||||||||||||||||||||||
| Earnings from equity method investments |
1,949 | — | — | — | — | — | — | 1,949 | ||||||||||||||||||||||||
|
|
|
|
|
|
|
|
|
|
|
|
|
|
|
|
|
|||||||||||||||||
| Operating income (loss) |
27,859 | 2,012 | 21,131 | 6,530 | 16,798 | (10,006 | ) | (114,582 | ) | (50,258 | ) | |||||||||||||||||||||
|
|
|
|
|
|
|
|
|
|
|
|
|
|
|
|
|
|||||||||||||||||
| Other expenses (income): |
||||||||||||||||||||||||||||||||
| Interest expense |
15,384 | 15,496 | 25,108 | 2,254 | 3,998 | 13 | 23,880 | 86,133 | ||||||||||||||||||||||||
| Other expense (income), net |
(1,569 | ) | (2,983 | ) | 617 | (753 | ) | (88 | ) | (199 | ) | 9,313 | 4,338 | |||||||||||||||||||
|
|
|
|
|
|
|
|
|
|
|
|
|
|
|
|
|
|||||||||||||||||
| Total other expenses (income) |
13,815 | 12,513 | 25,725 | 1,501 | 3,910 | (186 | ) | 33,193 | 90,471 | |||||||||||||||||||||||
|
|
|
|
|
|
|
|
|
|
|
|
|
|
|
|
|
|||||||||||||||||
| Income (loss) from continuing operations before income taxes |
$ | 14,044 | $ | (10,501 | ) | $ | (4,594 | ) | $ | 5,029 | $ | 12,888 | $ | (9,820 | ) | $ | (147,775 | ) | $ | (140,729 | ) | |||||||||||
|
|
|
|
|
|
|
|
|
|
|
|
|
|
|
|
|
|||||||||||||||||
| Additions to long-lived assets |
$ | 16,731 | $ | 5,781 | $ | 4,308 | $ | 3,623 | $ | 8,964 | $ | 4,516 | $ | 4,051 | $ | 47,974 | ||||||||||||||||
|
|
||||||||||||||||||||||||||||||||
| Total assets at December 31, 2010 (excluding intersegment receivables) |
$ | 507,909 | $ | 342,475 | $ | 269,958 | $ | 76,048 | $ | 230,789 | $ | 90,264 | $ | 149,745 | $ | 1,667,188 | ||||||||||||||||
| Equity investment in White Cliffs at December 31, 2010 |
$ | 152,020 | $ | — | $ | — | $ | — | $ | — | $ | — | $ | — | $ | 152,020 | ||||||||||||||||
F-30
Table of Contents
SEMGROUP CORPORATION
Notes to Consolidated Financial Statements
| 10. | SEGMENTS, Continued |
| Successor | ||||||||||||||||||||||||||||||||
| Month Ended December 31, 2009 | ||||||||||||||||||||||||||||||||
| Crude | SemStream | SemCAMS | SemGas | SemLogistics | SemMexico | Corporate and Other |
Consolidated | |||||||||||||||||||||||||
| (in thousands) | ||||||||||||||||||||||||||||||||
| Revenues: |
||||||||||||||||||||||||||||||||
| External |
$ | 11,930 | $ | 59,546 | $ | 12,930 | $ | 4,399 | $ | 3,297 | $ | 12,079 | $ | 53,147 | $ | 157,328 | ||||||||||||||||
| Intersegment |
2,085 | 4,477 | — | 2,245 | — | — | (8,807 | ) | — | |||||||||||||||||||||||
|
|
|
|
|
|
|
|
|
|
|
|
|
|
|
|
|
|||||||||||||||||
| Total revenues |
14,015 | 64,023 | 12,930 | 6,644 | 3,297 | 12,079 | 44,340 | 157,328 | ||||||||||||||||||||||||
| Expenses: |
||||||||||||||||||||||||||||||||
| Costs of products sold, exclusive of depreciation and amortization shown below |
6,317 | 75,593 | — | 4,495 | 11 | 10,242 | 43,378 | 140,036 | ||||||||||||||||||||||||
| Operating |
907 | 1,642 | 11,345 | 921 | 657 | 1,142 | 151 | 16,765 | ||||||||||||||||||||||||
| General and administrative |
2,012 | 1,435 | 1,726 | 975 | 575 | 1,310 | (21 | ) | 8,012 | |||||||||||||||||||||||
| Depreciation and amortization |
4,937 | 509 | 962 | 427 | 655 | 304 | 997 | 8,791 | ||||||||||||||||||||||||
| Loss on disposal or impairment of long-lived assets, net |
— | — | 23,119 | — | — | — | — | 23,119 | ||||||||||||||||||||||||
|
|
|
|
|
|
|
|
|
|
|
|
|
|
|
|
|
|||||||||||||||||
| Total expenses |
14,173 | 79,179 | 37,152 | 6,818 | 1,898 | 12,998 | 44,505 | 196,723 | ||||||||||||||||||||||||
|
|
|
|
|
|
|
|
|
|
|
|
|
|
|
|
|
|||||||||||||||||
| Operating income (loss) |
(158 | ) | (15,156 | ) | (24,222 | ) | (174 | ) | 1,399 | (919 | ) | (165 | ) | (39,395 | ) | |||||||||||||||||
|
|
|
|
|
|
|
|
|
|
|
|
|
|
|
|
|
|||||||||||||||||
| Other expenses (income): |
||||||||||||||||||||||||||||||||
| Interest expense |
3,047 | 1,987 | 1,015 | 358 | 418 | — | 344 | 7,169 | ||||||||||||||||||||||||
| Other expense (income), net |
(307 | ) | (3 | ) | (583 | ) | (2 | ) | 6 | (58 | ) | (276 | ) | (1,223 | ) | |||||||||||||||||
|
|
|
|
|
|
|
|
|
|
|
|
|
|
|
|
|
|||||||||||||||||
| Total other expenses (income) |
2,740 | 1,984 | 432 | 356 | 424 | (58 | ) | 68 | 5,946 | |||||||||||||||||||||||
|
|
|
|
|
|
|
|
|
|
|
|
|
|
|
|
|
|||||||||||||||||
| Income (loss) from continuing operations before income taxes |
$ | (2,898 | ) | $ | (17,140 | ) | $ | (24,654 | ) | $ | (530 | ) | $ | 975 | $ | (861 | ) | $ | (233 | ) | $ | (45,341 | ) | |||||||||
|
|
|
|
|
|
|
|
|
|
|
|
|
|
|
|
|
|||||||||||||||||
| Additions to long-lived assets |
$ | 2,037 | $ | 1,752 | $ | 948 | $ | 859 | $ | 724 | $ | 490 | $ | 651 | $ | 7,461 | ||||||||||||||||
F-31
Table of Contents
SEMGROUP CORPORATION
Notes to Consolidated Financial Statements
| 10. | SEGMENTS, Continued |
| Predecessor | ||||||||||||||||||||||||||||||||
| Eleven Months Ended November 30, 2009 | ||||||||||||||||||||||||||||||||
| Crude | SemStream | SemCAMS | SemGas | SemLogistics | SemMexico | Corporate and Other |
Consolidated | |||||||||||||||||||||||||
| (in thousands) | ||||||||||||||||||||||||||||||||
| Revenues: |
||||||||||||||||||||||||||||||||
| External |
$ | 256,931 | $ | 402,553 | $ | — | $ | 39,099 | $ | 33,393 | $ | 167,063 | $ | 2,196 | $ | 901,235 | ||||||||||||||||
| Intersegment |
— | 26,306 | — | 16,131 | — | — | (42,437 | ) | — | |||||||||||||||||||||||
|
|
|
|
|
|
|
|
|
|
|
|
|
|
|
|
|
|||||||||||||||||
| Total revenues |
256,931 | 428,859 | — | 55,230 | 33,393 | 167,063 | (40,241 | ) | 901,235 | |||||||||||||||||||||||
| Expenses: |
||||||||||||||||||||||||||||||||
| Costs of products sold, exclusive of depreciation and amortization shown below |
178,705 | 425,470 | — | 37,700 | 565 | 144,142 | (42,409 | ) | 744,173 | |||||||||||||||||||||||
| Operating expense |
17,716 | 9,006 | — | 9,002 | 7,186 | 3,983 | 414 | 47,307 | ||||||||||||||||||||||||
| General and |
7,436 | 5,410 | — | 4,371 | 4,353 | 7,129 | 15,549 | 44,248 | ||||||||||||||||||||||||
| Depreciation and amortization |
10,878 | 4,813 | — | 8,296 | 8,615 | 2,942 | 3,430 | 38,974 | ||||||||||||||||||||||||
| Loss on disposal or impairment of long- |
— | — | — | 13,625 | — | — | — | 13,625 | ||||||||||||||||||||||||
|
|
|
|
|
|
|
|
|
|
|
|
|
|
|
|
|
|||||||||||||||||
| Total expenses |
214,735 | 444,699 | — | 72,994 | 20,719 | 158,196 | (23,016 | ) | 888,327 | |||||||||||||||||||||||
|
|
|
|
|
|
|
|
|
|
|
|
|
|
|
|
|
|||||||||||||||||
| Operating income (loss) |
42,196 | (15,840 | ) | — | (17,764 | ) | 12,674 | 8,867 | (17,225 | ) | 12,908 | |||||||||||||||||||||
|
|
|
|
|
|
|
|
|
|
|
|
|
|
|
|
|
|||||||||||||||||
| Other expenses (income): |
||||||||||||||||||||||||||||||||
| Interest expense |
6,292 | 2,174 | — | 739 | 627 | — | 2,209 | 12,041 | ||||||||||||||||||||||||
| Other expense (income), net |
(1,643 | ) | — | — | (92 | ) | (3,009 | ) | (772 | ) | (3,176 | ) | (8,692 | ) | ||||||||||||||||||
|
|
|
|
|
|
|
|
|
|
|
|
|
|
|
|
|
|||||||||||||||||
| Total other expenses (income) |
4,649 | 2,174 | — | 647 | (2,382 | ) | (772 | ) | (967 | ) | 3,349 | |||||||||||||||||||||
|
|
|
|
|
|
|
|
|
|
|
|
|
|
|
|
|
|||||||||||||||||
| Income (loss) from continuing operations before reorganization items and income taxes |
$ | 37,547 | $ | (18,014 | ) | $ | — | $ | (18,411 | ) | $ | 15,056 | $ | 9,639 | $ | (16,258 | ) | $ | 9,559 | |||||||||||||
|
|
|
|
|
|
|
|
|
|
|
|
|
|
|
|
|
|||||||||||||||||
| Additions to long-lived assets |
$ | 45,645 | $ | 3,399 | $ | — | $ | 11,516 | $ | 9,523 | $ | 14,112 | $ | 5,651 | $ | 89,846 | ||||||||||||||||
Income tax expense (benefit) relates to the following segments (in thousands):
| Successor | Predecessor | |||||||||||||||||
| Year Ended December 31, 2011 |
Year Ended December 31, 2010 |
Month Ended December 31, 2009 |
Eleven Months Ended November 30, 2009 |
|||||||||||||||
| SemCAMS |
$ | 552 | $ | 886 | $ | (6,899 | ) | $ | — | |||||||||
| SemLogistics |
(3,331 | ) | 2,244 | (459 | ) | 4,192 | ||||||||||||
| SemMexico |
629 | 259 | (72 | ) | 2,118 | |||||||||||||
| Corporate and other |
(266 | ) | (9,612 | ) | 221 | — | ||||||||||||
|
|
|
|
|
|
|
|
|
|||||||||||
| Total |
$ | (2,416 | ) | $ | (6,223 | ) | $ | (7,209 | ) | $ | 6,310 | |||||||
|
|
|
|
|
|
|
|
|
|||||||||||
F-32
Table of Contents
SEMGROUP CORPORATION
Notes to Consolidated Financial Statements
| 11. | INVENTORIES |
Inventories consist of the following (in thousands):
| Successor | ||||||||
| December 31, 2011 |
December 31, 2010 |
|||||||
| Natural gas and natural gas liquids |
$ | 570 | * | $ | 104,134 | * | ||
| Crude oil |
21,803 | 18,608 | ||||||
| Asphalt and other |
10,688 | 7,104 | ||||||
|
|
|
|
|
|||||
| $ | 33,061 | $ | 129,846 | |||||
|
|
|
|
|
|||||
| * | The significant decrease in natural gas and natural gas liquids from December 31, 2010 to December 31, 2011 is due to the contribution of assets from our SemStream segment to NGL Energy. |
| 12. | OTHER ASSETS |
Other current assets consist of the following (in thousands):
| Successor | ||||||||
| December 31, 2011 |
December 31, 2010 |
|||||||
| Product prepayments |
$ | 2,396 | $ | 3,761 | ||||
| Other prepaid expenses |
18,685 | 16,255 | ||||||
| Margin deposits |
596 | * | 14,884 | |||||
| Derivative assets |
162 | 4,368 | ||||||
|
|
|
|
|
|||||
| Total other current assets |
$ | 21,839 | $ | 39,268 | ||||
|
|
|
|
|
|||||
| * | The decrease in margin deposits from December 31, 2010 to December 31, 2011 is primarily due to the contribution of assets from our SemStream segment to NGL Energy. $12.6 million of the $14.3 million decrease is due to the contribution of assets to NGL Energy. |
Other noncurrent assets consist of the following (in thousands):
| Successor | ||||||||
| December 31, 2011 |
December 31, 2010 |
|||||||
| Debt issuance costs, net |
$ | 6,642 | * | $ | 23,435 | * | ||
| Other |
5,923 | 6,740 | ||||||
|
|
|
|
|
|||||
| Total other noncurrent assets, net |
$ | 12,565 | $ | 30,175 | ||||
|
|
|
|
|
|||||
| * | See Note 17 for discussion of debt issuance costs. |
F-33
Table of Contents
SEMGROUP CORPORATION
Notes to Consolidated Financial Statements
| 13. | PROPERTY, PLANT AND EQUIPMENT |
Property, plant and equipment consists of the following (in thousands):
| Successor | ||||||||
| December 31, 2011 |
December 31, 2010 |
|||||||
| Land |
$ | 50,329 | $ | 52,765 | ||||
| Pipelines and related facilities |
208,175 | 162,472 | ||||||
| Storage and terminal facilities |
221,072 | 299,333 | ||||||
| Natural gas gathering and processing facilities |
247,768 | 236,308 | ||||||
| Linefill |
13,003 | 18,200 | ||||||
| Office and other property and equipment |
32,980 | 20,151 | ||||||
| Construction-in-progress |
54,788 | 38,077 | ||||||
|
|
|
|
|
|||||
| Property, plant and equipment, gross |
828,115 | 827,306 | ||||||
| Accumulated depreciation |
(84,880 | ) | (45,491 | ) | ||||
|
|
|
|
|
|||||
| Property, plant and equipment, net |
$ | 743,235 | $ | 781,815 | ||||
|
|
|
|
|
|||||
SemGroup Corporation recorded depreciation expense of $46.5 million for the year ended December 31, 2011, $54.7 million for the year ended December 31, 2010, and $4.6 million for the month ended December 31, 2009. SemGroup, L.P. recorded depreciation expense from continuing operations of $36.9 million for the eleven months ended November 30, 2009.
We include within the cost of property, plant and equipment interest costs incurred while an asset is being constructed. SemGroup Corporation capitalized $1.0 million of interest costs during the year ended December 31, 2011 and $0.4 million during the year ended December 31, 2010. SemGroup, L.P. capitalized $2.6 million of interest costs during the eleven months ended November 30, 2009.
| 14. | GOODWILL AND OTHER INTANGIBLE ASSETS |
Goodwill
Goodwill relates to the following segments (in thousands):
| Successor | ||||||||
| December 31, 2011 |
December 31, 2010 |
|||||||
| SemStream |
$ | — | $ | 53,707 | ||||
| SemLogistics |
— | 44,220 | ||||||
| SemMexico |
9,453 | 9,896 | ||||||
|
|
|
|
|
|||||
| Total |
$ | 9,453 | $ | 107,823 | ||||
|
|
|
|
|
|||||
In addition to the amounts in the table above, approximately $2.9 million of our investment in NGL Energy and its general partner and approximately $8.7 million of our investment in White Cliffs represent equity method goodwill. Our estimate of the amount of our investment in NGL Energy and its general partner that represents equity method goodwill is subject to change, as we have not yet completed a detailed valuation analysis of the underlying assets.
As described in Note 3, we test goodwill for impairment annually, or more often if circumstances warrant. To perform these tests, we must determine which asset groups the goodwill relates to (such asset groups are referred to as reporting units). SemLogistics and SemMexico each represent a separate reporting unit.
F-34
Table of Contents
SEMGROUP CORPORATION
Notes to Consolidated Financial Statements
| 14. | GOODWILL AND OTHER INTANGIBLE ASSETS, Continued |
For the October 1, 2011 goodwill impairment tests, we developed estimates of cash flows for each reporting unit for a period of time ranging from 9 to 15 years, and also developed an estimated terminal value using an assumed 3% growth rate (except for the SemStream residential division, for which we assumed a terminal growth rate of 0%). We discounted the estimated cash flows to present value using a weighted average cost of capital of 13.9% for SemMexico and 9.4% for the other reporting units.
Changes in goodwill balances during the period from November 30, 2009 to December 31, 2011 are shown below (in thousands):
| Balance, November 30, 2009 (Successor) |
$ | 188,812 | ||
| Currency translation adjustments |
(1,968 | ) | ||
|
|
|
|||
| Balance, December 31, 2009 (Successor) |
186,844 | |||
| Impairments (Note 6) |
(61,173 | ) | ||
| Deconsolidation of White Cliffs (Note 5) |
(17,000 | ) | ||
| Currency translation adjustments |
(848 | ) | ||
|
|
|
|||
| Balance, December 31, 2010 (Successor) |
107,823 | |||
| Impairments (Note 6) |
(47,804 | ) | ||
| Contribution of SemStream assets to NGL Energy (Note 5) |
(50,071 | ) | ||
| Currency translation adjustments |
(495 | ) | ||
|
|
|
|||
| Balance, December 31, 2011 (Successor) |
$ | 9,453 | ||
|
|
|
For U.S. federal income tax purposes, all of the goodwill recorded upon emergence from bankruptcy is being amortized on a straight-line basis over a 15-year period with the exception of goodwill on the SemStream assets contributed to NGL Energy.
Other intangible assets
Other intangible assets relate to the following segments (in thousands):
| Successor | ||||||||
| December 31, 2011 |
December 31, 2010 |
|||||||
| SemStream |
$ | — | $ | 19,679 | ||||
| SemMexico |
8,907 | 12,539 | ||||||
| Corporate and other |
43 | 46 | ||||||
|
|
|
|
|
|||||
| Total |
$ | 8,950 | $ | 32,264 | ||||
|
|
|
|
|
|||||
F-35
Table of Contents
SEMGROUP CORPORATION
Notes to Consolidated Financial Statements
| 14. | GOODWILL AND OTHER INTANGIBLE ASSETS, Continued |
Changes in other intangible asset balances subsequent to the Emergence Date are shown below (in thousands):
| Balance, November 30, 2009 (Successor) |
$ | 134,452 | ||
| Amortization |
(4,218 | ) | ||
| Currency translation adjustments |
378 | |||
|
|
|
|||
| Balance, December 31, 2009 (Successor) |
$ | 130,612 | ||
| Amortization |
(16,181 | ) | ||
| Impairment (Note 6) |
(39,446 | ) | ||
| Deconsolidation of White Cliffs (Note 5) |
(43,267 | ) | ||
| Currency translation adjustments |
546 | |||
|
|
|
|||
| Balance, December 31, 2010 (Successor) |
$ | 32,264 | ||
| Amortization |
(4,664 | ) | ||
| Contribution of SemStream assets to NGL Energy (Note 5) |
(12,408 | ) | ||
| Impairment (Note 6) |
(5,048 | ) | ||
| Currency translation adjustments |
(1,194 | ) | ||
|
|
|
|||
| Balance, December 31, 2011 (Successor) |
$ | 8,950 | ||
|
|
|
Our other intangible assets consist primarily of customer relationships and unpatented technology of our SemMexico segment, which represented $6.0 million and $2.5 million respectively of the balance at December 31, 2011. These assets may be subject to impairments in the future if we are unable to maintain the relationships with the customers to which the assets relate.
Prior to the Emergence Date, intangible assets were generally amortized on a straight-line basis over the expected period of benefit. Subsequent to the Emergence Date, intangible assets are generally amortized on an accelerated basis over the estimated period of benefit. SemGroup, L.P. recorded intangible asset amortization expense from continuing operations of $2.1 million for the eleven months ended November 30, 2009. We estimate that future amortization of other intangible assets will be as follows (in thousands):
| For year ending: |
||||
| December 31, 2012 |
$ | 2,017 | ||
| December 31, 2013 |
1,676 | |||
| December 31, 2014 |
1,332 | |||
| December 31, 2015 |
1,060 | |||
| December 31, 2016 |
847 | |||
| Thereafter |
2,018 | |||
|
|
|
|||
| Total estimated amortization expense |
$ | 8,950 | ||
|
|
|
F-36
Table of Contents
SEMGROUP CORPORATION
Notes to Consolidated Financial Statements
| 15. | FINANCIAL INSTRUMENTS AND CONCENTRATIONS OF RISK |
Fair value of financial instruments
We record certain financial assets and liabilities at fair value at each balance sheet date. The tables below summarize the balances of these assets and liabilities at December 31, 2011 and 2010 (in thousands):
| Successor | ||||||||||||||||||||||||||||||||||||||||
| December 31, 2011 | December 31, 2010 | |||||||||||||||||||||||||||||||||||||||
| Level 1 | Level 2 | Level 3 | Netting* | Total | Level 1 | Level 2 | Level 3 | Netting* | Total | |||||||||||||||||||||||||||||||
| Assets: |
||||||||||||||||||||||||||||||||||||||||
| Commodity derivatives |
$ | 393 | $ | — | $ | — | $ | (231 | ) | $ | 162 | $ | 97,857 | $ | 1,993 | $ | 2,499 | $ | (97,981 | ) | $ | 4,368 | ||||||||||||||||||
|
|
|
|
|
|
|
|
|
|
|
|
|
|
|
|
|
|
|
|
|
|||||||||||||||||||||
| Total assets |
$ | 393 | $ | — | $ | — | $ | (231 | ) | $ | 162 | $ | 97,857 | $ | 1,993 | $ | 2,499 | $ | (97,981 | ) | $ | 4,368 | ||||||||||||||||||
|
|
|
|
|
|
|
|
|
|
|
|
|
|
|
|
|
|
|
|
|
|||||||||||||||||||||
| Liabilities: |
||||||||||||||||||||||||||||||||||||||||
| Commodity derivatives |
$ | 231 | $ | — | $ | — | $ | (231 | ) | $ | — | $ | 101,563 | $ | 7,494 | $ | 3,046 | $ | (97,981 | ) | $ | 14,122 | ||||||||||||||||||
| Warrants |
12,180 | — | — | — | 12,180 | — | — | 17,192 | — | 17,192 | ||||||||||||||||||||||||||||||
| Interest rate swaps |
— | 358 | — | — | 358 | — | — | — | — | — | ||||||||||||||||||||||||||||||
|
|
|
|
|
|
|
|
|
|
|
|
|
|
|
|
|
|
|
|
|
|||||||||||||||||||||
| Total liabilities |
$ | 12,411 | $ | 358 | $ | — | $ | (231 | ) | $ | 12,538 | $ | 101,563 | $ | 7,494 | $ | 20,238 | $ | (97,981 | ) | $ | 31,314 | ||||||||||||||||||
|
|
|
|
|
|
|
|
|
|
|
|
|
|
|
|
|
|
|
|
|
|||||||||||||||||||||
| Net assets (liabilities) at fair value |
$ | (12,018 | ) | $ | (358 | ) | $ | — | $ | — | $ | (12,376 | ) | $ | (3,706 | ) | $ | (5,501 | ) | $ | (17,739 | ) | $ | — | $ | (26,946 | ) | |||||||||||||
|
|
|
|
|
|
|
|
|
|
|
|
|
|
|
|
|
|
|
|
|
|||||||||||||||||||||
| * | Relates primarily to exchange traded futures. Gain and loss positions on multiple contracts are settled net on a daily basis with the exchange. |
“Level 1” measurements were obtained using unadjusted quoted prices in active markets that are accessible at the measurement date for identical, unrestricted assets or liabilities. These include commodity futures contracts that are traded on an exchange. These also include common stock warrants (Note 19), beginning in September 2011, when the warrants began to be traded on the New York Stock Exchange.
“Level 2” measurements use as inputs market observable and corroborated prices for similar commodity derivative contracts. Assets and liabilities classified as Level 2 include over-the-counter (OTC) traded forwards contracts and swaps.
“Level 3” measurements were obtained using information from a pricing service and internal valuation models incorporating observable and unobservable market data. These include commodity derivatives, such as forwards and swaps for which there is not a highly liquid market, and therefore are not included in Level 2 above. Level 3 measurements also included common stock warrants until September 2011, when the warrants began to be traded on the New York Stock Exchange. Prior to that point, we used a Black-Scholes pricing model to estimate the fair value of the warrants.
Financial assets and liabilities are classified based on the lowest level of input that is significant to the fair value measurement. Our assessment of the significance of a particular input to the measurement requires judgment, and may affect the valuation of assets and liabilities and their placement within the fair value levels.
F-37
Table of Contents
SEMGROUP CORPORATION
Notes to Consolidated Financial Statements
| 15. | FINANCIAL INSTRUMENTS AND CONCENTRATIONS OF RISK, Continued |
The following table summarizes changes in the fair value of our net financial assets (liabilities) classified as Level 3 in the fair value hierarchy (in thousands):
| Successor | Predecessor | |||||||||||||||||||||||||||||||||||||||||
| Year Ended December 31, 2011 |
Year Ended December 31, 2010 |
Month Ended December 31, 2009 |
Eleven Months Ended November 30, 2009 |
|||||||||||||||||||||||||||||||||||||||
| Warrants | Commodity Derivatives |
Total | Warrants | Commodity Derivatives |
Total | Warrants | Commodity Derivatives |
Total | Commodity Derivatives |
|||||||||||||||||||||||||||||||||
| Net assets (liabilities)—beginning balance |
$ | (17,192 | ) | $ | (547 | ) | $ | (17,739 | ) | $ | (16,909 | ) | $ | (23,438 | ) | $ | (40,347 | ) | $ | (16,037 | ) | $ | (15,663 | ) | $ | (31,700 | ) | $ | 11,324 | |||||||||||||
| Transfers out of Level 3(*) |
8,934 | (419 | ) | 8,515 | — | 4,072 | 4,072 | — | — | — | — | |||||||||||||||||||||||||||||||
| Total realized and unrealized gain (loss) included in earnings(**) |
8,258 | 2,783 | 11,041 | (283 | ) | (5,351 | ) | (5,634 | ) | (872 | ) | (5,372 | ) | (6,244 | ) | (34,390 | ) | |||||||||||||||||||||||||
| Settlements |
— | (1,817 | ) | (1,817 | ) | — | 24,170 | 24,170 | — | (2,403 | ) | (2,403 | ) | 10,610 | ||||||||||||||||||||||||||||
| Fresh-start and plan effect adjustments |
— | — | — | — | — | — | — | — | (19,244 | ) | ||||||||||||||||||||||||||||||||
|
|
|
|
|
|
|
|
|
|
|
|
|
|
|
|
|
|
|
|
|
|||||||||||||||||||||||
| Net assets (liabilities)—ending balance |
$ | — | $ | — | $ | — | $ | (17,192 | ) | $ | (547 | ) | $ | (17,739 | ) | $ | (16,909 | ) | $ | (23,438 | ) | $ | (40,347 | ) | $ | (31,700 | ) | |||||||||||||||
|
|
|
|
|
|
|
|
|
|
|
|
|
|
|
|
|
|
|
|
|
|||||||||||||||||||||||
| Amount of total gain or loss included in earnings for the period attributable to the change in unrealized gain or loss relating to assets and liabilities still held at the reporting date |
$ | — | $ | — | $ | — | $ | (283 | ) | $ | (547 | ) | $ | (830 | ) | $ | (872 | ) | $ | (10,222 | ) | $ | (11,094 | ) | $ | (13,158 | ) | |||||||||||||||
| (*) | In these tables transfers in and transfers out are recognized as of the beginning of the reporting period for commodity derivatives and as of the transfer date for warrants. |
| (**) | Gains and losses related to commodity derivatives are reported in product revenue, gains and losses related to warrants are recorded in other expense (income), and gains and losses related to fresh-start and plan effect adjustments are recorded in reorganization items gain (loss) in the consolidated statements of operations. |
Commodity derivative contracts
Our consolidated results of operations and cash flows are impacted by changes in market prices for petroleum products. This exposure to commodity price risk is managed, in part, by entering into various commodity derivatives.
We seek to manage the price risk associated with our marketing operations by limiting our net open positions through (i) the concurrent purchase and sale of like quantities of crude oil to create back-to-back transactions that are intended to lock in positive margins based on the timing, location or quality of the crude oil purchased and delivered or (ii) derivative contracts. Our storage and transportation assets also can be used to mitigate location and time basis risk. All marketing activities are subject to our comprehensive risk management policy, which establishes limits in order to manage risk and mitigate financial exposure.
F-38
Table of Contents
SEMGROUP CORPORATION
Notes to Consolidated Financial Statements
| 15. | FINANCIAL INSTRUMENTS AND CONCENTRATIONS OF RISK, Continued |
As described in Note 5, we contributed the primary operating assets of SemStream to NGL Energy on November 1, 2011, including all of SemStream’s commodity derivatives. Prior to November 1, 2011, SemStream managed commodity price risk by limiting its net open positions subject to outright price risk and basis risk resulting from grade, location or time differences. SemStream did so by selling and purchasing similar quantities of natural gas liquids with purchase and sale transactions for current or future delivery, by entering into future delivery and purchase obligations with futures contracts or other commodity derivatives and employing its storage and transportation assets. SemStream at times hedged its natural gas liquids commodity price exposure with derivatives on commodities other than natural gas liquids due to the limited size of the market for natural gas liquids derivatives. In addition, physical transaction sale and purchase strategies were intended to lock in positive margins for SemStream, e.g., the sales price was sufficient to cover purchase costs, any other fixed and variable costs and SemStream’s profit. All marketing activities were subject to our risk management policy, which establishes limits to manage risk and mitigate financial exposure.
Our commodity derivatives were comprised of swaps, future contracts, and forward contracts of crude oil and natural gas liquids. These are defined as follows:
Swaps—Over the counter transactions where a floating price, basis or index is exchanged for a fixed (or a different floating) price, basis, or index at a preset schedule in the future according to an agreed-upon formula.
Futures contracts—Exchange traded contracts to buy or sell a commodity. These contracts are standardized by the exchange in terms of quality, quantity, delivery period and location for each commodity.
Forward contracts—Over the counter contracts to buy or sell a commodity at an agreed upon future date. The buyer and seller agree on specific terms (price, quantity, delivery period, and location) and conditions at the inception of the contract.
The following table sets forth the notional quantities for derivative instruments entered into (amounts in thousands of barrels):
| Successor | ||||||||
| Year Ended December 31, 2011 |
Year Ended December 31, 2010 |
|||||||
| Sales |
18,869 | 16,227 | ||||||
| Purchases |
18,572 | 14,955 | ||||||
We have not designated any of our commodity derivative instruments as accounting hedges. We record the fair value of our commodity derivative instruments on our consolidated balance sheets in other current assets and other current liabilities in the following amounts (in thousands):
| Successor |
||||||||||||
| December 31, 2011 |
December 31, 2010 | |||||||||||
| Other |
Other Current Liabilities |
Other Current Assets |
Other Current Liabilities |
|||||||||
| $162 | $ | — | $ | 4,368 | $ | 14,122 | ||||||
F-39
Table of Contents
SEMGROUP CORPORATION
Notes to Consolidated Financial Statements
| 15. | FINANCIAL INSTRUMENTS AND CONCENTRATIONS OF RISK, Continued |
Realized and unrealized gains (losses) from our commodity derivatives were recorded to product revenue in the following amounts (in thousands):
| Successor |
Predecessor | |||||||
|
Year Ended |
Year Ended |
Month Ended |
Eleven Months | |||||
| $2,153 | $(11,969) | $(13,589) | $(32,268) | |||||
Interest rate swaps
As described in Note 17, we entered into certain interest swaps during February 2011. The swaps are recorded at fair value in other noncurrent liabilities on the consolidated balance sheet, with changes in the fair value (net of income taxes) recorded to other comprehensive income (loss).
Concentrations of risk
During the year ended December 31, 2011, no individual customer accounted for more than 10% of our consolidated revenue. At December 31, 2011, one customer of the SemCrude segment accounted for approximately 16% of our consolidated accounts receivable.
During the year ended December 31, 2010, no individual customer accounted for more than 10% of our consolidated revenue.
During the month ended December 31, 2009, our continuing operations generated approximately $15.8 million of revenue from one customer of the SemStream segment, which represented approximately 11% of our consolidated revenue from continuing operations. At December 31, 2009, no individual customer accounted for more than 10% of our consolidated accounts receivable.
During the eleven months ended November 30, 2009, we generated approximately $178.4 million in revenue from one customer of the Crude segment, which represented approximately 20% of our consolidated revenue from continuing operations. Approximately 17% of our consolidated costs of products sold were purchased from one of the Crude segment’s suppliers.
Assets and liabilities of subsidiaries outside the United States
The following table summarizes the assets and liabilities (excluding affiliate balances) at December 31, 2011 of our subsidiaries outside the United States (amounts in thousands):
| Canada | United Kingdom |
Mexico | Total | |||||||||||||
| Cash and cash equivalents |
$ | 47,791 | $ | 9,964 | $ | 8,754 | $ | 66,509 | ||||||||
| Other current assets |
63,418 | 2,836 | 29,979 | 96,233 | ||||||||||||
| Noncurrent assets |
167,513 | 170,371 | 50,506 | 388,390 | ||||||||||||
|
|
|
|
|
|
|
|
|
|||||||||
| Total assets |
278,722 | 183,171 | 89,239 | 551,132 | ||||||||||||
| Current liabilities |
$ | 33,480 | $ | 23,979 | $ | 23,374 | $ | 80,833 | ||||||||
| Noncurrent liabilities |
80,282 | 33,686 | 4,258 | 118,226 | ||||||||||||
|
|
|
|
|
|
|
|
|
|||||||||
| Total liabilities |
113,762 | 57,665 | 27,632 | 199,059 | ||||||||||||
|
|
|
|
|
|
|
|
|
|||||||||
| Net assets |
$ | 164,960 | $ | 125,506 | $ | 61,607 | $ | 352,073 | ||||||||
|
|
|
|
|
|
|
|
|
|||||||||
F-40
Table of Contents
SEMGROUP CORPORATION
Notes to Consolidated Financial Statements
| 15. | FINANCIAL INSTRUMENTS AND CONCENTRATIONS OF RISK, Continued |
Employees
At December 31, 2011, we had approximately 710 employees, including approximately 480 employees outside the U.S. Approximately 106 of the employees in Canada and Mexico are represented by labor unions and are subject to collective bargaining agreements. Of these employees, approximately 55 are subject to collective bargaining agreements that will expire in 2012 and approximately 51 expiring in 2013.
| 16. | INCOME TAXES |
Prior to the Emergence Date, we generally did not record a provision for U.S. federal or state income taxes since SemGroup, L.P. was a partnership and was not subject to such taxes. Upon emergence from bankruptcy, we became a corporation and are now subject to U.S. federal and state income taxes. Our subsidiaries based in Canada, the United Kingdom, and Mexico have been subject to income taxes in those jurisdictions throughout the period of these financial statements.
As described in Note 5, SemCAMS and SemCanada Crude were deconsolidated from the Petition Date through the Emergence Date. Amounts shown for income (loss) from continuing operations before income taxes and for provision (benefit) for income taxes in the following tables do not include SemCAMS and SemCanada Crude for the eleven months ended November 30, 2009.
Income tax expense (benefit)
Our consolidated income (loss) from continuing operations before income taxes was generated in the following jurisdictions (in thousands):
| Successor | Predecessor | |||||||||||||||
| Year Ended December 31, 2011 |
Year Ended December 31, 2010 |
Month Ended December 31, 2009 |
Eleven Months Ended November 30, 2009 |
|||||||||||||
| U.S. |
$ | 30,292 | $ | (35,242 | ) | $ | (18,478 | ) | $ | 3,488,471 | ||||||
| Foreign |
(29,886 | ) | (105,487 | ) | (26,863 | ) | 53,531 | |||||||||
|
|
|
|
|
|
|
|
|
|||||||||
| Consolidated |
$ | 406 | $ | (140,729 | ) | $ | (45,341 | ) | $ | 3,542,002 | ||||||
|
|
|
|
|
|
|
|
|
|||||||||
The following table summarizes income tax expense (benefit) from continuing operations by jurisdiction (in thousands):
| Successor | Predecessor | |||||||||||||||
| Year Ended December 31, 2011 |
Year Ended December 31, 2010 |
Month Ended December 31, 2009 |
Eleven Months Ended November 30, 2009 |
|||||||||||||
| Current income tax provision (benefit): |
||||||||||||||||
| Foreign |
$ | 7,427 | $ | 7,376 | $ | (2,518 | ) | $ | (53,182 | ) | ||||||
| U.S. federal |
— | — | — | — | ||||||||||||
| U.S. state |
4 | 120 | 106 | — | ||||||||||||
|
|
|
|
|
|
|
|
|
|||||||||
| 7,431 | 7,496 | (2,412 | ) | (53,182 | ) | |||||||||||
| Deferred income tax provision (benefit): |
||||||||||||||||
| Foreign |
(7,252 | ) | (16,570 | ) | (5,146 | ) | 59,492 | |||||||||
| U.S. federal |
(2,251 | ) | 2,450 | 311 | — | |||||||||||
| U.S. state |
(344 | ) | 401 | 38 | — | |||||||||||
|
|
|
|
|
|
|
|
|
|||||||||
| (9,847 | ) | (13,719 | ) | (4,797 | ) | 59,492 | ||||||||||
|
|
|
|
|
|
|
|
|
|||||||||
| Provision (benefit) for income taxes |
$ | (2,416 | ) | $ | (6,223 | ) | $ | (7,209 | ) | $ | 6,310 | |||||
|
|
|
|
|
|
|
|
|
|||||||||
F-41
Table of Contents
SEMGROUP CORPORATION
Notes to Consolidated Financial Statements
| 16. | INCOME TAXES, Continued |
The following table reconciles income tax provision (benefit) at the U.S. federal statutory rate to the consolidated provision (benefit) for income taxes (in thousands):
| Successor | Predecessor | |||||||||||||||
| Year Ended December 31, 2011 |
Year Ended December 31, 2010 |
Month Ended December 31, 2009 |
Eleven Months Ended November 30, 2009 |
|||||||||||||
| Income (loss) from continuing operations before income taxes |
$ | 406 | $ | (140,729 | ) | $ | (45,341 | ) | $ | 3,542,002 | ||||||
| U.S. federal statutory rate |
35 | % | 35 | % | 35 | % | 35 | % | ||||||||
|
|
|
|
|
|
|
|
|
|||||||||
| Provision at statutory rate |
142 | (49,255 | ) | (15,869 | ) | 1,239,701 | ||||||||||
| State income taxes—net of federal benefit |
(221 | ) | 339 | 93 | — | |||||||||||
| Effect of rates other than statutory |
(1,360 | ) | 2,447 | (7,151 | ) | (4,226 | ) | |||||||||
| Effect of U.S. taxation on foreign branches |
(10,460 | ) | (36,920 | ) | — | — | ||||||||||
| Foreign tax adjustment |
— | — | (1,442 | ) | (10,595 | ) | ||||||||||
| Impairment of goodwill |
15,745 | 21,411 | — | — | ||||||||||||
| Partnership income not subject to tax provision |
— | — | — | (1,218,570 | ) | |||||||||||
| Foreign tax credit and offset to branch deferreds |
9,339 | 13,392 | (99,190 | ) | — | |||||||||||
| Impact of valuation allowance on deferred tax assets |
(13,152 | ) | 38,184 | 115,418 | — | |||||||||||
| Other, net |
(2,449 | ) | 4,179 | 932 | — | |||||||||||
|
|
|
|
|
|
|
|
|
|||||||||
| Provision for income taxes |
$ | (2,416 | ) | $ | (6,223 | ) | $ | (7,209 | ) | $ | 6,310 | |||||
|
|
|
|
|
|
|
|
|
|||||||||
For the eleven months ended November 30, 2009, SemGroup, L.P. was a partnership and, therefore, was not subject to U.S. federal and state income taxes. For the month ended December 31, 2009 and the years ended December 31, 2010 and 2011, the foreign subsidiaries are disregarded entities for U.S. federal income tax purposes. The foreign earnings are taxed in foreign jurisdictions as well as in the U.S. Foreign tax credits, subject to limitations, are available to reduce U.S. taxes.
F-42
Table of Contents
SEMGROUP CORPORATION
Notes to Consolidated Financial Statements
| 16. | INCOME TAXES, Continued |
Deferred tax positions
Deferred income taxes reflect the effects of temporary differences between the amounts of assets and liabilities recognized for financial reporting purposes and the amounts recognized for income tax purposes. Significant components of deferred tax assets and liabilities are as follows at December 31, 2011 and 2010 (in thousands):
| Successor | ||||||||
| December 31, 2011 |
December 31, 2010 |
|||||||
| Deferred tax assets: |
||||||||
| Net operating loss and other credit carryforwards |
$ | 43,009 | $ | 34,625 | ||||
| Compensation and benefits |
1,606 | 3,334 | ||||||
| Unrealized gain/(loss) |
93 | — | ||||||
| Inventories |
48 | 729 | ||||||
| Intangible assets |
56,328 | 40,212 | ||||||
| Pension plan |
4,541 | 3,398 | ||||||
| Allowance for doubtful accounts |
2,189 | 5,573 | ||||||
| Deferred revenue |
7,281 | 7,267 | ||||||
| Foreign tax credit and offset to branch deferreds |
77,293 | 84,969 | ||||||
| Other |
6,798 | 5,984 | ||||||
| less: valuation allowance |
(148,945 | ) | (162,202 | ) | ||||
|
|
|
|
|
|||||
| Net deferred tax assets |
50,241 | 23,889 | ||||||
|
|
|
|
|
|||||
| Deferred tax liabilities: |
||||||||
| Intangible assets |
(9,069 | ) | (12,582 | ) | ||||
| Prepaid expenses |
(142 | ) | (109 | ) | ||||
| Unrealized gain/(loss) |
— | (2,497 | ) | |||||
| Property, plant and equipment |
(76,957 | ) | (90,803 | ) | ||||
| Equity Investment in partnerships |
(28,696 | ) | (1,658 | ) | ||||
| Other |
(8,586 | ) | (1,379 | ) | ||||
|
|
|
|
|
|||||
| Total deferred tax liabilities |
(123,450 | ) | (109,028 | ) | ||||
|
|
|
|
|
|||||
| Net deferred tax assets (liabilities) |
$ | (73,209 | ) | $ | (85,139 | ) | ||
|
|
|
|
|
|||||
At December 31, 2011, we had a cumulative U.S. federal net operating loss of approximately $105.5 million that can be carried forward to apply against taxable income generated in future years. This carry forward begins to expire in 2029. We had U.S. capital losses of approximately $4.3 million and cumulative U.S. state net operating losses of approximately $80.9 million available for carry forward, which begin to expire in 2014.
Due to our emergence from bankruptcy and overall restructuring, we have recorded a valuation allowance on deferred tax assets. This valuation allowance decreased by $13.2 million in 2011 due primarily to a net increase in the amount of certain liabilities that have been considered as a source of future taxable income in establishing the amount of the valuation allowance. We have not yet been able to benefit from the net operating loss and foreign tax credit carry forwards above the extent of these liabilities. The current year net increase in the deferred tax liabilities results primarily from non-recognition of the gain recorded on the SemStream segment transaction as described in Note 6.
We have analyzed filing positions in all of the federal, state and foreign jurisdictions where we are required to file income tax returns and determined that no accruals related to uncertainty in tax positions are required. All income tax years of the company ending after the Emergence Date remain open for examination in all
F-43
Table of Contents
SEMGROUP CORPORATION
Notes to Consolidated Financial Statements
| 16. | INCOME TAXES, Continued |
jurisdictions. In foreign jurisdictions, all tax years within the revelant statute of limitations for periods prior to the Emergence Date remain open for examination.
Income taxable to partners prior to Emergence Date
Prior to the Emergence Date, SemGroup L.P.’s earnings were allocated to its general and limited partners, who were responsible for any related U.S. federal and state income taxes. Net earnings for financial statement purposes may have differed significantly from taxable income reportable to the partners, due to differences between the tax basis and financial reporting basis of assets and liabilities and also due to the taxable income allocation requirements under SemGroup, L.P.’s partnership agreement.
Individual partners had different investment bases, depending upon timing and price of the acquisition of partnership interests. Further, each partner’s tax accounting, which was dependent upon the partner’s tax position, may have differed from the accounting followed in the consolidated financial statements. Accordingly, there could be significant differences between each individual partner’s tax basis and the partner’s share of the net assets reported in the consolidated financial statements. We do not have access to information about each individual partner’s tax attributes, and the aggregate tax basis cannot be readily determined.
In addition to federal income taxes, partners may have been subject to other taxes, such as state and local taxes, foreign federal and local taxes and unincorporated business taxes that may have been imposed by the various jurisdictions in which SemGroup, L.P. conducted business or owned property. Furthermore, partners may have been required to file foreign federal income tax returns, pay foreign income taxes, file state income tax returns and pay taxes in various states.
Pro forma income tax provision (unaudited)
We estimate that, had we become a taxable corporation on January 1, 2009, the Predecessor’s provision for income taxes would have been $1.2 billion for the eleven months ended November 30, 2009. This estimated pro forma income tax provision assumes that the gain on extinguishment of debt in the reorganization process would have been a taxable event. The pro forma tax provision was calculated by applying an assumed U.S. federal and state income tax rate of 35.53% to actual historical income before income taxes, taking into account estimated permanent differences. The pro forma tax provision may not be indicative of the results that actually would have occurred if we had become a taxable corporation on January 1, 2009 or the results that may occur in the future.
| 17. | LONG-TERM DEBT |
Our long-term debt consisted of the following (in thousands):
| Successor | ||||||||
| December 31, 2011 |
December 31, 2010 |
|||||||
| SemGroup corporate revolving credit facility |
$ | 82,000 | $ | — | ||||
| Previous SemGroup corporate credit facilities |
— | 324,065 | ||||||
| Rose Rock credit facility |
— | — | ||||||
| SemLogistics credit facility |
23,180 | 24,289 | ||||||
| SemMexico credit facility |
4,046 | — | ||||||
| Capital leases |
109 | 89 | ||||||
|
|
|
|
|
|||||
| Total long-term debt |
109,335 | 348,443 | ||||||
| less: current portion of long-term debt |
26,058 | 12 | ||||||
|
|
|
|
|
|||||
| Noncurrent portion of long-term debt |
$ | 83,277 | $ | 348,431 | ||||
|
|
|
|
|
|||||
F-44
Table of Contents
SEMGROUP CORPORATION
Notes to Consolidated Financial Statements
| 17. | LONG-TERM DEBT, Continued |
SemGroup corporate credit agreement
During June 2011, we entered into a new credit agreement that consisted of a revolving facility, a Term Loan A and a Term Loan B. We used the proceeds from the new credit facilities to retire our previous revolving credit facility and term loan, which we had entered into upon emergence from bankruptcy. Later in 2011, we retired the Term Loan A and Term Loan B on the new credit facility, using proceeds from the contribution of SemStream assets to NGL Energy, proceeds from the Rose Rock IPO and borrowings on the revolving credit facility.
The revolving credit facility has a capacity of $320 million at December 31, 2011. This capacity may be used either for cash borrowings or letters of credit, although the maximum letter of credit capacity is $250 million. At December 31, 2011, we had outstanding cash borrowings of $82 million on this facility and outstanding letters of credit of $12.5 million. The principal is due on June 20, 2016, and any letters of credit expire on June 13, 2016. Earlier principal payments may be required if we enter into certain transactions to sell assets or obtain new borrowings. We have the right to make additional principal payments without incurring any penalties for early repayment.
Interest on revolving credit cash borrowings is charged at either a Eurodollar rate or an alternate base rate, at our election. The Eurodollar rate is calculated as:
| • | the London Interbank Offered Rate (“LIBOR”) for U.S. dollar deposits adjusted for currency requirements; plus |
| • | a margin that can range from 2.5% to 4.0%, depending on a leverage ratio specified in the agreement. |
The alternate base rate is calculated as:
| • | the greater of i) the U.S. Prime Rate, ii) the Federal Funds Effective Rate plus 0.5%, or iii) one-month LIBOR plus 1%; plus |
| • | a margin that can range from 1.5% to 3.0%, depending on a leverage ratio specified in the agreement. |
At December 31, 2011, there was $82 million of outstanding revolving cash borrowings, $75 million of which incurred interest at the Eurodollar rate and $7 million of which incurred interest at the alternate base rate. The interest rate in effect at December 31, 2011 on the $75 million of Eurodollar rate borrowings was 3.16%, calculated as LIBOR of 0.28% plus a margin of 2.875%. The interest rate in effect at December 31, 2011 on the $7 million of alternate base rate borrowings was 5.125%, calculated as the prime rate of 3.25% plus a margin of 1.875%.
At each interest payment date, we have the option of electing whether interest will be charged at the Eurodollar rate or at the alternate base rate for the following interest period. If we elect the alternate base rate, the following interest payment date will be at the end of the calendar quarter. If we elect the Eurodollar rate, we may elect for the next interest payment date to occur after one, two, three, or six months, or any other period acceptable to the lenders.
Fees are charged on any outstanding letters of credit at a rate that ranges from 2.5% to 4.0%, depending on a leverage ratio specified in the credit agreement. At December 31, 2011, the rate in effect was 2.875%. In addition, a fronting fee of 0.25% is charged on outstanding letters of credit. A commitment fee of 0.5% is charged on any unused capacity on the revolving credit facility. In addition, we are charged an annual administrative fee of $0.1 million. We also paid $11.9 million of fees to lenders and advisors, $5.2 million of which is attributable to the revolving credit agreement, and which was recorded in other noncurrent assets and is being amortized over the life of the agreement. The remaining $6.7 million of these fees were attributable to the term loans, and were fully amortized during 2011.
F-45
Table of Contents
SEMGROUP CORPORATION
Notes to Consolidated Financial Statements
| 17. | LONG-TERM DEBT, Continued |
We recorded interest expense related to the new SemGroup revolving credit facility of $2.8 million for the year ended December 31, 2011, including amortization of debt issuance costs. We recorded interest expense related to the SemGroup Term Loans A and B of $13.1 million for the year ended December 31, 2011, including amortization of debt issuance costs.
The credit agreement includes customary affirmative and negative covenants, including limitations on the creation of new indebtedness, liens, sale and lease-back transactions, new investments, making fundamental changes including mergers and consolidations, making of dividends and other distributions, making material changes in our business, modifying certain documents and maintenance of a consolidated leverage ratio and an interest coverage ratio. In addition, the credit agreement prohibits any commodity transactions that are not permitted by our Comprehensive Risk Management Policy.
The credit agreement includes customary events of default, including events of default relating to non-payment of principal and other amounts owing under the credit agreement from time to time, including in respect of letter of credit disbursement obligations, inaccuracy of representations and warranties in any material respect when made or when deemed made, violation of covenants, cross payment-defaults to any material indebtedness, cross acceleration to any material indebtedness, bankruptcy and insolvency events, the occurrence of a change of control, certain unsatisfied judgments, certain ERISA events, certain environmental matters and certain assertions of or actual invalidity of certain loan documents. A default under the credit agreement would permit the participating banks to terminate commitments, require immediate repayment of any outstanding loans with interest and any unpaid accrued fees, and require the cash collateralization of outstanding letter of credit obligations.
The credit agreement restricts our ability to make certain types of payments related to our capital stock, including the declaration or payment of dividends. The credit agreement is guaranteed by all of our material domestic subsidiaries (except for Rose Rock Midstream Holdings, L.L.C.) and secured by a lien on substantially all of our property and assets, subject to customary exceptions. At December 31, 2011, we were in compliance with the terms of the credit agreement.
As a condition upon the closing and effectiveness of the Rose Rock revolving credit facility, SemGroup Corporation agreed to reduce its revolving racility commitment to $300 million within 30 days following the closing of Rose Rock’s IPO.
Previous SemGroup Corporation term loan and revolving credit facilities
Pursuant to the Plan of Reorganization, on November 30, 2009, we entered into a revolving credit facility and a term loan. We retired these facilities in June 2011 upon entering into a new credit agreement (described above). The revolving credit facility included capacity for cash borrowings and letters of credit.
We paid $27 million in fees to the lenders at the inception of the agreement, which we recorded in other noncurrent assets and amortized over the life of the agreement.
Interest on revolving cash borrowings was charged at a floating rate, which was calculated as 5.5% plus whichever of the following yielded the highest rate: a) the Federal Funds Effective Rate plus 0.5%; b) the Prime Rate; c) the three-month LIBOR rate plus 1.5%, or d) 2.5%. In addition, a facility fee of $0.4 million was charged each year.
The facility included a fee that was payable at maturity. Interest was charged on this fee at a floating rate, which was calculated as 7.0% plus the greater of LIBOR or 1.5%.
Certain of the letters of credit were prefunded. Fees were charged on this prefunded tranche at a range of 7.0% to 8.5%. Fees on additional outstanding letters of credit were charged at a rate of 7.0%.
F-46
Table of Contents
SEMGROUP CORPORATION
Notes to Consolidated Financial Statements
| 17. | LONG-TERM DEBT, Continued |
Fees ranging from 1.5% to 2.5% were charged on any lender commitments that we did not utilize.
Interest was charged on the term loan at a rate of 9%. We had the option under certain circumstances to defer interest on the term loan; when we selected this option, interest was charged during that period at a rate of 11%.
We recorded interest expense related to these facilities of $39.3 million during the year ended December 31, 2011, $71.5 million during the year ended December 31, 2010, and $5.7 million during the month ended December 31, 2009. Included in interest expense is the amortization of debt issuance costs of $22.2 million for the year ended December 31, 2011 (which includes a $17.4 million reduction due to the refinancing of the credit facility) and $23.6 million for the year ended December 31, 2010.
Rose Rock credit facility
On November 10, 2011, our subsidiary Rose Rock entered into a senior secured revolving credit facility agreement. This credit facility became effective upon completion of the Rose Rock IPO on December 14, 2011. This credit agreement provides for a revolving credit facility of $150 million. The agreement also provides that the revolving credit facility may, under certain conditions, be increased by up to $200 million. The credit facility includes a $75 million sub-limit for the issuance of letters of credit for the account of Rose Rock or its loan parties. All amounts outstanding under the facility will be due and payable on December 14, 2016.
At Rose Rock’s option, amounts borrowed under the credit agreement will bear interest at either the Eurodollar rate or an alternate base rate (“ABR”), plus, in each case, an applicable margin. Until the date the financial statements relating to the first quarter after the effective date of the credit agreement have been delivered, the applicable margin relating to any Eurodollar loan will be 2.25% and with respect to any ABR loan will be 1.25%. After such financial statements have been delivered, the applicable margin will range from 2.25% to 3.25% in the case of a Eurodollar rate loan, and from 1.25% to 2.25% in the case of an ABR loan, in each case, based on a leverage ratio. At December 31, 2011, there were no revolving cash borrowings.
Fees are charged on any outstanding letters of credit at a rate that ranges from 2.25% to 3.25%, depending on a leverage ratio specified in the credit agreement. At December 31, 2011, there were $22.6 million in outstanding letters of credit, and the rate in effect was 2.25%. In addition, a fronting fee of 0.25% is charged on outstanding letters of credit.
A commitment fee that ranges from 0.375% to 0.50%, depending on a leverage ratio specified in the credit agreement, is charged on any unused capacity of the revolving credit facility. In addition, we are charged an annual administrative fee of $0.1 million. The credit facility also allows for the use of Secured Bilateral Letters of Credit. At December 31, 2011, we had $17.0 million of Bilateral Letters of Credit outstanding and the interest rate in effect was 1.75%.
We recorded $0.1 million of interest expense during December 2011 related to this facility, including amortization of debt issuance costs.
The credit agreement includes customary representations and warranties and affirmative and negative covenants. The covenants in the agreement include limitations on creation of new indebtedness and liens, entry into sale and lease-back transactions, investments, and fundamental changes including mergers and consolidations, dividends and other distributions, material changes in Rose Rock’s business and modifying certain documents. The agreement also requires the maintenance of a specified consolidated leverage ratio
and an interest coverage ratio. In addition, the agreement prohibits any commodity transactions that are not permitted by Rose Rock’s Comprehensive Risk Management Policy.
F-47
Table of Contents
SEMGROUP CORPORATION
Notes to Consolidated Financial Statements
| 17. | LONG TERM DEBT, Continued |
The credit agreement includes customary events of default, including events of default relating to non-payment of principal and other amounts owing under the agreement from time to time, including in respect of letter of credit disbursement obligations, inaccuracy of representations and warranties in any material respect when made or when deemed made, violation of covenants, cross payment-defaults of Rose Rock and its restricted subsidiaries to any material indebtedness, cross acceleration to any material indebtedness, bankruptcy and insolvency events, the occurrence of a change of control, certain unsatisfied judgments, certain ERISA events, certain environmental matters and certain assertions of or actual invalidity of certain loan documents. A default under the Rose Rock credit agreement would permit the participating banks to terminate commitments, require immediate repayment of any outstanding loans with interest and any unpaid accrued fees, and require the cash collateralization of outstanding letter of credit obligations.
The credit agreement restricts Rose Rock’s ability to make certain types of payments relating to its capital stock, including the declaration or payment of dividends; provided that Rose Rock may make quarterly distributions of available cash so long as no default under the agreement then exists or would result therefrom. The agreement is:
| • | guaranteed by all of Rose Rock’s material domestic subsidiaries; and |
| • | secured by a lien on substantially all of the property and assets of Rose Rock and the guarantors, subject to customary exceptions. |
At December 31, 2011, we were in compliance with the terms of the credit agreement.
SemLogistics credit facilities
SemLogistics entered into a credit agreement in December 2010, which includes a £15 million term loan and a £15 million revolving credit facility (U.S. $23.2 million each, at the December 31, 2011 exchange rate). The proceeds from this new facility were used to retire SemLogistics’ previous credit facility.
The revolving credit facility can be utilized either for cash borrowings or letters of credit. The number of cash borrowings may not exceed five at any point in time and the number of outstanding letters of credit may not exceed ten at any point in time. At December 31, 2011, no cash borrowings were outstanding under the revolving facility and no letters of credit were utilized.
Interest is charged on both the term loan and the revolving loans (including letters of credit) at a floating rate, which is calculated as LIBOR plus a margin that ranges from 1.75% to 2.5%, depending on whether SemLogistics meets certain financial ratios specified in the agreement. The interest rate in effect at December 31, 2011 was 2.84%, which was calculated as 1.75% plus the LIBOR rate of 1.09%. Interest on the term loan and revolving facility are payable quarterly. A commitment fee of 0.50% is charged on any unused commitments under the facility and is payable quarterly. In addition, SemLogistics paid fees of $1.3 million upon inception of the facility, which were recorded to other noncurrent assets and are being amortized over the life of the facility.
During February 2011, we entered into three interest swap agreements. The intent of the swaps is to offset a portion of the variability in interest payments due under the term loan. The swaps require us to pay a fixed rate of 2.49% on a combined notional amount of £7.5 million (which declines during the final year of the swap until it reaches £7.0 million) each quarter through March 31, 2014. The swaps entitle us to receive a floating rate equal to LIBOR on the same notional amount.
F-48
Table of Contents
SEMGROUP CORPORATION
Notes to Consolidated Financial Statements
| 17. | LONG-TERM DEBT, Continued |
Failure to comply with the provisions of the credit agreement could cause events of default, which could result in increases in interest rates, the debt becoming due and payable, or other adverse consequences. The events of default include the failure to pay fees, interest, or principal when due, a breach of any material representation or warranty contained in the credit agreement, a breach of certain covenants, any default under any of the agreements entered into in connection with the loan, bankruptcy, judgments and attachments, any event of default under our other credit agreements, default events relating to employee benefit plans, the guarantees, or collateral documents or the credit agreement failing to be in full force and effect or being declared null and void, or the occurrence of an event that is reasonably likely to have a material adverse effect on our ability to meet our obligations under the facility. In addition, cross acceleration will occur if we do not pay any other debt facility.
SemLogistics used the proceeds from the term loan to retire its previous credit agreement, which it had entered into on November 30, 2009. The previous facility bore interest at a floating rate, which was calculated as LIBOR plus a margin ranging from 5.5% to 6.0%. In addition, SemLogistics paid $2.1 million of fees to the lender at the inception of the agreement.
SemLogistics recorded interest expense of $1.0 million for the year ended December 31, 2011, $4.0 million for the year ended December 31, 2010, and $0.4 million for the month ended December 31, 2009, including amortization of debt issuance costs. SemLogistics recorded the fair value of the interest swaps as a noncurrent liability of $0.4 million at December 31, 2011, with a corresponding adjustment to other comprehensive income (net of income taxes).
At December 31, 2011, the outstanding balance of the SemLogistics credit facility has been classified as a current liability as we have committed to the banks to terminate the credit facility by March 31, 2012. The interest rate swaps will be terminated with an expected loss on closure of £250,000 (U.S. $0.4 million at the December 31, 2011 exchange rate). At December 31, 2011, unamortized capitalized loan fees of $0.8 million were included in other assets, net on the consolidated balance sheet.
At December 31, 2011, we were in compliance with the terms of the credit agreement.
SemCrude Pipeline credit facility
SemCrude Pipeline, L.L.C. (“SemCrude Pipeline”), which is a wholly-owned subsidiary that holds our ownership interest in White Cliffs, borrowed $125 million under a credit agreement on November 30, 2009. SemCrude Pipeline retired this facility during September 2010.
Interest was generally charged on the SemCrude Pipeline credit facility at a floating rate, which was calculated as 6% plus the greater of LIBOR or 1.5%. In addition, we paid $4.8 million in fees to the lender at the inception of the agreement, which have been fully amortized. We recorded interest expense related to this facility of $11.0 million during the year ended December 31, 2010 and $1.1 million for the month ended December 31, 2009.
SemMexico facilities
During 2010, SemMexico entered into a credit agreement that allowed SemMexico to borrow up to 80 million Mexican pesos at any time through June 2011. Borrowings on this facility are required to be repaid with monthly payments through May 2013. At December 31, 2011, borrowings of 56.7 million pesos (U.S. $4.0 million) were outstanding on this facility. Borrowings are unsecured and bear interest at the bank prime rate in Mexico plus 1.5%. At December 31, 2011, the interest rate in effect was 6.31%, calculated as 1.5% plus the bank prime rate of 4.81%.
F-49
Table of Contents
SEMGROUP CORPORATION
Notes to Consolidated Financial Statements
| 17. | LONG-TERM DEBT, Continued |
SemMexico also has outstanding letters of credit of 210 million Mexican pesos at December 31, 2011 (U.S. $15.0 million). Fees are generally charged on outstanding letters of credit at a rate of 0.40% for 196 million Mexican pesos (U.S. $14.0 million) in letters of credit and 1.0% for 14 million Mexican pesos (U.S. $1.0 million) in letters of credit.
During 2011, SemMexico entered into an additional credit agreement that allows SemMexico to borrow up to 56 million Mexican pesos (U.S. $4.0 million at the December 31, 2011 exchange rate) at any time during the term of the facility, which matures in August 2012. Borrowings would be unsecured and would bear interest at the bank prime rate in Mexico plus 1.7%.
SemMexico recorded interest expense of $0.4 million during the year ended December 31, 2011 related to these facilities.
At December 31, 2011, we were in compliance with the terms of these facilities.
Scheduled principal payments
The following table summarizes the scheduled principal payments as of December 31, 2011 (in thousands). As described above, our credit agreements require accelerated principal payments under certain circumstances. As a result, principal payments may occur earlier than shown in the table below.
| SemGroup Facility |
Rose Rock Facility |
SemLogistics Facility |
SemMexico Facility |
Capital Leases |
Total | |||||||||||||||||||
| For the year ended: |
||||||||||||||||||||||||
| December 31, 2012 |
$ | — | $ | — | $ | 23,180 | $ | 2,857 | $ | 21 | $ | 26,058 | ||||||||||||
| December 31, 2013 |
— | — | — | 1,189 | 21 | 1,210 | ||||||||||||||||||
| December 31, 2014 |
— | — | — | — | 21 | 21 | ||||||||||||||||||
| December 31, 2015 |
— | — | — | — | 21 | 21 | ||||||||||||||||||
| December 31, 2016 |
82,000 | — | — | — | 20 | 82,020 | ||||||||||||||||||
| Thereafter |
— | — | — | — | 5 | 5 | ||||||||||||||||||
|
|
|
|
|
|
|
|
|
|
|
|
|
|||||||||||||
| Total |
$ | 82,000 | $ | — | $ | 23,180 | $ | 4,046 | $ | 109 | $ | 109,335 | ||||||||||||
|
|
|
|
|
|
|
|
|
|
|
|
|
|||||||||||||
Fair value
We estimate that the fair value of our long-term debt was not materially different than the recorded values at December 31, 2011. We estimate that the fair value of our fixed-rate term loan was $316.4 million at December 31, 2010 (compared to a recorded value of $308.7 million) and that the fair value of the other (floating rate) credit agreements approximated their recorded values at December 31, 2010.
Long-term debt prior to Emergence Date
Prior to the Petition Date, SemGroup, L.P. was a borrower on several credit agreements. Substantially all of SemGroup L.P.’s assets were pledged as collateral under these agreements. The bankruptcy petitions and related events caused events of default on all of the credit agreements. In addition, the examiner appointed by the bankruptcy court alleged that certain of SemGroup L.P.’s commodity trading practices prior to the Petition Date may have violated covenants under the credit agreements.
During 2008, while under bankruptcy protection, we obtained a debtor-in-possession credit facility to fund working capital and reorganization costs. We repaid the full balance of this facility at the Emergence Date.
F-50
Table of Contents
SEMGROUP CORPORATION
Notes to Consolidated Financial Statements
| 17. | LONG-TERM DEBT, Continued |
All of the long-term debt prior to the Emergence Date, with the exception of certain capital leases, was repaid, refinanced, or extinguished as part of the reorganization process.
While in bankruptcy, we only recorded interest expense to the extent such interest was expected to be paid. Interest obligations in the amount of $221 million during the eleven months ended November 30, 2009 related to pre-petition credit agreements that were expected to be compromised (i.e., not paid in full) in the reorganization process were not recorded as expenses.
| 18. | COMMITMENTS AND CONTINGENCIES |
Bankruptcy matters
| (a) | Confirmation order appeals |
Manchester Securities appeal. On October 21, 2009, Manchester Securities Corporation, a creditor of SemGroup Holdings, L.P. (one of our subsidiaries), filed an objection to the Plan of Reorganization. In the objection, Manchester argued that the Plan of Reorganization should not be confirmed because it did not provide for an alleged $50 million claim of SemGroup Holdings, L.P. against SemCrude Pipeline, L.L.C. (another of our subsidiaries). On October 28, 2009, the bankruptcy court overruled the objection and entered the confirmation order approving the Plan of Reorganization. On November 4, 2009, Manchester filed a notice of appeal of the confirmation order. On December 4, 2009, Manchester’s appeal was docketed in the United States District Court for the District of Delaware. We filed a motion to dismiss the appeal as equitably moot. On February 18, 2011, the District Court granted our motion to dismiss the appeal. On March 22, 2011, Manchester filed a notice to appeal this order. On January 2, 2012, the United States Court of Appeals affirmed the judgment of the District Court to dismiss the appeal. Manchester has not filed a petition for rehearing or a petition for a writ of certiorari with the United States Supreme Court. The deadline for filing a petition for rehearing has passed. The deadline for filing a petition for a writ of certiorari with the Supreme Court is March 2, 2012.
Luke Oil appeal. On October 21, 2009, Luke Oil Company, C&S Oil/Cross Properties, Inc., Wayne Thomas Oil and Gas and William R. Earnhardt Company (collectively, “Luke Oil”) filed an objection to the Plan of Reorganization “to the extent that the Plan of Reorganization may alter, impair, or otherwise adversely affect Luke Oil’s legal rights or other interests.” On October 28, 2009, the bankruptcy court overruled the Luke Oil objection and entered the confirmation order. On November 6, 2009, Luke Oil filed a notice of appeal. On December 23, 2009, Luke Oil’s appeal was docketed in the United States District Court for the District of Delaware. We filed a motion to dismiss the appeal as equitably moot. Briefing on this matter is complete, but the motion to dismiss has not been ruled upon by the District Court. While we believe that this action is without merit and are vigorously defending this matter on appeal, an adverse ruling on this action could have a material adverse impact on us.
| (b) | Investigations |
Around the time of our bankruptcy filings, several governmental agencies launched investigations regarding the circumstances of the filings. The mandate and scope of these investigations were very broad and the investigations are ongoing.
Bankruptcy examiner. On October 14, 2008, the bankruptcy court appointed an examiner to (i) investigate the circumstances surrounding our trading strategy prior to bankruptcy filings; (ii) investigate the circumstances surrounding certain insider transactions and the formation of
F-51
Table of Contents
SEMGROUP CORPORATION
Notes to Consolidated Financial Statements
| 18. | COMMITMENTS AND CONTINGENCIES, Continued |
SemGroup Energy Partners L.P. (a former subsidiary); (iii) investigate the circumstances surrounding the potential improper use of borrowed funds and funds generated from operations and the liquidation of assets to satisfy margin calls related to our trading strategy and that of certain entities owned or controlled by former officers and directors of the general partner of SemGroup, L.P.; (iv) determine whether any directors, officers or employees of the general partner of SemGroup, L.P. participated in fraud, dishonesty, incompetence, misconduct, mismanagement, or irregularity in the management of our affairs; and (v) determine whether the SemGroup debtor estates have causes of action against current or former officers, directors, or employees of the general partner of SemGroup, L.P. arising from such participation. The examiner’s report was filed with the bankruptcy court on April 15, 2009.
Certain current and prior employees of the general partner of SemGroup, L.P. are referenced in the examiner’s report and the report’s conclusions may suggest possible civil or criminal liability on their part. To the extent such claims exist, they are property of a litigation trust that was established for the benefit of pre-petition creditors pursuant to the Plan of Reorganization, and are not property of the reorganized SemGroup Corporation. This litigation trust is pursuing claims against certain former officers, at its own expense. We may incur expenses, which are not expected to be material, related to information and document requests of the litigation trust related to such claims. Any indemnification obligations to such officers by SemGroup, L.P. were discharged under the Plan of Reorganization.
SEC. On August 5, 2008 and September 5, 2008, we received requests for voluntary production from the Securities and Exchange Commission (“SEC”). On September 24, 2008, the SEC entered an Order Directing Private Investigation and Designating Officers to Take Testimony that pertains to us. The SEC has also served us with subpoenas dated October 24, 2009, December 11, 2009 and November 15, 2010, seeking further documents and information. We complied with the SEC requests and subpoenas. On November 28, 2011, the staff of the SEC notified us that their investigation had been completed and that they did not intend to recommend any enforcement action by the Commission.
CFTC. On June 19, 2008, we received a request for voluntary production from the Commodity Futures Trading Commission (“CFTC”). Subsequent to the bankruptcy filings, the CFTC sent other requests for voluntary production. The CFTC has also served subpoenas upon us requiring us to produce various documents and for the depositions of our representatives. We continue to comply with the CFTC’s requests. We are unaware of any currently pending formal charges against us by the CFTC.
DOJ. On July 15, 2008, we received a subpoena from the Department of Justice (“DOJ”) directing us to produce documents responsive to the subpoena. We contacted the DOJ regarding the subpoena and the DOJ verbally voluntarily stayed compliance with the subpoena. We have not produced any documents to the DOJ and, to our knowledge, the DOJ is not currently pursuing any such production. We are unaware of any currently pending formal charges against us by the DOJ.
| (c) | Claims reconciliation process |
A large number of parties have made claims against us for obligations alleged to have been incurred prior to our bankruptcy filing. On September 15, 2010, the bankruptcy court entered an order estimating the contingent, unliquidated and disputed claims and authorizing distributions to holders of allowed claims. Pursuant to that order we have begun making distributions to the claimants. We continue to attempt to settle unresolved claims.
Pursuant to the Plan of Reorganization, we committed to settle authorized and allowed bankruptcy claims by paying a specified amount of cash, issuing a specified number of warrants, and issuing a specified number of shares of SemGroup Corporation common stock. We do not believe the resolution of the remaining outstanding claims will exceed the total amount of consideration established under the
F-52
Table of Contents
SEMGROUP CORPORATION
Notes to Consolidated Financial Statements
| 18. | COMMITMENTS AND CONTINGENCIES, Continued |
Plan of Reorganization for all claimants; instead, the resolution of the remaining claims in some cases will impact the relative share of the established pool of common stock and warrants that certain claimants receive.
However, under certain circumstances we could be required to pay additional funds to settle the specified group of claims to be settled with cash. Pursuant to the Plan of Reorganization, a specified amount of restricted cash was set aside at the Emergence Date, which we expect to be sufficient to settle this group of claims. Since the Emergence Date, we have made significant progress in resolving these claims, and we continue to believe that the cash set aside at the Emergence Date will be sufficient to settle these claims. However, we have not yet reached a resolution of all of these claims, and if the total settlement amount of all of these claims exceeds the specified amount, we will be required to pay additional funds to satisfy the total settlement amount for this specified group of claims. If this were to become probable of occurring, we would be required to record a liability and a corresponding expense.
Blueknight claim
Blueknight Energy Partners, L.P. (“Blueknight”), which was formerly a subsidiary of SemGroup, together with other entities related to Blueknight, entered into a Shared Services Agreement on April 7, 2009, with SemCrude, L.P. and SemManagement, L.L.C. (which are currently subsidiaries of SemGroup). The services provided by SemCrude to Blueknight under this agreement included the coordination of movement of crude oil belonging to Blueknight’s customers and the operation of Blueknight’s Oklahoma pipeline system and its Cushing, Oklahoma terminal. Under the subsequent amendments to the agreements beginning in May 2010, certain of these services were phased out, and Blueknight began to manage the movement of its crude oil and the operation of its Cushing terminal.
In a letter dated August 18, 2011, Blueknight claimed that SemCrude owes Blueknight approximately 141,000 barrels of crude oil. We responded to Blueknight’s letter denying their charges and requesting documentation from Blueknight of its claim. We continued to respond to requests for information and to review documentation provided by Blueknight; however, on February 14, 2012, Blueknight filed suit against us, Rose Rock Midstream GP, L.L.C. and Rose Rock Midstream, L.P. in the District Court of Oklahoma County, Oklahoma in connection with this claim. We continue to maintain that there is no basis for their claim and will vigorously defend this matter; however, we cannot reliably predict the outcome.
Other matters
We are party to various other claims, legal actions, and complaints arising in the ordinary course of business. In the opinion of our management, the ultimate resolution of these claims, legal actions, and complaints, after consideration of amounts accrued, insurance coverage, and other arrangements, will not have a material adverse effect on our consolidated financial position, results of operations or cash flows. However, the outcome of such matters is inherently uncertain, and estimates of our consolidated liabilities may change materially as circumstances develop.
Environmental
We may from time to time experience leaks of petroleum products from our facilities, as a result of which we may incur remediation obligations or property damage claims. In addition, we are subject to numerous environmental regulations. Failure to comply with these regulations could result in the assessment of fines or penalties by regulatory authorities.
F-53
Table of Contents
SEMGROUP CORPORATION
Notes to Consolidated Financial Statements
| 18. | COMMITMENTS AND CONTINGENCIES, Continued |
The Kansas Department of Health and Environment (“the KDHE”) initiated discussions during our bankruptcy proceeding regarding six of our sites in Kansas (five owned by SemCrude and one owned by SemGas) that KDHE believes, based on their historical use, may have soil or groundwater contamination in excess of state standards. KDHE sought our agreement to undertake assessments of these sites to determine whether they are contaminated. We reached an agreement with KDHE on this matter and entered into a Consent Agreement and Final Order with KDHE to conduct environmental assessments on the sites and to pay KDHE’s costs associated with their oversight of this matter. We have conducted phase II investigations at all sites. Four of the six sites have limited amounts of soil contamination that will be excavated and/or remediated on site. Four of the six sites appear to have ground water contamination that may require further delineation and/or on-going monitoring. We are preparing work plans to submit to the State of Kansas for approval. We do not anticipate any penalties or fines for these historical sites.
A water pipeline break occurred at a SemCAMS facility during August 2010. This resulted in a spill of material that was predominantly salt water containing a small amount of hydrocarbons. The incident was investigated by Environment Canada and Alberta Environment. On February 14, 2012, charges were filed against SemCAMS by the Federal Government of Canada (Department of Fisheries) and the Province of Alberta (Alberta Environment) in connection with this incident. SemCAMS is summoned to appear in court in Fox Creek, Province of Alberta to respond to the charges. We are currently reviewing the charges and will request disclosure from the agencies in order to determine our response. Although it is not possible to predict the outcome of these proceedings, we accrued a liability for estimated fines and environmental contributions of $0.4 million in December 2010 which we still carry on our books at December 31, 2011.
Asset retirement obligations
We will be required to incur significant removal and restoration costs when we retire our natural gas gathering and processing facilities in Canada. We have recorded a liability associated with these obligations, which is reported within other noncurrent liabilities on the consolidated balance sheets. The following table summarizes the changes in this liability from November 30, 2009 (the date we reconsolidated SemCAMS) through December 31, 2011 (in thousands):
| Balance at November 30, 2009 (Successor) |
$ | 23,791 | ||
| Accretion |
205 | |||
| Changes in estimated timing and amount of payments (Note 6) |
4,738 | |||
| Currency translation adjustments |
262 | |||
|
|
|
|||
| Balance at December 31, 2009 (Successor) |
28,996 | |||
|
|
|
|||
| Accretion |
3,523 | |||
| Payments made |
(1,144 | ) | ||
| Currency translation adjustments |
1,509 | |||
|
|
|
|||
| Balance at December 31, 2010 (Successor) |
32,884 | |||
|
|
|
|||
| Accretion |
4,114 | |||
| Payments made |
(341 | ) | ||
| Currency translation adjustments |
(771 | ) | ||
|
|
|
|||
| Balance at December 31, 2011 (Successor) |
$ | 35,886 | ||
|
|
|
The December 31, 2011 liability was calculated using the $105.3 million cost we estimate we would incur to retire these facilities, discounted based on our risk-adjusted cost of borrowing and the estimated timing of remediation.
F-54
Table of Contents
SEMGROUP CORPORATION
Notes to Consolidated Financial Statements
| 18. | COMMITMENTS AND CONTINGENCIES, Continued |
The calculation of the liability for an asset retirement obligation requires the use of significant estimates, including those related to the length of time before the assets will be retired, cost inflation over the assumed life of the assets, actual remediation activities to be required, and the rate at which such obligations should be discounted. Future changes in these estimates could result in material changes in the value of the recorded liability. In addition, future changes in laws or regulations could require us to record additional asset retirement obligations. The $105.3 million estimated cost represents only our proportionate share of the obligations associated with these facilities. An additional $44.2 million of estimated costs are attributable to third-party owners’ proportionate share of the obligations. If an owner fails to perform on its obligations, the other owners (including SemGroup) could be obligated to bear that party’s share of the remediation costs.
Our other segments may also be subject to removal and restoration costs upon retirement of their facilities. However, we do not believe the present value of such obligations under current laws and regulations, after taking into account the estimated lives of our facilities, is material to our financial position or results of operations.
Leases
We have entered into capital and operating lease agreements for office space, office equipment, land, trucks and tank storage. Future minimum payments required under operating leases that have initial or remaining non-cancelable lease terms in excess of one year at December 31, 2011 are as follows (in thousands):
| Capital Leases |
Operating Leases |
|||||||
| For year ending: |
||||||||
| December 31, 2012 |
$ | 21 | $ | 5,185 | ||||
| December 31, 2013 |
21 | 4,674 | ||||||
| December 31, 2014 |
21 | 2,446 | ||||||
| December 31, 2015 |
21 | 1,774 | ||||||
| December 31, 2016 |
20 | 1,564 | ||||||
| Thereafter |
5 | 7,920 | ||||||
|
|
|
|
|
|||||
| Total future minimum lease payments |
$ | 109 | $ | 23,563 | ||||
|
|
|
|
|
|||||
SemGroup Corporation recorded lease and rental expenses of $9.4 million for the year ended December 31, 2011, $10.6 million for the year ended December 31, 2010 and $1.1 million for the month ended December 31, 2009. SemGroup, L.P. recorded lease and rental expense from continuing operations of $7.5 million for the eleven months ended November 30, 2009.
F-55
Table of Contents
SEMGROUP CORPORATION
Notes to Consolidated Financial Statements
| 18. | COMMITMENTS AND CONTINGENCIES, Continued |
Purchase and sale commitments
We routinely enter into agreements to purchase and sell petroleum products at specified future dates. We account for these commitments as normal purchases and sales, and therefore we do not record assets or liabilities related to these agreements until the product is purchased or sold. At December 31, 2011, such commitments included the following (in thousands):
| At December 31, 2011 | ||||||||
| Volume (barrels) |
Value ($) | |||||||
| Fixed price purchases |
150 | 13,442 | ||||||
| Fixed price sales |
150 | 14,496 | ||||||
| Floating price purchases |
32,217 | 3,128,239 | ||||||
| Floating price sales |
32,835 | 3,140,511 | ||||||
Certain of the commitments shown in the table above relate to agreements to purchase product from a counterparty and to sell a similar amount of product (in a different location) to the same counterparty. Many of the commitments shown in the table above are cancellable by either party, as long as notice is given within the time frame specified in the agreement (generally 30 to 120 days).
In addition, our SemGas segment enters into contracts under which we are responsible for marketing the majority of the gas and natural gas liquids produced by the counterparties to the agreements. In 2011, the majority of SemGas’ revenues were generated from such contracts.
| 19. | EQUITY |
Common stock
Upon emergence from bankruptcy, we issued 40,882,496 shares of common stock. The Plan of Reorganization specified that we were to issue an additional 517,500 shares of common stock in settlement of pre-petition claims. As of December 31, 2011, we have issued 182,174 shares of this stock and will issue the remainder as the process of resolving the claims progresses. The owners’ equity balances on the consolidated balance sheets include the shares that are required to be issued in settlement of pre-petition claims. The shares of common stock reflected on the consolidated balance sheet at December 31, 2011 are summarized below:
| Shares issued on Emergence Date |
40,882,496 | |||
| Shares subsequently issued in settlement of pre-petition claims |
182,174 | |||
| Remaining shares required to be issued in settlement of pre-petition claims |
335,326 | |||
| Issuance of shares under employee and director compensation programs |
419,403 | |||
| Shares issued upon exercise of warrants |
7 | |||
|
|
|
|||
| Total shares |
41,819,406 | |||
|
|
|
|||
| Par value per share |
$ | 0.01 | ||
|
|
|
|||
| Common stock on December 31, 2011 balance sheet |
$ | 418,194 | ||
|
|
|
In addition to the shares in the table above, there are shares of unvested restricted stock outstanding at December 31, 2011. The par value of these shares has not yet been reflected in common stock on the consolidated balance sheet, as these shares have not yet vested. There are also shares of restricted stock that were returned to treasury upon forfeiture. The par value of these shares is not reflected in the consolidated balance sheet, as no accounting recognition is given to forfeited shares.
F-56
Table of Contents
SEMGROUP CORPORATION
Notes to Consolidated Financial Statements
| 19. | EQUITY, Continued |
The common stock includes Class A and Class B stock. Class A stock is eligible to be listed on an exchange, whereas Class B stock is not. Any share of Class B stock may be converted to Class A at the election of the holder. Both classes of stock have full voting rights. Both classes of stock have a par value of $0.01 per share. The total number of shares authorized for issuance is 90,000,000 shares of Class A stock and 10,000,000 shares of Class B stock.
On October 28, 2011, we adopted a limited duration Stockholders Rights Plan (the “Rights Plan”) and declared a dividend of one right on each outstanding share of our Class A common stock. Under the Rights Plan, the rights generally will become exercisable only if a person or group acquires beneficial ownership of 10% or more of our Class A common stock in a transaction not approved by our Board of Directors. In that situation, each holder of a right (other than the acquiring person, whose rights will become void and will not be exercisable) will be entitled to purchase, at the then-current price, additional shares of Class A common stock having a value of twice the exercise price of the right. In addition, if we are acquired in a merger or other business combination after an unapproved party acquires more than 10% of our Class A common stock, each holder of the right would then be entitled to purchase, at the then-current exercise price, shares of the acquiring company’s stock having a value of twice the exercise price of the right. We may redeem the rights for $0.001 per right at any time before an event that causes the rights to become exercisable. Under the Rights Plan’s terms, the rights will expire one day after the date of our 2012 Annual Meeting of Stockholders.
Warrants
Upon emergence from bankruptcy protection, we issued 1,634,210 warrants. The Plan of Reorganization specified that we were to issue an additional 544,737 warrants in settlement of the pre-petition claims. As of December 31, 2011, we have issued 191,752 of the warrants and will issue the remainder as the process of resolving the claims progresses. Beginning September 2011, the warrants began trading on the New York Stock Exchange under the ticker symbol, SEMGWS. The warrants reflected on the consolidated balance sheet at December 31, 2011 are summarized below:
| Warrants issued on Emergence Date |
1,634,210 | |||
| Warrants subsequently issued in settlement of pre-petition claims |
191,752 | |||
| Remaining warrants to be issued in settlement of pre-petition claims |
352,985 | |||
| Warrants exercised |
(7 | ) | ||
|
|
|
|||
| Total warrants at December 31, 2011 |
2,178,940 | |||
|
|
|
|||
| Fair value per warrant at December 31, 2011 |
$ | 5.59 | ||
|
|
|
|||
| Warrant value included within other noncurrent liabilities on December 31, 2011 consolidated balance sheet |
$ | 12,180,275 | ||
|
|
|
Each warrant entitles the holder to purchase one share of common stock for $25 at any time before the November 30, 2014 expiration date. Upon exercise, a holder may elect a cashless exercise, whereby the number of shares to be issued to the holder is reduced, in lieu of a cash payment. The closing price of our common stock was $26.06 per share on December 31, 2011. In the event of a change in control of the Company, the holders of the warrants would have the right to sell the warrants to us, and we would have the right to purchase the warrants from the holders. In either case, the price to be paid for the warrants would be calculated using a standard pricing model with inputs specified in the warrants agreement.
F-57
Table of Contents
SEMGROUP CORPORATION
Notes to Consolidated Financial Statements
| 20. | EARNINGS PER SHARE |
Successor
The following summarizes the calculation of basic earnings per share for the year ended December 31, 2011 and basic and diluted earnings per share for the year ended December 31, 2010 and the month ended December 31, 2009 (amounts in thousands, except per share amounts):
| Year Ended December 31, 2011 | ||||||||||||
| Continuing Operations |
Discontinued Operations |
Net | ||||||||||
| Income (loss) |
$ | 2,822 | $ | (10 | ) | $ | 2,812 | |||||
| less: Income attributable to noncontrolling interest |
435 | — | 435 | |||||||||
|
|
|
|
|
|
|
|||||||
| Numerator |
$ | 2,387 | $ | (10 | ) | $ | 2,377 | |||||
| Common stock issued and to be issued pursuant to Plan of Reorganization |
41,400 | 41,400 | 41,400 | |||||||||
| Weighted average common stock outstanding issued under compensation plans |
240 | 240 | 240 | |||||||||
|
|
|
|
|
|
|
|||||||
| Denominator |
41,640 | 41,640 | 41,640 | |||||||||
|
|
|
|
|
|
|
|||||||
| Basic earnings per share |
$ | 0.06 | $ | 0.00 | $ | 0.06 | ||||||
|
|
|
|
|
|
|
|||||||
| Year Ended December 31, 2010 | ||||||||||||
| Continuing Operations |
Discontinued Operations |
Net | ||||||||||
| Income (loss) |
$ | (134,506 | ) | $ | 2,434 | $ | (132,072 | ) | ||||
| less: Income attributable to noncontrolling interest |
225 | — | 225 | |||||||||
|
|
|
|
|
|
|
|||||||
| Numerator |
$ | (134,731 | ) | $ | 2,434 | $ | (132,297 | ) | ||||
| Common stock issued and to be issued pursuant to Plan of Reorganization |
41,400 | 41,400 | 41,400 | |||||||||
| Weighted average common stock outstanding issued under compensation plans |
2 | 2 | 2 | |||||||||
|
|
|
|
|
|
|
|||||||
| Denominator |
41,402 | 41,402 | 41,402 | |||||||||
|
|
|
|
|
|
|
|||||||
| Basic and diluted earnings (loss) per share |
$ | (3.25 | ) | $ | 0.06 | $ | (3.20 | ) | ||||
|
|
|
|
|
|
|
|||||||
| Month Ended December 31, 2009 | ||||||||||||
| Continuing Operations |
Discontinued Operations |
Net | ||||||||||
| Income (loss) |
$ | (38,132 | ) | $ | 215 | $ | (37,917 | ) | ||||
| less: Income attributable to noncontrolling interest |
(25 | ) | — | (25 | ) | |||||||
|
|
|
|
|
|
|
|||||||
| Numerator |
$ | (38,107 | ) | $ | 215 | $ | (37,892 | ) | ||||
| Common stock issued and to be issued pursuant to Plan of Reorganization |
41,400 | 41,400 | 41,400 | |||||||||
|
|
|
|
|
|
|
|||||||
| Denominator |
41,400 | 41,400 | 41,400 | |||||||||
|
|
|
|
|
|
|
|||||||
| Basic and diluted earnings (loss) per share |
$ | (0.92 | ) | $ | 0.00 | $ | (0.92 | ) | ||||
|
|
|
|
|
|
|
|||||||
F-58
Table of Contents
SEMGROUP CORPORATION
Notes to Consolidated Financial Statements
| 20. | EARNINGS PER SHARE, Continued |
The following summarizes the calculation of diluted earnings per share for the year ended December 31, 2011 (amounts in thousands, except per share amounts):
| Year Ended December 31, 2011 | ||||||||||||
| Continuing Operations |
Discontinued Operations |
Net | ||||||||||
| Income (loss) |
$ | 2,822 | $ | (10 | ) | $ | 2,812 | |||||
| less: Income attributable to noncontrolling interest |
435 | — | 435 | |||||||||
| less: Income resulting from change in fair value of warrants |
5,012 | — | 5,012 | |||||||||
|
|
|
|
|
|
|
|||||||
| Numerator |
$ | (2,625 | ) | $ | (10 | ) | $ | (2,635 | ) | |||
| Common stock issued and to be issued pursuant to Plan of Reorganization |
41,400 | 41,400 | 41,400 | |||||||||
| Weighted average common stock outstanding issued under compensation plans |
240 | 240 | 240 | |||||||||
|
|
|
|
|
|
|
|||||||
| Denominator |
41,640 | 41,640 | 41,640 | |||||||||
|
|
|
|
|
|
|
|||||||
| Diluted earnings (loss) per share |
$ | (0.06 | ) | $ | 0.00 | $ | (0.06 | ) | ||||
|
|
|
|
|
|
|
|||||||
Since we experienced losses from continuing operations during the year ended December 31, 2010 and the month ended December 31, 2009, the share-based compensation (described in Note 21) did not cause any dilution for these periods.
For the year ended December 31, 2011, we recorded a gain on the change in the fair value of the warrants of $5 million which creates a loss from continuing operations when excluded from the numerator for the calculation of diluted EPS for the period. For the year ended December 31, 2010, we recorded a loss on the change in the fair value of the warrants; because of this, the warrants did not cause any dilution for that period. For the month ended December 31, 2009, the average price of our common stock was at or below the exercise price of the warrants, and therefore the warrants did not cause any dilution for that period.
On January 11, 2012, we issued 91,712 shares of common stock upon the vesting of certain grants of restricted stock and restricted stock units. These shares are not reflected in the shares of common stock shown in the tables above.
Predecessor
Prior to the Emergence Date, SemGroup, L.P. was structured as a partnership. All general and limited partner ownership interests in SemGroup, L.P. were cancelled in the reorganization process.
F-59
Table of Contents
SEMGROUP CORPORATION
Notes to Consolidated Financial Statements
| 20. | EARNINGS PER SHARE, Continued |
The following table presents unaudited pro forma earnings per share for the eleven months ended November 30, 2009, assuming that the same number of shares of SemGroup Corporation common stock required to be issued pursuant to the Plan of Reorganization had been outstanding during the periods presented. No effect is given to equity-based compensation of the Predecessor, since such agreements were denominated in limited partner units. The pro forma earnings per share may not be indicative of the results that actually would have occurred if the equity structure of the reorganized company had been in place during the periods shown below or the results that may occur in the future. Amounts in the table are in thousands, except per share amounts.
| Eleven Months Ended November 30, 2009 (unaudited) |
||||||||||||
| Continuing Operations |
Discontinued Operations |
Net | ||||||||||
| Income (loss) |
$ | 3,535,692 | $ | (141,613 | ) | $ | 3,394,079 | |||||
| less: Income (loss) attributable to noncontrolling interests |
(505 | ) | — | (505 | ) | |||||||
|
|
|
|
|
|
|
|||||||
| Numerator |
$ | 3,536,197 | $ | (141,613 | ) | $ | 3,394,584 | |||||
| Common stock issued and to be issued pursuant to Plan of Reorganization |
41,400 | 41,400 | 41,400 | |||||||||
|
|
|
|
|
|
|
|||||||
| Denominator (pro forma) |
41,400 | 41,400 | 41,400 | |||||||||
|
|
|
|
|
|
|
|||||||
| Earnings (loss) per share (pro forma) |
$ | 85.42 | $ | (3.42 | ) | $ | 81.99 | |||||
|
|
|
|
|
|
|
|||||||
F-60
Table of Contents
SEMGROUP CORPORATION
Notes to Consolidated Financial Statements
| 21. | EQUITY-BASED COMPENSATION |
SemGroup Corporation (Successor) equity awards
We have reserved a total of 2,781,635 shares of common stock for issuance pursuant to employee and director compensation programs. Upon emergence from bankruptcy, we began issuing awards of restricted stock and restricted stock units pursuant to such programs. These awards give the recipients the right to receive shares of common stock, once specified service or performance related vesting conditions are met. We record expense for these awards (and corresponding increases to additional paid-in capital) based on the grant date fair value of the awards. Although these awards are to be settled in shares, we may elect to give participants the option of settling a portion of the awards in cash, to meet statutory minimum tax withholding requirements. The activity related to these awards is summarized below:
| Unvested Shares |
Average Grant Date Fair Value(*) |
|||||||
| Awards granted - 2009 |
148,533 | $ | 25.00 | |||||
|
|
|
|||||||
| Outstanding at December 31, 2009 |
148,533 | $ | 25.00 | |||||
| Awards granted - 2010 |
562,295 | $ | 25.00 | |||||
| Awards vested - 2010 |
(92,833 | ) | $ | 25.00 | ||||
| Awards forfeited - 2010 |
(115,093 | ) | $ | 25.00 | ||||
|
|
|
|||||||
| Outstanding at December 31, 2010 |
502,902 | $ | 25.00 | |||||
| Awards granted - 2011 (**) |
173,982 | $ | 28.90 | |||||
| Awards vested - 2011 |
(201,361 | ) | $ | 25.00 | ||||
| Awards forfeited - 2011 |
(65,017 | ) | $ | 25.36 | ||||
|
|
|
|||||||
| Outstanding at December 31, 2011 |
410,506 | $ | 26.59 | |||||
| (*) | The grant date fair value of awards issued prior to our listing on the New York Stock Exchange was estimated at $25 per share, which was the per share reorganization value of the Company (described in Note 8). |
| (**) | For certain of the awards granted in 2011, the number of shares that will vest is contingent upon our achievement of certain specified targets. If we meet the specified maximum targets, approximately 30,000 additional shares could vest. |
The following table summarizes the scheduled vesting of awards that have been granted as of December 31, 2011:
| Year ended December 31, 2012 |
158,915 shares | |||
| Year ended December 31, 2013 |
107,042 shares | |||
| Year ended December 31, 2014 |
174,093 shares |
The awards may be subject to accelerated vesting in the event of involuntary terminations.
The following table summarizes the expense we have recorded and expect to record related to awards that have been granted through December 31, 2011:
| Month ended December 31, 2009 |
$ | 233,720 | ||
| Year ended December 31, 2010 |
$ | 6,229,920 | ||
| Year ended December 31, 2011 |
$ | 5,424,360 | ||
| Year ended December 31, 2012 (estimated) |
$ | 4,745,894 | ||
| Year ended December 31, 2013 (estimated) |
$ | 1,520,852 | ||
| Year ended December 31, 2014 (estimated) |
$ | 1,007,879 |
F-61
Table of Contents
SEMGROUP CORPORATION
Notes to Consolidated Financial Statements
| 21. | EQUITY-BASED COMPENSATION, Continued |
Restricted stock granted subsequent to December 31, 2011
During first quarter 2012, we granted approximately 131,700 awards of restricted stock and restricted stock units that will vest on January 19, 2015, contingent upon the continued service of the recipients. Also during the first quarter 2012, we granted certain restricted stock awards that will vest in 2015, contingent not only on the continued service of the recipients, but also on our achievement of certain specified targets. The maximum number of these awards that could vest is approximately 128,650 shares, if we meet the specified maximum performance targets.
Retention Awards
During June 2010, we granted retention awards to certain officers and employees, which were scheduled to vest in December 2011, contingent on the continued service of the recipients. Each award had a specified value that was payable either in cash or in shares of SemGroup stock.
We recorded $2.4 million of expense during 2011 and $2.0 million of expense during 2010 related to these retention awards. Upon vesting during 2011, we settled awards with a value of $1.2 million by paying cash, and we settled awards with a value of $3.2 million by issuing 125,212 shares of common stock.
| 22. | EMPLOYEE BENEFIT PLANS |
Defined contribution plans
We sponsor defined contribution retirement plans in which the majority of employees are eligible to participate. SemGroup Corporation’s contributions to the defined contribution plans were $1.1 million for the year ended December 31, 2011, $1.3 million for the year ended December 31, 2010, and $0.1 million for the month ended December 31, 2009. SemGroup, L.P.’s contributions to the defined contribution plans related to continuing operations were $1.2 million for the eleven months ended November 30, 2009.
F-62
Table of Contents
SEMGROUP CORPORATION
Notes to Consolidated Financial Statements
| 22. | EMPLOYEE BENEFIT PLANS, Continued |
Pension plans
We sponsor a defined benefit pension plan and a supplemental defined benefit pension plan (collectively, the “Pension Plans”) for certain employees of the SemCAMS segment. The following table shows the projected benefit obligations and plan assets of the Pension Plans (in thousands):
| Successor | ||||||||
| December 31, 2011 |
December 31, 2010 |
|||||||
| Change in projected benefit obligation: |
||||||||
| Projected benefit obligation at beginning of year |
$ | 29,182 | $ | 26,475 | ||||
| Service cost |
742 | 783 | ||||||
| Interest cost |
1,494 | 1,560 | ||||||
| Actuarial (gains) losses |
1,247 | 3,096 | ||||||
| Benefits paid |
(5,430 | ) | (3,985 | ) | ||||
| Currency translation adjustment |
(468 | ) | 1,253 | |||||
|
|
|
|
|
|||||
| Projected benefit obligation at end of year |
26,767 | 29,182 | ||||||
| Change in fair value of plan assets: |
||||||||
| Fair value of plan assets at beginning of year |
24,063 | 19,959 | ||||||
| Employer contributions |
2,903 | 5,186 | ||||||
| Actual return on plan assets |
(143 | ) | 1,831 | |||||
| Benefits paid |
(5,430 | ) | (3,985 | ) | ||||
| Currency translation adjustment |
(385 | ) | 1,072 | |||||
|
|
|
|
|
|||||
| Fair value of plan assets at end of year |
21,008 | 24,063 | ||||||
|
|
|
|
|
|||||
| Funded status: |
$ | (5,759 | ) | $ | (5,119 | ) | ||
|
|
|
|
|
|||||
| Accumulated benefit obligation at end of year |
$ | 25,242 | $ | 25,940 | ||||
To compute the December 31, 2011 projected benefit obligation of the Pension Plans, we used a discount rate of 4.25% and an assumed rate of compensation increase of 3.5%. To compute the December 31, 2010 projected benefit obligation of the Pension Plans, we used a discount rate of 5.25% and an assumed rate of compensation increase of 4%.
We recorded other noncurrent liabilities of $5.8 million at December 31, 2011, and $5.1 million at December 31, 2010, to reflect the funded status of the Pension Plans. We recorded changes in the funded status of the Pension Plans to other comprehensive income (loss), net of income taxes. These amounts were a loss of $1.7 million for the year ended December 31, 2011, a loss of $2.0 million for the year ended December 31, 2010, and a gain of $0.8 million for the month ended December 31, 2009.
F-63
Table of Contents
SEMGROUP CORPORATION
Notes to Consolidated Financial Statements
| 22. | EMPLOYEE BENEFIT PLANS, Continued |
The following table summarizes the components of the net periodic benefit cost related to the Pension Plans (in thousands). As described in Note 5, SemCAMS was not consolidated during the eleven months ended November 30, 2009.
| Successor | ||||||||||||
| Year Ended December 31, 2011 |
Year Ended December 31, 2010 |
Month Ended December 31, 2009 |
||||||||||
| Service cost |
$ | 742 | $ | 783 | $ | 64 | ||||||
| Interest cost |
1,494 | 1,560 | 131 | |||||||||
| Expected return on plan assets |
(1,585 | ) | (1,452 | ) | (116 | ) | ||||||
| Settlement loss |
703 | 174 | — | |||||||||
|
|
|
|
|
|
|
|||||||
| Net periodic benefit cost |
$ | 1,354 | $ | 1,065 | $ | 79 | ||||||
|
|
|
|
|
|
|
|||||||
To compute interest cost, we used discount rates of 5.25%, 6.00% and 5.75% for 2011, 2010 and 2009, respectively. To compute expected return on plan assets, we used an estimated rate of return of 6.75% for 2011 and 7.00% for 2010 and 2009.
We estimate that benefit payments from the Pension Plans will be as follows for the years 2012 – 2021 (in thousands):
| Year |
Estimated Benefit Payments |
|||
| 2012 |
$ | 1,831 | ||
| 2013 |
1,727 | |||
| 2014 |
1,716 | |||
| 2015 |
1,914 | |||
| 2016 |
2,096 | |||
| 2017 - 2021 |
9,452 | |||
We estimate that we will make contributions of $1.1 million to the Pension Plans during the year ended December 31, 2012.
Substantially all of the plan’s assets are invested in pooled funds that hold highly-liquid securities. The value of each share of a pooled fund is calculated based on the quoted market prices of the assets held by the fund. The following table shows the value of each category of plan assets at December 31, 2011 and 2010 and the target investment allocation under our investment policy at December 31, 2011:
| Asset Value at December 31, 2011 (in thousands) |
Asset Value at December 31, 2010 (in thousands) |
Actual Allocation at December 31, 2011 |
Normal Allocation Per Investment Policy |
Minimum Allocation Per Investment Policy |
Maximum Allocation Per Investment Policy |
|||||||||||||||||||
| Cash and cash equivalents |
$ | 101 | $ | 30 | 0 | % | 6 | % | 0 | % | 25 | % | ||||||||||||
| Pooled funds—fixed income |
7,986 | 9,170 | 38 | % | 39 | % | 30 | % | 50 | % | ||||||||||||||
| Pooled funds—Canadian equities |
6,724 | 8,078 | 32 | % | 30 | % | 20 | % | 50 | % | ||||||||||||||
| Pooled funds—non-Canadian equities |
6,197 | 6,785 | 29 | % | 25 | % | 5 | % | 60 | % | ||||||||||||||
|
|
|
|
|
|||||||||||||||||||||
| Total |
$ | 21,008 | $ | 24,063 | ||||||||||||||||||||
|
|
|
|
|
|||||||||||||||||||||
F-64
Table of Contents
SEMGROUP CORPORATION
Notes to Consolidated Financial Statements
| 22. | EMPLOYEE BENEFIT PLANS, Continued |
Our investment policy for plan assets permits investments in a wide variety of assets, including certain types of derivatives. Our policy prohibits investments of plan assets in certain types of assets, including commodities, mineral rights, and collectibles. Our investment policy requires us to maintain an investment allocation within the ranges shown in the table above, and also contains more specific requirements that are designed to achieve an appropriate level of diversification. The fair values of the pension plan’s pooled funds are level 2 measurements, while the fair value of the cash and cash equivalents component of plan assets is a level 1 measurement.
Retiree medical plan
We sponsor an unfunded, post-employment health benefit plan (the “Health Plan”) for certain employees of the SemCAMS segment. The projected benefit obligation related to the Health Plan was $1.7 million at December 31, 2011 and $1.7 million at December 31, 2010, and is reported within other noncurrent liabilities on the consolidated balance sheets.
Termination benefits
The laws in Canada, the United Kingdom and Mexico require us to pay certain benefits to employees if their employment is terminated without cause. In addition, we entered into agreements with certain employees in the U.S. that would require us to pay benefits to those employees if their employment is terminated without cause before June 2, 2012. We recorded $1.6 million of expense during 2010 and $0.4 million of expense during 2011 for termination benefits related to the wind-down of certain operations of SemCanada Crude.
F-65
Table of Contents
SEMGROUP CORPORATION
Notes to Consolidated Financial Statements
| 23. | ACCUMULATED OTHER COMPREHENSIVE INCOME (LOSS) |
The following table presents changes in the components of accumulated other comprehensive income (loss) (in thousands):
| Currency Translation |
Employee Benefit Plans |
Interest Rate Swaps |
Total | |||||||||||||
| Balance, December 31, 2008 (Predecessor) |
$ | (40,071 | ) | $ | — | $ | — | $ | (40,071 | ) | ||||||
| Currency translation adjustment |
28,109 | — | — | 28,109 | ||||||||||||
|
|
|
|
|
|
|
|
|
|||||||||
| Balances prior to fresh-start reporting |
(11,962 | ) | — | — | (11,962 | ) | ||||||||||
| Fresh-start reporting adjustment |
11,962 | — | — | 11,962 | ||||||||||||
|
|
|
|
|
|
|
|
|
|||||||||
| Balance, November 30, 2009 (Successor) |
— | — | — | — | ||||||||||||
| Currency translation adjustment |
(4,180 | ) | — | — | (4,180 | ) | ||||||||||
| Changes related to benefit plans, net of income tax expense of $287 |
— | 846 | — | 846 | ||||||||||||
|
|
|
|
|
|
|
|
|
|||||||||
| Balance, December 31, 2009 (Successor) |
(4,180 | ) | 846 | — | (3,334 | ) | ||||||||||
|
|
|
|
|
|
|
|
|
|||||||||
| Currency translation adjustment |
6,475 | — | — | 6,475 | ||||||||||||
| Changes related to benefit plans, net of income tax benefit of $687 |
— | (2,026 | ) | — | (2,026 | ) | ||||||||||
|
|
|
|
|
|
|
|
|
|||||||||
| Balance, December 31, 2010 (Successor) |
2,295 | (1,180 | ) | — | 1,115 | |||||||||||
|
|
|
|
|
|
|
|
|
|||||||||
| Currency translation adjustment |
(13,075 | ) | — | — | (13,075 | ) | ||||||||||
| Changes related to interest rate swaps net income tax benefits of $74 |
— | — | (284 | ) | (284 | ) | ||||||||||
| Changes related to benefit plans, net of income tax benefit of $553 |
— | (1,631 | ) | — | (1,631 | ) | ||||||||||
|
|
|
|
|
|
|
|
|
|||||||||
| Balance, December 31, 2011 (Successor) |
$ | (10,780 | ) | $ | (2,811 | ) | $ | (284 | ) | $ | (13,875 | ) | ||||
|
|
|
|
|
|
|
|
|
|||||||||
F-66
Table of Contents
SEMGROUP CORPORATION
Notes to Consolidated Financial Statements
| 24. | SUPPLEMENTAL CASH FLOW INFORMATION |
Operating assets and liabilities
The following table summarizes the changes in the components of operating assets and liabilities (in thousands):
| Successor | Predecessor | |||||||||||||||||
| Year Ended December 31, 2011 |
Year Ended December 31, 2010 |
Month Ended December 31, 2009 |
Eleven Months Ended November 30, 2009 |
|||||||||||||||
| Decrease (increase) in restricted cash |
$ | 25,827 | $ | 182,898 | $ | (36,911 | ) | $ | (15,082 | ) | ||||||||
| Decrease (increase) in accounts receivable |
28,568 | (26,602 | ) | 4,567 | 318,706 | |||||||||||||
| Decrease (increase) in receivable from affiliates |
(6,071 | ) | (337 | ) | — | — | ||||||||||||
| Decrease (increase) in inventories |
(8,908 | ) | 36,895 | 8,497 | 34,807 | |||||||||||||
| Decrease (increase) in derivatives and margin deposits |
14,287 | 12,146 | (4,495 | ) | (4,717 | ) | ||||||||||||
| Decrease (increase) in other current assets |
(7,214 | ) | 67,216 | 31,850 | 645 | |||||||||||||
| Decrease (increase) in other assets |
(1,874 | ) | 215 | 6,503 | 1,999 | |||||||||||||
| Increase (decrease) in accounts payable and accrued liabilities |
(9,446 | ) | (11,349 | ) | 16,707 | (106,405 | ) | |||||||||||
| Increase (decrease) in payable to affiliates |
6,614 | 257 | — | — | ||||||||||||||
| Increase (decrease) in payables to pre-petition creditors |
(34,490 | ) | (217,471 | ) | (26,787 | ) | — | |||||||||||
| Increase (decrease) in other noncurrent liabilities |
(897 | ) | 18,552 | 267 | — | |||||||||||||
|
|
|
|
|
|
|
|
|
|||||||||||
| $ | 6,396 | $ | 62,420 | $ | 198 | $ | 229,953 | |||||||||||
|
|
|
|
|
|
|
|
|
|||||||||||
Non-cash transactions
We entered into the following non-cash transactions on the Emergence Date:
| • | Retired $123.7 million of existing SemCrude Pipeline debt and paid $1.3 million of debt issuance costs by issuing new debt with a principal balance of $125.0 million; |
| • | Settled certain liabilities subject to compromise by entering into a $300 million term loan credit agreement; |
| • | Retired $29.6 million of existing debt and paid $26.9 million of debt issuance costs by borrowing $56.5 million under a new revolving credit agreement. We also recorded an additional $12.1 million of long-term debt and other noncurrent assets related to deferred charges in the revolving credit agreement. |
Acquisitions and disposals
On November 1, 2011, we contributed certain assets and liabilities to NGL Energy in return for cash and ownership interests in NGL Energy and its general partner. The assets and liabilities we contributed are summarized in Note 6.
At the end of September 2010, we deconsolidated White Cliffs. The assets and liabilities of White Cliffs at the time of deconsolidation are summarized in Note 6.
On November 30, 2009, we reconsolidated certain of our Canadian subsidiaries. The impact of the reconsolidation is summarized in Note 8.
F-67
Table of Contents
SEMGROUP CORPORATION
Notes to Consolidated Financial Statements
| 24. | SUPPLEMENTAL CASH FLOW INFORMATION, Continued |
Other supplemental disclosures
SemGroup Corporation paid cash for interest totaling $32.6 million for the year ended December 31, 2011, $44.5 million for the year ended December 31, 2010 and $2.1 million for the month ended December 31, 2009. SemGroup, L.P. paid cash for interest of $12.3 million during the eleven months ended November 30, 2009.
We elected to defer $19.2 million of interest under a term loan during 2010, as allowed under the term loan agreement. The amount of interest that we deferred was added to the principal balance of the term loan. When we made principal payments on this term loan, we classified the payments as cash used for financing activities in the consolidated statements of cash flows, regardless of whether the principal arose from the initial term loan or from previous interest deferrals.
SemGroup Corporation paid cash for income taxes (net of refunds received) in the amount of $10.1 million during the year ended December 31, 2011, $8.1 million during the year ended December 31, 2010 and $0.1 million for the month ended December 31, 2009. SemGroup, L.P. paid cash for income taxes (net of refunds received) of $3.1 million during the eleven months ended November 30, 2009.
SemGroup Corporation accrued $4.0 million at December 31, 2011, $0.1 million at December 31, 2010 and $0.9 million at December 31, 2009, for purchases of property, plant and equipment.
We recorded non-cash reorganization expense of $20.0 million for the eleven months ended November 30, 2009 (exclusive of the non-cash reorganization items gains related to the implementation of the Plan of Reorganization described in Note 8).
F-68
Table of Contents
SEMGROUP CORPORATION
Notes to Consolidated Financial Statements
| 25. | QUARTERLY FINANCIAL DATA (UNAUDITED) |
Summarized information on the consolidated results of operations of SemGroup Corporation (Successor) for the quarters during the year ended December 31, 2011 is shown below (in thousands, except per share amounts):
| First Quarter |
Second Quarter |
Third Quarter |
Fourth Quarter |
Total | ||||||||||||||||
| Total revenues |
$ | 406,954 | $ | 344,219 | $ | 393,404 | $ | 334,933 | $ | 1,479,510 | ||||||||||
| Loss (gain) on disposal or impairment of long-lived assets, net (Note 6) |
(64 | ) | (72 | ) | (1 | ) | 9,634 | 9,497 | ||||||||||||
| Other operating costs and expenses |
394,784 | 335,854 | 387,570 | 321,184 | 1,439,392 | |||||||||||||||
|
|
|
|
|
|
|
|
|
|
|
|||||||||||
| Total expenses |
394,720 | 335,782 | 387,569 | 330,818 | 1,448,889 | |||||||||||||||
|
|
|
|
|
|
|
|
|
|
|
|||||||||||
| Earnings from equity method investments |
2,064 | 4,086 | 4,016 | 4,838 | 15,004 | |||||||||||||||
|
|
|
|
|
|
|
|
|
|
|
|||||||||||
| Operating income |
14,298 | 12,523 | 9,851 | 8,953 | 45,625 | |||||||||||||||
|
|
|
|
|
|
|
|
|
|
|
|||||||||||
| Other expenses (income), net |
14,599 | 22,624 | (5,828 | ) | 13,824 | 45,219 | ||||||||||||||
|
|
|
|
|
|
|
|
|
|
|
|||||||||||
| Income (loss) from continuing operations before income taxes |
(301 | ) | (10,101 | ) | 15,679 | (4,871 | ) | 406 | ||||||||||||
| Income tax expense (benefit) |
(324 | ) | 2,218 | 1,308 | (5,618 | ) | (2,416 | ) | ||||||||||||
|
|
|
|
|
|
|
|
|
|
|
|||||||||||
| Income (loss) from continuing operations |
23 | (12,319 | ) | 14,371 | 747 | 2,822 | ||||||||||||||
| Income (loss) from discontinued operations, net of income taxes |
9 | 20 | (32 | ) | (7 | ) | (10 | ) | ||||||||||||
|
|
|
|
|
|
|
|
|
|
|
|||||||||||
| Net income (loss) |
32 | (12,299 | ) | 14,339 | 740 | 2,812 | ||||||||||||||
|
|
|
|
|
|
|
|
|
|
|
|||||||||||
| Less: net income attributable to noncontrolling interests |
— | — | — | 435 | 435 | |||||||||||||||
|
|
|
|
|
|
|
|
|
|
|
|||||||||||
| Net income (loss) attributable to SemGroup |
$ | 32 | $ | (12,299 | ) | $ | 14,339 | $ | 305 | $ | 2,377 | |||||||||
|
|
|
|
|
|
|
|
|
|
|
|||||||||||
| Earnings (loss) per share—basic |
$ | 0.00 | $ | (0.30 | ) | $ | 0.34 | $ | 0.01 | $ | 0.06 | |||||||||
| Earnings (loss) per share—diluted |
$ | 0.00 | $ | (0.30 | ) | $ | 0.34 | $ | 0.01 | $ | (0.06 | ) | ||||||||
F-69
Table of Contents
SEMGROUP CORPORATION
Notes to Consolidated Financial Statements
| 25. | QUARTERLY FINANCIAL DATA (UNAUDITED), Continued |
Summarized information on the consolidated results of operations of SemGroup Corporation (Successor) for the quarters during the year ended December 31, 2010 is shown below (in thousands, except per share amounts):
| First Quarter |
Second Quarter |
Third Quarter |
Fourth Quarter |
Total | ||||||||||||||||
| Total revenues |
$ | 476,006 | $ | 315,899 | $ | 385,299 | $ | 453,130 | $ | 1,630,334 | ||||||||||
| Loss on disposal or impairment of long-lived assets, net (Note 6) |
20 | 91,369 | 5,192 | 8,469 | 105,050 | |||||||||||||||
| Other operating costs and expenses |
451,453 | 318,529 | 375,128 | 432,381 | 1,577,491 | |||||||||||||||
|
|
|
|
|
|
|
|
|
|
|
|||||||||||
| Total expenses |
451,473 | 409,898 | 380,320 | 440,850 | 1,682,541 | |||||||||||||||
|
|
|
|
|
|
|
|
|
|
|
|||||||||||
| Earnings from equity method investments |
— | — | — | 1,949 | 1,949 | |||||||||||||||
|
|
|
|
|
|
|
|
|
|
|
|||||||||||
| Operating income (loss) |
24,533 | (93,999 | ) | 4,979 | 14,229 | (50,258 | ) | |||||||||||||
|
|
|
|
|
|
|
|
|
|
|
|||||||||||
| Other expenses, net |
15,015 | 31,230 | 18,409 | 25,817 | 90,471 | |||||||||||||||
|
|
|
|
|
|
|
|
|
|
|
|||||||||||
| Income (loss) from continuing operations before income taxes |
9,518 | (125,229 | ) | (13,430 | ) | (11,588 | ) | (140,729 | ) | |||||||||||
| Income tax expense (benefit) |
843 | (3,357 | ) | 2,242 | (5,951 | ) | (6,223 | ) | ||||||||||||
|
|
|
|
|
|
|
|
|
|
|
|||||||||||
| Income (loss) from continuing operations |
8,675 | (121,872 | ) | (15,672 | ) | (5,637 | ) | (134,506 | ) | |||||||||||
| Income from discontinued operations, net of income taxes |
482 | 894 | 348 | 710 | 2,434 | |||||||||||||||
|
|
|
|
|
|
|
|
|
|
|
|||||||||||
| Net income (loss) |
9,157 | (120,978 | ) | (15,324 | ) | (4,927 | ) | (132,072 | ) | |||||||||||
|
|
|
|
|
|
|
|
|
|
|
|||||||||||
| Less: net income attributable to noncontrolling interests |
61 | 56 | 108 | — | 225 | |||||||||||||||
|
|
|
|
|
|
|
|
|
|
|
|||||||||||
| Net income (loss) attributable to SemGroup |
$ | 9,096 | $ | (121,034 | ) | $ | (15,432 | ) | $ | (4,927 | ) | $ | (132,297 | ) | ||||||
|
|
|
|
|
|
|
|
|
|
|
|||||||||||
| Earnings (loss) per share—basic |
$ | 0.22 | $ | (2.92 | ) | $ | (0.37 | ) | $ | (0.12 | ) | $ | (3.20 | ) | ||||||
| Earnings (loss) per share—diluted |
$ | 0.20 | $ | (2.92 | ) | $ | (0.37 | ) | $ | (0.12 | ) | $ | (3.20 | ) | ||||||
F-70
Table of Contents
SEMGROUP CORPORATION
Notes to Consolidated Financial Statements
| 26. | RELATED PARTY TRANSACTIONS |
NGL Energy
As described in Note 5, we own interests in NGL Energy, which we account for under the equity method.
During the year ended December 31, 2011 we purchased natural gas, condensate and propane from NGL Energy. During the year ended December 31, 2011 we sold natural gas liquids to NGL Energy. During the year ended December 31, 2011, we received payments from NGL Energy for transition services. The amounts were as follows for the year ended December 31, 2011 (in thousands):
| Revenues |
$ | 9,708 | ||
| Purchases |
$ | 11,270 | ||
| Reimbursements from NGL Energy for transition services |
$ | 346 |
White Cliffs
As described in Note 5, we sold a portion of our ownership interests in White Cliffs at the end of September 2010. Upon closing of this sale, we deconsolidated White Cliffs and began accounting for it under the equity method. During the year ended December 31, 2011, we generated approximately $2.2 million of revenue from services we provided to White Cliffs. During the period from October 1, 2010 through December 31, 2010, we generated approximately $0.5 million of revenue from services we provided to White Cliffs.
SemGroup Holdings and SemGroup Energy Partners
During 2008, we deconsolidated SemGroup Energy Partners, and we subsequently accounted for our investment in SemGroup Energy Partners under the cost method. As described in Note 5, our ownership interest in SemGroup Energy Partners was seized by creditors prior to the Emergence Date.
Also in 2008 we deconsolidated SemGroup Holdings. At December 31, 2008, we owed $150.0 million to SemGroup Holdings, which was recorded as a liability subject to compromise. This liability was extinguished in the reorganization process.
We purchased crude oil transportation, terminalling, and storage services from SemGroup Energy Partners of $3.0 million during the eleven months ended November 30, 2009. We also purchased asphalt terminalling and storage services from SemGroup Energy Partners totaling $15.1 million during the eleven months ended November 30, 2009.
We received reimbursements from SemGroup Energy Partners for operating costs associated with services provided by us to SemGroup Energy Partners of $10.5 million during the eleven months ended November 30, 2009. We also received reimbursements from SemGroup Energy Partners for costs associated with general and administrative services provided by us to SemGroup Energy Partners of $1.6 million during the eleven months ended November 30, 2009.
On April 7, 2009, we and SemGroup Energy Partners executed definitive documentation related to the settlement of certain matters between us and SemGroup Energy Partners and entered into a settlement of a shared services agreement, which was retroactively effective as of March 31, 2009 (the “Settlement”). The Settlement provided for the following:
| • | SemGroup Energy Partners transferred certain crude oil assets located in Kansas and northern Oklahoma to us. SemGroup Energy Partners retained certain access and connection rights to enable it to continue to operate its crude oil trucking business in such areas. |
| • | We transferred to SemGroup Energy Partners: i) certain crude oil linefill and tank bottoms, (ii) certain personal property located in Oklahoma, Texas and Kansas used in connection with SemGroup Energy |
F-71
Table of Contents
SEMGROUP CORPORATION
Notes to Consolidated Financial Statements
| 26. | RELATED PARTY TRANSACTIONS, Continued |
| Partners’ crude oil trucking business, and (iii) certain real property located in Oklahoma, Kansas, Texas and New Mexico. In addition, we transferred certain asphalt processing assets that were connected to, adjacent to, or otherwise contiguous with, SemGroup Energy Partners’ existing asphalt facilities and associated real property interests to SemGroup Energy Partners. |
| • | We rejected certain service agreements and entered into new service agreements, pursuant to which SemGroup Energy Partners would provide certain crude oil and asphalt gathering, transportation, terminalling and storage services to us. |
| • | We rejected an existing agreement and entered into a new services agreement, pursuant to which we provide certain operational services for SemGroup Energy Partners. |
| • | The parties entered into a transition services agreement, pursuant to which we provide certain corporate, crude oil and asphalt transition services to SemGroup Energy Partners. |
| • | Certain pre-petition claims between us and SemGroup Energy Partners were netted and waived. |
As a result of this Settlement, we transferred to SemGroup Energy Partners asphalt-related assets with a net book value of $84.0 million and crude-related assets of $14.9 million. Also as part of this Settlement, SemGroup Energy Partners transferred to us crude-related assets of $4.3 million. SemGroup Energy Partners made an unsecured claim of $55 million associated with the rejection of these contracts.
SemCAMS and SemCanada Crude
As described in Note 5, SemCAMS and SemCanada Crude were not consolidated while we were in bankruptcy. We sold product to SemCAMS and SemCanada Crude totaling $155.5 million during the eleven months ended November 30, 2009. We purchased $136.6 million of product from SemCAMS and SemCanada Crude during the eleven months ended November 30, 2009.
Vulcan
In 2009, we assigned our 50% interest in Vulcan-Koch Asphalt Marketing, LLC (“Vulcan”) for proceeds of $3.9 million. The buyer of Vulcan was an entity controlled by an individual who had the right to nominate members of SemGroup, L.P.’s Management Committee.
F-72
Table of Contents
Index to Exhibits
The following documents are included as exhibits to this Form 10-K. Those exhibits below incorporated by reference herein are indicated as such by the information supplied in the parenthetical thereafter. If no parenthetical appears after an exhibit, such exhibit is filed herewith.
| Exhibit |
Description | |
| 2.1 | Fourth Amended Joint Plan of Affiliated Debtors filed with the United States Bankruptcy Court for the District of Delaware on October 27, 2009 (filed as Exhibit 2.1 to our registration statement on Form 10, File No. 001-34736 (the “Form 10”)). | |
| 2.2 | Contribution Agreement dated August 31, 2011, among SemStream, L.P., a wholly-owned subsidiary of SemGroup Corporation, NGL Supply Terminal Company LLC, NGL Energy Partners LP and NGL Energy Holdings LLC (filed as Exhibit 2.1 to our current report on Form 8-K dated November 1, 2011, filed November 4, 2011). | |
| 2.3 | Second Amended and Restated Limited Liability Company Agreement of NGL Energy Holdings LLC (filed as Exhibit 2.2 to our current report on Form 8-K dated November 1, 2011, filed November 4, 2011). | |
| 2.4 | First Amended and Restated Registration Rights Agreement dated October 3, 2011, among NGL Energy Partners LP, Hicks Oil & Hicksgas, Incorporated, NGL Holdings, Inc., Krim2010, LLC, Infrastructure Capital Management, LLC, Atkinson Investors, LLC, Stanley A. Bugh, Robert R. Foster, Brian K. Pauling, Stanley D. Perry, Stephen D. Tuttle, Craig S. Jones, Daniel Post, Mark McGinty, Sharra Straight, David Eastin, AO Energy, Inc., E. Osterman, Inc., E. Osterman Gas Service, Inc., E. Osterman Propane, Inc., Milford Propane, Inc., Osterman Propane, Inc., Propane Gas, Inc., and Saveway Propane Gas Service, Inc. (filed as Exhibit 2.3 to our current report on Form 8-K dated November 1, 2011, filed November 4, 2011). | |
| 2.5 | Amendment No. 1 and Joinder to First Amended and Restated Registration Rights Agreement dated November 1, 2011, between NGL Energy Holdings LLC and SemStream, L.P. (filed as Exhibit 2.4 to our current report on Form 8-K dated November 1, 2011, filed November 4, 2011). | |
| 3.1 | Amended and Restated Certificate of Incorporation, dated as of November 30, 2009, of SemGroup Corporation (filed as Exhibit 3.1 to the Form 10). | |
| 3.2 | Amended and Restated Bylaws, dated as of October 28, 2011, of SemGroup Corporation (filed as Exhibit 3.1 to our current report on Form 8-K dated October 28, 2011, filed October 28, 2011). | |
| 4.1 | Form of stock certificate for our Class A Common Stock, par value $0.01 per share (filed as Exhibit 4.1 to the Form 10). | |
| 4.2 | Form of stock certificate for our Class B Common Stock, par value $0.01 per share (filed as Exhibit 4.2 to the Form 10). | |
| 4.3 | Warrant Agreement dated as of November 30, 2009, by and between SemGroup Corporation and Mellon Investor Services, LLC (filed as Exhibit 4.3 to the Form 10). | |
| 4.4 | Form of warrant certificate (filed as Exhibit 4.4 to the Form 10). | |
| 4.5 | Rights Agreement, dated as of October 28, 2011, between SemGroup Corporation and Mellon Investor Services LLC (filed as Exhibit 4.1 to our current report on Form 8-K dated October 28, 2011, filed October 28, 2011). | |
| 10.1 | Credit Agreement (the “Credit Facility”) dated as of June 17, 2011, among SemGroup Corporation, as borrower, the lenders parties thereto from time to time, and The Royal Bank of Scotland PLC, as Administrative Agent and Collateral Agent (filed as Exhibit 10 to our current report on Form 8-K dated June 17, 2011, filed June 21, 2011). | |
Table of Contents
| Exhibit |
Description | |
| 10.2 | Second Amendment to the Credit Facility, dated as of September 19, 2011 (filed as Exhibit 10 to our current report on Form 8-K, dated September 19, 2011, filed September 23, 2011). | |
| 10.3* | SemGroup Corporation Board of Directors Compensation Plan (filed as Exhibit 10.6 to the Form 10). | |
| 10.4* | SemGroup Corporation Nonexecutive Directors’ Compensation Deferral Program (filed as Exhibit 10.7 to the Form 10). | |
| 10.5* | SemGroup Corporation Equity Incentive Plan (filed as Exhibit 10.8 to the Form 10). | |
| 10.6* | SemGroup Corporation Equity Incentive Plan Form of Restricted Stock Award Agreement for Directors (filed as Exhibit 10.9 to the Form 10). | |
| 10.7* | Amendment No. 1 to SemGroup Corporation Equity Incentive Plan Form of Restricted Stock Award Agreement for Directors (filed as Exhibit 10.15 to the Form 10). | |
| 10.8* | SemGroup Corporation Equity Incentive Plan Form of Restricted Stock Award Agreement for executive officers and employees in the United States (filed as Exhibit 10.10 to the Form 10). | |
| 10.9* | Amendment No. 1 to SemGroup Corporation Equity Incentive Plan Form of Restricted Stock Award Agreement for executive officers and employees in the United States (filed as Exhibit 10.16 to the Form 10). | |
| 10.10* | Amendment No. 2 to SemGroup Corporation Equity Incentive Plan Form of Restricted Stock Award Agreement for executive officers and employees in the United States. | |
| 10.11* | Employment Agreement dated as of November 30, 2009, by and among SemManagement, L.L.C., SemGroup Corporation and Norman J. Szydlowski (filed as Exhibit 10.11 to the Form 10). | |
| 10.12* | Letter Amendment dated March 18, 2010, by and among SemManagement, L.L.C., SemGroup Corporation and Norman J. Szydlowski, amending the Employment Agreement dated as of November 30, 2009 (filed as Exhibit 10.12 to the Form 10). | |
| 10.13* | Form of Severance Agreement between SemGroup Corporation and each of its executive officers other than Norman J. Szydlowski and David B. Gorte (filed as Exhibit 10.13 to the Form 10). | |
| 10.14* | Form of Amendment to Severance Agreement between SemGroup Corporation and certain of its executive officers. | |
| 10.15* | SemGroup Corporation Equity Incentive Plan Form of Retention Award Agreement for certain executive officers (filed as Exhibit 10.14 to the Form 10). | |
| 10.16* | SemGroup Corporation Equity Incentive Plan Form of Restricted Stock Award Agreement for Directors for awards granted on or after August 31, 2010 (filed as Exhibit 10.17 to the Form 10). | |
| 10.17* | SemGroup Corporation Equity Incentive Plan Form of Restricted Stock Award Agreement for executive officers and employees in the United States for awards granted on or after August 31, 2010 (filed as Exhibit 10.18 to the Form 10). | |
| 10.18* | Form of 2011 Performance Share Unit Award Agreement under the SemGroup Corporation Equity Incentive Plan for executive officers (filed as Exhibit 10.1 to our current report on Form 8-K dated January 24, 2011, filed January 24, 2011). | |
| 10.19* | Form of Restricted Stock Award Agreement under the SemGroup Corporation Equity Incentive Plan for executive officers and employees in the United States during 2011 (filed as Exhibit 10.2 to our current report on Form 8-K dated January 24, 2011, filed January 24, 2011). | |
Table of Contents
| Exhibit |
Description | |
| 10.20* | Form of 2012 Performance Share Unit Award Agreement under the SemGroup Corporation Equity Incentive Plan for executive officers. | |
| 10.21* | Form of Restricted Stock Award Agreement under the SemGroup Corporation Equity Incentive Plan for executive officers and employees in the United States for awards granted on or after January 1, 2012. | |
| 10.22* | SemGroup Corporation Short-Term Incentive Program (filed as Exhibit 10.1 to our current report on Form 8-K dated February 24, 2011, filed March 2, 2011). | |
| 10.23* | Consulting Services Agreement, effective as of February 2, 2012, by and between SemGroup Corporation and David B. Gorte. | |
| 10.24 | Credit Agreement dated November 10, 2011, among Rose Rock Midstream, L.P., as borrower, The Royal Bank of Scotland PLC, as administrative agent and collateral agent, the other agents party thereto and the lenders and issuing banks party thereto (filed as Exhibit 10.1 to Rose Rock Midstream, L.P.’s registration statement on Form S-1, File No. 333-176260). | |
| 10.25 | Second Amended and Restated Agreement of Limited Partnership of Rose Rock Midstream, L.P. (filed as Exhibit 3.1 to Rose Rock Midstream, L.P.’s current report on Form 8-K dated December 14, 2011, filed December 20, 2011). | |
| 10.26 | First Amended and Restated Limited Liability Company Agreement of Rose Rock Midstream GP, LLC (filed as Exhibit 3.2 to Rose Rock Midstream, L.P.’s current report on Form 8-K dated December 14, 2011, filed December 20, 2011). | |
| 10.27* | Rose Rock Midstream Equity Incentive Plan (filed as Exhibit 10.1 to Rose Rock Midstream, L.P.’s current report on Form 8-K dated December 8, 2011, filed December 14, 2011). | |
| 10.28* | Form of Restricted Unit Award Agreement (Employees) under the Rose Rock Midstream Equity Incentive Plan (filed as Exhibit 10.3.1 to Rose Rock Midstream, L.P.’s annual report on Form 10-K for the fiscal year ended December 31, 2011, filed February 29, 2012). | |
| 21 | Subsidiaries of SemGroup Corporation. | |
| 23.1 | Consent of Independent Registered Public Accounting Firm. | |
| 31.1 | Rule 13a – 14(a)/15d – 14(a) Certification of Norman J. Szydlowski, Chief Executive Officer. | |
| 31.2 | Rule 13a – 14(a)/15d – 14(a) Certification of Robert N. Fitzgerald, Chief Financial Officer. | |
| 32.1 | Section 1350 Certification of Norman J. Szydlowski, Chief Executive Officer. | |
| 32.2 | Section 1350 Certification of Robert N. Fitzgerald, Chief Financial Officer. | |
| 99.1 | White Cliffs Pipeline, L.L.C. financial statements presented pursuant to Rule 3-09 of Regulation S-X. | |
| 101** | Interactive data files pursuant to Rule 405 of Regulation S-T: (i) the Consolidated Balance Sheets at December 31, 2011 and 2010, (ii) the Consolidated Statements of Operations and Comprehensive Income (Loss) for the years ended December 31, 2011 and 2010, the month ended December 31, 2009 (Successor) and the eleven months ended November 30, 2009 (Predecessor), (iii) the Consolidated Statements of Changes in Owners’ Equity (Deficit) for the years ended December 31, 2011 and 2010, the month ended December 21, 2009 (Successor) and the eleven months ended November 30, 2009 (Predecessor), (iv) the Consolidated Statements of Cash Flows for the years ended December 31, 2011 and 2010, the month ended December 31, 2009 (Successor) and the eleven months ended November 30, 2009 (Predecessor), and (v) the Notes to Consolidated Financial Statements. | |
| * | Management contract or compensatory plan or arrangement |
| ** | To be filed by Amendment |