Attached files
| file | filename |
|---|---|
| 8-K - FORM 8-K - FIRST NIAGARA FINANCIAL GROUP INC | d308265d8k.htm |
Exhibit 99.1

| The Differentiated Choice -- Position and Performance John R. Koelmel Chief Executive OfficerGregory W. NorwoodChief Financial Officer KBW Boston Bank ConferenceFebruary 29, 2012 |
| This presentation contains forward-looking information for First Niagara Financial Group, Inc. Such information constitutes forward-looking statements (within the meaning of the Private Securities Litigation Reform Act of 1995) which involve significant risks and uncertainties. Actual results may differ materially from the results discussed in these forward-looking statements. Safe Harbor Statement 2 |
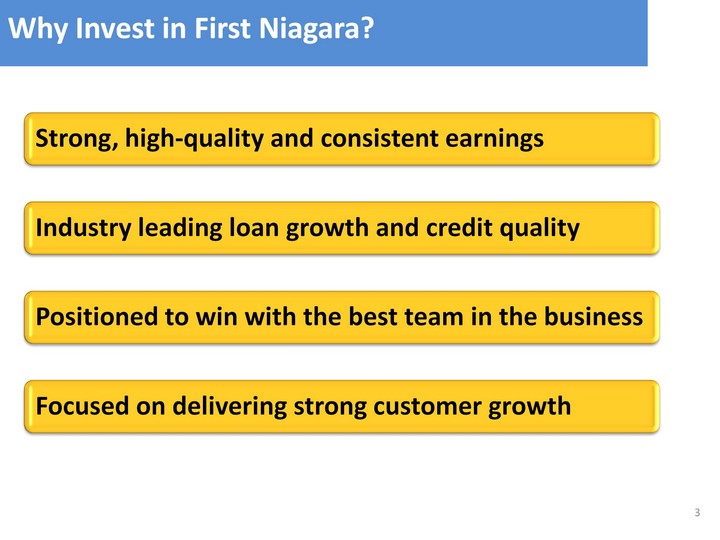
| Why Invest in First Niagara? Why Invest in First Niagara? 3 |
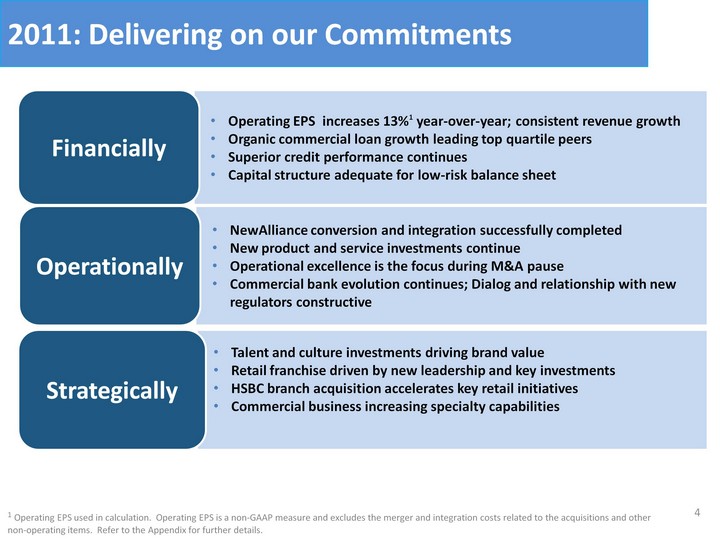
| Operating EPS increases 13%1 year-over-year; consistent revenue growthOrganic commercial loan growth leading top quartile peersSuperior credit performance continuesCapital structure adequate for low-risk balance sheet Financially NewAlliance conversion and integration successfully completedNew product and service investments continueOperational excellence is the focus during M&A pauseCommercial bank evolution continues; Dialog and relationship with new regulators constructive Operationally Talent and culture investments driving brand valueRetail franchise driven by new leadership and key investmentsHSBC branch acquisition accelerates key retail initiativesCommercial business increasing specialty capabilities Strategically 2011: Delivering on our Commitments 1 Operating EPS used in calculation. Operating EPS is a non-GAAP measure and excludes the merger and integration costs related to the acquisitions and other non-operating items. Refer to the Appendix for further details. 4 |
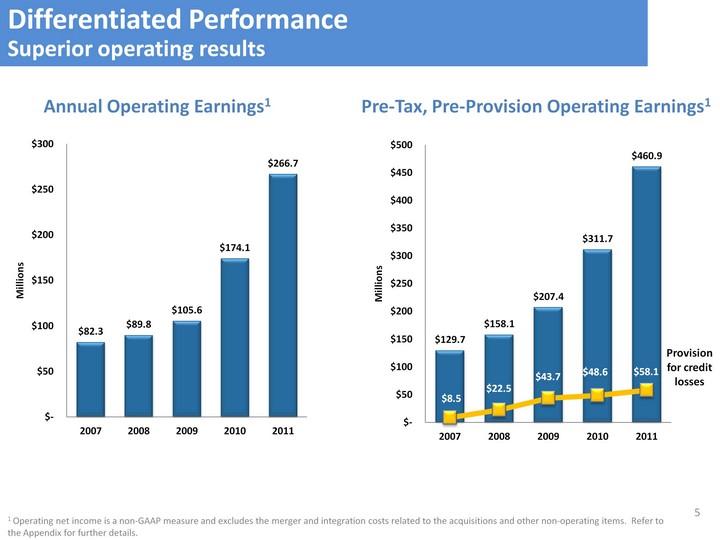
| Annual Operating Earnings1 Annual Operating Earnings1 Pre-Tax, Pre-Provision Operating Earnings1 1 Operating net income is a non-GAAP measure and excludes the merger and integration costs related to the acquisitions and other non-operating items. Refer to the Appendix for further details. the Appendix for further details. the Appendix for further details. Provision for credit losses Differentiated Performance Superior operating results 5 |
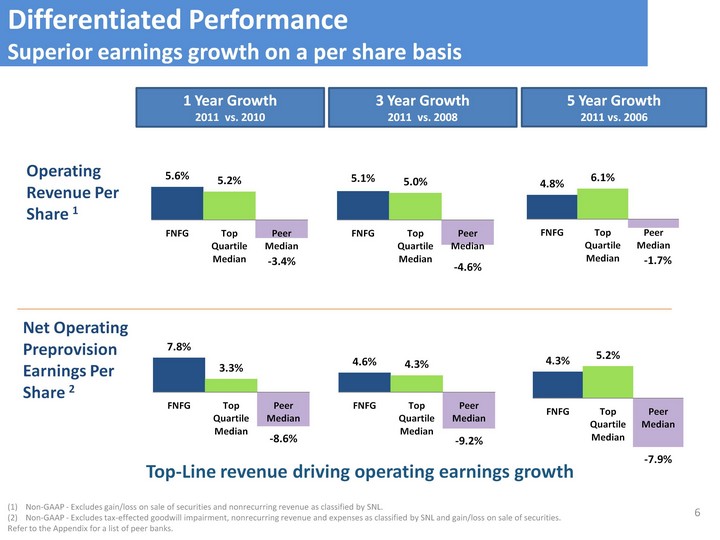
| Operating Revenue Per Share 1 Net Operating Preprovision Earnings Per Share 2 1 Year Growth2011 vs. 2010 5 Year Growth2011 vs. 2006 Non-GAAP - Excludes gain/loss on sale of securities and nonrecurring revenue as classified by SNL.Non-GAAP - Excludes tax-effected goodwill impairment, nonrecurring revenue and expenses as classified by SNL and gain/loss on sale of securities.Refer to the Appendix for a list of peer banks. Differentiated Performance Superior earnings growth on a per share basis 3 Year Growth2011 vs. 2008 (CHART) (CHART) (CHART) (CHART) (CHART) (CHART) 6 Top-Line revenue driving operating earnings growth |

| 7 |
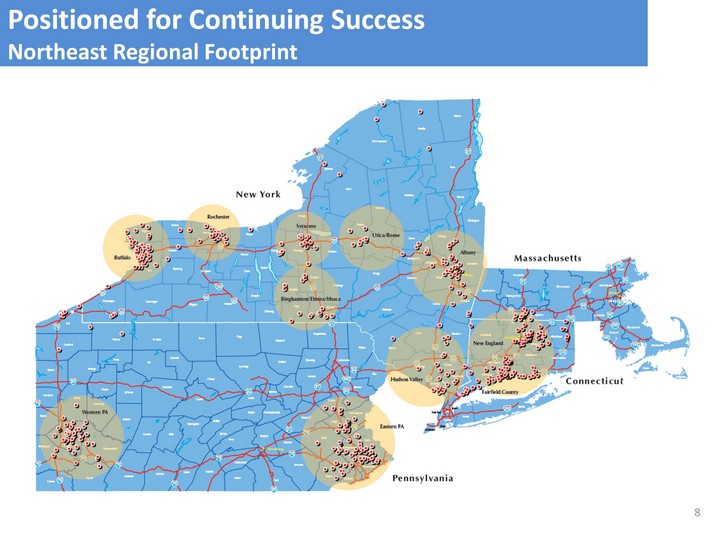
| Positioned for Continuing Success Northeast Regional Footprint 8 |
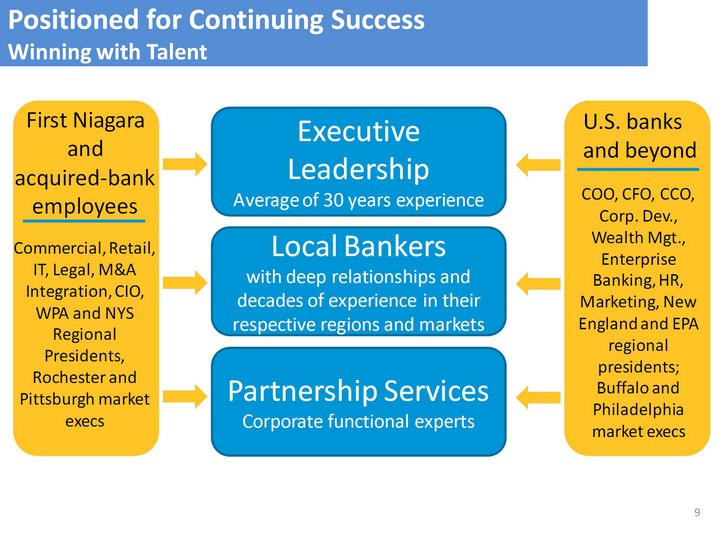
| Positioned for Continuing Success Winning with Talent U.S. banks and beyond 9 |

| 10 |

| 11 |
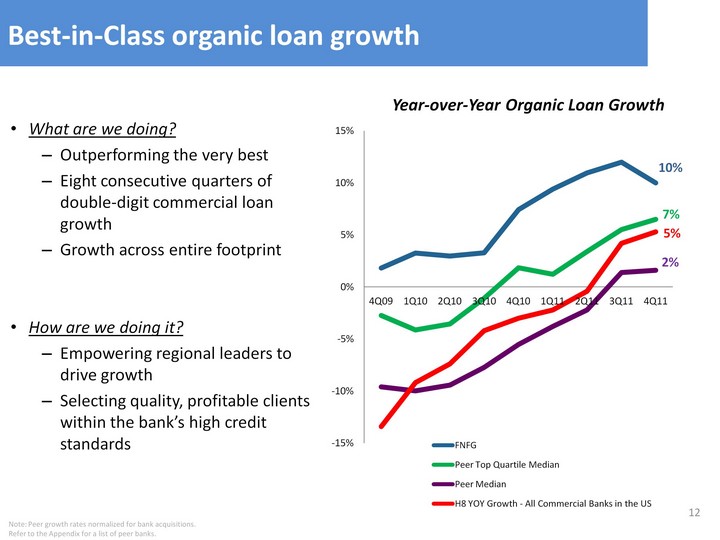
| What are we doing?Outperforming the very bestEight consecutive quarters of double-digit commercial loan growthGrowth across entire footprintHow are we doing it?Empowering regional leaders to drive growthSelecting quality, profitable clients within the bank's high credit standards Year-over-Year Organic Loan Growth Note: Peer growth rates normalized for bank acquisitions.Refer to the Appendix for a list of peer banks. Best-in-Class organic loan growth (CHART) 12 |
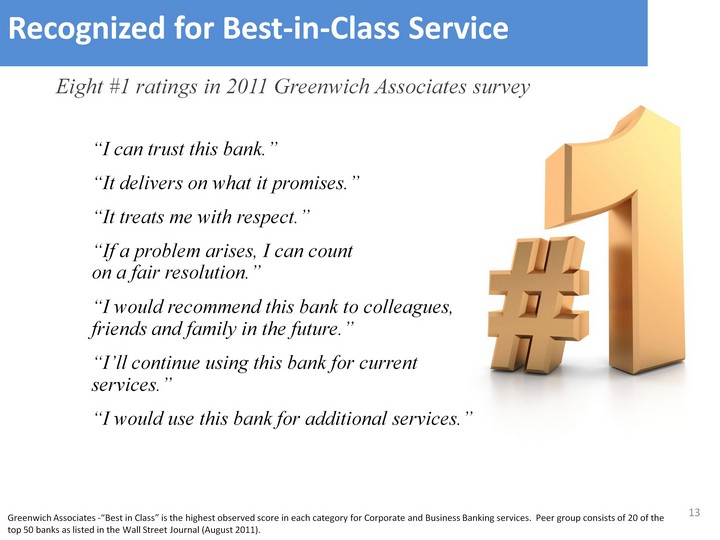
| Recognized for Best-in-Class Service Eight #1 ratings in 2011 Greenwich Associates survey "I can trust this bank.""It delivers on what it promises.""It treats me with respect.""If a problem arises, I can count on a fair resolution.""I would recommend this bank to colleagues, friends and family in the future.""I'll continue using this bank for current services.""I would use this bank for additional services." Greenwich Associates -"Best in Class" is the highest observed score in each category for Corporate and Business Banking services. Peer group consists of 20 of the top 50 banks as listed in the Wall Street Journal (August 2011). 13 |
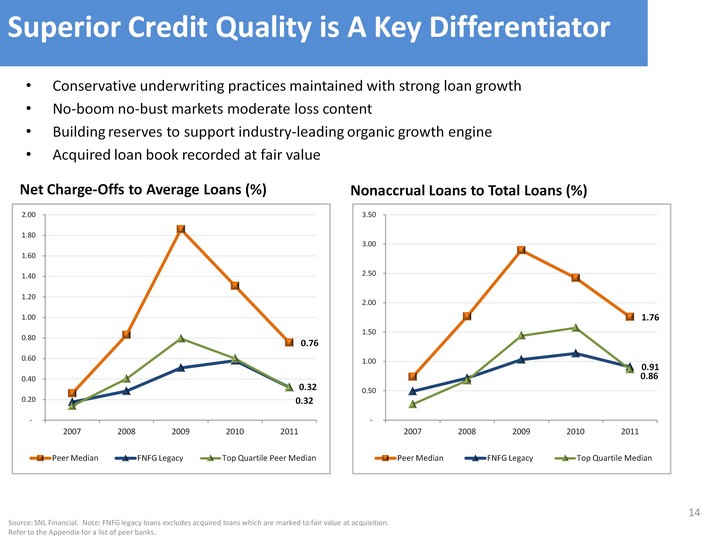
| Conservative underwriting practices maintained with strong loan growthNo-boom no-bust markets moderate loss content Building reserves to support industry-leading organic growth engineAcquired loan book recorded at fair value Net Charge-Offs to Average Loans (%) Nonaccrual Loans to Total Loans (%) Source: SNL Financial. Note: FNFG legacy loans excludes acquired loans which are marked to fair value at acquisition.Refer to the Appendix for a list of peer banks. Superior Credit Quality is A Key Differentiator (CHART) (CHART) 14 |
| Capitalize on commercial business scaleDrive organic growth with proven, local talentInfrastructure investments continueFootprint provides ample opportunity for growthPursue growth through specialized banking capabilitiesInvest further in Healthcare capabilitiesLeverage ABL opportunity further over broader markets/industriesEnhance leasing capability even moreContinue Capital Markets build-outCapacity to lead even more syndicated transactionsFacilitates acceleration of balance sheet rotation into loansLeverage derivative products to further increase fee income Commercial Services Opportunity 15 |

| 16 |
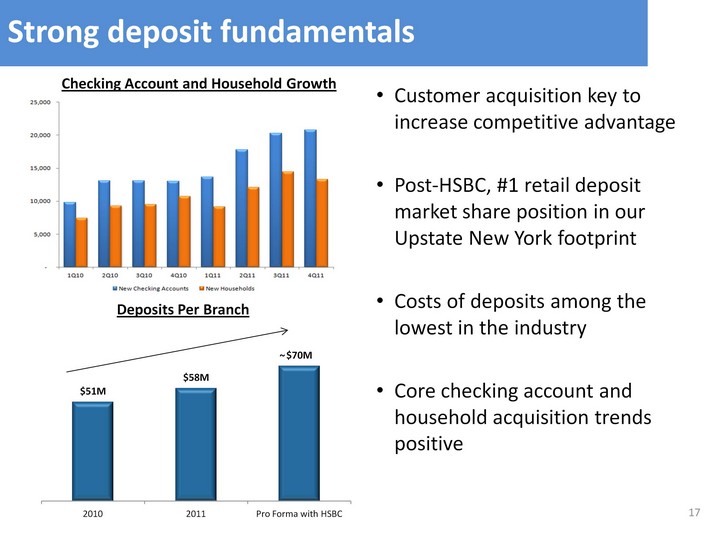
| Strong deposit fundamentals Deposits Per Branch (CHART) Customer acquisition key to increase competitive advantagePost-HSBC, #1 retail deposit market share position in our Upstate New York footprintCosts of deposits among the lowest in the industryCore checking account and household acquisition trends positive ~ 17 Checking Account and Household Growth |
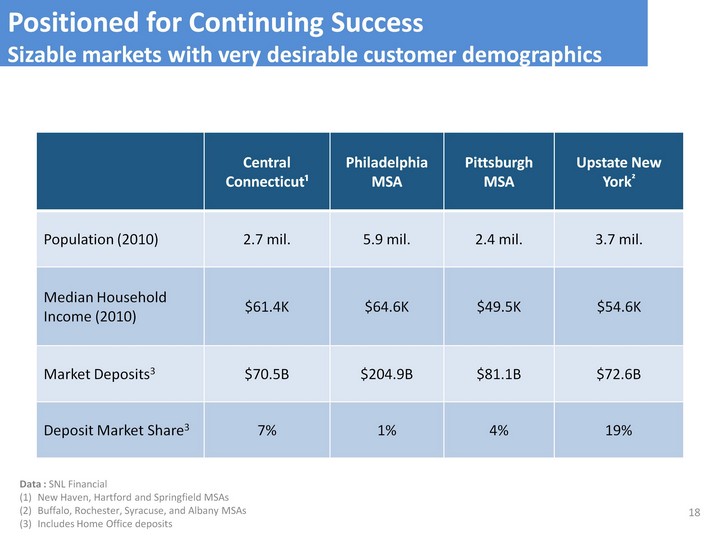
| Access to Growth Markets Well Positioned to Take Market Share Well Positioned to Take Market Share Well Positioned to Take Market Share Well Positioned to Take Market Share Well Positioned to Take Market Share Well Positioned to Take Market Share Well Positioned to Take Market Share Well Positioned to Take Market Share Well Positioned to Take Market Share Well Positioned to Take Market Share Well Positioned to Take Market Share Data : SNL FinancialNew Haven, Hartford and Springfield MSAsBuffalo, Rochester, Syracuse, and Albany MSAsIncludes Home Office deposits Positioned for Continuing Success Sizable markets with very desirable customer demographics 18 |
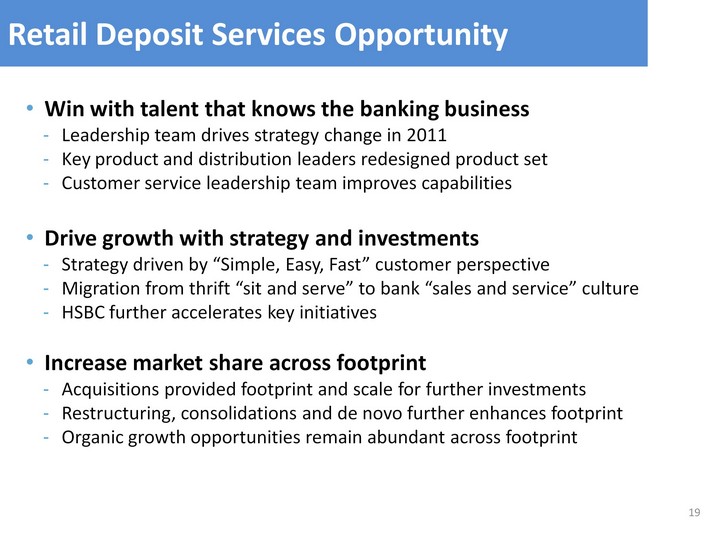
| Win with talent that knows the banking businessLeadership team drives strategy change in 2011Key product and distribution leaders redesigned product setCustomer service leadership team improves capabilitiesDrive growth with strategy and investmentsStrategy driven by "Simple, Easy, Fast" customer perspectiveMigration from thrift "sit and serve" to bank "sales and service" cultureHSBC further accelerates key initiativesIncrease market share across footprintAcquisitions provided footprint and scale for further investmentsRestructuring, consolidations and de novo further enhances footprintOrganic growth opportunities remain abundant across footprint Retail Deposit Services Opportunity 19 |

| 20 |
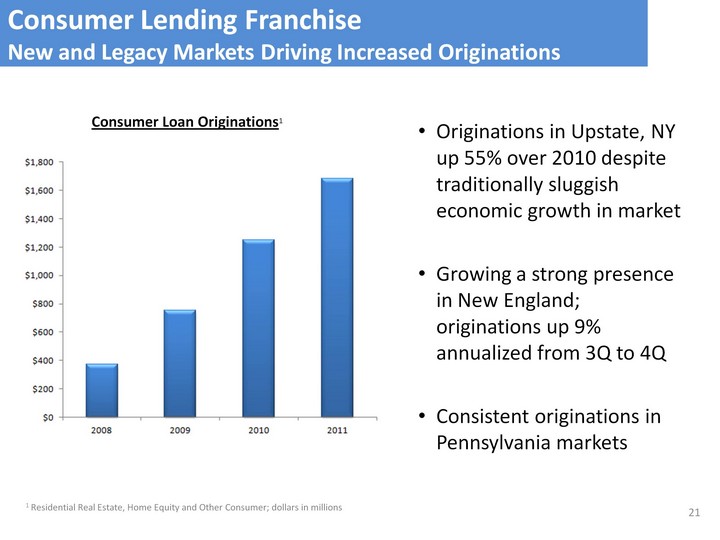
| Consumer Loan Originations1 1 Residential Real Estate, Home Equity and Other Consumer; dollars in millions Consumer Lending Franchise New and Legacy Markets Driving Increased Originations Originations in Upstate, NY up 55% over 2010 despite traditionally sluggish economic growth in marketGrowing a strong presence in New England; originations up 9% annualized from 3Q to 4QConsistent originations in Pennsylvania markets 21 |
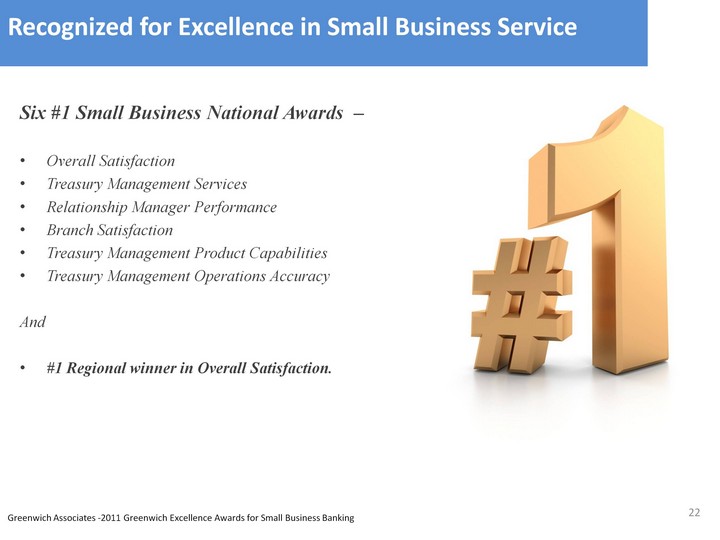
| Recognized for Excellence in Small Business Service Six #1 Small Business National Awards - Overall Satisfaction Treasury Management ServicesRelationship Manager PerformanceBranch SatisfactionTreasury Management Product CapabilitiesTreasury Management Operations AccuracyAnd#1 Regional winner in Overall Satisfaction. 22 Greenwich Associates -2011 Greenwich Excellence Awards for Small Business Banking |
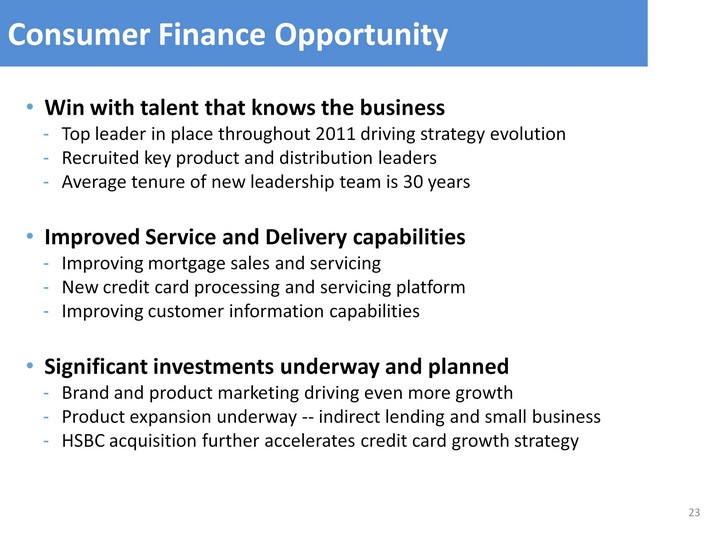
| Win with talent that knows the businessTop leader in place throughout 2011 driving strategy evolutionRecruited key product and distribution leadersAverage tenure of new leadership team is 30 yearsImproved Service and Delivery capabilitiesImproving mortgage sales and servicingNew credit card processing and servicing platformImproving customer information capabilitiesSignificant investments underway and plannedBrand and product marketing driving even more growthProduct expansion underway -- indirect lending and small businessHSBC acquisition further accelerates credit card growth strategy Consumer Finance Opportunity 23 |
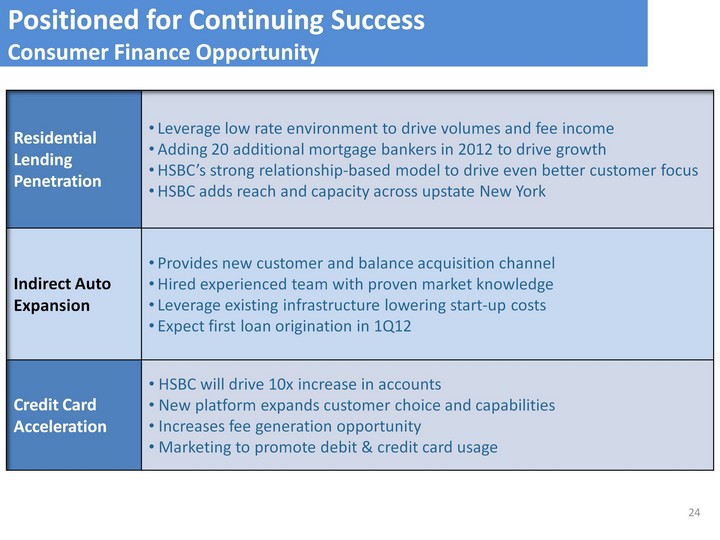
| Positioned for Continuing Success Consumer Finance Opportunity Residential Lending Penetration Leverage low rate environment to drive volumes and fee income Adding 20 additional mortgage bankers in 2012 to drive growth HSBC's strong relationship-based model to drive even better customer focus HSBC adds reach and capacity across upstate New York Indirect Auto Expansion Provides new customer and balance acquisition channel Hired experienced team with proven market knowledge Leverage existing infrastructure lowering start-up costs Expect first loan origination in 1Q12 Credit Card Acceleration HSBC will drive 10x increase in accounts New platform expands customer choice and capabilities Increases fee generation opportunity Marketing to promote debit & credit card usage 24 |

| 25 |
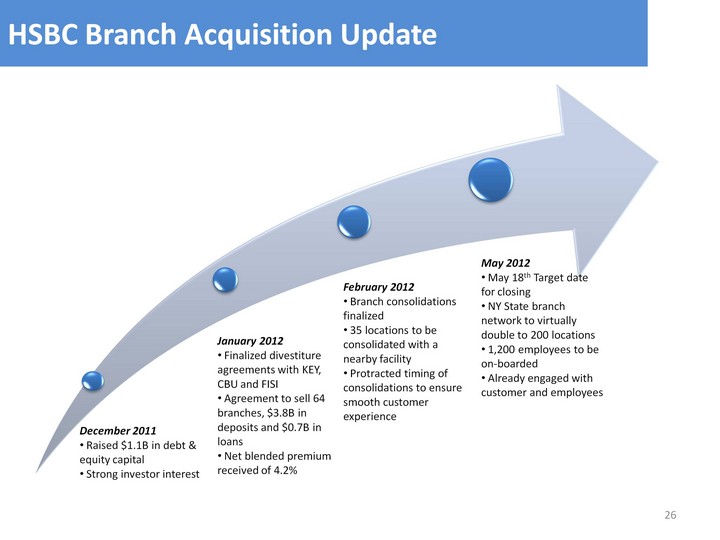
| 26 HSBC Branch Acquisition Update HSBC Branch Acquisition Update December 2011 Raised $1.1B in debt & equity capital Strong investor interest January 2012 Finalized divestiture agreements with KEY, CBU and FISI Agreement to sell 64 branches, $3.8B in deposits and $0.7B in loans Net blended premium received of 4.2% February 2012 Branch consolidations finalized 35 locations to be consolidated with a nearby facility Protracted timing of consolidations to ensure smooth customer experience May 2012 May 18th Target date for closing NY State branch network to virtually double to 200 locations 1,200 employees to be on-boarded Already engaged with customer and employees |
| Focus for the next 18-24 months on running the business we have builtObjectives:Optimize performance and resultsValidate ability to integrate and operateAccelerate capital re-loadEnsure well-positioned for longer-term success M & A Pause 27 |

| 28 |
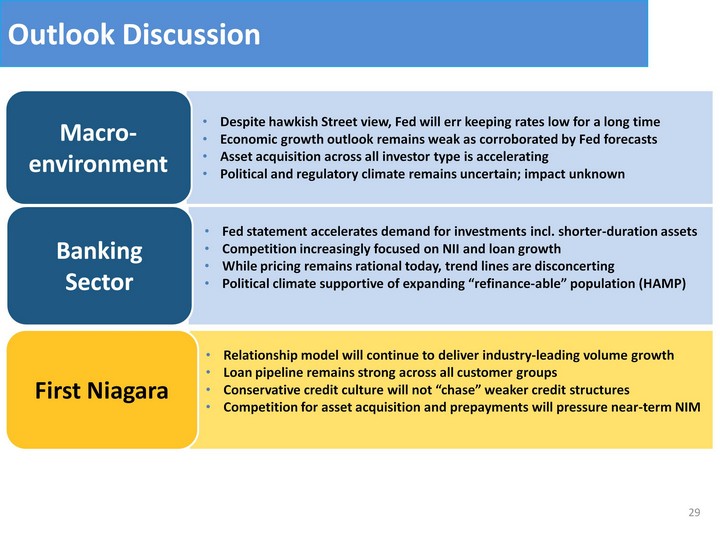
| Despite hawkish Street view, Fed will err keeping rates low for a long timeEconomic growth outlook remains weak as corroborated by Fed forecastsAsset acquisition across all investor type is acceleratingPolitical and regulatory climate remains uncertain; impact unknown Macro- environment Fed statement accelerates demand for investments incl. shorter-duration assetsCompetition increasingly focused on NII and loan growthWhile pricing remains rational today, trend lines are disconcertingPolitical climate supportive of expanding "refinance-able" population (HAMP) Banking Sector Relationship model will continue to deliver industry-leading volume growthLoan pipeline remains strong across all customer groupsConservative credit culture will not "chase" weaker credit structuresCompetition for asset acquisition and prepayments will pressure near-term NIM First Niagara Outlook Discussion 29 |
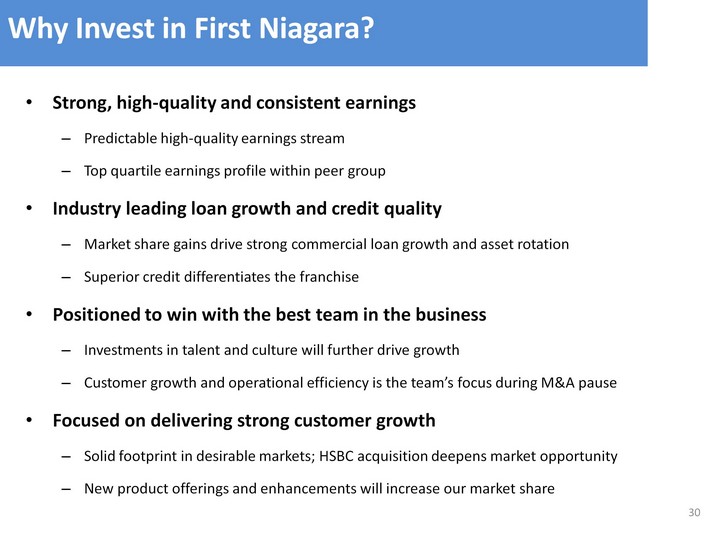
| Why Invest in First Niagara? 30 Strong, high-quality and consistent earningsPredictable high-quality earnings streamTop quartile earnings profile within peer groupIndustry leading loan growth and credit qualityMarket share gains drive strong commercial loan growth and asset rotationSuperior credit differentiates the franchisePositioned to win with the best team in the businessInvestments in talent and culture will further drive growthCustomer growth and operational efficiency is the team's focus during M&A pauseFocused on delivering strong customer growthSolid footprint in desirable markets; HSBC acquisition deepens market opportunityNew product offerings and enhancements will increase our market share |
| The Differentiated Choice -- Position and Performance John R. Koelmel Chief Executive OfficerGregory W. NorwoodChief Financial Officer KBW Boston Bank ConferenceFebruary 29, 2012 |

| 32 |
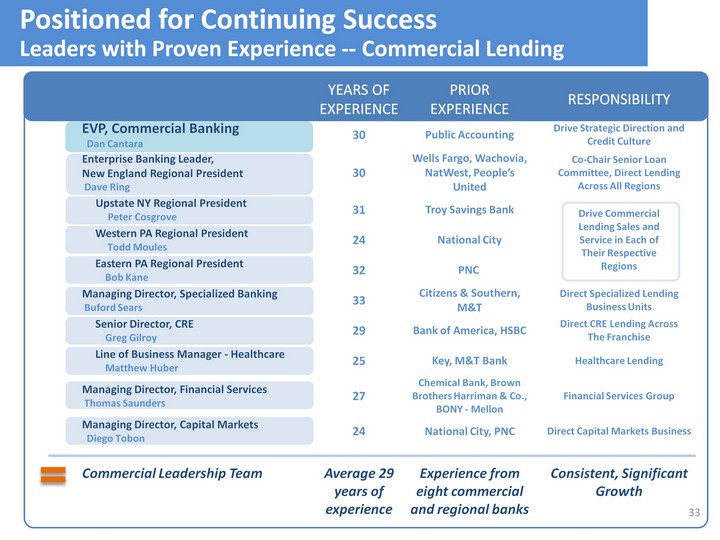
| 33 Positioned for Continuing Success Leaders with Proven Experience -- Commercial Lending Years of Experience Prior Experience Responsibility EVP, Commercial Banking Dan Cantara 30 Public Accounting Drive Strategic Direction and Credit Culture Enterprise Banking Leader, New England Regional President Dave Ring 30 Wells Fargo, Wachovia, NatWest, People's United Co-Chair Senior Loan Committee, Direct Lending Across All Regions Upstate NY Regional President Peter Cosgrove 31 Troy Savings Bank Drive Commercial Lending Sales and Service in Each of Their Respective Regions Western PA Regional President Todd Moules 24 National City Drive Commercial Lending Sales and Service in Each of Their Respective Regions Eastern PA Regional President Bob Kane 32 PNC Drive Commercial Lending Sales and Service in Each of Their Respective Regions Managing Director, Specialized Banking Buford Sears 33 Citizens & Southern, M&T Direct Specialized Lending Business Units Senior Director, CRE Greg Gilroy 29 Bank of America, HSBC Direct CRE Lending Across The Franchise Line of Business Manager - Healthcare Matthew Huber 25 Key, M&T Bank Healthcare Lending Managing Director, Financial Services Thomas Saunders 27 Chemical Bank, Brown Brothers Harriman & Co., BONY - Mellon Financial Services Group Managing Director, Capital Markets Diego Tobon 24 National City, PNC Direct Capital Markets Business Commercial Leadership Team Average 29 years of experience Experience from eight commercial and regional banks Consistent, Significant Growth |
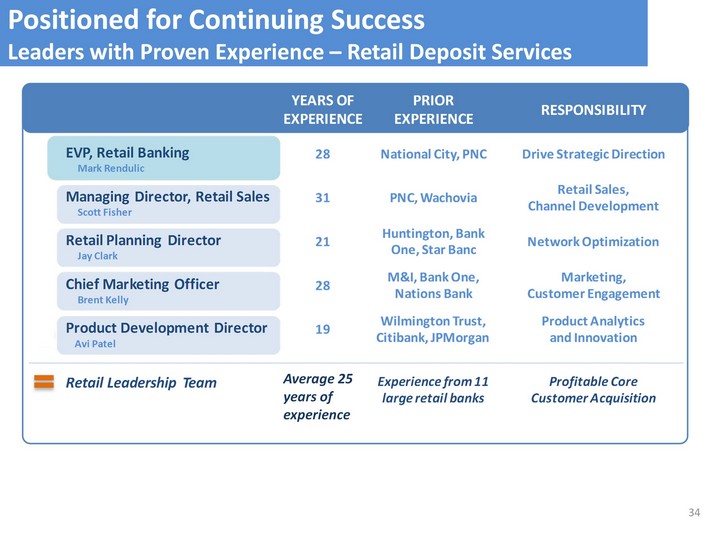
| Positioned for Continuing Success Leaders with Proven Experience - Retail Deposit Services 34 Average 25 years of experience |
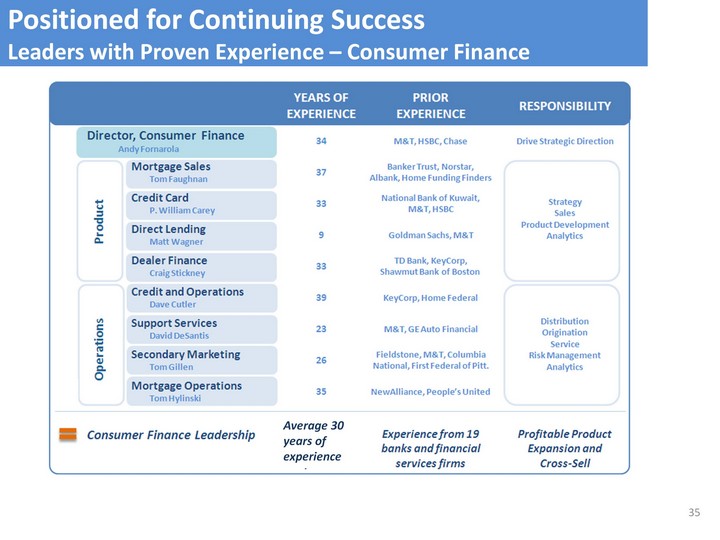
| Positioned for Continuing Success Leaders with Proven Experience - Consumer Finance 35 Average 30 years of experience |
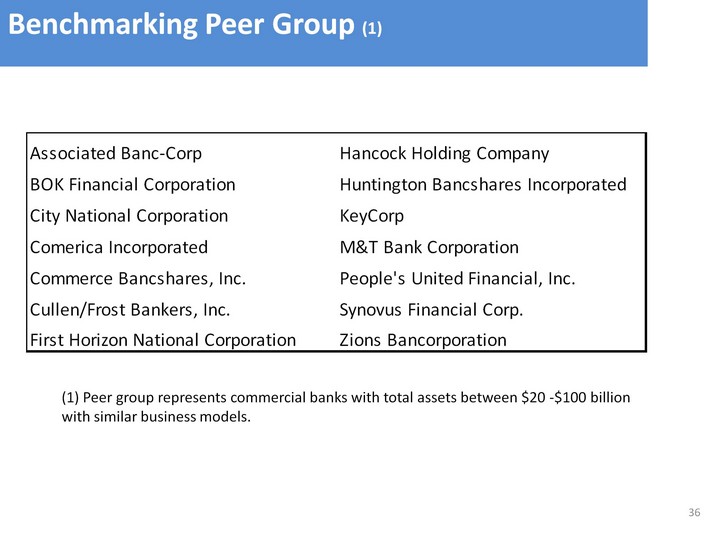
| 36 Benchmarking Peer Group (1) (1) Peer group represents commercial banks with total assets between $20 -$100 billion with similar business models. |
| Non-GAAP Measures - This presentation contains financial information determined by methods other than in accordance with accounting principles generally accepted in the United States of America (GAAP). The Company believes that these non-GAAP financial measures provide a meaningful comparison of the underlying operational performance of the Company, and facilitate investors' assessments of business and performance trends in comparison to others in the financial services industry. In addition, the Company believes the exclusion of these non-operating items enables management to perform a more effective evaluation and comparison of the Company's results and to assess performance in relation to the Company's ongoing operations. These disclosures should not be viewed as a substitute for financial measures determined in accordance with GAAP, nor are they necessarily comparable to non-GAAP performance measures that may be presented by other companies. Where non-GAAP disclosures are used in this presentation, the comparable GAAP financial measure, as well as the reconciliation to the comparable GAAP financial member, can be found in this Appendix. 37 GAAP to Non-GAAP Reconciliation |
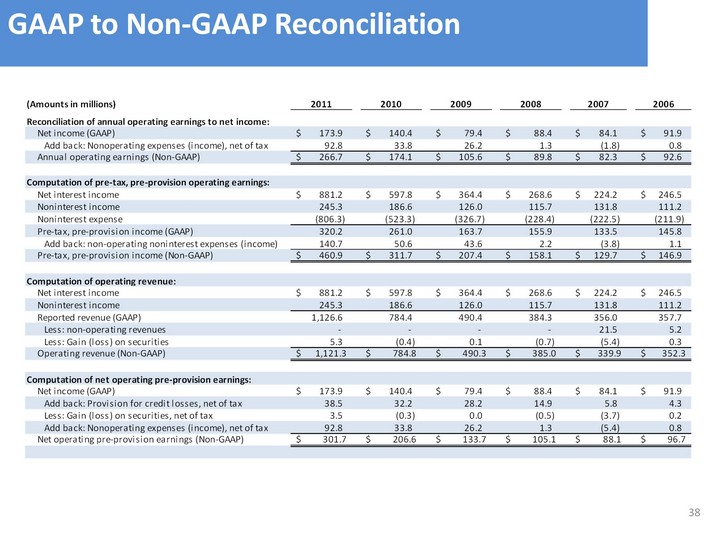
| 38 GAAP to Non-GAAP Reconciliation |