Attached files
| file | filename |
|---|---|
| 8-K - FORM 8-K - CENTERPOINT ENERGY INC | d309519d8k.htm |
| EX-99.1 - PRESS RELEASE ISSUED FEBRUARY 29, 2012 - CENTERPOINT ENERGY INC | d309519dex991.htm |
 The
Benefits of a Balanced Electric & Natural Gas Portfolio NYSE: CNP
www.CenterPointEnergy.com
Full Year 2011 Earnings
Supplemental Materials
February 29, 2012
Exhibit 99.2 |
 February 29, 2012
2
Full Year 2011 Earnings
Cautionary Statement Regarding
Forward-Looking Information
This presentation contains statements concerning our expectations, beliefs, plans,
objectives, goals, strategies, future events or performance and underlying
assumptions and other statements that are not historical facts. These
statements are “forward-looking statements”
within the meaning of the Private Securities Litigation Reform Act of
1995.
Actual
results
may
differ
materially
from
those
expressed
or
implied
by
these
statements.
You
can
generally
identify
our
forward-looking
statements
by
the
words
“anticipate,”
“believe,”
“continue,”
“could,”
“estimate,”
“expect,”
“forecast,”
“goal,”
“intend,”
“may,”
“objective,”
“plan,”
“potential,”
“predict,”
“projection,”
“should,”
“will,”
or
other
similar words.
We have based our forward-looking statements on our management's beliefs and
assumptions based on information currently available to our management at
the time the statements are made. We caution you that assumptions,
beliefs, expectations, intentions, and projections about future events may and often do vary materially
from actual results. Therefore, we cannot assure you that actual results will
not differ materially from those expressed or implied by our
forward-looking statements. Some of the factors that could cause actual
results to differ from those expressed or implied by our forward- looking
statements include the timing and impact of future regulatory, legislative and IRS decisions, financial market
conditions, future market conditions, and other factors described in CenterPoint
Energy, Inc.’s Form 10-K for the period ended December 31, 2011,
under “Risk Factors” and “Management’s Discussion and
Analysis of Financial Condition and Results of Operations -
Certain Factors Affecting Future Earnings”, and in other filings with the SEC
by CenterPoint Energy.
You should not place undue reliance on forward-looking statements. Each
forward-looking statement speaks only as of the date of this
presentation, and we undertake no obligation to publicly update or revise any forward-
looking statements except as required by law. |
 Full Year 2011 Operating
Income Drivers 12 months ended December 31, 2011
Interstate
Pipelines
$(22)
Field Services
$38
Other
$(8)
Competitive
Natural Gas
Sales & Service
$(10)
+
Customer
growth
+
Lower bad
debt expense
+
Rate
increases
¯
Higher benefit
costs
¯
Lower
miscellaneous
revenues
¯
Other,
primarily
higher
expenses
+
New firm
transportation
contracts and
higher
ancillary
services
¯
Restructured
contracts with
natural gas
distribution
affiliates
¯
Lower off-
system
revenues due
to declining
basis
¯
Expiring
Carthage to
Perryville
pipeline
backhaul
contract
Natural Gas
Distribution
$(5)
Electric TDU
$69
+
Higher
throughput in
Haynesville
and
Fayetteville
shales
¯
2010 gain on
sale of non-
strategic
assets
¯
Lower
commodity
prices
¯
Higher O&M,
depreciation,
and other
taxes due to
Magnolia and
Olympia
expansion
+
Increased
usage,
primarily
weather
+
Customer
growth
+
Lower D&A
+
Higher net
TCOS
¯
Rate case
impact
¯
Other,
primarily
higher O&M
+
Higher mark-to-
market in 2011
versus 2010
¯
Lower
optimization
opportunities
around pipeline
and storage
assets
¯
Release of
transportation
capacity
¯
Higher
inventory write-
down in in 2011
versus 2010
$1,109
$1,171
(in millions)
2010
2011
Total Operating Income
$1,249
Total Operating Income
$1,298
Securitization
Bonds
$140
Securitization
Bonds
$127
February 29, 2012
3
Full Year 2011 Earnings |
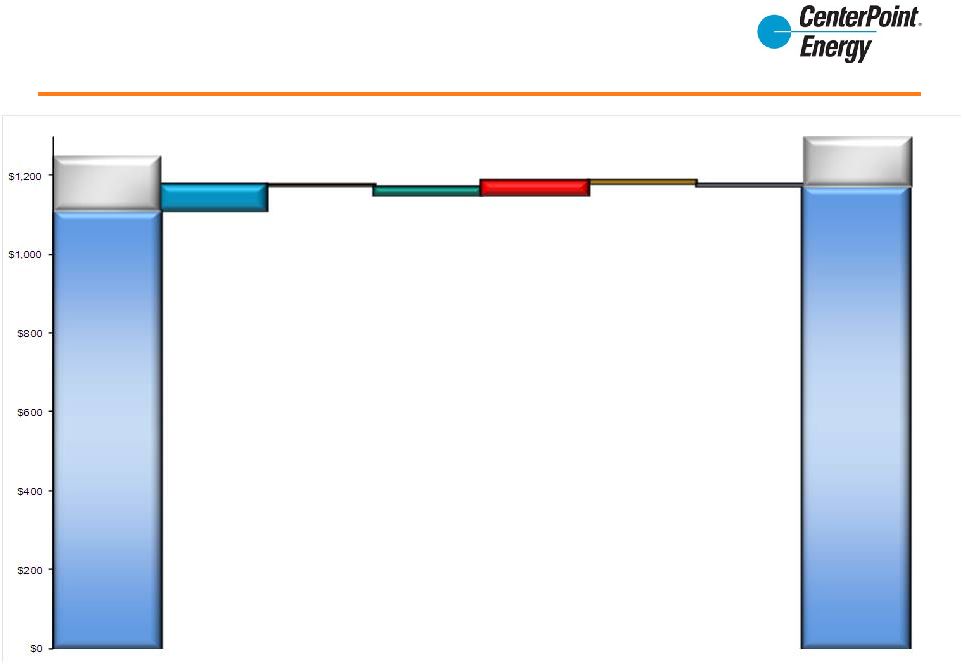
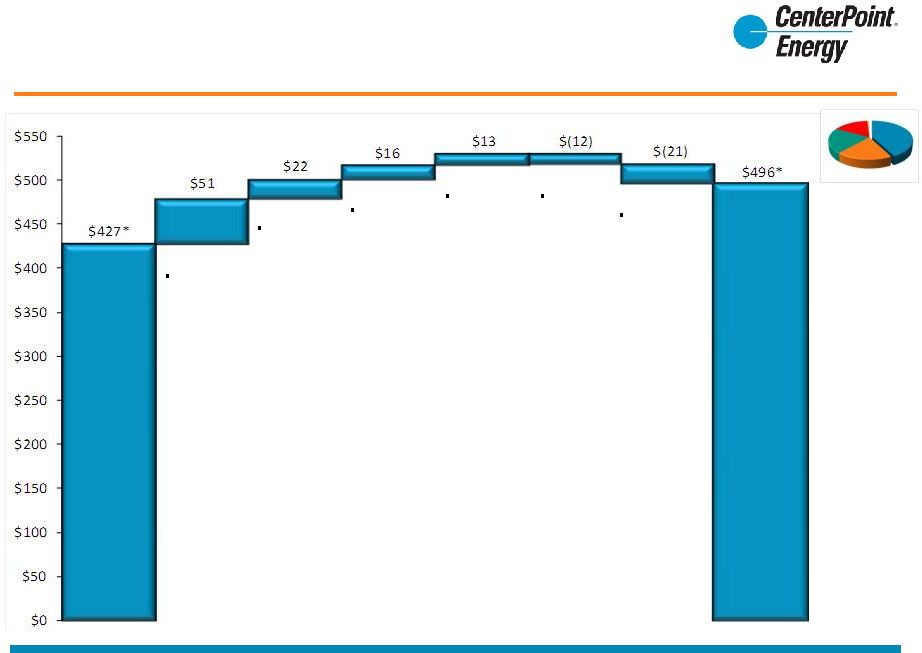 Electric Transmission & Distribution
2011 Operating Income Drivers
Increased
usage,
primarily
weather
Customer
growth
Other,
primarily
higher O&M
and lower
misc.
revenues
Lower
depreciation
expense
* Excludes operating income from transition and system restoration
bonds of $140 million and $127 million for 2010 and 2011, respectively
(in millions)
42%
Percentage of adjusted
operating income which
excludes $127 million of
securitization bonds
2010
2011
Higher net
TCOS
Rate case
impact
February 29, 2012
4
Full Year 2011 Earnings |
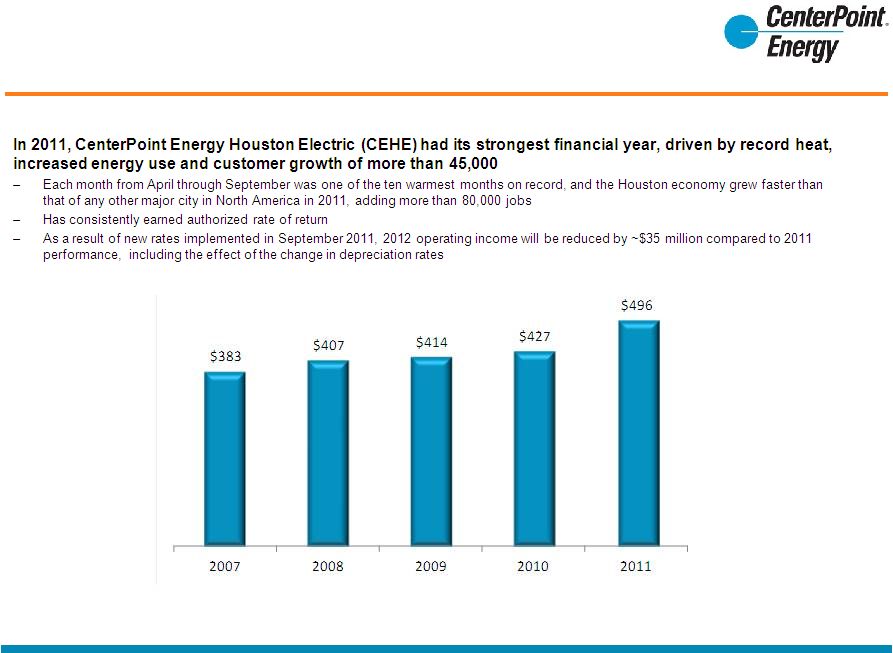 Electric Transmission & Distribution
Operating Income
Note:
Results
exclude
operating
income
from
the
Transition
and
System
Restoration
Bond
Companies,
the
Competition
Transition
Charge
and
the
Final
Fuel
Reconciliation
(see
reconciliation
on
page
28).
(in millions)
February 29, 2012
5
Full Year 2011 Earnings |
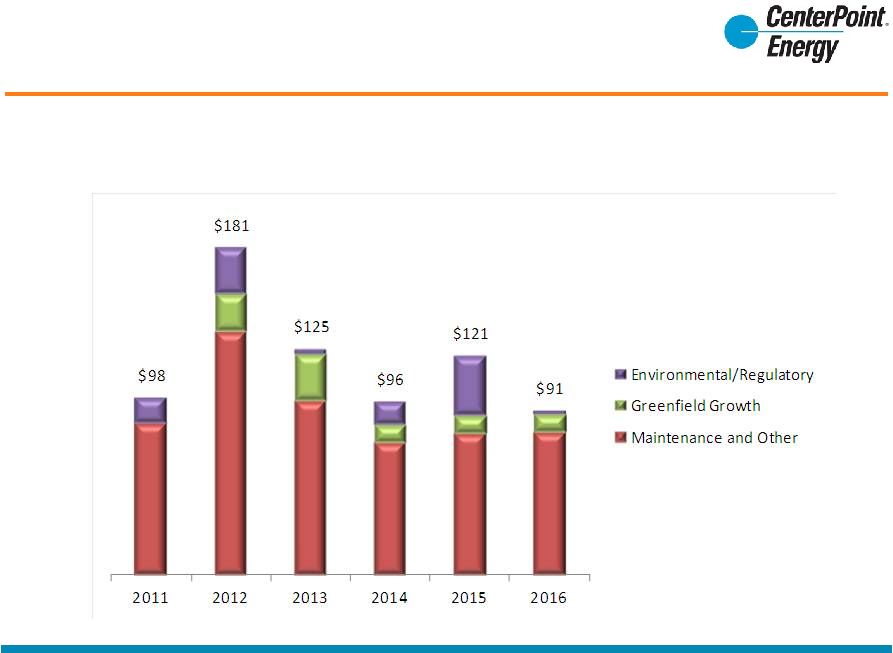
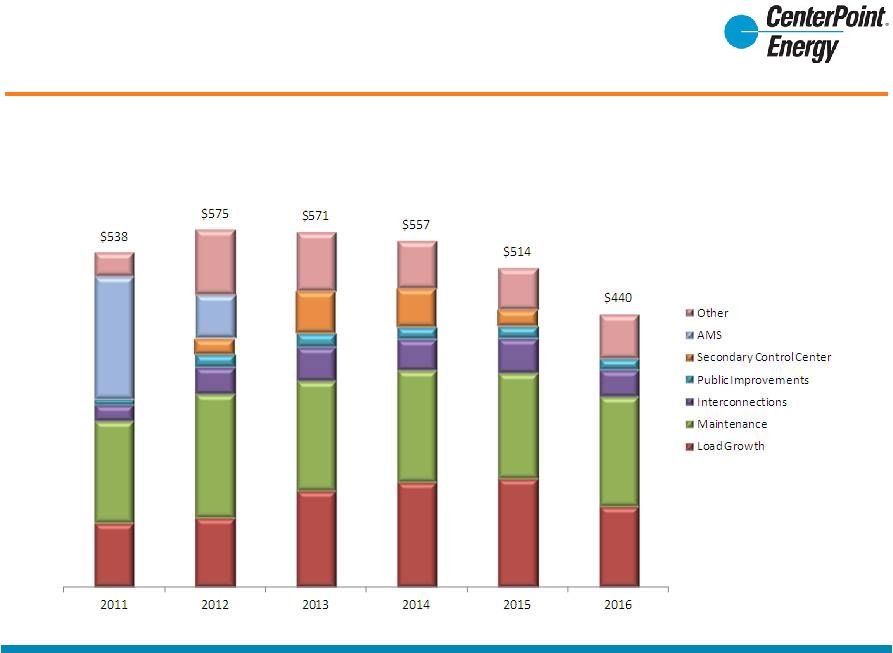 Electric Transmission & Distribution
Capital Expenditures
(in millions)
February 29, 2012
6
Full Year 2011 Earnings |
 February 29, 2012
7
Full Year 2011 Earnings
Electric Transmission & Distribution
Innovative Rate Mechanisms
Recovery mechanisms reduce rate case frequency and allow more timely recovery of and
on investments Interim Transmission Cost of Service (TCOS) Adjustment
Transmission Cost Recovery Factor (TCRF)
Distribution Cost Recovery Factor (DCRF)
Other Mechanisms
–
ERCOT transmission service providers (TSPs) charge distribution service providers
(DSPs) the cost of transmission investment –
Allows CEHE to make a filing up to two times per year to update its TCOS to recover
a return of and on transmission related plant investments –
CEHE is allowed to request rate increases twice a year to recover increased
transmission costs from other TSPs –
Additionally, CEHE is allowed to defer, until its next TCRF update, any increase in
expense from other TSPs –
In September 2011, the PUC approved a periodic rate adjustment mechanism that
mitigates regulatory lag for distribution capital investment –
Allows CEHE to file to update its rates each year effective September 1 to recover
a return of and on new distribution related plant investment (net of changes
in distribution related accumulated deferred federal income tax) –
No DCRF adjustment if the annual earnings monitoring report shows a utility is
earning more than its authorized rate of return on a weather normalized
basis –
Deferral
of
Pension
Costs
–
allows
a
utility
to
defer
the
excess
pension
and
other
postemployment
benefits
costs
over
the
amount
that
was
approved in the utility’s last general rate proceeding
–
Deferral
of
Bad
Debt
–
authorizes
utility
to
defer
bad
debts
resulting
from
defaults
by
REPs
for
recovery
in
a
future
rate
case
–
Energy
Efficiency
Cost
Recovery
Factor
(EECRF)
–
recovery
of
certain
energy
efficiency
program
costs
–
Advanced
Metering
System
(AMS)
Surcharge
–
continues
until
December
2014
for
residential
customers
and
until
April
2017
for
commercial
and industrial customers |
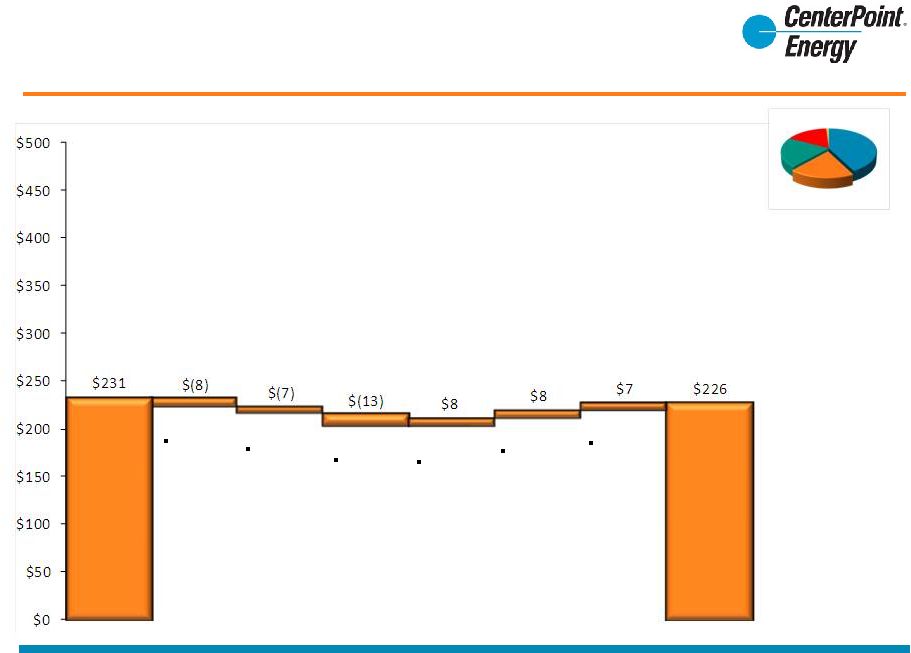 Natural Gas Distribution
2011 Operating Income Drivers
Higher
benefit
costs
(in millions)
19%
2010
2011
Lower
misc.
revenues
Other,
primarily
higher
expenses
Customer
growth
Lower bad
debt
expense
Rate
increases
Percentage of adjusted
operating income which
excludes $127 million of
securitization bonds
February 29, 2012
8
Full Year 2011 Earnings |
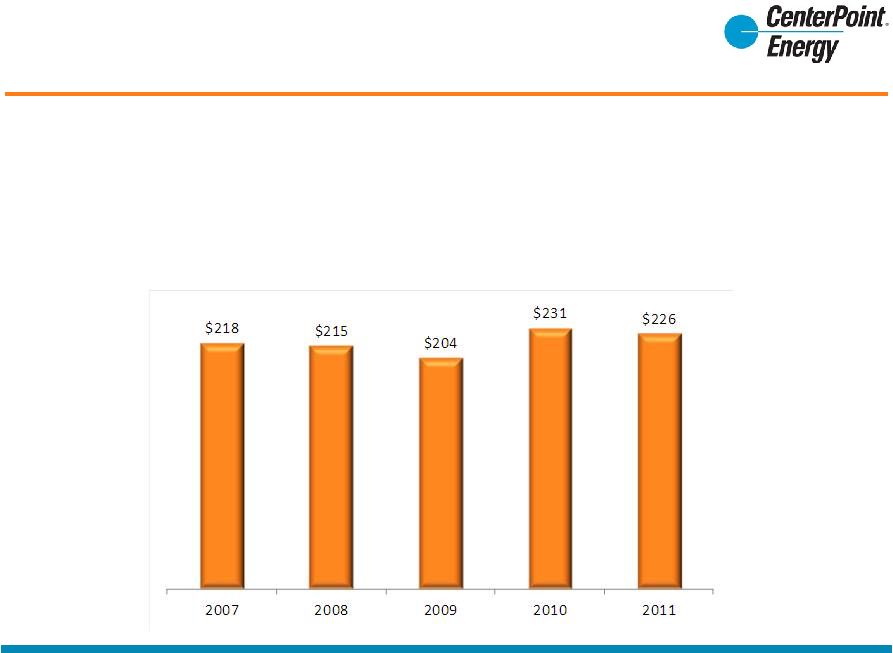 Earned at or near authorized return on equity over last two years
Natural Gas Distribution
Operating Income
(in millions)
February 29, 2012
9
Full Year 2011 Earnings |
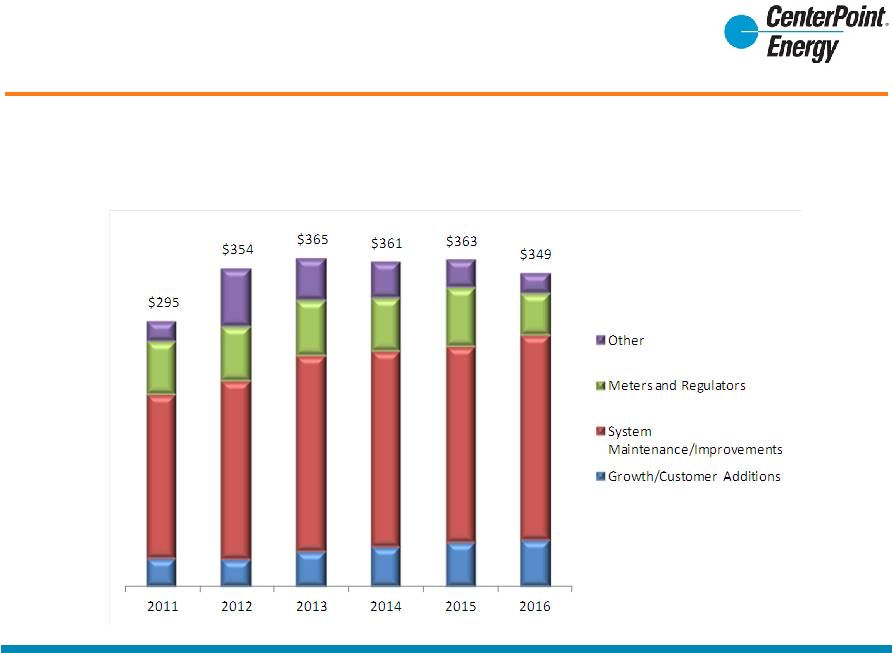 Natural Gas Distribution
Capital Expenditures
Increased capital investments primarily for infrastructure, safety and technology
will drive 6 percent growth in rate base
(in millions)
February 29, 2012
10
Full Year 2011 Earnings |
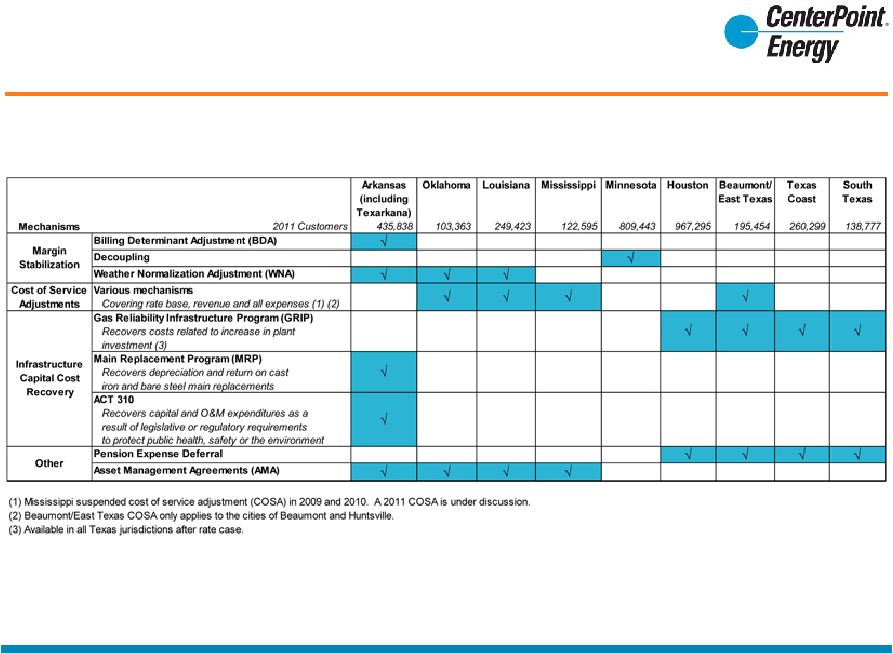 Natural Gas Distribution
Innovative Rate Mechanisms
Rate mechanisms reduce rate case frequency and decouple revenues
from consumption
February 29, 2012
11
Full Year 2011 Earnings |
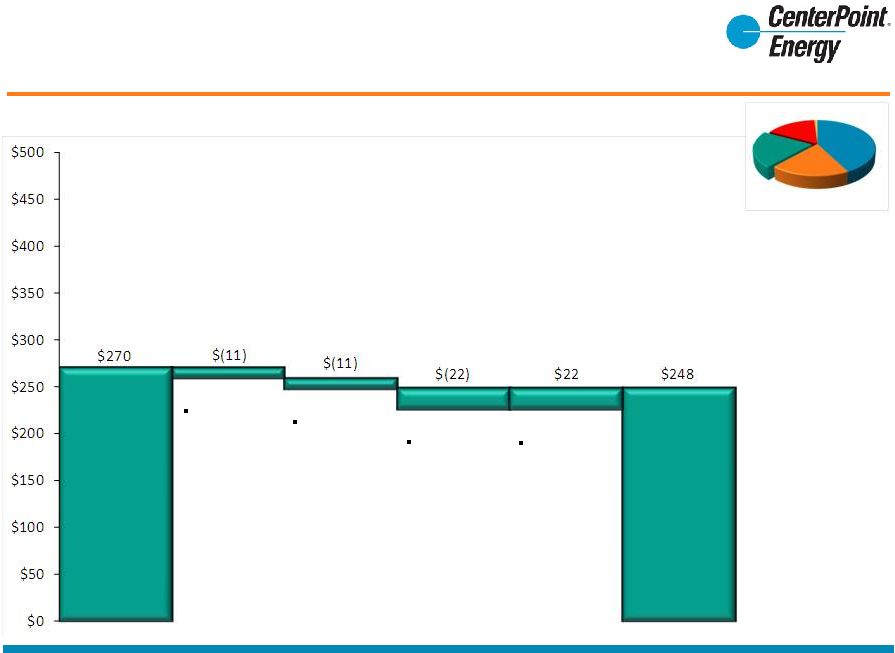 Interstate Pipelines
2011 Operating Income Drivers
Restructured
contracts with
natural gas
distribution
affiliates
(in millions)
21%
2010
2011
Lower off-
system
revenues due
to declining
basis
Expiring
Carthage to
Perryville
pipeline
backhaul
contract
New firm
transportation
contracts and
higher
ancillary
revenues
Percentage of adjusted
operating income which
excludes $127 million of
securitization bonds
February 29, 2012
12
Full Year 2011 Earnings |
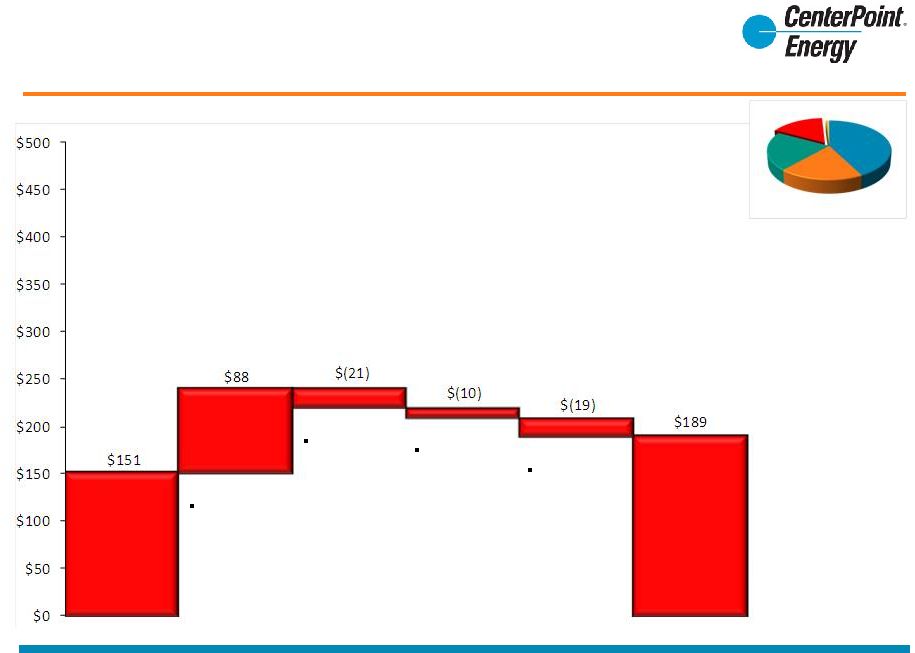
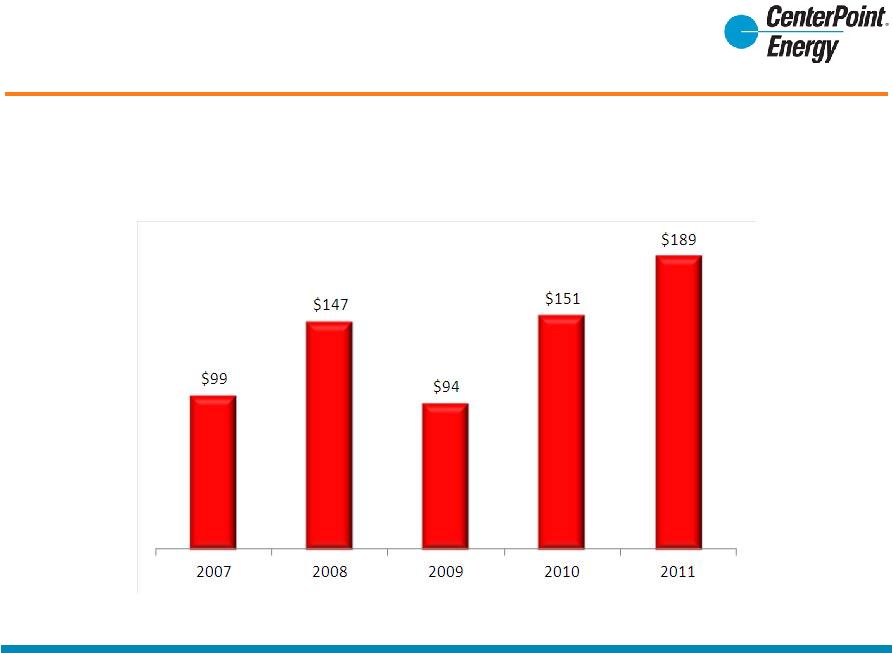
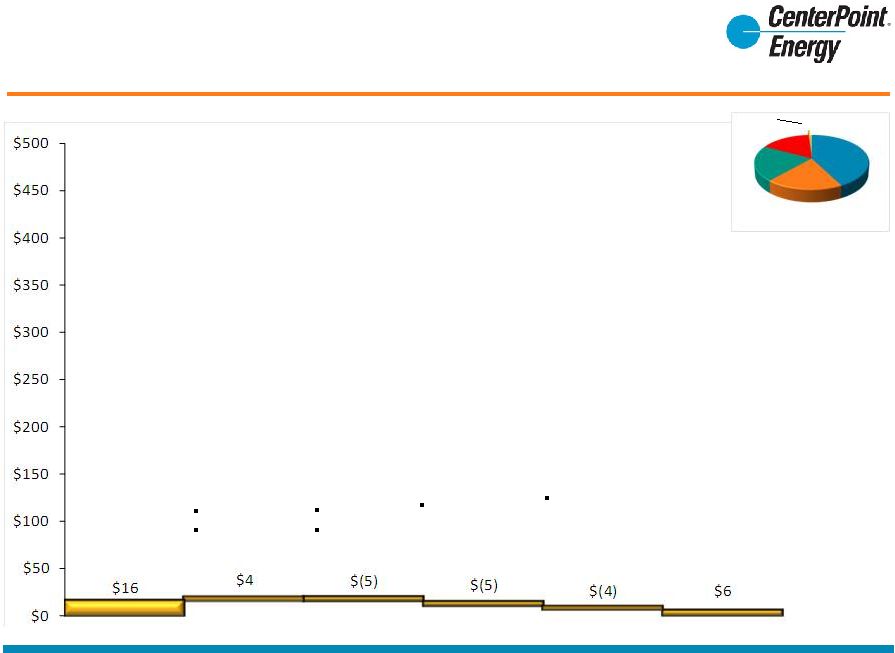
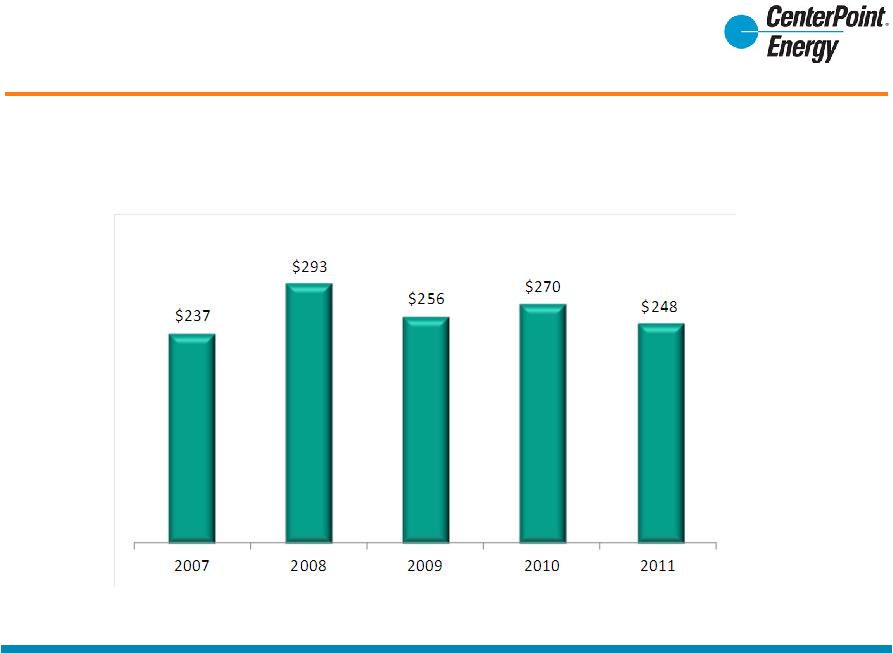 Interstate Pipelines
Operating Income
Operating income has benefited from core transportation contracts
Ancillary services are variable based on market conditions
More competition for new and existing customers expected in the future
(in millions)
Note: Interstate Pipelines also earned $6 million, $36 million, $7 million, $19
million and $21 million of equity income from its 50% interest in Southeast
Supply Header, LLC for 2007, 2008, 2009, 2010 and 2011, respectively.
February 29, 2012
13
Full Year 2011 Earnings |
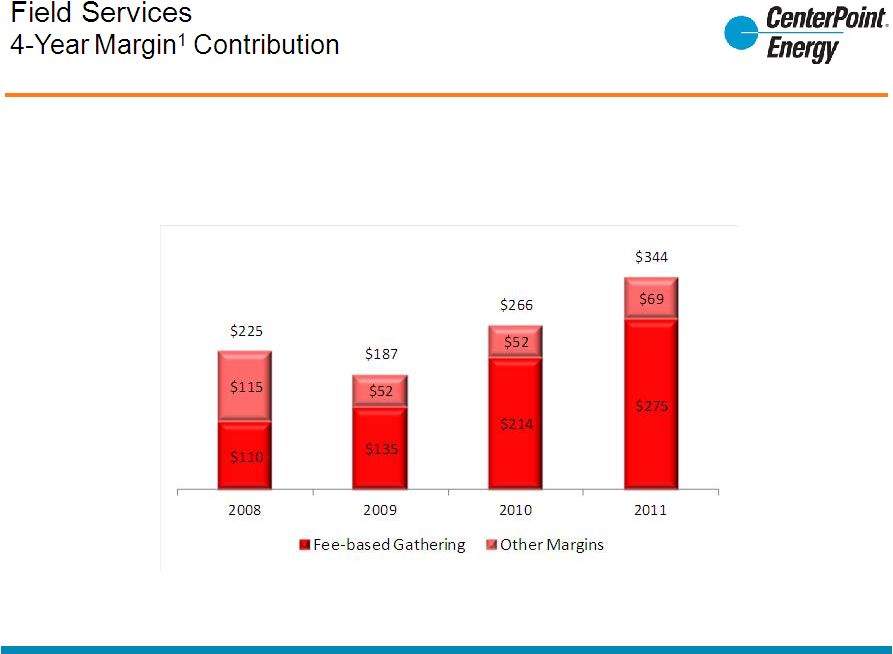
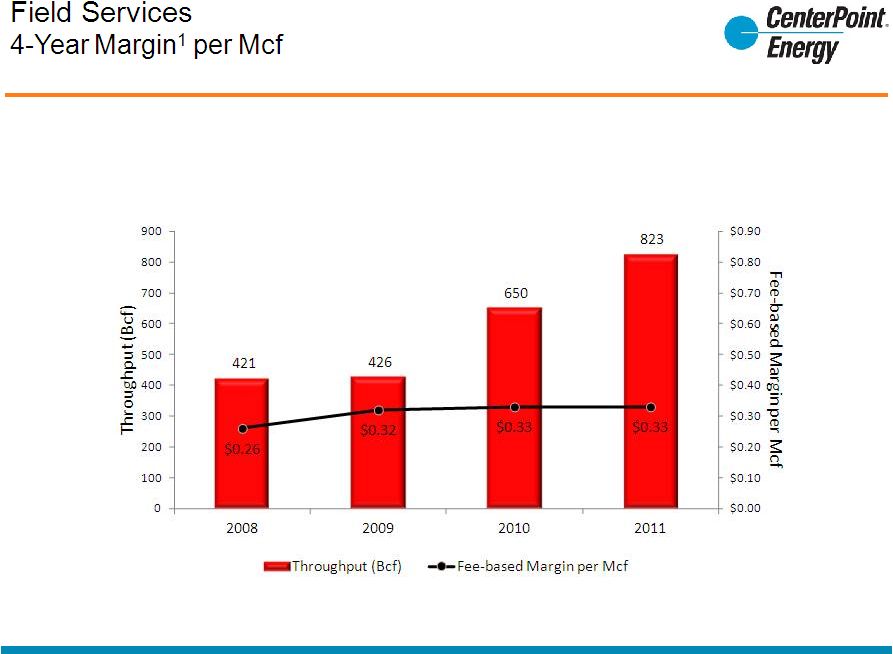
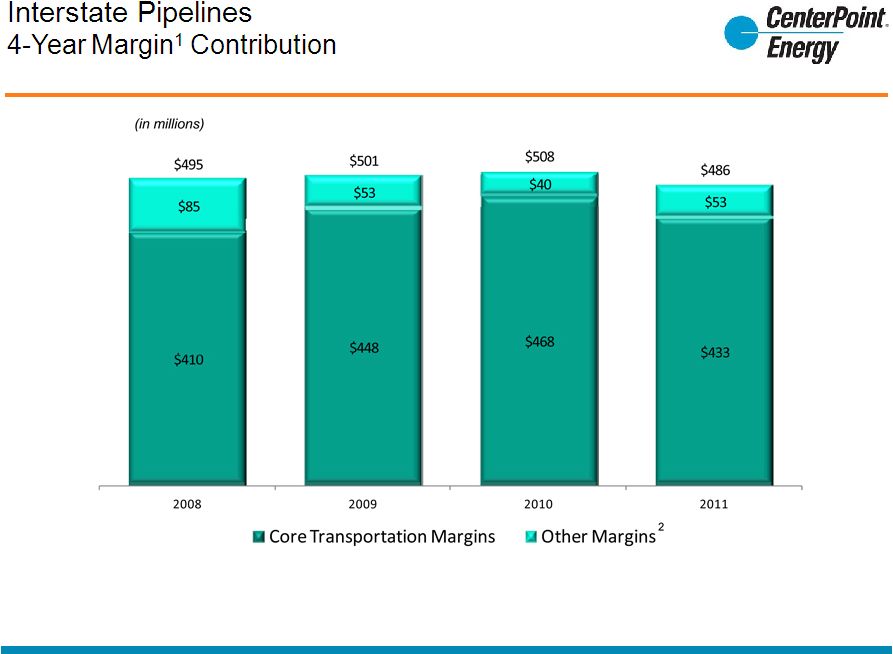 (1)
Margin equals revenues minus natural gas expense
(2)
Natural gas and ancillary services (balancing, system management, liquids)
2
February 29, 2012
14
Full Year 2011 Earnings |
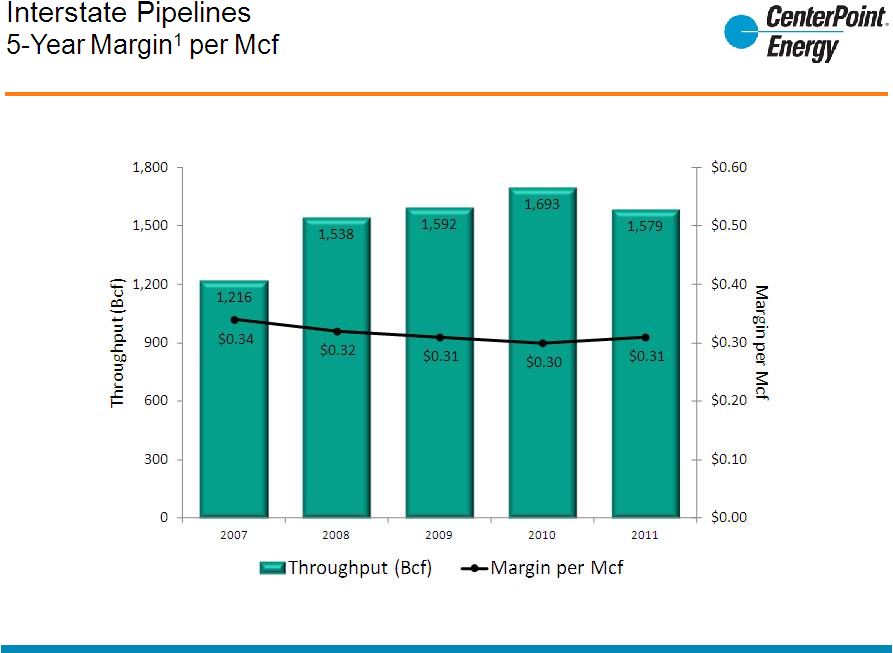 (1)
Margin equals revenues minus natural gas expense
February 29, 2012
15
Full Year 2011 Earnings |
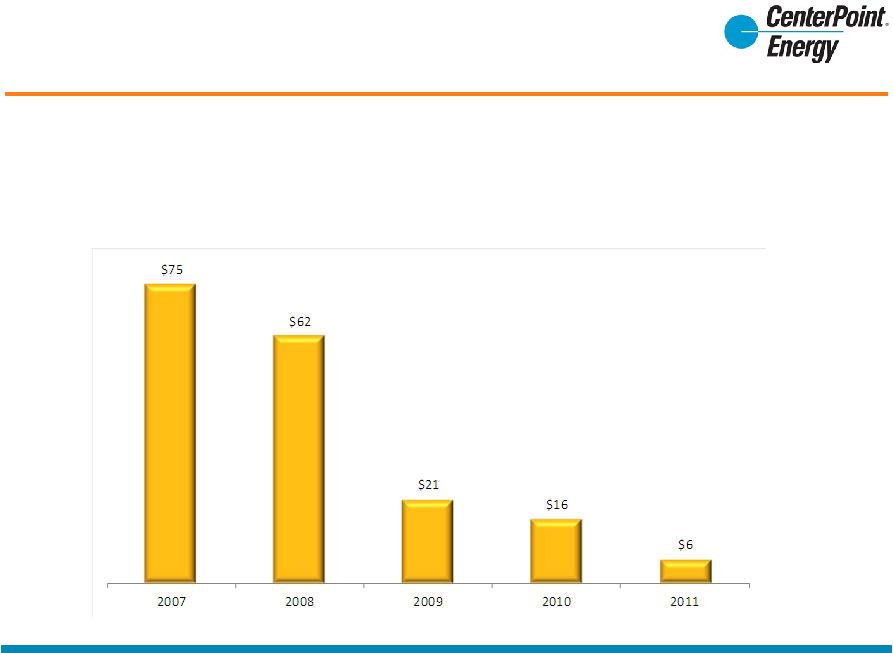
 Interstate Pipelines
Capital Expenditures
Planned capital expenditures support maintenance, pipeline upgrades, and pipeline
safety and environmental compliance
(in millions)
February 29, 2012
16
Full Year 2011 Earnings |
 Field Services
2011 Operating Income Drivers
Higher
throughput in
Haynesville and
Fayetteville
shales
(in millions)
16%
2010
2011
2010 gain on
sale of non-
strategic
assets
Lower
commodity
prices
Higher O&M,
depreciation,
and other
taxes due to
Magnolia and
Olympia
expansion
Percentage of adjusted
operating income which
excludes $127 million of
securitization bonds
February 29, 2012
17
Full Year 2011 Earnings |
 Field Services
Operating Income
Operating income has benefited from significant new investments in mid-continent
shale plays –
Contracted growth supported by fee-based contracts with volume commitments
and/or guaranteed returns on capital deployed (in millions)
Note: Field Services also earned $10 million, $15 million, $8 million, $10 million
and $9 million of equity earnings from its 50% interest in Waskom, a joint
processing plant, for 2007, 2008, 2009, 2010 and 2011, respectively.
February 29, 2012
18
Full Year 2011 Earnings |
 (1)
Margin equals revenues minus natural gas expense
(2)
Natural gas and liquids
2
(in millions)
February 29, 2012
19
Full Year 2011 Earnings |
 (1)
Margin equals revenues minus natural gas expense
February 29, 2012
20
Full Year 2011 Earnings |
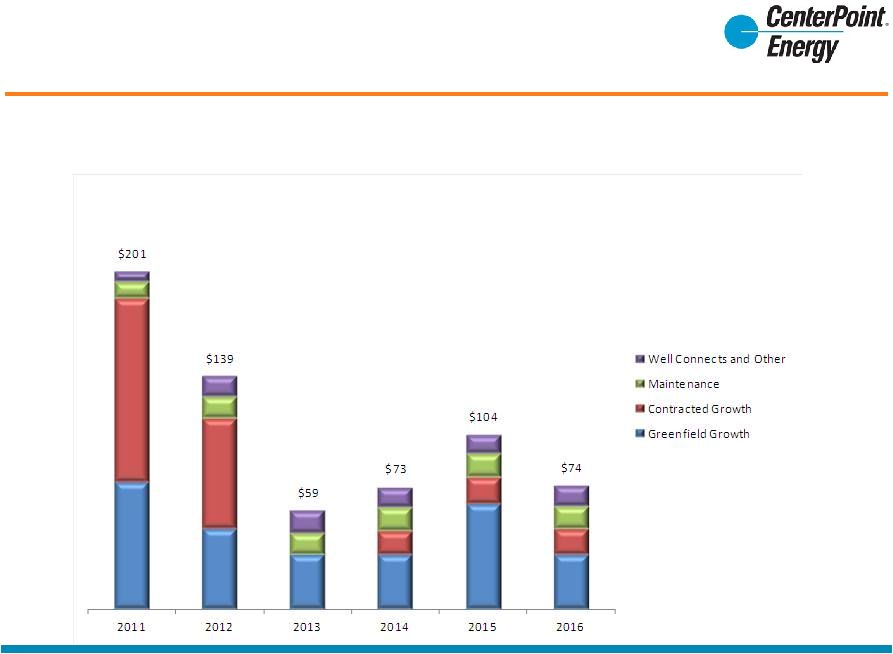 Field Services
Capital Expenditures
Developing shale plays drove significant capital prior to 2012
Beyond 2012, expect to deploy moderate level of capital under existing contractual
arrangements with customers Capital for significant new opportunities not
included (in millions)
February 29, 2012
21
Full Year 2011 Earnings |
 Competitive Natural Gas Sales & Services
2011 Operating Income Drivers
Lower optimization
opportunities
around pipeline
and storage assets
(in millions)
1%
2010
2011
Mark-to-market:
2011: $8 gain
2010: $4 gain
Inventory write-
down:
2011: $11
2010: $6
Release of
transportation
capacity
Percentage of adjusted
operating income which
excludes $127 million of
securitization bonds
February 29, 2012
22
Full Year 2011 Earnings |
 Competitive Natural Gas Sales & Services
Operating Income
Operating income has been negatively impacted by the significant
reductions in basis and seasonal spreads
Pipeline and storage capacity has been reduced to closely match customers
requirements (in millions)
February 29, 2012
23
Full Year 2011 Earnings |
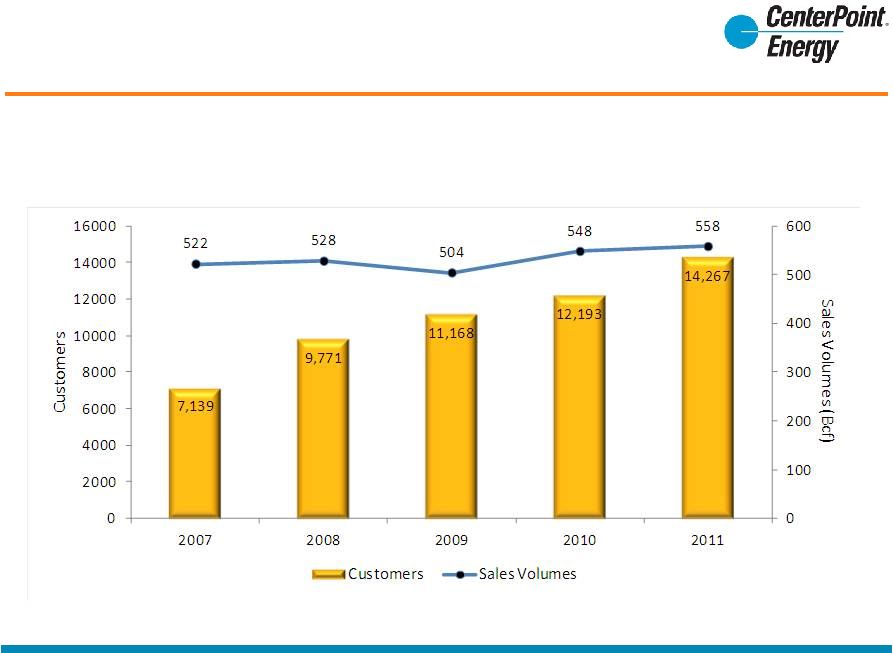 Competitive Natural Gas Sales & Services
Customers and Sales Volumes
February 29, 2012
24
Full Year 2011 Earnings |
 February 29, 2012
25
Full Year 2011 Earnings
25
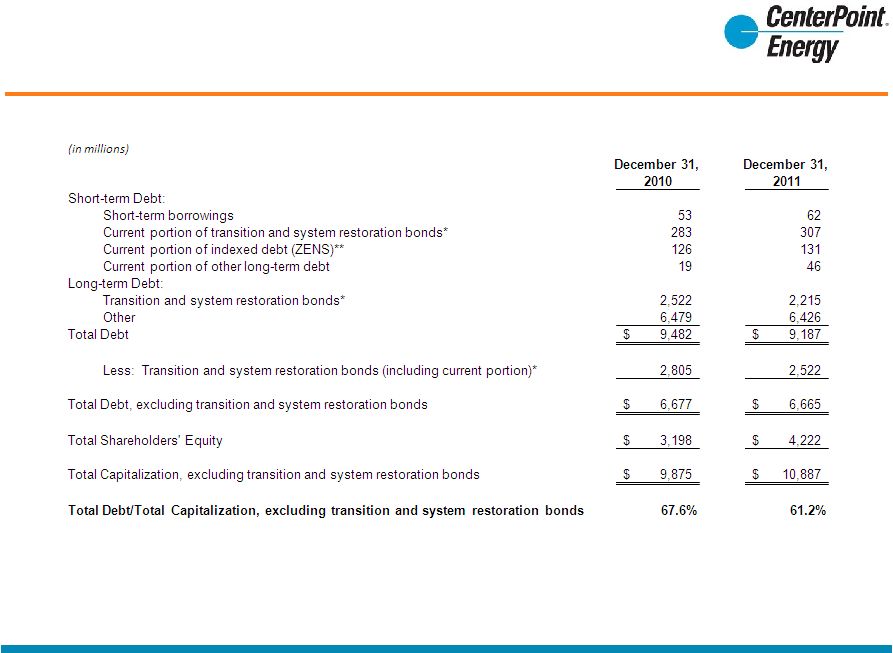
Debt and Capitalization Ratio
Excluding transition and system restoration bonds
* The transition and system restoration bonds are non-recourse to
CenterPoint Energy and CenterPoint Energy Houston Electric and are serviced
through collections of separate charges which are held in trust. **
The
debt
component
reflected
on
the
financial
statements
was
$131
as
of
December
31,
2011
and
$126
million
as
of
December
31,
2010.
The principal amount on which 2% interest is paid was $840 million as of December
31, 2011 and December 31, 2010. The contingent principal amount
was $797 as of December 31, 2011 and $805 million as of December 31, 2010. |
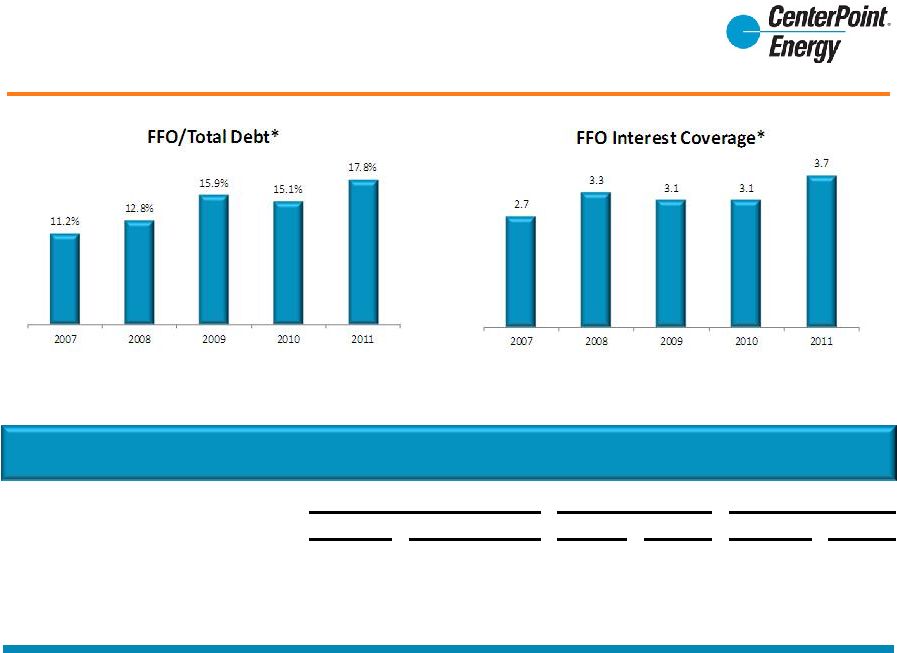 Credit Metrics and Ratings
* Calculated per CNP’s interpretation of S&P methodology; actual calculations
may include other adjustments not anticipated Credit Ratings
Rating
Outlook
Rating
Outlook
Rating
Outlook
CenterPoint Energy (Senior Unsecured)
Baa3
Stable
BBB
Stable
BBB-
Positive
CEHE (Senior Secured)
(1)
A3
Stable
A-
Stable
A-
Positive
CERC (Senior Unsecured)
Baa2
Stable
BBB+
Stable
BBB
Stable
(1) General mortgage bonds and first mortgage bonds.
Moody’s
Fitch
S&P
February 29, 2012
26
Full Year 2011 Earnings |
 February 29, 2012
27
Full Year 2011 Earnings
Liquidity
Available Liquidity ($MM)
Amount Utilized
Amount Unutilized
Bank Facilities
Type of Facility
Size of Facility
at February 13, 2012
at February 13, 2012
CenterPoint Energy
Revolver
1,200
$
13
$
(1)
1,187
$
CEHE
Revolver
300
4
(1)
296
CERC
Revolver
950
-
950
Total Credit Facilities
2,450
$
17
$
2,433
$
(1) Represents outstanding letters of credit.
Temporary Investments
Investments in Money Market Funds
(as of February 13, 2012)
1,486
Available Liquidity
3,919
$
|
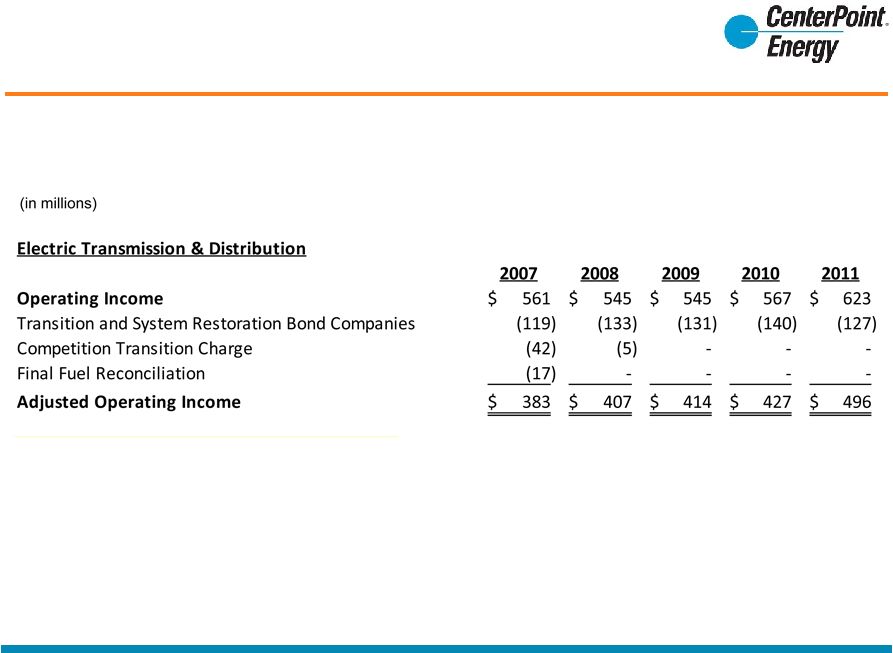 Reconciliation of CEHE Operating Income to
Adjusted Operating Income
February 29, 2012
28
Full Year 2011 Earnings |