Attached files
| file | filename |
|---|---|
| 8-K - FORM 8-K - Apollo Commercial Real Estate Finance, Inc. | d309395d8k.htm |
| EX-99.1 - EARNINGS RELEASE - Apollo Commercial Real Estate Finance, Inc. | d309395dex991.htm |
 Commercial Real Estate Finance, Inc. (“ARI”)
Quarterly Supplemental Presentation –
December 2011
a
0602201
Information is as of December 31, 2011 except as otherwise noted.
It should not be assumed that investments made in the future will
be profitable or will equal the performance of investments in this document.
Exhibit 99.2 |
 Legal Disclaimer
We make forward-looking statements in this presentation and other
filings we make with the SEC within the meaning of Section 27A of the
Securities Act of 1933, as amended, and Section 21E of the Securities
Exchange Act of 1934, as amended, and such statements are intended to be
covered by the safe harbor provided by the same. Forward-looking
statements are subject to substantial risks and uncertainties, many of which
are difficult to predict and are generally beyond our control. These
forward-looking statements include information about possible or assumed
future results of our business, financial condition, liquidity, results
of operations, plans and objectives. When we use the words “believe,”
“expect,”
“anticipate,”
“estimate,”
“plan,”
“continue,”
“intend,”
“should,”
“may”
or similar expressions, we intend to identify forward-looking
statements. Statements regarding the following subjects, among
others, may be forward-looking: our business and investment strategy; our
operating
results;
our
ability
to
obtain
and
maintain
financing
arrangements;
the
return
on
equity,
the
yield
on
investments
and
risks
associated
with investing in real estate assets, including changes in business
conditions and the general economy. The forward-looking
statements are based on our beliefs, assumptions and expectations of our future performance, taking into account all
information currently available to us. Forward-looking statements
are not predictions of future events. These beliefs, assumptions and
expectations can change as a result of many possible events or factors,
not all of which are known to us. Some of these factors are described
under
“Risk
Factors,”
and
“Management’s
Discussion
and
Analysis
of
Financial
Condition
and
Results
of
Operations”
as
included
in
ARI’s
Annual Report on Form 10-K for the fiscal year ended December 31,
2010, and in ARI’s Quarterly Reports on Form 10-Q for the quarters ended
March 31, 2011, June 30, 2011 and September 30, 2011. If a change
occurs, our business, financial condition, liquidity and results of operations
may vary materially from those expressed in our forward-looking
statements. Any forward-looking statement speaks only as of the date on which it
is made. New risks and uncertainties arise over time, and it is not
possible for us to predict those events or how they may affect us. Except as
required by law, we are not obligated to, and do not intend to, update
or revise any forward-looking statements, whether as a result of new
information, future events or otherwise.
This presentation may contain statistics and other data that in some
cases has been obtained from or compiled from information made available
by third-party service providers.
1
COMMERCIAL REAL ESTATE FINANCE, INC. (“ARI”)
|
 Investment
Statement 2011
2010
% Change
2011
2010
% Change
14,564
$
10,733
$
35.7%
52,918
$
32,485
$
62.9%
(3,618)
$
(3,421)
$
5.8%
(14,454)
$
(10,714)
$
34.9%
Net interest income (in thousands)
10,946
$
7,312
$
49.7%
38,464
$
21,771
$
76.7%
0.39
$
0.27
$
44.4%
1.47
$
1.09
$
34.9%
20,561,032
17,670,468
16.4%
18,840,954
12,679,277
48.6%
Balance sheet
860,247
$
806,870
$
6.6%
336,978
$
297,838
$
13.1%
2.2 years
2.5 years
1.64x
1.88x
251,327
$
297,334
$
290,700
$
242,728
$
3.5x
3.0x
Three Months Ended December 31,
Year Ended December 31,
Interest income (in thousands)
Interest expense (in thousands)
Operating earnings per share
Basic and diluted weighted average common shares
outstanding
Investments at amortized cost (in thousands)
Net equity (in thousands)
Investments - Weighted average Duration
Debt to equity
Fixed rate debt (in thousands)
(1)
Debt service coverage
(2)
Floating rate debt (in thousands)
ARI –
Financial Summary
COMMERCIAL REAL ESTATE FINANCE, INC. (“ARI”)
2
(1)
Fixed rate debt refers to the TALF borrowings which were refinanced with
the Wells repurchase facility during January 2012. (2)
The debt service coverage is interest expense as a percentage of
EBITDA. |
 ARI Overview
Return on Equity Based on Operating Income
(1)
Net Interest Income ($000s)
Dividend per Share
Operating Earnings per Share
(1)
Return on equity is calculated as annualized operating income for the
quarter as a percentage of average equity. COMMERCIAL REAL ESTATE
FINANCE, INC. (“ARI”) 3
$491
$3,903
$5,056
$5,500
$7,313
$7,599
$9,684
$10,236
$10,946
$0
$2,000
$4,000
$6,000
$8,000
$10,000
$12,000
Q3
2009
Q4
2009
Q1
2010
Q2
2010
Q3
2010
Q4
2010
Q1
2011
Q2
2011
Q3
2011
Q4
2011
3.4%
4.3%
6.7%
6.5%
6.3%
6.8%
9.6%
9.3%
9.8%
-6%
-4%
-2%
0%
2%
4%
6%
8%
10%
12%
Q3
2009
Q4
2009
Q1
2010
Q2
2010
Q3
2010
Q4
2010
Q1
2011
Q2
2011
Q3
2011
Q4
2011
-$0.01
-
$0.16
$0.20
$0.31
$0.32
$0.27
$0.29
$0.40
$0.38
$0.39
-$0.20
-$0.10
$0.00
$0.10
$0.20
$0.30
$0.40
$0.50
Q3
2009
Q4
2009
Q1
2010
Q2
2010
Q3
2010
Q4
2010
Q1
2011
Q2
2011
Q3
2011
Q4
2011
$0.35
$0.35
$0.40
$0.40
$0.40
$0.40
$0.40
$0.40
$0.00
$0.05
$0.10
$0.15
$0.20
$0.25
$0.30
$0.35
$0.40
$0.45
Q3
2009
Q4
2009
Q1
2010
Q2
2010
Q3
2010
Q4
2010
Q1
2011
Q2
2011
Q3
2011
Q4
2011
- |
 COMMERCIAL REAL ESTATE FINANCE, INC. (“ARI”)
4
ARI –
Q4 Financial Highlights
Financial Results & Earnings Per Share
Operating Earnings for the quarter ended December 31, 2011 of $8.3
million, or $0.39 per diluted common share
(1)
–
An
increase
of
44%
per
share
as
compared
with
Operating
Earnings
for
the
same
period
in
2010
–
Net interest income of $10.9 million for Q4 2011
–
Total expenses of $2.9 million, comprised of management fees of $1.3
million and G&A of $1.6
million
(2)
GAAP net income for the quarter ended December 31, 2011 of $8.7
million, or $0.41 per diluted common share
Dividend
Declared dividend of $0.40 per share of common stock for the quarter
ended December 31, 2011
–
Seven consecutive quarters of $0.40 per share dividend
10.6% annualized dividend yield based on closing price on February 27,
2012 (1)
Operating Earnings is a non-GAAP financial measure that is used to
approximate cash available for distribution and is defined by the Company as net income, computed in accordance with GAAP, adjusted for (i) non-
cash equity compensation expense and (ii) any unrealized gains or losses
or other non-cash items included in net income. Please see slide 15 for a reconciliation of operating earnings and operating earnings per diluted
common share to GAAP net income and GAAP net income per diluted common
share. (2)
Total expenses includes $634,000 of non-cash stock based
compensation for Q4 2011. |
 COMMERCIAL REAL ESTATE FINANCE, INC. (“ARI”)
5
ARI –
Q4 Financial Highlights
Investment Portfolio
Total investments of $860 million at December 31, 2011
Weighted average
underwritten
IRR
of
approximately
14.2%
(1)
Book Value
GAAP book value of $16.39 per share as of December 31, 2011
–
ARI
closed
at
$15.14
on
February
27,
2012
or
at
a
7.6%
discount
to
book
value
(2)
Fair
value
of
$16.80
per
share
outstanding
as
of
December
31,
2011
(3)
Subsequent Events
TALF refinancing
–
January
2012
–
Refinanced
TALF
debt
with
Wells
Facility
Increased advance rate generated approximately $14 million of
additional investable capital Lowered
current
cost
of
funds
from
2.8%
to
1.9%
and
extended
the
maturity
to
August
2013
New Investment
–
January 2012 –
Closed a $15 million mezzanine loan on a 165-room hotel in New
York, NY with an underwritten IRR of approximately 14.0%
(1)
(1)
The internal rates of return (“IRR”) for the investments shown
in the above table reflect the returns underwritten by the Manager, calculated on a weighted average basis assuming no dispositions, early prepayments or defa
but assumes extensions as well as the fully hedged cost of borrowings
under the Company’s master repurchase agreement with Wells Fargo Bank (“Wells Facility”). The Company has also assumed that financing will
available through the maturity of the asset and reflect a cost of funds
based on forward LIBOR curve. There can be no assurance that the actual IRRs will equal the underwritten IRRs shown in the table. See “Risk Factors”
the Company’s Annual Report on Form 10-K for the year ended
December 31, 2010 for a discussion of some of the factors that could adversely impact the returns received by the Company from the investments over time.
(2)
Based on GAAP Book Value of $16.39 per share as of December 31,
2011. (3)
The Company carries loans at amortized cost and its CMBS securities are
marked to market. Management has estimated that the fair value of the Company’s financial assets at December 31, 2011 was approximately $8.0
million greater than the carrying value of the Company’s investment
portfolio as of the same date. This represents a premium of $0.41 per share over the Company's GAAP book value as of December 31, 2011.
|
 COMMERCIAL REAL ESTATE FINANCE, INC. (“ARI”)
6
Stable, In-Place Investments Offer Attractive Yields
Asset Type
($000s)
Amortized
Cost
Equity
at Cost
Remaining
Weighted
Average
Life
Weighted
Average
IRR
(1)(3)
First
Mortgage
Loans
(1)
$109,006
($ 68,720)
$ 40,286
2.6 years
17.7%
Mezzanine Loans
149,086
—
149,086
6.2 years
14.2%
Repurchase Agreements
47,439
—
47,439
0.8 years
13.7%
AAA
CMBS–(Financed
with
TALF
Borrowings)
(2)
301,980
(251,327)
50,653
1.4 years
13.5%
AAA
CMBS–(Financed
with
Wells
Repurchase
Facility)
(2)
252,736
(221,980)
30,756
0.9 years
11.6%
Investments at December 31, 2011
$ 860,247
($542,027)
$318,220
2.2 years
14.2%
As of December 31, 2011.
(1)
Borrowings under the Company’s master repurchase facility with
JPMorgan bear interest at LIBOR plus 300 basis points, or 3.3% at December 31, 2011. The IRR calculation further assumes that the JPM
repurchase facility will remain available over the life of these
investments. (2)
TALF borrowings are non-recourse and were refinanced with the Wells
Facility during January 2012. The Company has agreed to provide a limited guarantee of up to 15% of the outstanding obligations of its
indirect wholly-owned subsidiary under the Wells Facility, or a
maximum of $37,500. (3)
The IRR for the investments shown in the above table reflect the returns
underwritten by the Manager, calculated on a weighted average basis assuming no dispositions, early prepayments or defaults but
assumes extensions as well as the fully hedged cost of borrowings under
the Wells Facility. The Company has also assumed that financing will be available through the maturity of the asset and reflect a cost of
funds based on forward Libor curve. There can be no assurance that the
actual IRRs will equal the underwritten IRRs shown in the table. See “Risk Factors” in the Company’s Annual Report on Form 10-K for
the year ended December 31, 2010 for a discussion of some of the factors
that could adversely impact the returns received by the Company from the investments shown in the table over time.
Borrowings |
 COMMERCIAL REAL ESTATE FINANCE, INC. (“ARI”)
7
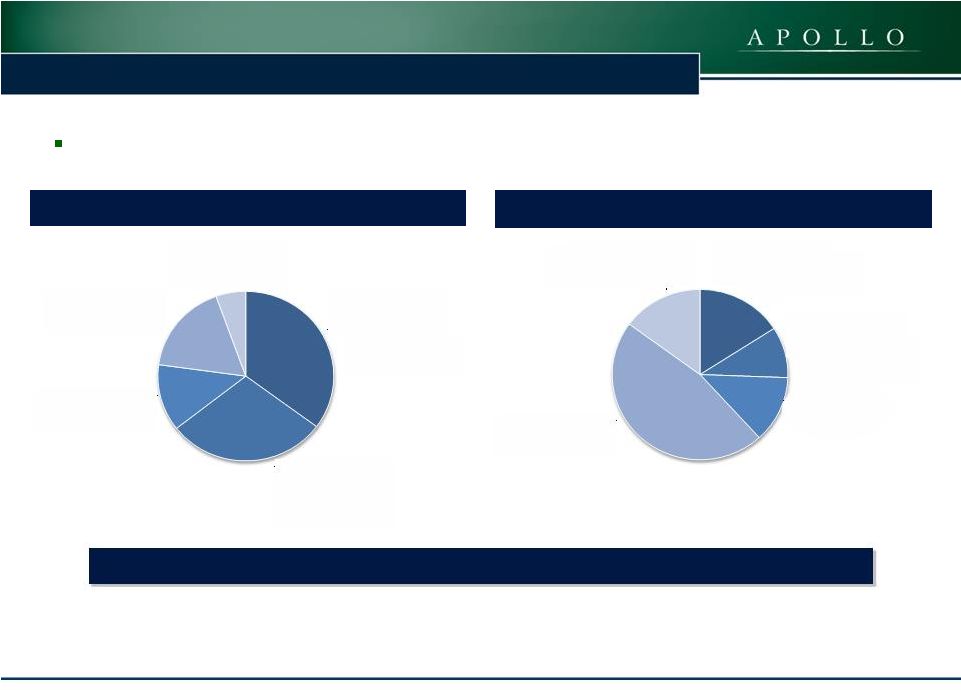
ARI Overview
Diversified Investment Portfolio with Amortized Cost Basis of $860
million Net Equity at Amortized Cost Basis ($000s)
Gross Assets at Amortized Cost Basis ($000s)
AAA CMBS (Financed
with TALF Borrowings)
$301,980
35%
AAA CMBS (Financed
with Wells Repurchase
Facility)
$252,736
29%
First Mortgages Loans
$109,006
13%
Mezzanine Loans
$149,086
17%
Repurchase Agreements
$47,439
6%
AAA CMBS
(Financed with TALF
Borrowings)
$50,653
16%
AAA CMBS
(Financed with Wells
Repurchase Facility)
$30,756
10%
First Mortgages Loans
$40,286
12%
Mezzanine Loans
$149,086
47%
Repurchase
Agreements
$47,439
15%
As of December 31, 2011.
(1) The IRR for the investments shown in the above table
reflect the returns underwritten by the Manager, calculated on a weighted average basis assuming no dispositions, early prepayments or defaults but assumes
extensions as well as the
fully hedged cost of borrowings under the Wells Facility. The Company has also assumed that financing will be available through the maturity of the asset and reflect a cost of funds based on
forward Libor curve. There
can be no assurance that the actual IRRs will equal the underwritten IRRs shown in the table. See “Risk Factors” in the Company’s Annual Report on Form 10-K for the year ended
December 31, 2010 for a discussion
of some of the factors that could adversely impact the returns received by the Company from the investments shown in the table over time.
Weighted Average IRR of Approximately 14.2%
(1) |
 COMMERCIAL REAL ESTATE FINANCE, INC. (“ARI”)
8
ARI Diversification
Net Equity Investments of $318 million as of December 31, 2011
Geographic Diversification by Net Equity
Property Type by Net Equity
(1)
See Form 10-Q and Form 10-K for property type and geographic
location underlying CMBS portfolio. (2)
Other category includes the repurchase agreement and the subordinate
financing on a ski resort. (3)
Other category includes the repurchase agreement as well as investments
in asset portfolios that are geographically diversified. (1)
(2)
(1)
(3)
North East
20%
South East
8%
Mid West
3%
West
13%
Other
31%
CMBS
25%
Hotel
17%
Office
6%
Retail
24%
Other
28%
CMBS
25% |
 COMMERCIAL REAL ESTATE FINANCE, INC. (“ARI”)
9
Senior Loan Portfolio
Description ($000’s)
Date of
Investment
Maturity
Date
Original
Face
Amount
Current
Face
Amount
Coupon
Amortization
Schedule
Property
Size
Current
Loan
Amount
Appraised
LTV
(1)
Hotel
New York, NY
Jan-10
Feb-15
$32,000
$31,798
8.25%
30 year
151
rooms
$210/
key
40%
Office Condo (Headquarters)
New York, NY
Feb-10
Feb-15
28,000
27,644
8.00
30 year
73,419
sq. ft.
$377/
sq. ft.
54%
Hotel
Silver Spring, MD
Mar-10
Apr-15
26,000
25,564
9.00
25 year
263
rooms
$97/
key
58%
Hotel
New York, NY
Aug-10
Aug-12
24,000
24,000
8.00
Interest
only
155
rooms
$155/
key
40%
Total
.
.
$110,000
$109,006
8.31%
Description ($000’s)
Date of
Investment
Maturity
Date
Original
Face
Amount
Current
Face
Amount
Coupon
Amortization
Schedule
Property
Size
Current
Loan
Amount
Appraised
LTV
(1)
Repurchase Agreement
(2)
Sept-10
Sept-12
$47,439
$47,439
13.00%
Interest only
N/A
N/A
N/A
Total
$47,439
$ 47,439
13.00%
(1)
Appraised loan-to-value (“LTV”) represents the LTV as
of the date of investment for all loans except the $32,000 New York, NY hotel loan. The LTV for the $32,000 New York, N.Y. hotel loan is as of March 2011.
(2)
Interest rate includes 10% current payment with a 3% accrual.
|
 COMMERCIAL REAL ESTATE FINANCE, INC. (“ARI”)
10
Subordinate Loan Portfolio
Description ($000’s)
Date of
Investment
Maturity
Date
Original
Face
Amount
Current
Face
Amount
Coupon
Amortization
Schedule
Current
Loan
Amount
Appraised
LTV
(1)
Senior
Mezz
–
Retail
Various
Dec-09
Dec-19
$30,000
$30,000
12.24%
Interest
only
(2)
$86/
sq. ft.
69%
Junior
Mezz
–
Retail
Various
Dec-09
Dec-19
20,000
20,000
14.00
Interest
only
(2)
$91/
sq. ft.
74%
Office
Michigan
May-10
Jun-20
9,000
8,950
13.00
25 year
$82/
sq. ft.
70%
Ski Resort
California
Apr-11
May-17
40,000
40,000
13.25
Interest
only
(2)
$356/
key
64%
Hotel Portfolio
New York
(3)
Aug-11
July-13
25,000
25,000
11.49
Interest
only
(4)
$339/
key
60%
Retail Center
Virginia
(5)
Oct-11
Oct-14
25,000
25,136
14.00
Interest
only
(5)
$281/
sq. ft.
60%
Total
.
.
$149,000
$149,086
13.00%
(1) Appraised LTV represents the LTV as of the date of investment.
(2) Prepayments are prohibited prior to the third year of the loan and
any prepayments thereafter are subject to prepayment penalties ranging from 5% to 0%.
(3) Includes a LIBOR floor of 1% and three one-year extension
options subject to certain conditions. (4) Prepayments are prohibited prior to February 2013 and any
prepayments thereafter are subject to spread maintenance premiums.
(5) Interest rate of 14.0% includes a 10.0% current payment with a 4.0%
accrual. There are two one-year extension options subject to certain conditions.
|
 COMMERCIAL REAL ESTATE FINANCE, INC. (“ARI”)
11
CMBS Portfolio
Face
Amortized
Cost
Remaining Weighted
Average Life with
Extensions (months)
Estimated
Fair Value
Debt
Net
Equity
TOTAL CMBS
$546,807
$554,716
14
$553,995
$473,307
$ 80,688
(1)
TALF borrowings were refinanced with an increase in the Wells repurchase
facility during January 2012. AAA CMBS–(Financed with TALF
Borrowings) (1)
CUSIP
Description
07388YAB8
BSCMS 07-PW16 A2
07401DAB7
BSCMS 2007-PW18 A2
12513YAC4
CD 2007-CD4 A2B
46629MAB1
JPMCC 2006-LDP8 A2
46631BAB1
JPMCC 07-LD11 A2
46632HAB7
JPMCC 2007-LD12 A2
50180CAB6
LBUBS 06-C7 A2
52109PAB1
LBUBS 07-C6 A2
61754KAC9
MSC 07-IQ14 A2
92978NAB0
WBCMT 07-C33 A2
92978YAB6
WBCMT 07-C32 A2
AAA CMBS–(Financed with Wells Repurchase Facility)
CUSIP
Description
07401DAB7
BSCMS 2007-PW18 A2
36246LAB7
GSMS 2007-GG10 A2
46630JAK5
JPMCC 2007-LDPX A2S
46630VAB8
JPMCC 2007-CB19 A2
46631QAB8
JPMCC 2007-CB20 A2
61751NAD4
MSC 2007-HQ11 A31
92978TAB7
WBCMT 2007-C31 A2 |
 COMMERCIAL REAL ESTATE FINANCE, INC. (“ARI”)
12
Financials |
 COMMERCIAL REAL ESTATE FINANCE, INC. (“ARI”)
13
(in thousands—except share and per share data)
December 31, 2011
December 31, 2010
Assets:
Cash and cash equivalents
21,568
$
37,894
$
Securities available-for-sale,
at estimated fair value 302,543
363,660
Securities, at estimated fair
value 251,452
279,124
Commercial mortgage loans, held for
investment 109,006
109,695
Subordinate loans, held for
investment 149,086
58,985
Repurchase agreements, held
for investment 47,439
-
Principal and interest receivable
8,075
5,553
Deferred
financing costs, net 2,044
2,818
Derivative instruments, net
-
387
Other assets
17
31
Total Assets
891,230
$
858,147
$
Liabilities and Stockholders' Equity
Liabilities:
TALF borrowings
251,327
$
297,334
$
Borrowings under repurchase agreements
290,700
242,728
Derivative instruments, net
478
-
Accounts payable and accrued expenses
1,746
2,375
Payable
to related party 1,298
683
Dividends payable
8,703
7,189
Deferred
underwriting fee ($8,000 of which was payable to the Manager) -
10,000
Total Liabilities
554,252
560,309
Commitments and Contingencies (see
Note 13) Stockholders' Equity:
Common stock, $0.01 par value, 450,000,000 shares authorized, 20,561,032 and 17,551,828 shares
issued and outstanding in 2011 and 2010, respectively
206
175
Additional paid-in-capital
336,209
291,304
Accumulated other comprehensive
income 563
6,359
Total
Stockholders' Equity 336,978
297,838
Total Liabilities and Stockholders'
Equity 891,230
$
858,147
$
Consolidated Balance
Sheets |
 COMMERCIAL REAL ESTATE FINANCE, INC. (“ARI”)
14
2011
2010
2011
2010
Net interest income:
Interest income from securities
5,904
$
6,468
$
25,323
$
18,112
$
Interest income from commercial mortgage loans
2,267
2,313
9,153
7,035
Interest income from subordinate loans
4,817
1,952
13,678
7,338
Interest income from repurchase agreements
1,576
-
4,764
-
Interest expense
(3,618)
(3,421)
(14,454)
(10,714)
Net interest income
10,946
7,312
38,464
21,771
Operating expenses:
General and administrative expenses (includes $634 and $1,788 of non-cash
stock based compensation in 2011 and $354 and $1,452 in 2010, respectively)
(1,563)
(1,400)
(5,652)
(5,556)
Management fees to related party
(1,297)
(1,118)
(4,728)
(3,339)
Total operating expenses
(2,860)
(2,518)
(10,380)
(8,895)
Interest income from cash balances
1
7
13
16
Realized loss
on sale of security -
-
-
(33)
Unrealized gain (loss) on
securities 600
$
(1,480)
$
482
$
(1,766)
$
Loss on derivative instruments (includes $426 and $(865) of
unrealized gain (loss) for the three and twelve months 2011 and $(387) and $(1,077) for
the three and nine months 2010, respectively)
(18)
$
645
$
(2,696)
$
(94)
$
Net income
8,669
$
3,966
$
25,882
$
10,999
$
Basic and diluted net income per share of common stock
0.41
$
0.22
$
1.35
$
0.87
$
Basic and diluted weighted average common shares
outstanding 20,561,032
17,670,468
18,840,954
12,679,277
Dividend declared per share of common stock
0.40
$
0.40
$
1.60
$
1.50
$
Year ended December 31,
Three months ended December 31,
Consolidated Statement of Operations |
 COMMERCIAL REAL ESTATE FINANCE, INC. (“ARI”)
15
Reconciliation of Operating Earnings to Net Income
Three
Months Ended
December 31, 2011
Earnings Per Share
(Diluted)
Three
Months Ended
December 31, 2010
Earnings Per Share
(Diluted)
Operating Earnings:
Net income
$8,669
$0.41
$3,966
$0.22
Adjustments:
Unrealized (gain) loss on securities
(600)
(0.03)
1,480
0.09
Unrealized (gain) on derivative instruments
(426)
(0.02)
(1,077)
(0.06)
Non-cash stock-based compensation expense
634
0.03
354
0.02
Total adjustments:
(392)
(0.02)
757
0.05
Operating Earnings
$8,277
$0.39
$4,723
$0.27
Basic and diluted weighted average common shares outstanding
20,561,032
17,670,468 |