Attached files
| file | filename |
|---|---|
| 8-K - FORM 8-K - Xylem Inc. | d307841d8k.htm |
| EX-99.1 - NEWS RELEASE - Xylem Inc. | d307841dex991.htm |
 Q4
2011 Earnings Release February 28, 2012
Exhibit 99.2 |
 Forward
Looking Statements 2
This document contains information that may constitute “forward-looking statements.”
Forward-looking statements by their nature address matters that are, to different degrees,
uncertain. Generally, the words “anticipate,” “estimate,”
“expect,” “project,” “intend,” “plan,” “believe,”
“target” and similar expressions identify forward-looking statements, which
generally are not historical in nature. However, the absence of these words or similar expressions
does not mean that a statement is not forward-looking. These forward-looking
statements include, but are not limited to, statements about the separation of Xylem Inc. (the
“Company”) from ITT Corporation, the terms and the effect of the separation, the nature and
impact of the separation, capitalization of the Company, future strategic plans and other
statements that describe the Company’s business strategy, outlook, objectives, plans,
intentions or goals, and any discussion of future operating or financial performance. All
statements that address operating performance, events or developments that we expect or anticipate will occur in
the future — including statements relating to orders, revenues, operating margins and earnings
per share growth, and statements expressing general views about future operating results —
are forward-looking statements.
Caution should be taken not to place undue reliance on any such forward-looking statements because
they involve risks, uncertainties and other factors that could cause actual results to differ
materially from those expressed or implied in, or reasonably inferred from, such
statements. The Company undertakes no obligation to publicly update or revise any
forward-looking statements, whether as a result of new information, future events or otherwise, except as required
by law. In addition, forward-looking statements are subject to certain risks and uncertainties
that could cause actual results to differ materially from the Company’s historical
experience and our present expectations or projections. These risks and uncertainties include,
but are not limited to, those set forth in our Registration Statement on Form 10, and those
described from time to time in subsequent reports filed with the Securities and Exchange Commission. |
 2011
Performance Summary 3
Strong
Strategic
Execution
…
Positioned
Well
for
2012
Advanced our Strategic Position
•
Solidified Leading Position in Analytical Instrumentation with YSI Acquisition
•
Built Out High Growth Dewatering Platform
•
Introduced New Product and Strategic Partnerships
•
Double-Digit Growth in Emerging Markets
Strong 2011 Financial Performance
•
Solid
Revenue
Growth
+19%
…
Organic
+7%*
•
Expanded Operating Margin +60 bps to 12.7%*
•
Double-Digit
“Normalized”
EPS
Growth
+30%*
•
Strong Free Cash Flow Conversion
Solid Fundamentals …
Positioned Well for 2012
•
Large Installed Base, Diversified Portfolio, and Stable End Markets
•
Focused Strategic Initiatives
Separation Complete …
Selected to the S&P 500
* See Appendix for Non-GAAP Reconciliations |
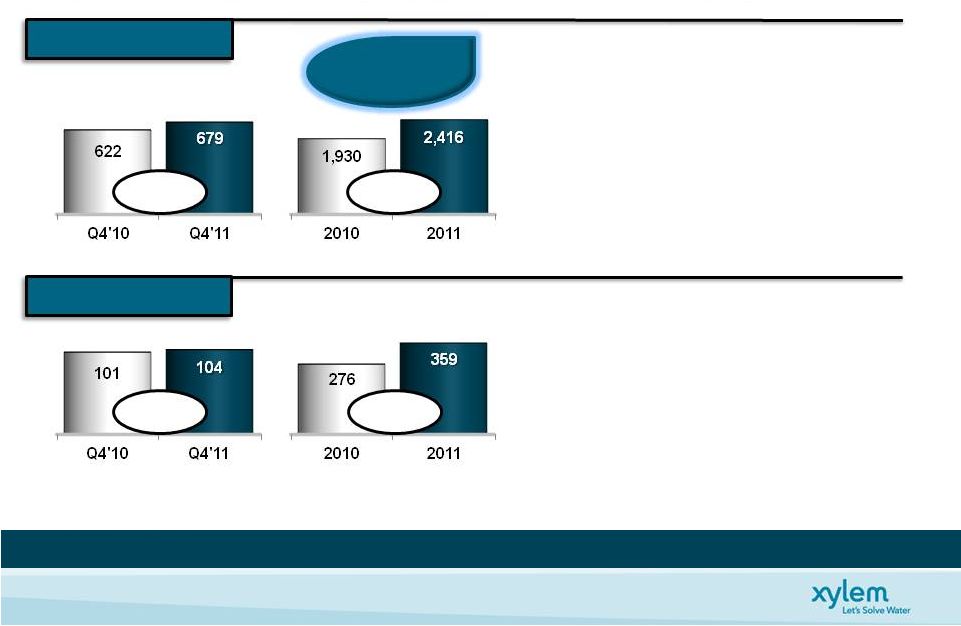
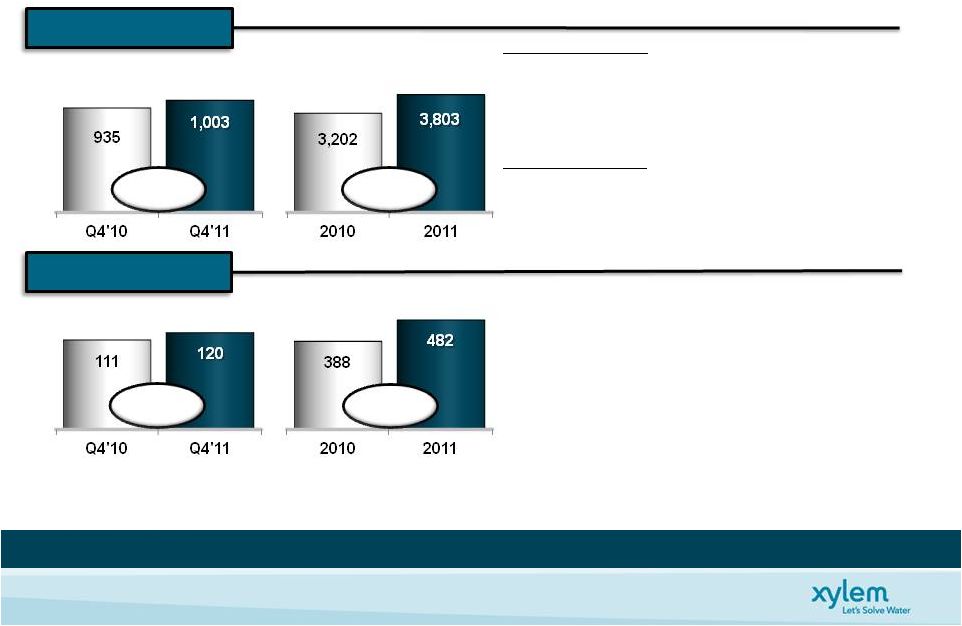 2011
Xylem Performance 4
Broad Based Growth and Margin Expansion
+19%
+7%
+24%
OM%
11.9%
12.0%
12.1%
12.7%
See appendix for non-GAAP reconciliations
* Excludes Q4 & FY 2011 non-recurring separation costs of $20M and $87M,
respectively Q4 Performance
•
Total growth +7%: US/Europe ea. up ~3%, EM up 20+%
•
Organic revenue growth +5%
•
Total orders $905M +8%; organic order growth +6%
FY Performance
•
Total growth +19%: US/EM ea. up 20+%; Europe up ~13%
•
Organic revenue growth +7%
•
Total orders $3,847 +19%; organic order growth +7%
•
Q4 Op Margin +10 bps; FY Op Margin +60 bps
•
Commercial & Operational Excellence drive price
and cost savings
•
Acquisitions accretive; Purchase accounting
headwind (Q4)
•
Significant inflation
•
Impact of stand alone costs ~$5M, -50 bps (Q4)
and -10 bps (FY), included in Op Margin
•
Increased organic investments
(Dollars, In Millions)
(Dollars, In Millions)
+8%
Revenue
Operating Income * |
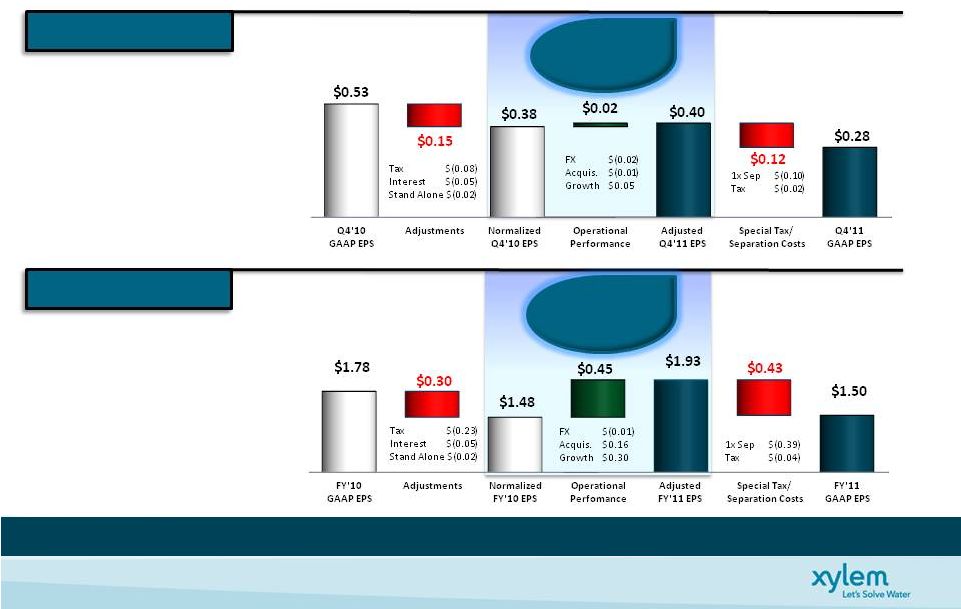 2011
Xylem Performance 5
Delivered Double-Digit Normalized EPS Growth
•
Q4’11 EPS $0.28; $0.40 Adj.
•
1x separation costs
•
Special tax items
•
5% Normalized EPS Growth
•
Strong operational performance
•
Purchase accounting dilution
•
FY’11 EPS $1.50; $1.93 Adj.
•
1x separation costs
•
Special tax items
•
30% Normalized EPS Growth
•
Strong operational performance
•
Organic investments & acquisitions
driving significant growth
* See Appendix for Non-GAAP Reconciliations
5% Normalized
5% Normalized
EPS Growth
EPS Growth
30%
30%
Normalized
Normalized
EPS Growth
EPS Growth
Q4’11 EPS*
2011 EPS* |
 6
Strategic Acquisitions Bolstered Strong Application Portfolio
OM%
16.2%
15.3%
14.3%
14.9%
* Excludes Q4 and FY Non-Recurring Separation Costs of $6M and $16M,
respectively 2011 Water Infrastructure Performance
•
Transport +3% (Q4); +6% (FY)
•
Global dewatering strength
•
Stability from large installed base
•
Treatment +21% (Q4); +13% (FY)
•
Emerging market strength
•
Project timing
•
Test +1% (Q4); +6% (FY)
•
Europe flat; US & emerging market strength
•
Q4 Op Margin 15.3%
•
Price & cost savings exceed inflation
•
Purchase accounting headwind
•
Stand alone costs
•
Unfavorable mix/lower restructuring offset
•
FY Op Margin 14.9%
•
Price & cost savings exceed inflation
•
Unfavorable FX
•
Unfavorable mix/lower restructuring offset
(Organic Revenue Growth by Application)
See Appendix for Non-GAAP Reconciliations
(Dollars, In Millions)
(Dollars, In Millions)
Revenue
Operating Income *
Organic Growth
Organic Growth
Q4 +6% /
Q4 +6% /
FY+7%
FY+7%
+30%
+3%
+9%
+25% |
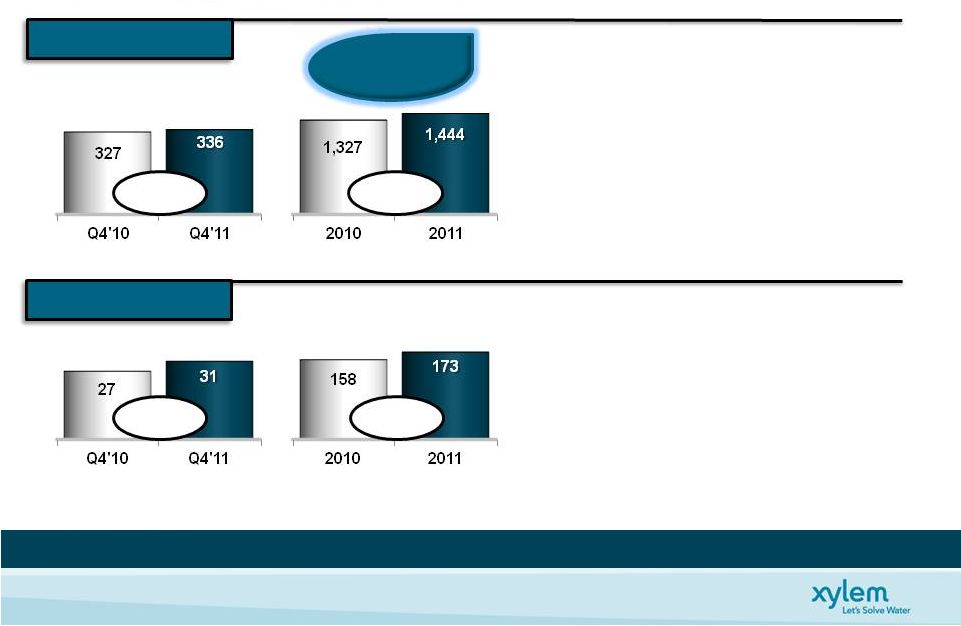 7
Energy Efficient Solutions Fueled Growth
OM%
8.3%
9.2%
11.9%
12.0%
* Excludes Q4 and FY Non-Recurring Separation Costs of $4M and $13M,
respectively 2011 Applied Water Performance
(Organic Revenue Growth by Application)
•
Building Services +2% (Q4); +6% (FY)
•
New energy efficient solutions
•
Q4: Destocking
•
Industrial Water +5% (Q4); +7% (FY)
•
Improved market conditions
•
Favorable across all regions
•
Irrigation +9% (Q4); +12% (FY)
•
Favorable weather conditions in US
•
Q4 Op Margin 9.2%
•
Price & cost savings exceeded inflation
•
Continued organic investments
•
Stand alone costs
•
Non-restructuring severance costs
•
FY Op Margin 12.0%
•
Price & cost savings exceeded inflation
•
Continued organic investments
See Appendix for Non-GAAP Reconciliations
(Dollars, In Millions)
(Dollars, In Millions)
Organic Growth
Organic Growth
Q4 +3% /
Q4 +3% /
FY+7%
FY+7%
+9%
+3%
+15%
+9%
Operating Income *
Operating Income *
Revenue
Revenue |
 2011
Xylem Financial Position 8
Strong Cash Flow …
Healthy Balance Sheet ... Providing Flexibility
•
Free Cash Flow Growth
•
Favorable acquisition performance
•
Working Capital improvement of 20 bps as
a % Sales
•
Continued investment $126M
Capex > 1 reinvestment ratio
•
Strong cash position
•
Debt/Adj EBITDA ratio of 1.9x
•
33% Net Debt to Net Capital
•
$600M Revolving Credit Facility Available
•
Access to Commercial Paper
FCF%
91%
111%
W/C%**
22.3%
22.1%
December 31, 2011
Cash
318
Debt
1,206
Net Debt
888
Shareholders’
Equity
1,827
Net Capital
2,715
Net Debt to Net Capital
33%
* See Appendix for Non-GAAP Reconciliations
(Dollars, In Millions)
(Dollars, In Millions)
(Dollars, In Millions)
* See Appendix for Non-GAAP Reconciliations
** (AR+INV-AP / Revenue (Adjusted for Acquisitions)
Free Cash Flow *
Free Cash Flow *
Working Capital **
Working Capital **
Capital Summary/Liquidity
Capital Summary/Liquidity
2010
2011
770
856
2010
2011
301
388 |
 2012 Guidance |
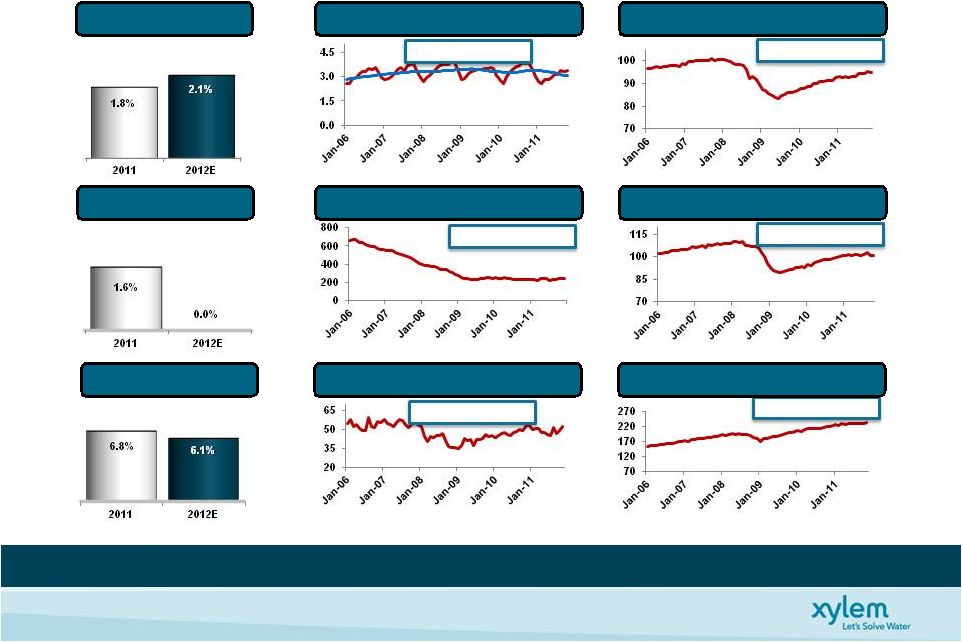 Key
Macro Economic Indicators 10
Navigating Through Tougher Macro Economic Conditions
Emerging GDP
Emerging GDP
Europe GDP
Europe GDP
US GDP
US GDP
Source: MAPI, U.S. Census Bureau , ITR, Company Estimates
Public Water & Sewer: Billions of dollars
US Private Residential Construction Spending: Seasonally Adjusted Annual Rate in
Billions of Dollars Industrial Production Index: 2007 = 100. S.A.
JP Morgan Developing Country Composite Index
US Public Water & Sewer Facility Construction
US Public Water & Sewer Facility Construction
US Private Residential Construction Spending
US Private Residential Construction Spending
Architectural Billing Index (ABI)
Architectural Billing Index (ABI)
US Total Industrial Production
US Total Industrial Production
Europe Union Industrial Production Index
Europe Union Industrial Production Index
12 Month Moving Average
Developing Country Composite Index
Developing Country Composite Index
Stable
Improving
Flat
Softening
Improving
Moderating |
 •
Global dewatering applications
•
Emerging market strength
•
2H OEM activity
Down Low
Single Digit
to Flat
End Markets
11
Xylem Well Positioned
Up Low to
Mid Single
Digit
Up Low to
Mid Single
Digit
Up Low
Single
Digit
Projected ‘12
XYL Growth
•
Increasing operation & maintenance spend
•
Rising global tariffs
•
Weakness in developed market Capex
•
Emerging market strength
•
Green building legislation 2H benefits
•
New products drive share gains
•
Installed base provides stability
•
US Construction slightly improving
•
European new construction weakness
•
Tough compare vs. strong 2011
•
Favorable long-term market
expectation
(~ 40% of ’11 Revenue)
(~ 36% of ’11 Revenue)
(~ 12% of ’11 Revenue)
(~ 9% of ’11 Revenue)
(~ 3% of ’11 Revenue)
Industrial
Public Utility
Commercial
Residential
Agriculture
Up Mid
Single
Digit |
 2012
Key Focus Areas 12
Creating Customer Value and Building Credibility
Advancing our Strategic Position
Deploying Innovation and New Product Applications & Services
Continued Strong Execution
•
Build out of high growth dewatering platform globally
•
Leverage leading position in analytical instrumentation
•
Build upon our presence in fast-growing emerging markets
•
Continue to advance our disciplined acquisition pipeline
•
Energy efficient technology and new product launches
•
Leverage our applications expertise to solve high-order water infrastructure
challenges •
Focus on Commercial Excellence: price realization through differentiated customer
value •
Strong productivity (Lean, LCR sourcing) while enabling reinvestment for
long-term growth •
Disciplined execution through proven management operating system
|
 Capital Deployment Strategy Update
13
Clear Strategy …
Strong Balance Sheet
Organic Investments
Robust Acquisition Pipeline
Dividend Policy
•
Funding through strong cash performance
•
Strong balance sheet provides flexibility
•
Target within peer range
•
Confidence in cash flow generation
•
Capex of ~$130M, >1 reinvestment ratio
•
R&D, ~3% of revenue
•
Core product development
•
Global dewatering and analytical instrumentation expansion
•
Emerging market expansion |
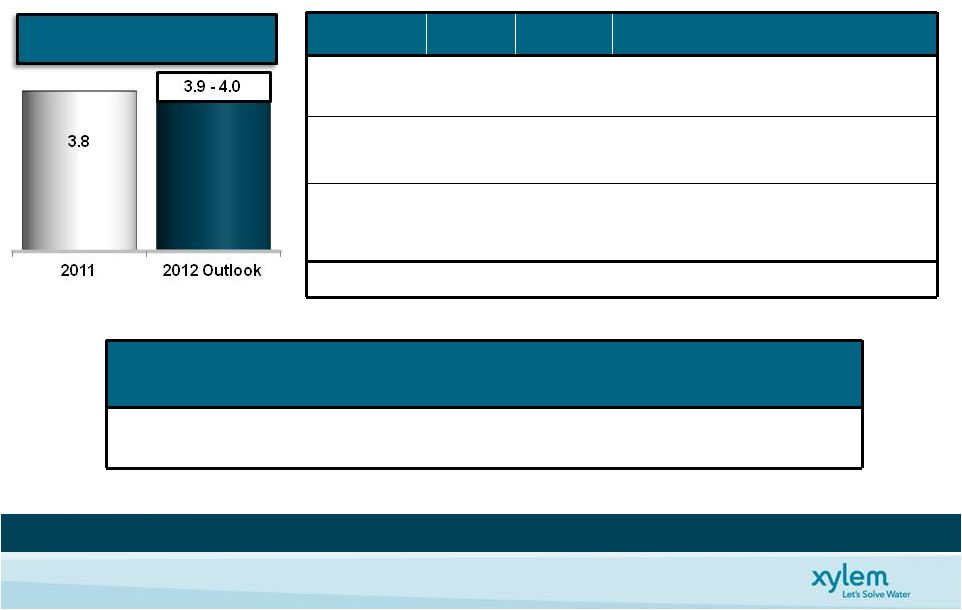
 2012
Financial Guidance Summary 14
2012
Financial Outlook
Growth
2012E vs. 2011
Total Revenue
$3.9B -
$4.0B
4% -
6% (Organic)
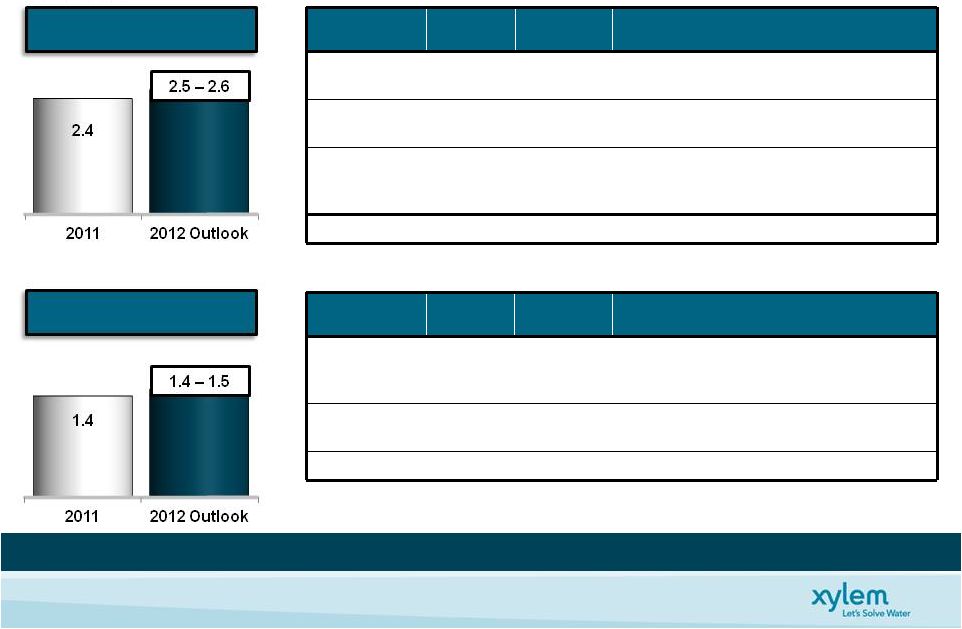
Water Infrastructure
$2.5B -
$2.6B
5% -
7% (Organic)
Applied Water
$1.4B -
$1.5B
2% -
6% (Organic)
Segment Margin*
14.5% -
15.0%
+50 to +100 bps
Operating Margin*
12.7% -
13.3%
Flat to +60 bps (incl. incremental
stand alone costs $25M-$30M)
EPS *
$1.80 -
$1.95
-7% to +1% on Adjusted Basis
+8% to +17% on Normalized Basis
Free Cash Flow Conversion
95%
Excluding
one-time
separation
costs
* See Appendix for Non-GAAP Reconciliations |
 2012
Revenue Outlook 15
Strong Underlying Growth …
FX Shift from Tailwind to Headwind
(Dollars, In Billions)
2011
2012
Comments
Organic
Growth
7%
4-6%
-
1H’12 tough compare vs. strong 1H’11
-
2H’12 stronger than 1H
FX
(Translation)
4%
(3)%
~65% international revenues
Top foreign currencies:
Euro, CAD, AUD, GBP, SEK
Acquisition
8%
2%
2012 represents YSI
2011 represents incremental Godwin,
Nova, OI Analytics and YSI
Total Growth
19%
3-5%
Quarterly
Revenue Profile
(% of FY Revenue)
Q1
Q2
Q3
Q4
2009-2011
Composite
22%
25%
25%
28%
Xylem
Xylem |
 2012
Revenue Outlook 16
Revenue Growth Driven by End Market Conditions & Xylem Initiatives
(Dollars, In Billions)
2011
2012
Comments
Organic
Growth
7%
5-7%
Public Utility up low to mid single digit
Industrial up mid single digit
FX
(Translation)
4%
(3)%
Top foreign currencies:
Euro, CAD, AUD, GBP, SEK
Acquisition
14%
3%
2012 represents YSI
2011 represents incremental Godwin,
Nova, OI Analytics and YSI
Total Growth
25%
5-7%
2011
2012
Comments
Organic
Growth
7%
2-6%
Commercial up low to mid single digit
Residential up low single digit
Industrial up mid single digit
FX
(Translation)
2%
(2)%
Top foreign currencies:
Euro, CAD, AUD, GBP
Total Growth
9%
0-4%
Water Infrastructure
Water Infrastructure
Applied Water
Applied Water |
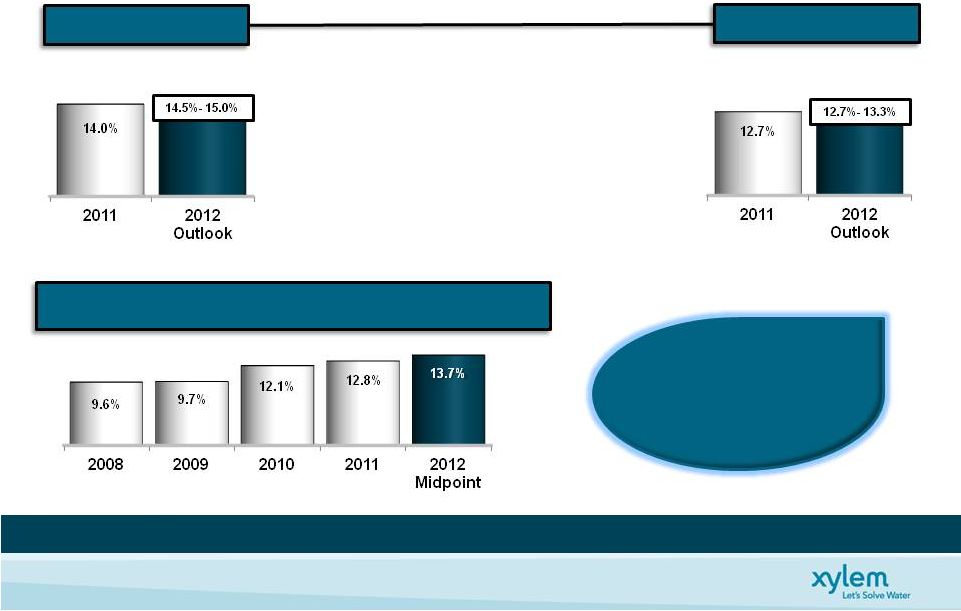 2012
Margin Outlook 17
Solid Margin Performance …
On Track to Meet Long Term Objective
Includes Stand Alone
Costs of ~70 bps
Includes Stand Alone
Costs of ~10 bps
•
Segment
Op
Margin
14.5%
-
15.0%
•
Comm’l & Oper’l Excellence Initiatives
•
Acquisition margin accretive
•
Organic growth investments
•
Inflation ~3%
•
Operating
Margin
12.7%
-
13.3%
•
Includes stand alone costs ~$25M-$30M
See appendix for non-GAAP reconciliations
*Excludes non-recurring separation costs of $87M and $15M-$20M for 2011 and
2012, respectively ** Adjusted for non recurring separation costs and stand
alone costs Driving Consistent
Improvements …
On
Track to Meet Long
Term Objective
Op Margin Expansion (Ex. Stand Alone Costs) **
Op Margin Expansion (Ex. Stand Alone Costs) **
Segment Margin *
Segment Margin *
Operating Margin *
Operating Margin * |
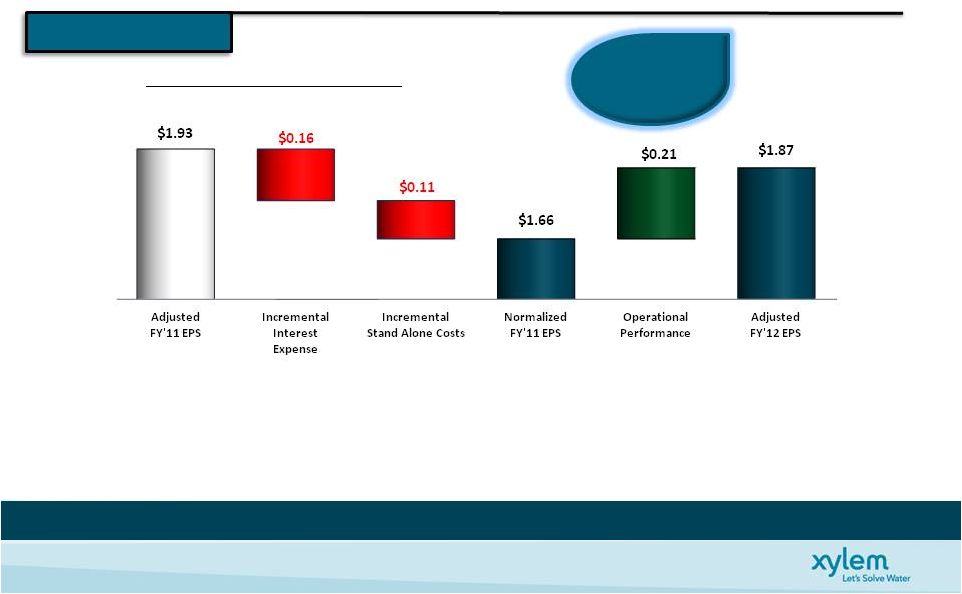 2012
Xylem Performance 18
Delivering Double-Digit EPS Growth
Illustration of Mid Point Guidance
•
Operational performance $0.21, includes YSI contribution, FX and
tax headwind
•
Projected structural tax rate ~25%
•
Nine months incremental interest expense normalization
•
Full year impact of stand alone costs …
in line with expectations
* See Appendix for Non-GAAP Reconciliations
Includes
unfavorable tax
rate change of 1%
13%
13%
Normalized
Normalized
EPS Growth
EPS Growth
2012 EPS * Outlook
2012 EPS * Outlook |
 Summary
19
2011 …
A Year in the Making
•
A Leader in the Global Water Industry
•
Executed Significant Strategic Advancement
•
Delivered Strong Financial Performance
•
Xylem, new independent company
Positioned to Deliver in 2012
•
Solid Foundation and Fundamentals
•
Strong Financial Position
•
Strong Growth Opportunities |
 Appendix |
 Separation Costs
21
($M)
Q1’11
Q2’11
Q3’11
Q4’11
FY’11
IT Costs
$ -
$ 7
$ 10
$ 2
$
19 Advisory fees
2
6
9
1
18
Employee retention & hiring costs
1
4
4
5
14
Rebranding & marketing costs
-
-
3
10
13
Lease termination & other real estate
costs
-
-
10
-
10
Non-cash asset impairments
-
-
8
-
8
Other
-
1
2
2
5
Total separation costs in Op Income
3
18
46
20
87
Tax-related separation (benefit) costs
-
14
(9)
1
6
Income tax benefit
(1)
(5)
(12)
(3)
(21)
Total separation costs, net of tax
$ 2
$ 27
$ 25
$ 18
$ 72
|
 Quarterly Financial Performance
22
($M, Except
EPS)
Q1’10
Q2’10
Q3’10
Q4’10
FY’10
Q1’11
Q2’11
Q3’11
Q4’11
FY’11
Revenue
686
775
806
935
3,202
890
971
939
1,003
3,803
COGS
431
484
497
576
1,988
553
592
574
623
2,342
Gross Profit
255
291
309
359
1,214
337
379
365
380
1,461
SG&A
164
170
183
220
737
210
219
215
233
877
R&D
18
17
18
21
74
24
26
23
27
100
Separation Costs
-
-
-
-
-
3
18
46
20
87
Restructuring &
Asset Impairment
Charges, net
4
3
1
7
15
-
-
2
-
2
Op Income
69
101
107
111
388
100
116
79
100
395
Interest Expense
-
-
-
-
-
-
1
1
15
17
Other Non-Op
-2
-1
3
-
-
1
-
4
-
5
Income before Tax
67
100
110
111
388
101
115
82
85
383
Tax
11
15
19
14
59
23
43
5
33
104
Net Income
56
85
91
97
329
78
72
77
52
279
EPS –
Diluted *
$0.30
$0.46
$0.49
$0.53
$1.78
$0.42
$0.39
$0.42
$0.28
$1.50
* On October 31, 2011, Xylem Inc. completed the spin-off through a
tax-free stock dividend to ITT Corporation’s shareholders. ITT
Corporation shareholders received one share of our common stock for each share of
ITT common stock. As a result on October 31, 2011, we
had
184.6
million
shares
of
common
stock
outstanding
and
this
share
amount
is
being
utilized
to
calculate
earnings
per
share
for
all
periods presented prior to the spin-off. |
 Non-GAAP Measures
23
Management views key performance indicators including revenue, segment operating
income and margins, orders growth, and backlog, among others. In
addition, we consider certain measures to be useful to management and investors evaluating our
operating performance for the periods presented, and provide a tool for evaluating
our ongoing operations, liquidity and management of assets. This
information can assist investors in assessing our financial performance and measures our ability to
generate capital for deployment among competing strategic alternatives and
initiatives. These metrics, however, are not measures of financial
performance under GAAP and should not be considered a substitute for revenues, operating income, net
income or net cash from continuing operations as determined in accordance with
GAAP. We consider the following non-GAAP measures, which may not be
comparable to similarly titled measures reported by other companies, to be key performance
indicators:
“Organic revenue”
and “Organic Orders”
defined as revenue or orders, as applicable, excluding the impact of foreign
currency fluctuations, intercompany transactions, and contributions from
acquisitions and divestitures. Divestitures include sales of portions
of our business that did not meet the criteria for classification as a discontinued operation or insignificant portions of our
business that we did not classify as a discontinued operation. The
period-over-period change resulting from foreign currency
fluctuations assumes no change in exchange rates from the prior period.
“EBITDA”
defined as earnings before interest, taxes, depreciation, amortization expense,
and share-based compensation. “Adjusted EBITDA”
reflects the adjustment to EBITDA to exclude for one-time separation costs
associated with the Xylem spin- off from ITT Corporation.
“Operating Income * ”
and “Adjusted EPS”
defined as operating income and earnings per share, adjusted to exclude
one-time separation costs associated with the Xylem spin-off from
ITT Corporation and tax-related special items. “Normalized
EPS” defined as earnings per share, adjusted to exclude one-time
separation costs associated with the Xylem spin- off from ITT Corporation
and tax-related special items, as well to reflect the incremental current period amount of interest expense
and stand alone costs in the prior comparable period.
“Free Cash Flow”
defined as net cash from operating activities, as reported in the Statement of
Cash Flow, less capital expenditures and other significant items that impact
current results which management believes are not related to our ongoing
operations and performance. Our definition of free cash flows does not
consider non-discretionary cash payments, such as debt. |
  Non-GAAP Reconciliation: Organic Orders
24
(A)
(B)
(C)
(D)
(E)
(F) = B+C+D+E
(G) = F/A
Change
% Change
Change
% Change
Orders
Orders
2011 v. 2010
2011 v. 2010
FX Contribution
Eliminations
Adj. 2011 v. 2010
Adj. 2011 v. 2010
2011
2010
Year Ended December 31, 2011
Xylem Inc.
3,847
3,237
610
18.8%
(272)
(120)
-
218
6.7%
Water infrastructure
2,454
1,941
513
26.4%
(272)
(96)
1
146
7.5%
Applied Water
1,452
1,352
100
7.4%
-
(27)
(1)
72
5.3%
Quarter Ended December 31, 2011
Xylem Inc.
905
836
69
8.3%
(24)
5
-
50
6.0%
Water infrastructure
589
514
75
14.6%
(24)
4
(5)
50
9.7%
Applied Water
330
331
(1)
-0.3%
-
1
(1)
(1)
-0.3%
Quarter Ended September 30, 2011
Xylem Inc.
966
810
156
19.3%
(41)
(42)
-
73
9.0%
Water infrastructure
621
504
117
23.2%
(41)
(33)
5
48
9.5%
Applied Water
358
322
36
11.2%
-
(10)
-
26
8.1%
Quarter Ended June 30, 2011
Xylem Inc.
998
822
176
21.4%
(91)
(70)
-
15
1.8%
Water infrastructure
632
498
134
26.9%
(91)
(55)
2
(10)
-2.0%
Applied Water
383
341
42
12.3%
-
(17)
1
26
7.6%
Quarter Ended March 31, 2011
Xylem Inc.
978
769
209
27.2%
(116)
(13)
-
80
10.4%
Water infrastructure
612
425
187
44.0%
(116)
(12)
(1)
58
13.6%
Applied Water
381
358
23
6.4%
-
(1)
(1)
21
5.9%
Acquisitions /
Divestitures
Xylem Inc. Non-GAAP Reconciliation
Reported vs. Organic Order Growth
($ Millions)
(As Reported - GAAP)
(As Adjusted - Organic) |
  Non-GAAP Reconciliation: Organic Revenue
25
(A)
(B)
(C)
(D)
(E)
(F) = B+C+D+E
(G) = F/A
Change
% Change
Change
% Change
Revenue
Revenue
2011 v. 2010
2011 v. 2010
FX Contribution
Eliminations
Adj. 2011 v. 2010
Adj. 2011 v. 2010
2011
2010
Year Ended December 31, 2011
Xylem Inc.
3,803
3,202
601
18.8%
(264)
(111)
-
226
7.1%
Water infrastructure
2,416
1,930
486
25.2%
(264)
(87)
2
137
7.1%
Applied Water
1,444
1,327
117
8.8%
-
(28)
(1)
88
6.6%
Quarter Ended December 31, 2011
Xylem Inc.
1,003
935
68
7.3%
(27)
6
-
47
5.0%
Water Infrastructure
679
622
57
9.2%
(27)
5
1
36
5.8%
Applied Water
336
327
9
2.8%
-
1
(1)
9
2.8%
Quarter Ended September 30, 2011
Xylem Inc.
939
806
133
16.5%
(42)
(39)
-
52
6.5%
Water infrastructure
584
488
96
19.7%
(42)
(30)
1
25
5.1%
Applied Water
368
331
37
11.2%
-
(10)
1
28
8.5%
Quarter Ended June 30, 2011
Xylem Inc.
971
775
196
25.3%
(85)
(65)
-
46
5.9%
Water infrastructure
602
443
159
35.9%
(85)
(50)
1
25
5.6%
Applied Water
385
346
39
11.3%
-
(18)
-
21
6.1%
Quarter Ended March 31, 2011
Xylem Inc.
890
686
204
29.7%
(110)
(13)
-
81
11.8%
Water infrastructure
551
377
174
46.2%
(110)
(12)
(1)
51
13.5%
Applied Water
355
323
32
9.9%
-
(1)
(1)
30
9.3%
Acquisitions /
Divestitures
Xylem Inc. Non-GAAP Reconciliation
Reported vs. Organic Revenue
($ Millions)
(As Reported - GAAP)
(As Adjusted - Organic) |
 Q4 '10
Q4 '11
As Reported
Adjustments
Normalized
As Reported
Adjustments
Adjusted
Total Revenue
935
935
1,003
1,003
Operating Income
111
(5)
a
106
100
20
g
120
Operating Margin
11.9%
b
11.4%
9.9%
11.9%
Interest Income (Expense)
-
(14)
(14)
(13)
(13)
Other Income (Expense)
-
-
(1)
(1)
Income before Taxes
111
(19)
92
85
20
105
Provision for Income Taxes
(14)
(9)
f
(23)
(33)
2
h
(31)
Net Income
97
(28)
69
52
22
74
Diluted Shares
184.6
184.6
185.3
185.3
Diluted EPS
0.53
$
(0.15)
$
0.38
$
0.28
$
0.12
$
0.40
$
FY '10
FY '11
As Reported
Adjustments
Normalized
As Reported
Adjustments
Adjusted
3,202
3,202
3,803
3,803
Operating Income
388
(5)
a
383
395
87
d
482
12.1%
b
11.9%
10.4%
12.7%
Interest Income (Expense)
-
(14)
(14)
(17)
(17)
Other Income (Expense)
-
-
5
5
Income before Taxes
388
(19)
369
383
87
470
Provision for Income Taxes
(59)
(37)
c
(96)
(104)
(7)
e
(111)
Net Income
329
(56)
273
279
80
359
Diluted Shares
184.6
184.6
185.3
185.3
Diluted EPS
1.78
$
(0.30)
$
1.48
$
1.50
$
0.43
$
1.93
$
a
Equals incremental stand alone costs incurred in 2011 of $5M
b
Represents incremental interest expense on long-term debt that was incurred in 2011
c
Represents net tax impact of above items, less 2010 special tax items of $43M
d
Represents one-time separation costs incurred in 2011
e
Represents the tax benefit on one time separation costs of $15M, less special tax items of
$7M f
Represents net tax impact on stand alone and interest expenses, less Q4 2010 special tax items
of $15M g
One time separation costs incurred in Q4 2010
h
Represents net tax impact of one time separation costs
($ Millions, except per share amounts)
Xylem Inc. Non-GAAP Reconciliation
Normalized and Adjusted Operating Income and Earnings Per Share (EPS)
Non-GAAP Reconciliation: EPS
26 |
  Non-GAAP Reconciliation: EPS
27
Q1 2011
Q2 2011
Q3 2011
Q4 2011
FY 2011
Net Income
78
72
77
52
279
Separation costs, net of tax
2
27
25
18
72
Adjusted Net Income before Special Tax Items
80
99
102
70
351
Special Tax Items
4
(1)
4
7
Adjusted Net Income
80
103
101
74
358
Diluted Earnings per Share
$0.42
$0.39
$0.42
$0.28
$1.50
Separation costs per Share
$0.01
$0.15
$0.13
$0.10
$0.39
Adjusted diluted EPS before Special Tax Items
$0.43
$0.54
$0.55
$0.38
$1.89
Special Tax Items per Share
$0.00
$0.02
($0.01)
$0.02
$0.04
Adjusted diluted EPS
$0.43
$0.56
$0.54
$0.40
$1.93
Q1 2010
Q2 2010
Q3 2010
Q4 2010
FY 2010
Net Income
56
85
91
97
329
Separation costs, net of tax
-
-
-
-
-
Adjusted Net Income before Special Tax Items
56
85
91
97
329
Special Tax Items
(6)
(11)
(11)
(15)
(43)
Adjusted Net Income
50
74
80
82
286
Diluted Earnings per Share
$0.30
$0.46
$0.49
$0.53
$1.78
Adjusted diluted EPS before Special Tax Items
$0.30
$0.46
$0.49
$0.53
$1.78
Special Tax Items per Share
($0.03)
($0.06)
($0.05)
($0.09)
($0.23)
Adjusted diluted EPS
$0.27
$0.40
$0.44
$0.44
$1.55
Xylem Inc. Non-GAAP Reconciliation
Adjusted Diluted EPS
2011 and 2010
($ Millions, except per share amounts) |
 28
Non-GAAP Reconciliation: Segment Operating Income
Adjusted Segment Operating Income
Q1
Q2
Q3
Q4
FY
'11
'10
'11
'10
'11
'10
'11
'10
'11
'10
Total Revenue
• Water Infrastructure
551
377
602
443
584
488
679
622
2,416
1,930
• Applied Water
355
323
385
346
368
331
336
327
1,444
1,327
Operating Income
• Water Infrastructure
64
45
94
57
87
73
98
101
343
276
• Applied Water
46
40
50
51
37
40
27
27
160
158
Separation Costs
• Water Infrastructue
-
-
2
-
8
-
6
-
16
-
• Applied Water
-
-
-
-
9
-
4
-
13
-
Adjusted Operating Income
• Water Infrastructue
64
45
96
57
95
73
104
101
359
276
• Applied Water
46
40
50
51
46
40
31
27
173
158
Operating Margin
• Water Infrastructure
11.6%
11.9%
15.6%
12.9%
14.9%
14.9%
14.4%
16.2%
14.2%
14.3%
• Applied Water
13.0%
12.4%
13.0%
14.7%
10.0%
12.0%
8.0%
8.3%
11.1%
11.9%
Adjusted Operating Margin*
• Water Infrastructure
11.6%
11.9%
15.9%
12.9%
16.3%
14.9%
15.3%
16.2%
14.9%
14.3%
• Applied Water
13.0%
12.4%
13.0%
14.7%
12.5%
12.0%
9.2%
8.3%
12.0%
11.9%
*Adjusted Operating Income excludes non-recurring separation costs
(Dollars, In Millions) |
  29
Non-GAAP Reconciliation: Adj. Operating Margin Rollforward
Xylem
Water Infrastructure
Applied Water
Q4'10 Margin
11.9%
16.2%
8.3%
Price
1.6%
0.5%
3.7%
Vol/Mix/Other
-0.9%
-1.2%
-1.6%
Stand Alone Costs
-0.5%
-0.3%
0.0%
Cost Improvements
3.5%
3.1%
3.6%
Acquisitions
-0.5%
-0.9%
0.0%
Inflation
-2.8%
-1.9%
-4.5%
FX
-0.3%
-0.2%
-0.3%
Q4'11 Margin
12.0%
15.3%
9.2%
Xylem
Water Infrastructure
Applied Water
FY'10 Margin
12.1%
14.3%
11.9%
Price
1.3%
0.4%
2.7%
Vol/Mix/Other
-0.1%
0.3%
-1.0%
Stand Alone Costs
-0.1%
-0.1%
0.0%
Cost Improvements
3.1%
3.1%
3.1%
Acquisitions
0.2%
0.0%
0.0%
Inflation
-3.3%
-2.3%
-4.6%
FX
-0.5%
-0.8%
-0.1%
FY'11 Margin
12.7%
14.9%
12.0%
Adjusted Operating Margin Rollforward
Xylem Inc. Non-GAAP Reconciliation
Operating Margin Rollforward |
  Non-GAAP Reconciliation: Free Cash Flow
30
2011
2010
Net Cash - Operating Activities
449
395
Capital Expenditures
(126)
(94)
Free Cash Flow, including separation costs
323
301
Separation Costs (Cash Paid incl. Capex)
65
-
Free Cash Flow, excluding separation costs
388
301
Net Income
279
329
Separation Costs
72
0
Adjusted Net Income
351
329
Free Cash Flow Conversion
111%
91%
Xylem Inc. Non-GAAP Reconciliation
Net Cash - Operating Activities vs. Free Cash Flow
Years ended 2011 & 2010
($ Millions)
Year Ended |
  31
Non-GAAP Reconciliation: Xylem EBITDA & Adj. EBITDA
Q1
Q2
Q3
Q4
Total
Pre-Tax Net Income
101
115
82
85
383
Interest, net
-
-
1
16
17
Depreciation
22
25
25
21
93
Amortization
11
10
11
12
44
Stock
Compensation 3
2
2
6
13
EBITDA
137
152
121
140
550
Separation Costs
3
18
46
20
87
Adjusted
EBITDA 140
170
167
160
637
Revenues
890
971
939
1,003
3,803
Adjusted EBITDA Margin
15.7%
17.5%
17.8%
16.0%
16.7%
Xylem Inc. Non-GAAP Reconciliation
Adjusted EBITDA by Quarter
($ Millions)
2011 |
 32
Non-GAAP Reconciliation: Water Infrastructure EBITDA & Adj. EBITDA
Q1
Q2
Q3
Q4
Total
Pre-Tax Net Income
65
93
88
99
345
Interest, net
(1)
-
(1)
Depreciation
16
19
19
14
68
Amortization
9
9
9
9
36
Stock Compensation
-
-
1
1
2
EBITDA
90
121
116
123
450
Separation Costs
-
2
8
6
16
Adjusted EBITDA
90
123
124
129
466
Revenues
551
602
584
679
2,416
Adjusted EBITDA Margin
16.3%
20.4%
21.2%
19.0%
19.3%
Xylem Inc. Non-GAAP Reconciliation
Adjusted EBITDA by Quarter
($ Millions)
2011
Water Infrastructure |
 33
Non-GAAP Reconciliation: Applied Water EBITDA & Adj. EBITDA
Q1
Q2
Q3
Q4
Total
Pre-Tax Net Income
46
51
37
25
159
Interest, net
-
-
-
-
-
Depreciation
6
6
6
7
25
Amortization
2
1
2
1
6
Stock Compensation
-
-
1
1
2
EBITDA
54
58
46
34
192
Separation Costs
-
-
9
4
13
Adjusted EBITDA
54
58
55
38
205
Revenues
355
385
368
336
1,444
Adjusted EBITDA Margin
15.2%
15.1%
14.9%
11.3%
14.2%
Xylem Inc. Non-GAAP Reconciliation
Adjusted EBITDA by Quarter
($ Millions)
2011
Applied Water |
 Illustration
of Mid Point Guidance 2012 Guidance
FY '11
FY '12
As Reported
Adjustments
Adjusted
Adjustments
Normalized
As Reported
Adjustments
Adjusted
Total Revenue
3,803
3,803
3,803
3,950
3,950
Segment Operating Income
503
29
a
532
(8)
d
524
577
8
h
585
Segment Operating Margin
13.2%
14.0%
13.8%
14.6%
14.8%
Corporate Expense
108
(58)
b
50
20
e
70
81
(10)
h
71
Operating Income
395
87
482
(28)
454
496
18
514
Operating Margin
10.4%
12.7%
11.9%
12.6%
13.0%
Interest Expense
(17)
(17)
(39)
f
(56)
(51)
(51)
Other Non-Operating Income (Expense)
5
5
5
-
-
Income before Taxes
383
87
470
(67)
403
445
18
463
Provision for Income Taxes
(104)
(7)
c
(111)
16
g
(95)
(111)
(5)
i
(116)
Net Income
279
80
359
(51)
308
334
13
347
Diluted Shares
185.3
185.3
185.8
185.8
Diluted EPS
1.50
$
0.43
$
1.93
$
(0.27)
$
1.66
1.80
0.07
1.87
a
One time separation costs incurred at the segment level
b
One time separation costs incurred at the corporate level
c
Net tax impact of above items, plus the addition of 2011 special tax items
d
Incremental stand alone costs to be incurred in 2012 at the segment level ($8M)
e
Incremental stand alone costs to be incurred in 2012 at the corporate level ($20M)
f
Incremental interest expense on long-term debt to be incurred in 2012
g
Tax impact of incremental interest expense and stand alone costs to be incurred in 2012
h
Expected one time separation costs of $8M and $10M to be incurred at the segments and
headquarters, respectively. i
Tax impact of one time separation costs expected to be incurred in 2012.
($ Millions, except per share amounts)
Guidance
Xylem Inc. Non-GAAP Reconciliation
Non-GAAP Reconciliation: Guidance
34 |
 35
NYSE: XYL
http://investors.xyleminc.com
Phil De Sousa, Investor Relations Officer
(914) 323-5930
Janice Tedesco, Investor Relations Coordinator
(914) 323-5931 |