Attached files
| file | filename |
|---|---|
| 8-K - FORM 8-K - WESTAR ENERGY INC /KS | d307786d8k.htm |
 UBS Electric Power Conference
February 29, 2012
Dallas, TX
2012 UBS Electric Power Conference
Exhibit 99.1 |
 2
Forward Looking Disclosures
2012 UBS Electric Power Conference
Forward-looking statements: Certain matters discussed in this presentation are
“forward- looking statements.” The Private Securities Litigation Reform Act of
1995 has established that these statements qualify for safe harbors from liability.
Forward-looking statements may include words like “believe,”
“anticipate,” “target,” “expect,” “pro forma,” “estimate,”
“intend,” “guidance” or words of similar meaning. Forward-looking statements
describe future plans, objectives, expectations or goals. Although we believe expectations are
based on reasonable assumptions, all forward-looking statements involve risk and
uncertainty. The factors that could cause actual results to differ materially from these
forward-looking statements include those discussed herein as well as (1) those discussed in
the company’s Annual Report on Form 10-K for the year ended Dec. 31, 2011 (a) under
the heading, “Forward-Looking Statements,” (b) in ITEM 1. Business, (c) in ITEM
1A. Risk Factors, (d) in ITEM 7. Management’s Discussion and Analysis of Financial
Condition and Results of Operations, and (e) in ITEM 8. Financial Statements and Supplementary
Data: Notes 13 and 15; and (2) other factors discussed in the company’s filings with the
Securities and Exchange Commission. Any forward-looking statement speaks only as of the
date such statement was made, and the company does not undertake any obligation to update any
forward-looking statement to reflect events or circumstances after the date on which such
statement was made.
|
 3
•
Rate request settlement filed ($50 million rate increase)
•
Priced $250 million First Mortgage Bond
•
2011 results $1.95 per share; ongoing earnings $1.81 per share
•
Dividend increased to $0.33 per share, 3% increase
•
2012 EPS guidance range $1.85 -
$2.00 per share
•
2012 –
2014 CapEx plan
•
Environmental rules
Recent Events
2012 UBS Electric Power Conference |
 4
•
Provisions of Settlement filed in February include:
–
Annual retail revenue increase $50 million, effective May
–
$11 million annual increase in tree trimming expense
–
$33 million annual increase in pension expenses
–
$40 million annual lower depreciation expense
–
Use 10% ROE for regulatory accounting purposes
•
Hearings complete
•
Next step --
filing briefs
•
Order due in proceeding by April 23
2011 General Rate Request
2012 UBS Electric Power Conference |
 5
•
Priced $250 million FMB
•
Coupon 4.125%
•
30 year maturity, due March 2042
•
Use of Proceeds
–
provide long-term funding of investment in infrastructure
•
Planned closing March 1, 2012
First Mortgage Bond Offer
2012 UBS Electric Power Conference |
 6
•
EPS from continuing operations of $1.81 vs. $1.81 for 2010
•
Retail MWh sales increased 1%
–
Warmer than normal weather, modestly above 2010
–
Continued
signs
of
industrial
growth
–
2%
over
2010
•
Implemented all planned price adjustments (annualized amts):
–
Transmission adjustments -
$17 million
–
Environmental adjustment -
$10 million
–
Energy efficiency adjustment -
$5 million
•
No COLI proceeds in 2011
•
($0.10) per share impact from additional shares to fund
infrastructure investment
2011 Ongoing EPS Results Unchanged From 2010
2012 UBS Electric Power Conference |
 7
•
KCC approval of Stipulation & Agreement (S&A) in rate review
–
Annual retail revenue increase $50 million, effective May
•
Planned price adjustments via tracking mechanisms
•
Expect weather-adjusted retail sales to grow
1%
•
Combined O&M and SG&A (excl. SPP costs) increase
7%
–
Excludes $34 million increase SPP transmission expenses
–
Includes S&A expense increases of $7 million for tree trimming and
$33 million for pension expenses
–
2011 adjusted for legal settlement of arbitration
•
Depreciation
$10 million lower including effects of S&A
•
AFUDC increase
$7 million
•
COLI proceeds of
$14 million; (will book
$9 million in Q1)
•
Effective tax rate of 29-31%
•
Debt used for 2012 external funding needs
2012 Earnings Guidance of $1.85 -
$2.00
2012 UBS Electric Power Conference |
 8
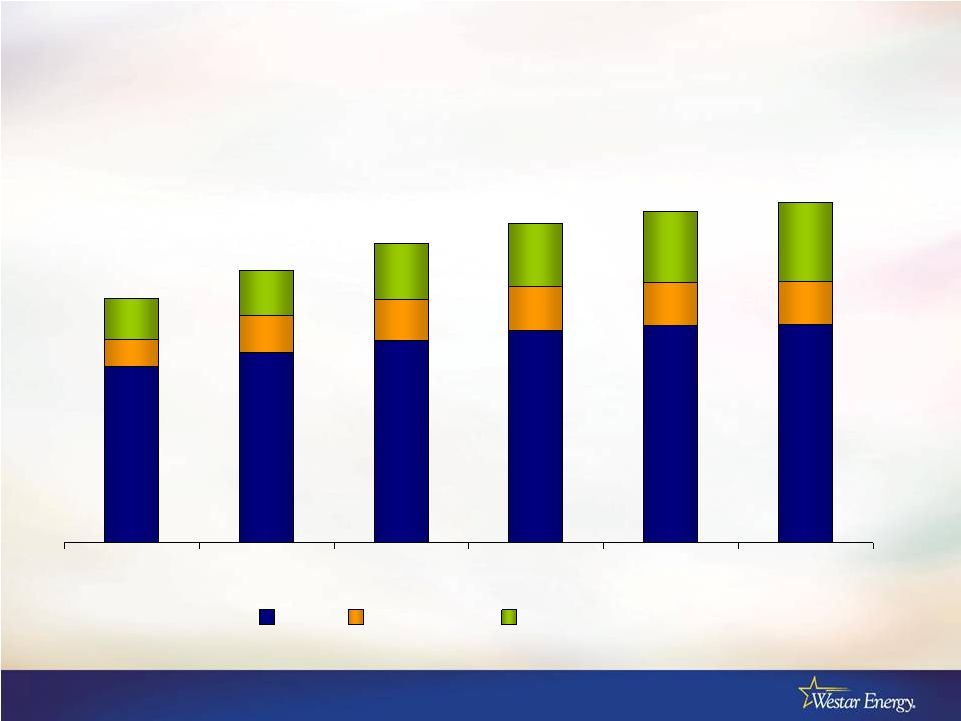
Capital Expenditure Forecast 2012 -
2014
Actual
Forecast
Forecast
Forecast
Forecast
Method of
Cost
2011
2012
2013
2014
2012 - 2014
Recovery
Generation replacements and other
132.8
$
159.8
$
172.3
$
164.6
$
496.7
$
GRC
Westar environmental
153.4
219.3
121.8
107.4
448.5
ECRR
La Cygne environmental
66.5
215.8
205.9
122.3
544.0
GRC
Nuclear Fuel
18.5
21.9
44.2
20.6
86.7
RECA
Transmission
188.8
136.5
200.7
197.4
534.6
FERC / TDC
Distribution
New customers, replacements & other
95.9
92.8
106.7
88.1
287.6
GRC
Smart grid (a)
17.9
3.7
3.7
GRC
Other
23.6
21.5
23.6
12.1
57.2
GRC
Total
697.4
$
871.3
$
875.2
$
712.5
$
2,459.0
$
(a) net of DOE matching grant
Prairie Wind Transmission joint venture
2.0
$
1.8
$
27.4
$
3.4
$
32.6
$
Not included in the table are Westar's planned investment in Prairie Wind
Transmission joint venture 2012 UBS Electric Power Conference
|
 9
•
Mercury and Air Toxics Standards (MATS)
–
Final rule issued February 2012
–
Not viewed as problematic
•
Reasonable time for compliance
•
Compliance viewed as additive to current environmental plans
•
Projected investment up to $40 million
•
Cross-States Air Pollution Rule (CSAPR)
–
Rule currently stayed
–
Arguments before DC Circuit Court in April
–
Optimistic no major issues with compliance or reliability
•
Time for implementation in our favor
•
Helpful technical adjustments by EPA
Environmental Rules
2012 UBS Electric Power Conference |
 10
2012 UBS Electric Power Conference
2012 Plans
|
 11
Annualized Rate & Revenue Changes
Actual and Estimated
2011
2012
(Estimated)
2013
(Estimated)
Base rates
$50 million
May
Transmission rates (a)
$17
million
Jan 1
$25
million
Jan 1
$17 million
Jan 1
ECRR
$10
million
June 1
$15
million
June 1
$27
million
June 1
Energy Efficiency
$5 million
November
$1 million
November
$1 million
November
2012 UBS Electric Power Conference
Complete
In process
(a)
Incremental transmission revenue is from FERC transmission formula rate and the
retail Transmission Delivery Charge, net of the projected 2012 increase in
SPP transmission costs. |
 12
Major Construction Projects Underway
•
Air Quality Improvements
–
Lawrence Energy Center
•
Fabric filters, rebuild scrubbers, precipitator, low NOx system
–
Jeffrey Energy Center
•
SCR on 1 unit
–
La Cygne Energy Center
•
Scrubbers, fabric filters, common chimney, SCR and low NOx system
•
Transmission
–
Wichita to Oklahoma 345 kV
–
Prairie Wind Transmission line (
110 mile double circuit 345 kV)
•
SmartStar Lawrence
–
$40 million project reduced by 50% DOE match
•
Advanced outage management
•
Automated metering infrastructure
2012 UBS Electric Power Conference |
 13
Capital Expenditure Forecast 2012 -
2014
Actual
Forecast
Forecast
Forecast
Forecast
Method of
Cost
2011
2012
2013
2014
2012 - 2014
Recovery
Generation replacements and other
132.8
$
159.8
$
172.3
$
164.6
$
496.7
$
GRC
Westar environmental
153.4
219.3
121.8
107.4
448.5
ECRR
La Cygne environmental
66.5
215.8
205.9
122.3
544.0
GRC
Nuclear Fuel
18.5
21.9
44.2
20.6
86.7
RECA
Transmission
188.8
136.5
200.7
197.4
534.6
FERC / TDC
Distribution
New customers, replacements & other
95.9
92.8
106.7
88.1
287.6
GRC
Smart grid (a)
17.9
3.7
3.7
GRC
Other
23.6
21.5
23.6
12.1
57.2
GRC
Total
697.4
$
871.3
$
875.2
$
712.5
$
2,459.0
$
(a) net of DOE matching grant
Prairie Wind Transmission joint venture
2.0
$
1.8
$
27.4
$
3.4
$
32.6
$
Not included in the table are Westar's planned investment in Prairie Wind
Transmission joint venture 2012 UBS Electric Power Conference
|
 14
Capital Expenditure Forecast 2012 -
2014
$0
$100
$200
$300
$400
$500
$600
$700
$800
$900
$1,000
2011
2012
2013
2014
$697
$871
$875
$713
Air Quality
Other
Transmission
43%
37%
41%
49%
La Cygne
2012 UBS Electric Power Conference |
 15
Projected Rate Base 2010 –
2015 (in billions)
2011
2012
2013
2014
2015
2016
Base
Air Quality
Transmission
$6.9
$6.7
$6.5
$6.0
$5.4
$4.8
$3.4
$3.8
$4.1
$4.3
$4.4
$4.4
2012 UBS Electric Power Conference
$0.8
$0.9
$1.1
$1.3
$1.4
$1.6
$0.6
$0.7
$0.8
$0.9
$0.9
$0.9 |
 16
Environmental
2012 UBS Electric Power Conference |
 17
Cross-State Air
Pollution Rule
Mercury and Air
Toxics Standards
Water 316(b)
Coal
Combustion
Waste
Status
Stayed by DC
Circuit Court
Published
February 2012
Proposed
Proposed
Effective
Pending Court
Decision
April 2012
(3 to 5 years to
comply)
July 2012
Mid 2013
Emissions / Areas
Covered
NOx
SO
2
Mercury
Acid gases
Water intake
Coal waste
Generation
Sources Affected
Coal
Gas
Coal
Coal
Nuclear
Coal
Issue(s)
Cost
Reliability
Allowances
Timeline
Cost
Timeline
Cost
Cost
Designation as
hazardous or non-
hazardous
Environmental Regulation Summary
2012 UBS Electric Power Conference |
 18
•
Rule issued February 2012
•
Westar does not view as problematic
–
No surprises in final rule
–
Allow three years for compliance
•
Opportunity for one additional year
–
View as additive to current environmental plans
•
Incorporated anticipated rules in current compliance plans for Regional
Haze and JEC Consent Decree
–
Largest fleet impact on smallest coal-fired units
–
MATS compliance investment estimated up to $40 million
Mercury and Air Toxics Standards (MATS)
2012 UBS Electric Power Conference |
 19
Dramatic Improvement in Air Quality
2012 UBS Electric Power Conference
Actual
Projected
Actual
Projected
Nitrogen Oxide
57%
(tons per year)
Sulfur Dioxide
83%
(tons per year)
0
10,000
20,000
30,000
40,000
50,000
60,000
70,000
2001
2002
2003
2004
2005
2006
2007
2008
2009
2010
2011
2012
2013
2014
2015
2016
2017
0
20,000
40,000
60,000
80,000
100,000
120,000
2001
2002
2003
2004
2005
2006
2007
2008
2009
2010
2011
2012
2013
2014
2015
2016
2017 |
 20
Westar Coal Fleet Emission Control Equipment
Unit
Scrubber
Precipitator
Fabric Filter
Low NOx
SCR
ACI
DSI
Jeffrey 1
Yes
Yes
No plans
Yes
Planned
Planned
No plans
Jeffrey 2
Yes
Yes
No plans
Yes
Uncertain
Planned
No plans
Jeffrey 3
Yes
Yes
No plans
Yes
No plans
Planned
No plans
La Cygne 1
Yes
(b)
Planned
No
Yes
Planned
No plans
La Cygne 2
Planned
Yes
Planned
Planned
Planned
Planned
No plans
Lawrence 3
No plans
Yes (c)
No plans
Planned
No plans
Planned
Planned
Lawrence 4
Yes (a)
(b)
Planned
Planned
No plans
Planned
No plans
Lawrence 5
Yes (a)
(b)
Planned
Yes
No plans
Planned
No plans
Tecumseh 7
No plans
Yes
No plans
Yes
No plans
Planned
Planned
Tecumseh 8
No plans
Yes (c)
No plans
Planned
No plans
Planned
Planned
(a) Equipment rebuild underway
(b) PM removal integrated into scrubbers
(c) Equipment upgrade planned
83% of MWs Currently Scrubbed
2012 UBS Electric Power Conference |
 21
Air Quality Control
Targeted Emission / Benefit
Low NOx Burner Systems
NOx
Selective Non-Catalytic Reduction
NOx
Selective Catalytic Reduction
NOx
Scrubber
SO
2
Acid gases
Small amount of mercury
Baghouse
Particulate matter
Small amount of mercury
Metals
Electrostatic Precipitator
Particulate matter
Metals
Activated Carbon Injection (ACI)
Mercury
Dry Sorbent Injection (DSI)
SO
2
Acid gases
Air Quality Controls
2012 UBS Electric Power Conference |
 22
Transmission
2012 UBS Electric Power Conference |
 23
Major Transmission Investments Underway
2012 UBS Electric Power Conference
•
Rose Hill –
Oklahoma
Under construction
•
Target completion Apr 2012
•
Investment
n
$80 million
•
Favorable to budget
•
Prairie Wind Transmission
•
50/50 JV with ETA
•
Siting approved June 2011
•
Acquiring ROW and clearing
•
Begin construction mid 2012
•
Approximately 110 miles
•
Estimated completion 2014
•
Project cost
$225 million
n |
 24
Prairie Wind Transmission Regulation
•
Received FERC incentives
–
Recovery of pre-commercial development costs
–
CWIP recovery in rate base
–
Allowed ROE of 12.8%
•
KCC
–
Siting approved June 2011
•
Southwest Power Pool
–
Regional cost allocation approved by FERC
–
“Notice to Construct”
accepted
–
JV became a member of the SPP
–
PWT’s formula rate in effect
2012 UBS Electric Power Conference |
 25
Potential for High Voltage Transmission Growth
A.
JEC to Iatan
Energy Center
B.
Wolf Creek to
Swissvale
C.
Concordia to Salina
D.
Salina to Hays
E.
JEC to Swissvale
F.
Hutchinson to
Spearville
G.
Wichita to Rose Hill
H.
JEC to Concordia
F
G
A
B
C
E
D
H
2012 UBS Electric Power Conference |
 26
Profile
2012 UBS Electric Power Conference |
 27
Strategic Approach
•
Embrace uncertainty
–
Acknowledge inability to predict the future
•
Value flexibility
–
Operational
–
Financial
–
Regulatory
•
Leverage actions and strategies around intrinsic advantages
•
Seek collaborative and constructive approaches to regulation
•
Value proposition
–
Protect against downside while growing investor returns
2012 UBS Electric Power Conference
Pure-play, vertically
integrated, rate-regulated
•
7,100 MW of generation
•
6,200 miles transmission
•
688,000 customers |
 28
Regulatory Approach
•
A sound regulatory and energy policy platform
–
KCC and FERC
•
Ultimately results in lower rates for customers
2012 UBS Electric Power Conference |
 29
Favorable Supply Portfolio
$52.65
$19.30
$7.15
Uranium
Coal
Gas
Ave. Fuel Cost
$20.60/MWh
Fuel Mix
Coal
49%
Gas
39%
Wind
4%
Uranium
8%
MW Capacity
5.0¢
6.0¢
7.0¢
8.0¢
9.0¢
10.0¢
Westar Energy
Kansas City Power
and Light (KS)
Empire District
Electric (KS)
National
Average
8.0¢
8.8¢
9.8¢
Low Rates
Source: Edison Electric Institute 07/01/2011
Coal
77%
Gas
8%
Wind
3%
Uranium
12%
Cost of Fuel
2012 UBS Electric Power Conference |
 30
Diverse Energy Sales (MWh)
Chemical & oil
Food
processing
Aerospace
Consumer
manufacturing
Other
Commercial
37%
Residential
35%
Industrial
28%
40%
17%
15%
16%
12%
12%
18%
8%
7%
3%
4%
48%
Other
General
merchandise
Grocery/
Convenience
Real estate
Health care
Government
Education
2012 UBS Electric Power Conference |
 31
Strong Service Territory
•
Economy significantly stronger
than for the nation
–
No real estate crash
–
Unemployment remains 2+ pts
favorable to nation
•
Economic development gains
fueling industrial resurgence
–
Sales up 2% 12me Dec ‘11
–
EcoDevo successes:
•
Mars Chocolate opening M&M
and Snickers factory in Topeka
•
South central Kansas becoming a
wind manufacturing corridor
–
Pulling from aerospace base
2012 UBS Electric Power Conference |
 32
Liquidity and Capitalization
Target n 50/50
capital structure Debt
47%
Equity
52%
Preferred
<1%
Dec. 31, 2011
(a)
(millions)
Long-term, net
$2,491
Preferred
21
Common
2,769
Total Capitalization $5,281
(a) Capitalization excludes short-term debt
and adjustments for VIEs
2012 UBS Electric Power Conference
•
Solid investment grade credit
•
Total credit facility capacity $1 Billion
•
Active in Commercial Paper market
•
No bonds mature before 2014
Secured
Unsecured
Outlook
Moody's
A3
Baa2
Stable
Fitch Ratings
A-
BBB+
Stable
Standard & Poor's
BBB+
BBB
Stable |
 33
$0.92
$1.00
$1.08
$1.16
$1.20
$1.24
$1.28
$1.32
$0.75
$0.85
$0.95
$1.05
$1.15
$1.25
$1.35
2005
2006
2007
2008
2009
2010
2011
2012
Dividend
•
Quarterly dividend increased 3% effective April 1
•
Long-standing dividend payout target of 60%-75% of earnings
–
2012 guidance implies payout in middle of range
Indicated
annual rate
2012 UBS Electric Power Conference |
 34
Westar’s Value Proposition
•
Solid, transparent business strategy
•
Strong, experienced utility management team
•
Thoughtful, disciplined approach to operations, capital planning
and financing
•
Constructive regulatory and policy environment
–
Results in lower, more gradual price changes for customers
–
Preserves reliable infrastructure as base for economic growth
–
Provides investors clarity
•
Focus on containing risks and maintaining returns
•
Diverse customer base and stable service territory
2012 UBS Electric Power Conference |
 35
Rates and Regulation
2012 UBS Electric Power Conference |
 36
•
Kansas Corporation Commission
–
Three-member board appointed by governor
•
Serve staggered four year terms
•
Current KCC commissioners
–
Mark Sievers (R), chairman
•
Term expires March 2015
–
Thomas Wright (D)
•
Term expires March 2014
–
Ward Loyd (R)
•
Term expires March 2012
Kansas Regulators
2012 UBS Electric Power Conference |
 37
Regulatory Approach
•
A sound regulatory and energy policy platform
–
KCC and FERC
•
Ultimately results in lower rates for customers
2012 UBS Electric Power Conference |
 38
Methods of Cost Recovery
Revenue Requirement
Method of Recovery
Comment
1.
Fuel, purchased power and
environmental consumables
Quarterly adjustment based on
forecasted cost, with annual true-up
Adjusts prices for actual costs,
protecting both customers and
investors from mispricing
2.
Environmental capital, excluding
La Cygne environmental project
Environmental Cost Recovery Rider
adjusts annually
Allows annual price adjustment to
reflect capital costs for investments
in emission controls
3.
Transmission rate recovery
FERC formula rate adjusts annually;
companion retail tariff to reflect
current revenue requirement
Timely recovery of transmission
system operating and capital costs
4.
General capital investments
Traditional rate case, but with
predetermination and CWIP
Typical rate case reflects current
level of operating expenses and
most recent plant investment
5.
Property taxes
Annual adjustment to reflect current
property taxes
Allows timely recovery of actual
property tax costs in current rates
6.
Extraordinary storm damages
Traditionally deferred accounting
treatment as rate base
Smoothes period expenses for
extraordinary storm restoration costs
7.
Pension expenses
Deferred as a regulatory asset for
subsequent recovery
Smoothes period expenses in
excess of amount in base rates
8.
Energy efficiency programs
Deferred as a regulatory asset for
subsequent recovery
Smoothes period expenses for
energy efficiency programs
2012 UBS Electric Power Conference |
 39
Retail Energy Cost Adjustment (RECA)
•
Provides timely price adjustments for fuel and purchased power
costs
•
Retail rates based on forecast of fuel and purchased power costs
and retail sales
–
Set quarterly
–
Difference between forecast and actual is deferred
•
Quarterly approach produces more stable prices
•
Annual settlement of deferred balance
•
RECA also used to rebate wholesale margins as a credit to retail
cost of service
–
Energy Marketing (i.e., non-asset) margins continue to be excluded
from rate setting
2012 UBS Electric Power Conference |
 40
Pension Tracker
•
Defer as regulatory asset shortfall between funding of GAAP
pension/OPEB expense and pension/OPEB currently authorized
in rates
•
Maintain minimum funding level equal to GAAP pension/OPEB
expense
•
Recover deferred expenses through multi-year amortization as
part of next rate case
2012 UBS Electric Power Conference |
 41
Environmental Cost Recovery Rider Mechanics
•
ECRR adjusts retail rates annually to reflect capital investments in
emission controls
–
Investments as of December 31 recovered in rates subsequent June
–
Eliminates need to file a rate case to capture rate base additions
•
Return of
and on
capital that is in service December 31
•
Return on
capital not yet placed in service December 31 (i.e., CWIP)
•
ECRR reduces regulatory lag
–
Regulatory lag limited to months, rather than longer lag typically
associated with traditional rate case filings
2012 UBS Electric Power Conference |
 42
Illustrative ECRR Mechanics
(1)
Illustration reflects only the projects publicly announced and assumes one-half of annual
investment in service at year end (2)
Illustration uses
n
11.9% pretax return and 4% depreciation recovery
(3)
Annual ECRR Tariff is effective June 1; assume Jan-May at prior year revenue requirement and
Jun-Dec at new revenue requirement Clean Air Investment (1)
2008
2009
2010
2011
2012
2013
2014
Year 1 Investment
238.4
$
Year 2 Investment
85.2
$
Year 3 Investment
107.7
$
Year 4 Investment
153.4
$
Year 5 Investment
219.3
$
Year 6 Investment
121.7
$
Year 7 Investment
107.4
$
Environmental Investment
238.4
$
85.2
$
107.7
$
153.4
$
219.3
$
121.7
$
107.4
$
Accumulated Depreciation Clean Air Investment
Depreciation on Year 1 Investment
4.8
$
9.5
$
9.5
$
9.5
$
9.5
$
9.5
$
9.5
$
Depreciation on Year 2 Investment
1.7
3.4
3.4
3.4
3.4
3.4
Depreciation on Year 3 Investment
2.2
4.3
4.3
4.3
4.3
Depreciation on Year 4 Investment
3.1
6.1
6.1
6.1
Depreciation on Year 5 Investment
4.4
8.8
8.8
Depreciation on Year 6 Investment
2.4
4.9
Depreciation on Year 7 Investment
2.1
Annual Depreciation
4.8
$
11.2
$
15.1
$
20.3
$
27.8
$
34.6
$
39.2
$
Total Accum Depreciation for Environmental Investment
4.8
$
16.0
$
31.1
$
51.4
$
79.2
$
113.8
$
153.0
$
Environmental Investment, net of Accum. Depreciation
233.6
$
69.2
$
76.6
$
102.0
$
140.1
$
7.9
$
(45.6)
$
Return on prior YE investment balance (2)
27.7
$
8.2
$
9.1
$
12.1
$
16.6
$
0.9
$
4.8
11.2
15.1
20.3
27.8
34.6
Annual ECRR Revenue Requirement
32.5
$
19.4
$
24.2
$
32.4
$
44.4
$
35.5
$
Estimated calendar year revenue recognition (3)
18.9
$
24.9
$
22.2
$
29.0
$
39.4
$
39.2
$
Cumulative ECRR revenue recognition
18.9
$
43.8
$
66.0
$
95.0
$
134.4
$
173.6
$
2012 UBS Electric Power Conference
Return of prior YE investments completed |
 43
Transmission Cost Recovery
•
FERC formula transmission rate
–
Changes in cost of service reflected in annual update of FERC tariff
•
Update posted each October using projected test year
–
Capital expenditures
–
O&M
–
Tariff based on year-end consolidated capital structure
•
FERC transmission changes effective January 1
•
Allowed ROE 11.3%
•
Annual true-up compares projected revenue requirement to actual, with
difference incorporated into next update
–
Incentives on recently completed central Kansas line
•
12.3% ROE
•
Accelerated book depreciation of 15 vs. 45 years
•
Transmission Delivery Charge (TDC)
–
Retail rates adjusted to match changes to FERC tariff
2012 UBS Electric Power Conference |
 44
Transmission Formula Rate Mechanics
•
Fixed formula with changing inputs
–
Updated annually using Form 1 data
–
Established protocols for updates
•
Uses projected test year
–
Rate base (based on 13 month average)
–
O&M, depreciation and taxes
–
Cost of debt
•
Annual true-up
incorporated in subsequent year’s formula inputs
Establish
Proj. 2012
Rev. Req.
Establish
Proj. 2013
Rev. Req.
Start of 2013
Rate Year
Start of 2012
Rate Year
FERC
Form 1
Released
True-up between ’11
Proj. Rev. Req. and
Actual Rev. Req.
Transmission Formula Rate Time Line
2012 UBS Electric Power Conference |
 45
Energy Efficiency Initiatives
•
SmartStar Lawrence smart grid project
–
Installing
48,000 “smart”
meters
–
Advanced outage management system
–
Total project cost of
$40 million
•
Reduced by 50% DOE match
–
Expect to implement over 2 -
3 years
•
Deferred accounting for the cost of energy efficiency initiatives,
such as
–
Smart thermostats
–
Customer educational programs
–
Demand response programs
2012 UBS Electric Power Conference |
 46
Kansas’
Renewable Requirements
•
Renewable Portfolio Standard established
–
Installed capability standard in lieu of energy standard
•
10%
of
peak
load
by
2011,
15%
by
2016
and
20%
after
2020
–
If generated in Kansas, treated at 110% of requirement
–
Relief from standard possible if costs would increase prices >1%
•
Potential to offset with RECs for initial period
•
Limited net metering
–
Limited to 1% of peak demand
–
Customer’s net metered sales can’t produce net negative sales
•
Environmental predictability
–
Legislation precludes state air emission levels from being more
stringent than federal standards
2012 UBS Electric Power Conference |
 47
•
Statute requires
200 MW additional renewables by 2011
–
KCC approved use of RECs to satisfy 2011 requirement until projects
placed in-service in late 2012
•
KCC approved request for
370 MW through PPAs
–
Agreements for 2 projects
•
Post Rock Wind Farm -
201 MW
•
Ironwood Wind Farm –
168 MW
–
Expect both projects to be in-service by end 2012
–
Recover through the fuel adjustment clause
•
20 year agreements priced < $35/MWh
Addition of Renewables in 2012
2012 UBS Electric Power Conference |
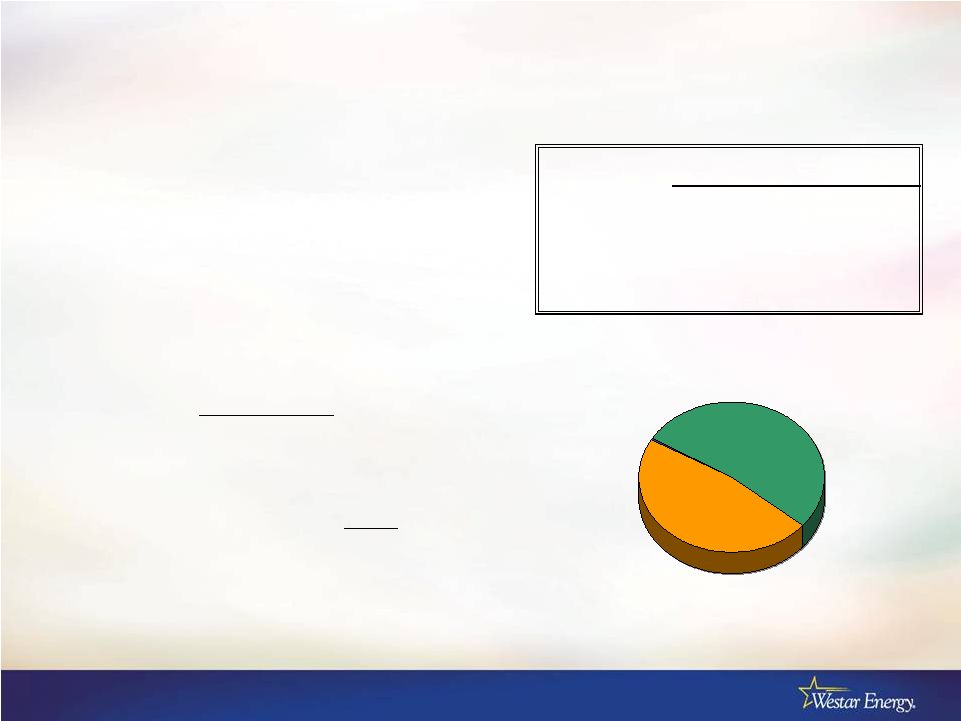
 Westar Renewables Compliance
Favorable pricing allowed
for head start on 2016
statute requirements
KCC allowed the 2011 statute
requirement to be satisfied
with Renewable Energy Credits
2012 UBS Electric Power Conference
48 |
 49
Statutes for Predetermination and CWIP
•
Predetermination
–
Utilities can obtain order establishing ratemaking principles that will
apply over the life of the asset
•
Construction Work in Progress (CWIP)
–
Utilities can include CWIP in rate cases
2012 UBS Electric Power Conference |
 50
Capital Structure for Ratemaking (Per Recent Orders)
Capitalization
Ratio
Cost of
Capital
Weighted Cost
of Capital
Pre-tax Weighted
Cost of Capital
Long-term debt
48.66%
6.55%
3.19%
3.19%
Preferred
0.51
4.55
.02
.04
Common
50.83
10.40
5.29
8.77
100.00%
8.50%
12.00%
Capitalization
Ratio
Cost of
Capital
Weighted Cost
of Capital
Pre-tax Weighted
Cost of Capital
Long-term debt
50.89%
6.30%
3.21%
3.21%
Preferred
0.44
4.52
.02
.03
Common
48.67
11.30
5.50
9.10
100.00%
8.73%
12.34%
KCC
FERC Transmission
(1) Incentive ROE of 12.3% for applicable rate base
(1)
2012 UBS Electric Power Conference |
 51
Capital Structure for Ratemaking (Proposed)
Capitalization
Ratio
Cost of
Capital
Weighted Cost
of Capital
Pre-tax Weighted
Cost of Capital
Long-term debt
46.97%
6.65%
3.12%
3.12%
Preferred
0.40
4.55
.02
.03
Common
52.63
10.00
5.26
8.71
100.00%
8.40%
11.86%
KCC
(proposed in Settlement Agreement)
2012 UBS Electric Power Conference |
 52
•
Obtain permission from KCC to file ARC
–
Request made in a general rate case (GRC)
–
Identify scope of proposed ARC
•
Must file within 12 months of final GRC order
•
Applicant must adopt from previous rate order:
–
All regulatory procedures
–
All regulatory principles
–
Established rate of return
Abbreviated (Limited Scope) Rate Case (ARC)
2012 UBS Electric Power Conference |
 53
Background
2012 UBS Electric Power Conference |
 54
Westar Energy Legal Structure
Kansas Gas and
Electric Company
Consolidated capital
structure is used for
ratemaking
(Rate regulated utility)
(Rate regulated utility)
Westar Energy, Inc.
Parent
Subsidiary
Combined company
does business under
the name “Westar
Energy”
2012 UBS Electric Power Conference |
 55
Westar’s Generating Resources
2012 UBS Electric Power Conference
Indicates proposed facility |
 56
Westar’s Plants
Westar's
MW
Operator
Years Installed
Pulverized coal
Jeffrey Energy Center
2,005
Westar
1978, 1980, 1983
Lawrence Energy Center
531
Westar
1954, 1960, 1971
Tecumseh Energy Center
205
Westar
1957, 1962
LaCygne Station
711
KCPL
1973, 1977
Nuclear
Wolf Creek
547
WCNOC (1)
1985
Gas steam turbine
Gordon Evans Energy Center
527
Westar
1961, 1967
Hutchinson Energy Center
167
Westar
1965
Murray Gill Energy Center
293
Westar
1952, 1954, 1956, 1959
Neosho Energy Center
62
Westar
1954
Gas combustion turbine
Abilene Energy Center
68
Westar
1973
Gordon Evans Energy Center
294
Westar
2000, 2001
Hutchinson Energy Center
229
Westar
1974, 1975
Spring Creek Energy Center
279
Westar
2001
Emporia Energy Center
660
Westar
2008, 2009
Gas combined cycle
State Line
201
EDE Co.
2001
Wind
Meridian Way
96
Horizon (2)
2008
Central Plains
99
Westar
2009
Flat Ridge
100
Westar (3)
2009
Available generation
At Dec. 31, 2011
7,074
(1)
Wolf Creek Nuclear Operating Company is a company formed specifically to operate
Wolf Creek for its owners. WCNOC is governed by a board of directors
consisting of the CEO of WCNOC and senior executives of the plant
owners. (2)
100% of generation purchased under Power Purchase Agreement (PPA)
(3)
50% owned and 50% of generation purchased under PPA from BP Alternative
Energy Westar Energy
2011 Results
NERC
5-Year Average
Plant Performance
72.1%
85.8%
71.2%
89.3%
87.0%
90.1%
70.4%
73.7%
0%
20%
40%
60%
80%
100%
Coal Capacity
Factor
Wolf Creek
Capacity Factor
Coal Availability
Factor
Wolf Creek
Availability
Factor
2012 UBS Electric Power Conference |
 57
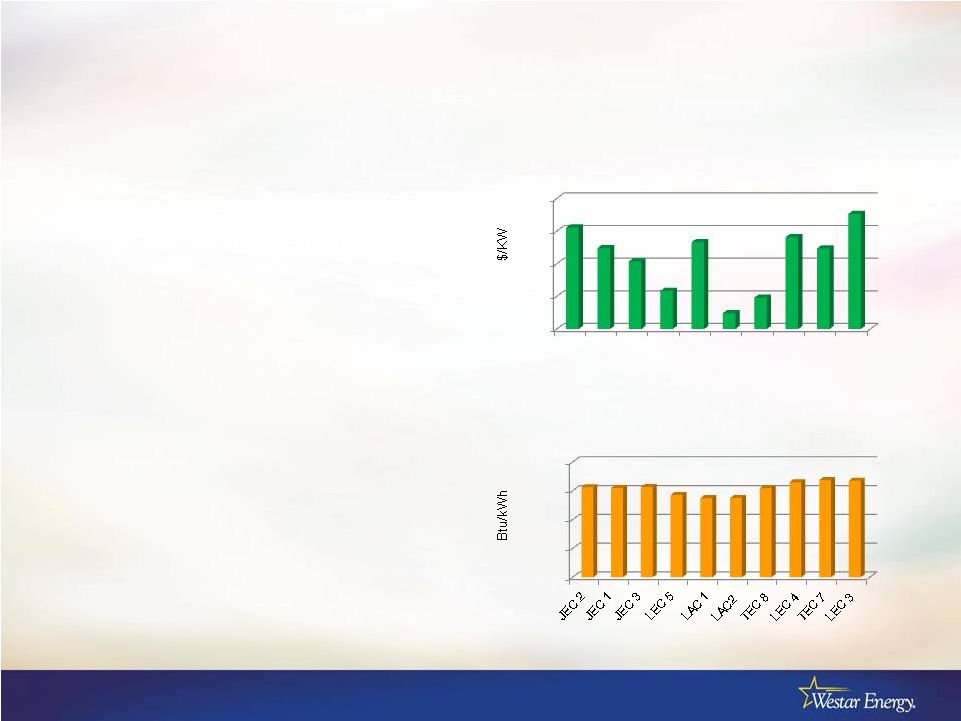
Low-Cost Coal Fleet
•
Very low fuel cost
–
PRB coal
–
Excellent rail arrangements
–
Proximity to mines
•
Low embedded capital cost
•
No high-heat rate obsolete
plants
LAC 2 subject to lease agreement
2012 UBS Electric Power Conference
$0
$150
$300
$450
$600
JEC
3
JEC
2
JEC
1
LEC
5
LAC
1
LAC
2
TEC
8
LEC
4
TEC
7
LEC
3
Low Embedded Cost
5,000
7,000
9,000
11,000
13,000
Heat Rate |
 58
Westar Energy Coal Fleet
Unit
Capacity
(MW)
WR Share
(MW)
Age
Heat Rate
(Btu/kWh)
Net Book
Value
(Millions)
$/KW
Jeffrey 3
730
672
28
11,265
314
$
467
$
Jeffrey 2
725
667
31
11,256
248
$
372
$
Jeffrey 1
724
666
33
11,204
207
$
311
$
Lawrence 5
371
371
40
10,713
65
$
175
$
La Cygne 1
736
368
38
10,497
147
$
399
$
La Cygne 2
(a)
686
343
34
10,500
25
$
73
$
Tecumseh 8
132
132
49
11,189
19
$
144
$
Lawrence 4
109
109
51
11,605
46
$
422
$
Tecumseh 7
73
73
54
11,749
27
$
370
$
Lawrence 3
51
51
57
11,707
27
$
529
$
3,452
(a) Subject to lease agreement
2012 UBS Electric Power Conference |
 59
Westar-operated plant fuel supply (80%)
•
JEC supply under contract through 2020 (10+ million tons/year)
–
70% has no market openers
–
30% reopened on price every 5 years
•
Next re-pricing will occur in 2013
–
All volumes have cost escalators
–
Rail contract through 2013
•
LEC/TEC supply under contract until 2012 (3.5 million tons/year)
–
100% at fixed price or capped through 2012
–
Rail contract through 2013
Co-owned plant fuel supply managed by GXP (20%)
•
LAC supply (3 million tons/year)
Coal Supply
2012 UBS Electric Power Conference |