Attached files
| file | filename |
|---|---|
| EX-31.01 - CERTIFICATION OF CEO - 302 - VERSANT CORP | fy201110kaexhibit3101.htm |
| EX-31.02 - CERTIFICATION OF CFO - 302 - VERSANT CORP | fy201110kaexhibit3102.htm |
| EX-32.01 - CERTIFICATION OF CEO - 906 - VERSANT CORP | fy201110kaexhibit3201.htm |
| EX-32.02 - CERTIFICATION OF CFO - 906 - VERSANT CORP | fy201110kaexhibit3202.htm |
United States Securities and Exchange Commission
Washington, D.C. 20549
Form 10-K/A
x | Annual Report pursuant to Section 13 or 15(d) of the Securities Exchange Act of 1934 |
For the fiscal year ended October 31, 2011, or
o | Transition Report pursuant to Section 13 or 15(d) of the Securities Exchange Act of 1934 |
for the transition period from to .
Commission File Number 000-28540

VERSANT CORPORATION
(Exact name of Registrant as specified in its charter)
255 Shoreline Drive, Suite 450, Redwood City, California 94065
California | 94-3079392 | |
(State or other jurisdiction of incorporation or organization) | (I.R.S. Employer Identification No.) | |
(Address of principal executive offices) (Zip code)
(650) 232-2400
(Registrant’s telephone number, including area code)
Securities registered pursuant to Section 12(b) of the Act:
Title of each class | Name of each exchange on which registered | |
Common Stock, no par value | NASDAQ Capital Market | |
Securities registered pursuant to Section 12(g) of the Act: None
Indicate by check mark if the registrant is a well-known seasoned issuer, as defined in Rule 405 of the Securities Act. Yes o No ý
Indicate by check mark if the registrant is not required to file reports under Section 13 or 15(d) of the Exchange Act. Yes o No ý
Indicate by check mark whether the registrant: (1) has filed all reports required to be filed by Section 13 or 15(d) of the Securities Exchange Act of 1934 during the preceding 12 months (or for such shorter period that the Registrant was required to file such reports), and (2) has been subject to such filing requirements for the past 90 days. Yes ý No o
Indicate by check mark whether the registrant has submitted electronically and posted on its corporate Web site, if any, every Interactive Data File required to be submitted and posted pursuant to Rule 405 of Regulation S-T (§232.405 of this chapter) during the preceding 12 months (or for such shorter period that the registrant was required to submit and post such files). Yes ý No o
Indicate by check mark if disclosure of delinquent filers pursuant to Item 405 of Regulation S-K (§229.405 of this chapter) is not contained herein and will not be contained, to the best of registrant's knowledge, in definitive proxy or information statements incorporated by reference in Part III of this Form 10-K or any amendment to this Form 10-K. o
Indicate by check mark whether the registrant is a large accelerated filer, an accelerated filer, a non-accelerated filer, or a smaller reporting company. See the definitions of “large accelerated filer,” “accelerated filer” and “smaller reporting company” in Rule 12b-2 of the Exchange Act. (Check one):
Large Accelerated Filer o | Accelerated Filer o | |
Non-Accelerated Filer o | Smaller reporting company x | |
(Do not check if a smaller reporting company) | ||
Indicate by check mark whether the registrant is a shell company (as defined in Rule 12b-2 of the Exchange Act) o Yes No x
The aggregate market value of the voting and non-voting common equity held by non-affiliates (assuming, for purposes of this calculation only, that the registrant's directors, executive officers and greater than 10% shareholders are affiliates of the registrant) computed by reference to the price at which the common equity was last sold, or the average bid and asked price of such common equity, as of April 30, 2011 (the last business day of the registrant's most recently completed second fiscal quarter): $39,903,000.
As of January 25, 2012, there were outstanding 2,925,400 shares of the Registrant’s common stock, no par value.
VERSANT CORPORATION
ANNUAL REPORT ON FORM 10-K/A
For the Fiscal Year Ended October 31, 2011
Table of Contents
Item no. | Name of Item | Page | |
2
EXPLANATORY NOTE
This Amendment No. 1 on Form 10-K/A (this “Amendment”) amends our Annual Report on Form 10-K for the fiscal year ended October 31, 2011, that was filed with the Securities and Exchange Commission (“SEC”) on January 30, 2012 (the “Original Filing”). We are filing this Amendment to include the information required by Part III and not included in the Original Filing, as we will not file a definitive proxy statement involving an election of directors within 120 days of the end of our fiscal year ended October 31, 2011. The reference on the cover of the Original Filing to the incorporation by reference of our definitive proxy statement into Part III of the Original Filing is hereby deleted.
Except as set forth in Part III below, no other changes are made to the Original Filing. The Original Filing continues to speak as of the date of the Original Filing. Unless expressly stated, this Amendment does not reflect events occurring after the filing of the Original Filing, nor does it modify or update in any way the disclosures contained in the Original Filing.
Without limitation, Versant Object Database, Versant ®, FastObjects, db4o, db4objects and other Versant product names referred to herein are trademarks of Versant in the United States and/or other countries. All other corporate or trade names or service marks referred to in this report are the names or marks of their respective owners in the United States and/or other countries.
CAUTION REGARDING FORWARD-LOOKING STATEMENTS
This Form 10-K contains forward-looking statements within the meaning of Section 21E of the Securities Exchange Act of 1934 and Section 27A of the Securities Act of 1933. These forward-looking statements include, among other things, statements regarding the Company's expected future financial performance, assets, liquidity and trends anticipated for the Company's business. These statements are based on the Company's current expectations, assumptions, estimates and projections about the Company's business, the Company's industry and the market for the Company's goods and services, which are based on information that is reasonably available to the Company as of the date of this report. Forward-looking statements may include words such as "believes," "anticipates," "expects," "intends," "plans," "will," "may," "should," "estimates," "predicts," “forecasts,” "guidance," "potential," "continue" or the negative of such terms, other variants of such terms or other similar expressions.
We caution investors that forward-looking statements are only predictions, forecasts or estimates based upon our current expectations about future events. The forward-looking statements are not guarantees or assurances of our future performance and are subject to significant risks and uncertainties that are inherently difficult to assess and predict, particularly in light of the continuing recessionary environment in the United States and the global economy. Consequently, our actual future results and performance may differ materially from the results and performance anticipated by any forward-looking statements due to these risks and uncertainties. Some of the important risks and factors that could cause our results and performance to differ from results or performance anticipated by this report are discussed in Item 1A of this report, -“Risk Factors”- which you should read carefully. We undertake no obligation to revise or update any forward-looking statements in order to reflect events or circumstances that may arise or occur after the date of this report or for any other reason. Readers are urged to carefully review and consider the various disclosures made by Versant in this report and in our other reports filed with the Securities and Exchange Commission that attempt to advise interested parties of risks and factors that may affect our business.
3
PART I
Item 1. Business
Overview of the Company
We are a leading provider of object-oriented data management software that forms a critical component of the infrastructure of enterprise computing. We design, develop, market and support object-oriented database management system products that companies use to solve complex data management and data integration problems. We also provide related product support, training, and consulting services to assist users of our products in developing and deploying software applications based on our products. In December 2011, we announced a new strategic product roadmap in which we have outlined our plans to create database software designed to address very large data problems. This new strategy is intended to extend Versant's proven ability to provide data solutions for large, distributed systems to emerging so-called "Big Data" and near real-time analytical application opportunities. We operate our business within a single operating segment that we refer to as “Data Management”.
Historically, our mission has been to be a preferred vendor of core data management solutions to world-class enterprises whose businesses require the successful management of large and complex bodies of data. We believe that, to fulfill this mission, we must pursue a general strategy of developing and offering powerful, scalable and highly reliable data management solutions capable of handling a wide array of challenging applications. In order to carry out this objective in a world in which it is becoming increasingly important for enterprises to source and manage voluminous amounts of unstructured, real-time and/or distributed data, we plan to augment our existing product offerings by pursuing our new strategy to focus on emerging Big Data and near real-time analytical applications. Driven by the growing ubiquity of mobile devices and smart sensors, the commoditization of computing power and storage, and the exponential growth in raw data, opportunities are emerging for enterprises to harness vast stores of information and become highly agile, data-driven organizations. We believe that it is critical for Versant to develop data management solutions designed to respond to these new computing challenges.
Consequently, Versant plans to make significant investments in new product developments in order to provide data management software that enables the development of analytical applications for this new era of the intelligent “real-time enterprise.” This strategic initiative will include efforts to develop application programming interfaces and server technologies specifically geared toward enhancing an enterprise's ability to ingest and manage vast amounts of structured and unstructured data and analyze very large data sets with near real-time capabilities, and may also involve co-development of technology with other parties and/or licensing of third party intellectual property. We will continue to market our products to companies in the telecommunications and defense industries, as well as to customers in several vertical markets including technology, financial services, transportation and health care. Our software has historically been used in strategic distributed applications such as network modeling and management, fault diagnosis, fraud prevention, service activation and assurance, and customer billing, scheduling and other applications.
Versant's strategic roadmap currently includes plans to develop the following technology components in 2012 and future years:
• | A real-time data ingestion framework, enabling developers to connect large incoming data streams directly with the database server, reducing unwanted network I/O overhead and allowing higher ingestion rates and data transformation in to the database. |
• | A flexible, server side framework to integrate analytical tools and software with the database, to allow processes such as analytical algorithms or graph analysis, to be executed as close as possible to the stored data, and to only transfer results back to a client process. Running these algorithms close to the data is particularly critical for achieving near real-time performance with large data sets. |
• | A highly scalable storage engine, optimized for multi-core server architectures and horizontal scale-out capabilities on commodity server hardware. Most traditional database systems today support either horizontal or vertical scale-out architecture, but not both. Versant believes that combining the two models will create an architecture that can take advantage of massive multi-core servers and allow enterprises to do more with less hardware. |
• | An industry standard-compliant client API based on the Java Persistence API (JPA). The Versant Java Persistence API (Versant JPA) is a so-called pure Java client for the Versant Database Server, which serves as the storage tier for these emerging Big Data and analytical applications. A code preview of Versant JPA is available for download in the Versant Developer Community (community.versant.com). Supporting the JPA industry standard allows developers to use existing programming skills learned from object-to-relational mapping tools, such as Eclipse Link or Hibernate. |
4
Our planned new products will make use of the existing Versant Database technology, an enterprise class data management solution, and build on its current capabilities to enable the development of analytical applications to address Big-Data problems. The technology extensions of the core database will independently address an enterprise class NoSQL data management market and be capable of running in modern cloud computing environments.
However, as with any new software development effort, there can be no assurance that we will succeed in developing any or all of these currently planned technology components, complete them in the chronological order in which we currently plan to develop them, or develop them on a timely basis necessary to attract adequate customer interest. Likewise, we cannot offer any assurance that any of these planned technology components will not be changed or be replaced by other, new and/or different components, that any such technology components will perform as we intend or not experience technical deficiencies, or that any of these components will achieve any meaningful market acceptance or produce meaningful revenues or profit.
We were incorporated in California in August 1988 under the name Object Sciences Corporation and completed the initial public offering of our common stock under the name of Versant Object Technology Company in July 1996. The name of the company was changed to Versant Corporation on July 15, 1998. In March 2004, we acquired Poet Holdings, Inc. (Poet) through a merger. Prior to that merger, Poet was a provider of object-oriented data management software headquartered in the United States, whose stock was publicly traded on the Frankfurt Stock Exchange. In June 2004, we acquired the JDO Genie product line and its customers from JDO Genie (PTY) Ltd., a privately held South African company, and in July 2004, we acquired FastObjects, Inc., a private company that held North American distribution rights with respect to Poet's FastObjects database management product. In August 2005, we effected a 1-for-10 reverse split of our outstanding common stock. In February 2006, we sold our WebSphere consulting business. On December 1, 2008 we acquired the assets of the database software business of privately-held Servo Software, Inc. (formerly named db4objects, Inc.), which included an open source object database software solution targeting the embedded device market. Our principal executive offices are located at 255 Shoreline Drive, Suite 450, Redwood City, California 94065 and our telephone number is (650) 232-2400.
Our website URL is www.versant.com. Except as otherwise expressly set forth in this annual report on Form 10-K, the information contained in, or referred to on, our website is not a part of this report.
We conduct most of our administrative operations from our U.S headquarters in Redwood City, California and the offices of our German subsidiary, Versant GmbH in Hamburg, Germany. Our research and development activities are primarily conducted by our German subsidiary, Versant GmbH. In September 2009, a restructuring plan was undertaken to consolidate the Company's research and development efforts into one location in Germany and to close a facility in India. This restructuring plan was substantially completed as of April 30, 2010.
Industry Background
Computerized data management has evolved significantly over the past few decades. As business computing became more sophisticated, network and hierarchical databases emerged in the 1970s to serve growing business data requirements. In the 1980s, these types of databases were largely superseded by relational database technology, which continues to be a widely prevalent database technology today. The mid to late 1980s saw the emergence of object-oriented software programming. In object-oriented programming, smaller software building blocks called “objects”, which can perform specific functions, are aggregated with other objects in order to create larger software systems. With the advent of object-oriented software programming, it became possible to incorporate the unique features and advantages of object-based software into database management solutions. Our principal products are object-based database management software solutions, which we believe have advantages over relational database technology. In particular, we believe that object-based database management solutions are especially well suited for successfully addressing the complex and challenging data management and analytical requirements of companies who need to rapidly source, update, analyze and use very large changing bodies of complex data for a wide variety of business applications.
Certain Industry Terms
For reference purposes we have listed below certain well-known technical terms often used in our data management industry to assist readers in better understanding the information provided in this report:
• | API - means application program interface, a software source code interface that an operating system provides to enable other software programs to use and access the functionality of that operating system. |
• | Application Server - deployment software used to build and deploy Internet applications, including commercial |
5
websites, internal company websites and applications requiring a higher degree of scalability than is typically deployed in support of solutions for smaller user populations.
• | Big Data - The collection of technologies that handle data volumes well beyond the inflection point when traditional data management systems fail because requirements for processors, memory and disks escalate as data volume grows. Data sets grow in size and complexity because they are increasingly being gathered by ubiquitous information-sensing mobile devices, aerial sensory technologies and wireless sensor networks. |
• | Cache - performance enhancing software that works with servers to improve their response times and throughput. |
• | Cores - a multicore chip, i.e., a computer chip that contains more than one central processing unit, allowing for highly efficient increases in computing power on a single chip in contrast to a chip containing one single central processing unit. |
• | Data Integration - a broad term for a variety of techniques that enable the data from one software system to be transferred and/or used in other software systems. |
• | Disk mirroring - a technique using specialized software, and often specialized hardware, to get the same data on two storage disks for the purpose of increasing the reliability or making a quick snapshot (duplicate backup) of a database. |
• | Fault tolerant server - a server that offers higher reliability through the use of duplicated hardware and specialized software, so that, in the event of a failure of one system, the surviving duplicated system takes over without any significant service interruption. |
• | Java - a software programming language originally developed by Sun Microsystems. |
• | J2EE-based - an application or software component that is deployed in a Java 2 Enterprise Edition (J2EE) software environment. |
• | JDO - Java Data Objects, a standard-based Java API for Versant. |
• | JDBC - Java Database Connectivity, a standard in the relational database world for embedding SQL statements into Java application programs. |
• | JPA - a Java programming language framework managing relational data in applications using Java Platform, Standard Edition and Java Platform, Enterprise Edition. |
• | JVI - Java Versant Interface, a proprietary-based Java API for the Versant Database Server. |
• | Object-Oriented - object-oriented software uses smaller building blocks called objects to create larger software systems. |
• | ODBC - Open Database Connectivity, a standard in the relational database world for embedding SQL statements into a computer language. |
• | Relational Database - data management software that stores data as tables and columns and can be accessed using SQL. |
• | Replication - a range of technical approaches that enable multiple databases to be approximately synchronized, and to eventually contain the same data. |
• | SNMP - is an "Internet-standard protocol for managing devices on IP networks. Devices that typically support SNMP include routers, switches, servers, workstations, printers, modem racks and more." SNMP is used mostly in network management systems to monitor network-attached devices for conditions that warrant administrative attention. |
• | SQL - an industry standard data definition, data manipulation and query language used to retrieve and manage large data sets, typically used in relational database management systems. |
• | Versant JPA - Versant's implementation of the JPA standard as a pure Java client for the Versant Database Server. |
6
• | XML - a standard format used to exchange data (information) between multiple software systems. |
Overview of Our Products and Services
We provide sophisticated data management solutions designed to address complex data management needs. Our Versant Object Database product is used primarily by larger enterprises which have significant large-scale data management requirements, such as technology providers, telecommunications carriers, government defense agencies, defense contractors, healthcare companies and companies in the financial services and transportation industries. Since the incorporation of Poet's FastObjects solution into our product line in March 2004, we expanded the scope of our solutions to also address the data management needs of smaller systems. With our acquisition of db4o in December 2008, we added a database solution for the embedded space, (which, for example, includes database solutions for platforms such as mobile smart phones and media tablets), which we plan to continue to develop and support. In 2012 and future years, our new product roadmap includes plans for the development of application programming interfaces and server technologies specifically geared toward enhancing the ability of enterprises to ingest, manage and analyze very large data sets at near real-time.
The data management needs of our customers usually involve many business functions, ranging from usage and management of the customer's internal data to the processing of externally originated information such as customer enrollment, billing and payment transaction data. Our solutions have also been used to solve complex data management and analysis problems such as fraud detection, risk analysis, yield management, and a host of other problems that require an application specific data management solution.
In addition to our product offerings, to assist users in their development and deployment of applications based on the Versant Object Database, FastObjects and db4o, we offer a variety of related professional services, including consulting, training, and technical support services. We also provide customers with maintenance and support services with respect to our products.
Benefits of Versant Solutions
Our products provide customers the following benefits for specialized data management:
• | High Performance. Our object-based architecture provides direct access or navigation to stored objects. The balanced client-server architecture of Versant products enhances performance by efficiently distributing processing burdens between clients and servers to leverage the processing power of networked computers. |
• | Highly Scalable Support for Distributed Computing. Our products can work in various environments ranging from small workgroup operations to operations involving thousands of users over the Internet or wide area networks. This scalability can be achieved through object-level operations and other design features. |
• | Reliability, Availability and Serviceability. Our Versant Object Database product offers a number of features designed to permit continuous operation, including features providing online backup and recovery and online modification of the database system, system utilities that can operate while the system is running and replication and disk mirroring provided by a Fault Tolerant Server. |
• | Language-Independent Support for Object-Oriented Programming. Our products provide native support for the leading object-oriented software development languages of C++, Microsoft .NET and Java. This facilitates rapid and flexible application development by our customers and the maintenance and evolution of complex and dynamic applications that closely model real-world systems and processes. |
• | Support for Component Architectures. The Versant Object Database client integrates with leading J2EE application servers, including IBM WebSphere, BEA Weblogic and Red Hat JBoss application servers. These application servers enable users to build and deploy J2EE-based applications that will work compatibly and directly with the Versant Object Database in order to gain our productivity and performance advantages. |
• | Support of Major Operating Systems. Versant products operate on a wide range of server platforms, including UNIX platforms from Sun Microsystems, Hewlett-Packard and IBM, Linux platforms from Red Hat, and Microsoft Windows platforms. |
• | Support of Major Embedded Operating Systems. Selected versions of Versant's products operate on a wide range of handheld platforms, including J2ME, Microsoft Compact Framework, and Google's Android. |
7
Products
Versant Object Database (VOD)
VOD, an eighth generation object database management system, is Versant's flagship product and is designed to support multi-user, commercial applications in distributed computing environments. VOD enables users to store, manage, and distribute information that often cannot be administered effectively through traditional database technologies, including the following types of information:
• | real-time data, graphics, images, video, audio and unstructured text; |
• | dynamic, graph-oriented data, such as network management data and advanced financial instruments; and |
• | meta-data, data aiding integration of diverse systems, and workflow information, which together |
• | enable the construction of applications that integrate diverse systems and add new functionality, often making this functionality available over the Internet. |
The object-oriented, balanced client-server architecture of VOD provides the basis for high-performance, scalable distributed applications. We believe that VOD's performance is superior compared to relational database management systems, particularly for complex data applications, for which VOD has the capability of processing a wide variety of abstract data types in a highly concurrent, high performance manner. We also believe that the use of VOD allows our customers to reduce the time they need to develop applications for their data management systems and improves their system performance.
VOD implements a variety of enterprise database features, including two-phase commitment for distributed transaction integrity and “database triggers” to monitor changing events and data and to notify users and applications when specified events occur. In addition, on-line management utilities enable routine maintenance to be performed while the database is running. These include utilities to perform backup operations, manage log files, dynamically evolve database schema, add, delete and compress volumes on disk storage and related functions. These utilities provide multiple levels of administrative access and application security.
Version 8.0 of VOD includes our core object database management system, C++ and Java language interfaces (proprietary JVI and standards-based JDO), and XML for import and export of data into the database. By bundling these components with VOD, we believe we are enhancing the solution that we are offering, thereby making it easier for customers to deploy applications requiring these components.
As part of the VOD family of solutions, we also offer a range of add-on options that a customer can use in situations requiring advanced capabilities, including the following:
• | Versant FTS (Fault Tolerant Server) provides highly reliable operations in mission-critical environments. This product provides transparent failure recovery by connecting database clients to synchronized copies of the database stored on physically separate servers. If one of the servers fails due to operating system failure, hardware breakdown or any other form of interruption, the other server continues operation without application interruption. When the failed server is restored, the two servers automatically resynchronize and resume normal operations without any interruption in application processing. |
• | Versant Management Center is an add-on tool for the monitoring of Versant Object Databases, following the standard managing console/remote agent paradigm. The remote agent resides on the Versant server system, while the managing console is a graphical interface running on a Versant client system to display the ongoing activity of the monitored database. The tool also supports industry standard formats for monitoring known as SNMP and can be integrated with other third party SNMP enabled monitoring tools. |
• | Versant Asynch Server supports both master-slave and peer-to-peer asynchronous replication between multiple Versant Object Database servers. This can be used to replicate data to a distributed recovery site or to replicate data between multiple local servers for increased performance and reliability. |
• | Versant Compact allows the online compaction of production database data volumes required for special categories of applications that are performing heavy data deletions. This option allows customers to ensure continuous operations at required performance levels by eliminating performance degradation due to fragmentation, a common problem for databases in this application category. |
8
• | Versant SQL provides JDBC/ODBC driver connectivity, allowing the use of standard SQL enabled tooling to access VOD. This is especially useful for customers who use industry standard reporting tools such as Crystal Reports and Microsoft Access. |
• | Versant HA Backup (High Availability Backup) enables VOD to use the mirroring and backup features of other enterprise storage systems to take an online backup of very large data volumes within seconds, without impacting transaction response times. |
FastObjects
FastObjects is an object database management system designed to provide minimal administration and to work natively with the customer's product. The primary target application for our FastObjects product line is for use as an embedded data management system to be integrated in a customer's products. FastObjects is used in a vast range of applications, including medical devices, vending machines, telecom equipment, and defense systems. The majority of FastObjects installations are now running under the Microsoft Windows Operating System.
db4o
db4o is an open source object database that enables Java and .NET developers to store and retrieve any application object with only one line of code, eliminating the need to predefine or maintain a separate, rigid data model. The db4o product targets embedded applications and embedded operating system deployments.
Services
We derived approximately 45% of our revenues from services in fiscal 2011, predominantly from maintenance services. Our services include maintenance and support programs for our data management products, consulting services and the development of customer-specific extensions to our products.
Maintenance Services. We provide maintenance and technical support services for our products that are generally available at an annual fee that varies depending on the type and level of support the customer requires. Maintenance and support contracts, which typically have twelve-month terms, are offered concurrently with the initial license of our product and entitle a customer to telephone support, product upgrades, and documentation updates. For additional fees, customers may purchase a special support package that provides dedicated support engineers and telephone support available for 24 hours per day and seven days a week. Maintenance contracts are typically renewable annually and typically are paid for in advance for all products, but in some instances maintenance and support fees are paid in arrears. For the support of older versions of our products, we offer specific obsolescence support options.
Professional Services. We also provide a variety of training and consulting services to assist customers in the design, development, training and management of applications that are built based on our core products. Training services are offered for a variety of Versant-specific and other object-related technologies and range from beginning to advanced levels. Consulting services are available for analysis and design assistance, mentoring and technical information transfer, application coding, design reviews and performance analysis. In addition, we provide custom development services to customers that request unique or proprietary product extensions.
Our Customers
We categorize our customers into two broad groups, End-Users and Value Added Resellers (“VARs”). End-Users are companies who use our products internally and do not redistribute our products outside their corporate organizations. VAR customers, on the other hand, include traditional Value Added Resellers, Systems Integrators, OEMs and other vendors who redistribute Versant products to third party customers, either individually or as part of an integrated product.
We license our data management products through two types of perpetual and time-based licenses - development licenses and deployment licenses. Development licenses, typically licensed on a per seat basis, authorize a customer to develop an application program that uses our software product. Under a deployment license, a customer is permitted to deploy an application that it has developed under a development license from us. End-Users generally purchase deployment licenses based on the number of central processing units (CPUs or Cores) accessing the server that will run the application using our database management system. For certain applications, we offer deployment licenses priced on a per user basis. Pricing of Versant Object Database and FastObjects varies according to several factors, including the number of CPUs/Cores per server on which the applications run, and the number of users that are able to access the server at any particular time. Pricing of db4o
9
also varies according to several factors, including the number of users that are able to access the server at any particular time. However, due to the open source nature of the db4o product, for db4o at this time we only offer use/deployment licenses (and not development licenses).
VARs license development software from us on a per seat basis and on terms similar to those of development licenses that we license directly to End-Users. VARs are authorized to sublicense directly to the End-User deployment copies of our data management products, which are either bundled or embedded in the VARs' applications. VARs are required to report the distribution of our software to us and are charged a royalty that is based either on the number of copies of the application software that are distributed or computed as a percentage of the selling price charged by the VAR to its end-user customers. These royalties may be prepaid in full or paid upon deployment.
Frequently, a significant portion of our total revenues has been derived from a limited number of large organizations who tend to change from year to year. In fiscal year 2011, one customer accounted for 10% of our total revenues in the first quarter; two customers accounted for 15% and 14%, respectively of our total revenues in the second quarter; two customers accounted for 11% and 11%, respectively, of our total revenues in the third quarter; and one customer accounted for 15% of our total revenues in the fourth quarter. One customer accounted for 12% of our total revenues for the fiscal year ended October 31, 2011.
In fiscal year 2010, one customer accounted for 13% of our total revenues for the first quarter; two customers accounted for 12% and 17%, respectively, of our total revenues for the second quarter; one customer accounted for 15% of our total revenues for the third quarter; and two customers accounted for 12% and 13%, respectively, of our total revenues in the fourth quarter. One customer accounted for 12% of our total revenues for the fiscal year ended October 31, 2010. In fiscal year 2009, no one customer accounted for 10% or more of our total revenues for the fiscal year or in any fiscal quarter as we experienced smaller average license transactions in fiscal 2009.
Our Vertical Markets
Versant Object Database and FastObjects are licensed for development or deployment, or both, and db4o is licensed only for deployment, in a wide range of application categories. A substantial amount of our sales is for applications in the telecommunications, technology, healthcare, defense, transportation, financial services and media sectors. Many of our customers have licensed multiple copies of our products for use in different applications.
Our future performance will depend in significant part on achieving increased usage and sales of the Versant Object Database and FastObjects in telecommunications, technology, healthcare, government and defense, transportation, financial market applications, media, and online gaming, the continued acceptance of our products within these industries and achieving use and acceptance of our products in other industries such as the energy sector. Our performance will also be affected by the success of our planned development of new product offerings and the adoption of those products to solve the Big Data problems of our current and future vertical markets.
Sales and Marketing
Sales Channels. We market and sell our products principally through our direct sales force and through value-added resellers, systems integrators, and distributors.
Direct Sales. Our direct sales organization is based in our corporate offices in Redwood City, California and Hamburg, Germany, and in other offices in the U.S. and Europe. The direct sales organization includes field sales personnel, who are responsible for account management, and systems engineers, who answer technical questions and assist customers in running benchmarks against competitive products and in developing prototype applications.
Indirect Sales. Part of our sales strategy is to further develop indirect distribution channels, such as value-added resellers and systems integrators who address new markets or industries. Systems integrators may integrate our products with their own products or those of other vendors, in order to provide a complete solution to their customers. Under their agreements with Versant, value-added resellers and systems integrators are typically not subject to any minimum purchase or resale requirements and can cease marketing our products at any time. Some of our value-added resellers and systems integrators offer products they produced by themselves or by other vendors, which may in some cases compete with our products. In addition we distribute our products in certain markets through distributors who resell our products without integrating them in other solutions.
Marketing. The primary objective of our marketing efforts is to build increased visibility for Versant and its products and to generate sales leads for our business. Our marketing programs have included our efforts at cultivating media and analyst
10
relations, fostering valuable investor communications, speakers' programs, online marketing, partner-marketing programs, sponsoring database technology scholarship programs at the university level, participation in conferences and tradeshows and in some cases preparation of white papers or other marketing / advertising initiatives targeting a discrete industry or market.
Sales Process. The cycle for a complete sale of our products to new and large enterprise customers can often exceed six months and may extend to a year or beyond. For existing customers with successfully deployed applications, sales cycles for new applications of our core products are generally shorter. During the sales cycle, meetings involving both Versant technical and management staff are conducted frequently at the prospective customer's site and at our offices. As part of their product selection process, our prospective customers typically perform a detailed technical evaluation or benchmark of our object-based technologies, often directly comparing them to competitive products. Upon completion of the evaluation, a customer that chooses our solution may license one or more development licenses, which entitle the customer to develop applications that use a Versant software product. The number of development licenses a customer may acquire depends upon the number of programmers who will develop and build the customer's application. Additionally, a customer may purchase technical support, training courses and consulting services. Our customers may also purchase deployment licenses from us that enable them to sell and market product applications developed under a Versant development license. In some cases our customers purchase deployment licenses at the same time they acquire development licenses. In other cases customers may instead defer their purchase of deployment licenses and related maintenance until they complete the application development under their development license (a process that typically takes at least six months and can exceed one year).
Shipping and Backlog. Our software may be either physically or electronically delivered to the customer. If physically delivered, our software product is shipped from either our Redwood City or Hamburg facilities and is delivered to the customer upon receipt of an approved order and a signed license agreement. We typically do not have a material backlog of unfilled license orders at any given time, and we do not consider backlog to be a meaningful indicator of our future performance.
International Sales and Marketing. Our international sales are primarily recorded by our subsidiary in Germany, which sells our products through distributors and value-added resellers, as well as directly to end-users. In fiscal 2009, we partnered with a distributor in China and in 2011 with a distributor in India to access potential long-term growth opportunities in those geographic regions. For fiscal 2011, our international revenues derived from customers outside North America made up approximately 60% of our total revenues, compared to 60% for fiscal 2010 and 62% for fiscal 2009. Risks particularly associated with our international sales are discussed below in Item 1A under the risk factor captioned “International Operations pose unique risks”.
Competition
Our software products compete with products of companies offering object and relational database management systems. Our competitors, especially Oracle and Progress Software, have longer operating histories, significantly greater financial, technical, marketing, service and other resources, significantly greater name recognition, broader product offerings, larger and more established distribution channels and a larger installed base of customers than does Versant. In addition, many of our competitors have well-established relationships with our current and potential customers and may offer broader suites of products with a wide array of complementary applications which may incentivize customers to purchase these competitors' data management products. We will encounter competition from new sources such as 10gen, IBM, EMC, HP and Teradata as the implementation of our new Big Data strategy brings us into new marketplaces. We may not be able to compete successfully against current or future competitors, and competitive pressures could have a material adverse effect on the business, pricing, operating results and financial condition of the company.
Research and Development
Currently our research and development activities are conducted primarily in Hamburg, Germany and consist primarily of the development of enhancements of and improvements to our existing product line, (quality assurance engineering) and development of add-on option solutions used with our principal products. Our new Big Data strategic initiative will require significant investment in research and development to develop analytics software, application programming interfaces and server technologies to manage Big Data sets. Consequently, in order to pursue this initiative, Versant expects to increase its research and development expenses from 2011 levels by approximately 40% in 2012. In fiscal 2011, fiscal 2010 and fiscal 2009, our research and development expenses were $3.9 million, $3.8 million and $4.0 million, respectively. Our research and development expenses consist primarily of personnel and related expenses, including payroll and employee benefits, expenses for facilities and payments made to outside software development contractors and, to a lesser degree, depreciation of capital equipment.
11
Intellectual Property and Other Proprietary Rights
We consider our products to be proprietary. We attempt to protect our technology by relying primarily on a combination of copyright and trademark laws, trade secrets, confidentiality procedures and contractual provisions to protect our proprietary technology. For example, we license our software pursuant to signed license agreements and, to a lesser extent, “shrink-wrap” licenses displayed in evaluation downloads and in software installation screens, which impose certain restrictions on the licensee's ability to utilize our software. In addition, we take steps to avoid disclosure of our trade secrets, such as requiring persons with access to our proprietary information to execute non-disclosure agreements, and we restrict access to our software source code. We seek to protect our software, documentation and other written materials under trade secret and copyright laws, which afford only limited protection. We were awarded a United States patent (No. 5,822,759) for our proprietary cache system used within our product suites, which expires in 2015. We also have certain trademarks and service marks for certain of our products and services.
Employees
As of October 31, 2011, we and our subsidiaries had a total of 65 full time employees, of whom 24 were based in the United States and 41 in Europe. As of October 31, 2011, 33 employees were engaged in engineering and technical services, 18 were engaged in sales and marketing and the remaining 14 were engaged in general administration and finance. To the best of our knowledge, none of our employees is represented by a labor union. We have not experienced any organized work stoppage to date and believe that our relationship with our employees is generally good.
Our future performance depends mostly upon the continued service of our key technical, sales, and senior management personnel. The loss of the services of one or more of our key employees could have a material adverse effect on our business, operating results and financial condition.
Restructuring
In September 2009, a restructuring plan was undertaken to consolidate the Company's research and development efforts into one location in Germany in order to streamline operations, create management efficiencies and increase productivity. The Company committed to closing its research and development facility in Pune, India and winding down the affairs of its subsidiary, Versant India Private Limited. The restructuring was substantially completed during the second fiscal quarter ended April 30, 2010. See Note 12 of our “Notes to Consolidated Financial Statements” in Item 8 of this report for more information regarding this transaction.
Investor Information
We are subject to the informational requirements of the Securities Exchange Act of 1934, or the “Exchange Act” pursuant to which we file our periodic reports on Forms 10-Q, 10-K, 8-K, proxy statements and other information with the Securities and Exchange Commission, or “the SEC”. These reports, proxy statements and other information may be obtained by visiting the Public Reference Room of the SEC at 100 F Street, NE, Room 1580, Washington, DC 20549. Information on the operation of the SEC's Public Reference Room may be obtained by calling the SEC at 1(800) SEC-0330. In addition, the SEC maintains an Internet site (at http://www.sec.gov) that contains reports, proxy and information statements and other information regarding issuers that file electronically.
Information regarding our revenues, net income, total assets and other financial information for our fiscal years ended
October 31, 2011, 2010 and 2009 can be found in Item 8 of this report on Form 10-K, which is incorporated here by reference.
Financial and other information about Versant can also be accessed at our Investor Relations website. The address of Versant's website is: (www.versant.com). We make available, free of charge, copies of our annual reports, annual reports on Forms 10-K, quarterly reports on Forms 10-Q, current reports on Form 8-K and amendments to those reports, filed or furnished pursuant to Section 13(a) or 15(d) of the Exchange Act, as soon as reasonably practicable after filing such materials with the SEC.
12
Item 1A. Risk Factors
This annual report on Form 10-K contains forward-looking statements regarding the Company that involve risks and uncertainties, including, but not limited to, those set forth below in this Item 1A, that could cause our actual results of operations and financial condition to differ materially from those contemplated in the forward-looking statements. The risks and uncertainties set forth below should be carefully considered when evaluating our business and prospects.
Current economic conditions may harm our business and results of operations. Global economic conditions and financial markets have continued to be challenging to the enterprise software market, as many economies and financial markets continue to experience a deep recession stemming from a multitude of factors, including adverse credit conditions, slower economic activity, concerns about the debt levels and financial viability of certain European countries and the instability of financial institutions and other businesses, inflation and deflation, continuing high rates of unemployment, reduced corporate capital spending, adverse business conditions and liquidity concerns and other factors. Recovery of economic growth in the U.S. and many other countries has remained very slow and the length of time these adverse economic conditions may persist are unknown. During challenging economic times and in tight credit markets, many prospective customers delay or reduce technology purchases. This has resulted, and could continue to result in, reductions in sales of our products and services, longer sales cycles, smaller sales levels, difficulties in collection of accounts receivable, slower adoption of new technologies and increased price competition. Continued softness in corporate information technology spending would have a direct adverse impact on our business and any of the events described above in this paragraph would likely materially harm our business, including by decreasing our revenues, decreasing cash provided by operating activities and negatively impacting our liquidity. We cannot predict the duration of these economic conditions or the impact they will have on our customers or business.
Efforts to expand and diversify our product line may adversely affect our operating results and may not result in the development of successful new products. In 2012 and future years we plan to develop new products in order to expand and diversify our product offerings beyond our existing core products, VOD, FastObjects and db4o. The new software that we propose to develop will require substantial research and development, marketing and sales expenditures, and in some cases product acquisition and technology licensing costs, with no assurance that we will receive incremental additional revenue from such new products. Developing successful new products will require us to incur significant marketing expenditures to determine the viability of such new products and applications and target customers, as well as substantial research and development expenditures and additional sales expense associated with selling new products. A significant portion of such expenses would likely be incurred well in advance of our recognition of any revenues from such new products, and thus are likely to adversely affect our results of operations and cash flows for certain fiscal periods. In addition, there can be no assurance that any new products will be successfully developed, accepted in the marketplace or generate meaningful amounts of revenue or net income. Failure to develop successful new products may adversely affect our reputation and our ability to successfully market other products and our future revenues. Consequently, the Company must act carefully when making product or technology development decisions. In December 2008 we acquired the db4o database assets of Servo Software, with the objective of giving us a new product, as well as access to new customers and additional revenue opportunities. However the financial costs of this acquisition and associated operational costs have adversely affected our results of operations for fiscal years 2011, 2010 and 2009 and may continue to do so.
We are dependent on a limited number of products, especially Versant Object Database or “VOD”. Most of our license revenues to date have been derived from our VOD product, its predecessors and related products that add to or extend the capabilities of VOD. Consequently, if our ability to generate revenues from VOD were negatively impacted, our business, cash flows and results of operations would be materially and adversely affected. Many factors could negatively impact our ability to generate revenues from Versant Object Database, including without limitation softness in demand in the North American or European markets for enterprise software, the current instability in the global economy and any slowness in the U.S. or European economies or in key industries we serve, such as the telecommunications and information technology industries, the success of competitive products of other vendors, reduction in the prices we can obtain for our products due to competitive or economic factors, the adoption of new technologies or standards that make our products technologically obsolete and customer reluctance to invest in object-oriented technologies. Although we have taken steps to diversify our product line through our 2004 acquisition of Poet and its FastObjects data management product and our December 2008 acquisition of db4o, we still expect that sales of VOD will continue to be very critical to our revenues for the foreseeable future. Accordingly, any significant reduction in revenue levels from our VOD product can be expected to have a material negative impact on our business and results of operation. It is possible that our efforts to develop and market our proposed new products for Big Data applications could divert attention from our continued development, sales and marketing efforts for VOD, and any failure by the Company to devote sufficient effort to VOD development, sales and marketing efforts could have an adverse impact on VOD sales and the Company's overall revenues and financial condition.
13
We depend on successful technology development. We believe it will be necessary for us to increase significantly our research and development expenditures in order for us to develop the new products outlined in our strategic roadmap. While we believe our research and development expenditures will result in new salable product, because of the uncertainty of software development projects and risks posed by the current economic downturn, these expenditures will not necessarily result in successful product introductions or sustained or increased revenue levels. Uncertainties affecting the success of software development project introductions include risks of technical difficulties, delays in the introductions of new products, potential product errors, market conditions, competitive products, and customer acceptance of and demand for new products and the operating systems they run on. We also face certain challenges in integrating third-party technology embedded in our products. These challenges include the technological challenges of integration, which may result in development delays, and uncertainty regarding the economic terms of our relationship with our third-party technology providers, which may result in delays of the commercial release of new products. In addition, if we are required to adopt cost-conservation measures, we may be compelled to reduce the amount of our investment in research and development activities, which could adversely affect our ability to maintain the competitiveness of our existing products, our ability to develop new products (including without limitation the new proposed products outlined in our strategic roadmap) and our future research and development capabilities. Failure to continue to timely develop technologies and products necessary for us to remain competitive is likely to have a material and adverse effect on our business.
Reduced demand for our products and services may prevent us from achieving targeted revenues and profitability. Our revenues and our ability to achieve and sustain profitability depend on continuing or increasing the level of overall demand for the software products and services we offer. Demand for our product line may be reduced due to alternative technologies offered by competitors, negative customer perception of our object-oriented technology or other causes, including economic conditions that adversely affect the industries of our most significant customers, such as the defense and telecommunications industries. In addition, we have experienced continued hesitancy on the part of our existing and potential customers to commit to additional products or services from us, particularly in our North American markets. Any significant reduction in the demand for our products or services would have a material adverse effect on our business and results of operations.
Our products face significant competition from larger competitors. Our VOD, FastObjects and db4o products compete with products of other companies that offer database management systems. We face substantial competition from substantially larger and well-established relational database management companies including Oracle, Computer Associates, Sybase, IBM, and Microsoft. We also face competition from object database companies including Progress Software Corporation and Objectivity. Additionally, some of our prospective customers might attempt to build specialized data storage capability themselves using their own internal engineering resources, sometimes starting with low level operating system functionality, and other times utilizing lower level data storage routines that are commercially available, such as Oracle Berkeley DB, a simplified database without query processing capability. Many of our competitors have longer operating histories, significantly greater financial, technical, marketing, service and other resources, better and wider name recognition, broader suites of product offerings, stronger sales and distribution channels and a much larger installed base of customers than ours. In addition, many of our competitors have well-established relationships with our current and potential customers. Our competitors may be able to devote greater resources to the development, promotion, and sale of their products. They may also have more direct access to corporate decision-makers of key customers based on their previous relationships with these customers. Our competitors may also be able to respond more quickly to new or emerging technologies and changes in customer requirements, and may have the competitive advantage of being able to sell products competitive to ours through package sales of a suite of a variety of products for different applications that we do not offer. We may not be able to compete successfully against our current or future competitors, and competitive pressures could cause us to lose revenues or lower the prices for our products to increase or maintain our sales revenues, or to take other market-responsive actions, any of which could have a material adverse effect on our business, operating results and financial condition.
Our customer concentration increases the potential volatility of our operating results. Due to the nature of our products a significant portion of our total revenues has been, and we believe will continue to be, derived from a limited number of significant orders placed by large organizations. For example, in fiscal year 2011, one customer accounted for 10% of our revenues in the first quarter; two customers accounted for 15% and 14%, respectively of our total revenues in the second quarter; two customers accounted for 11% and 11%, respectively, of our total revenues in the third quarter; one customer accounted for 15% of our total revenues in the fourth quarter; and one customer accounted for 12% of our total revenues for the fiscal year ended October 31, 2011. Similarly, in fiscal year 2010, one particular customer accounted for 13%, 12%, 15% and 9% of our total revenues in the first, second, third and fourth fiscal quarters of that fiscal year, respectively, and 12% of total revenues for that fiscal year. A different customer accounted for 17% of our total revenues in the second fiscal quarter of 2010 and two other customers accounted for 12% and 13%, respectively, of our total revenues in our fourth fiscal quarter of 2010. The timing of large orders and their fulfillment has caused, and in the future is likely to cause, material fluctuations in our operating results, particularly on a quarterly basis. In addition, our major customers tend to change from year to year. The loss of any one or more of our major customers, or our inability to replace a customer making declining purchases with a new
14
customer of comparable significance, could each have a material adverse effect on our business.
Our quarterly revenue levels and operating results are not predictable and have resulted in volatility in our stock price. Our revenues and, in some cases, our operating results, have fluctuated (in some cases significantly) on a quarterly basis, and we expect this trend to continue. For example, in fiscal 2011, our quarterly revenues fluctuated from a high of $4.6 million in the first quarter of 2011 to a low of $3.5 million in the second quarter of 2011. These quarterly fluctuations can result in volatility in our stock price and result from a number of factors, including but not limited to the following:
• | delays by our customers (including customers who are resellers) in signing revenue-bearing contracts that were expected to be entered into in a particular fiscal quarter and, in particular, the timing of any significant sales transactions; |
• | the status of the market for enterprise software and general macroeconomic factors that impact our potential customers' capital purchasing decisions for information technology ( or “IT”) solutions, such as our products, which may result in fewer licenses or smaller license transactions; |
• | the lengthy sales cycle associated with our products, which complicates our ability to accurately forecast the timing of our revenues; |
• | changes in customer purchasing patterns, such as customers' selecting lower levels of maintenance and support services; |
• | fluctuations in domestic and foreign demand for our products and services, particularly in the telecommunications and defense markets; |
• | customer and market perceptions of the value and currency of object-oriented software technology; |
• | uncertainty regarding the timing and scope of our customers' deployment of VOD-based applications, where our revenues are contingent upon the customer's deployment of our product; |
• | any failure by us to timely develop and launch successful new products; |
• | the impact of new product introductions, both by us and by our competitors; |
• | our unwillingness to lower our prices significantly to meet reduced prices set by our competitors or to successfully meet other competitive market conditions; |
• | the effect of the publication by industry writers or others of their opinions about us, our products, our competitors and our competitors' products; |
• | customer deferrals of orders for our products or services in anticipation of our product enhancements, or the pending release of new product versions or new product offerings by us or our competitors; |
• | the extent to which we do or do not complete tasks under contracts for consulting projects which must be completed in order for us to recognize certain revenues under such contracts; |
• | failure to transition db4o customers to other Versant products; and |
• | potential customers' unwillingness to invest in our products given our size and assets. |
We have previously experienced revenues and earnings results that were significantly below levels expected by investors, which have had an immediate and significant adverse effect on the trading price of our common stock. This may occur again in the future. Additionally, as a significant portion of our revenues are often realized late in a fiscal quarter, we may not be aware of any revenue shortfall until late in a fiscal quarter and an unanticipated announcement of such a revenue shortfall, could result in an even more immediate and adverse effect on the trading price of our common stock.
Our future revenues are substantially dependent upon our installed customers continuing to license Versant products and renew their maintenance agreements for our products. Our future professional services and maintenance revenues are dependent on future sales of our software products. We depend heavily on our installed customer base for future revenues from licenses of additional products or upgrades of existing products and from related fees for the renewal of maintenance and support agreements. If our existing customers do not purchase additional products, upgrade existing products or renew their maintenance and support agreements with us, this could materially and adversely affect our business and revenues and our future quarterly and annual operating results. The terms of our standard license arrangements provide for a one-time license fee and a prepayment of one year of software maintenance and support fees. Our maintenance agreements are generally renewable annually at the option of the customer, and there are no minimum payment obligations or obligations to license additional software. Therefore, our current customers may not necessarily generate significant maintenance revenues in future periods if
15
they choose not to renew our maintenance services or renew them at lower service levels that generate lower revenues. This risk may be increased in the case of long-term customers who have not upgraded our products which they license. In addition, our customers may choose not to purchase additional products, upgrades or professional services. Our professional services and maintenance revenues are also dependent upon the continued use of our products by our installed customer base. Consequently, any downturn in our software license revenues would likely have a corresponding negative impact on the growth of our professional service and maintenance revenues.
We plan to substantially increase our research and development, and sales and marketing efforts and related expenses in fiscal 2012, which is likely to adversely affect our operating results in fiscal 2012 and may continue to adversely affect our operating results thereafter if these efforts are unsuccessful. As part of our 2012 strategic new product initiative, we expect to develop database software related to very large data problems and plan to make significant investments in research and development in order to execute on this initiative. Specifically, we currently have plans to increase our research and development spending levels by approximately 40% in fiscal 2012 compared to the prior fiscal year. In addition as we did in fiscal 2011, in fiscal 2012 we again anticipate increasing our sales and marketing efforts and associated sales and marketing expense in order to enter into the Big Data market, attract new customers and to find new applications for our products with existing customers. We currently have plans to increase our sales and marketing spending levels by approximately 30%, in fiscal 2012 compared to fiscal 2011. While we anticipate receiving benefits from these additional research and development, and sales and marketing investments over the medium term, we do not expect to generate meaningful revenues from our new product initiative in fiscal 2012, and we currently expect that our total revenues in fiscal year 2012 will remain at approximately 2011 levels. Consequently as a result of these planned investments, we currently estimate that we will experience a net loss of approximately $1.7 to $1.9 million for the fiscal year ending October 31, 2012, and we expect our net cash from operating activities for fiscal year 2012 to be minimal. If our enhanced research and development and sales and marketing activities do not result in additional revenues and new customers, the related increased research and development and sales and marketing expenses associated with these efforts would likely adversely affect our results of operations over the medium to longer term. Further, even if our increased research and development and sales and marketing efforts are successful, we do not expect to recognize revenue from our new strategic product initiative until sometime in fiscal 2013, and due to the relatively long sales cycle of our products, the benefit of these efforts likely will not be meaningfully realized until future fiscal periods, so that such increased research and development and sales and marketing expenses will still be likely to adversely affect our results of operations in the fiscal periods in which they are incurred. Without limitation, the estimates, forecasts and other statements in this paragraph are forward-looking statements.
Our products have a lengthy sales cycle. The sales cycle for our VOD, FastObjects and db4o products varies substantially from customer to customer and similar long sales cycles can be expected for new products developed pursuant to our new Big Data product initiative. This sale cycle often exceeds six months and can sometimes extend to a year or more, especially for sales to defense sector customers. Due in part to the critical and strategic nature of our products and the level of expenditures associated with their purchase, our potential customers are typically very cautious in making decisions to acquire our products. In order for us to influence our customers' decision to license our products we often must provide a significant level of education to prospective customers regarding the uses and benefits of our products, and we frequently commit to provide that education without any charge or reimbursement. Generally, pre-sales support efforts, such as assistance in performing benchmarking and application prototype development, are also conducted with no charge to customers. Because of the lengthy sales cycle for our products and the relatively large average dollar size of our individual licenses, a lost or delayed sales transaction could potentially have a significant negative impact on our operating results for a particular fiscal period.
We may not be able to manage our costs effectively given the unpredictability of our revenues. We expect to continue to maintain a relatively high percentage of fixed expenses. We expect our research and development and our sales and marketing expenses to increase substantially as we invest in efforts to develop new products and expand our customer base. Consequently, if our forecasted revenue does not materialize, our business, financial condition and results of operations will be materially harmed.
We rely on revenues from the telecommunications and to a lesser degree, certain other industries; and these industries are characterized by complexity, intense competition and changes in purchasing cycles. Historically, we have been highly dependent upon the telecommunications industry and, more recently, we are also becoming increasingly dependent upon the information technology, medical, transportation and finance industries, for sales of VOD. Our success in these markets depends, to a large extent, on general economic conditions affecting these industries, our ability to successfully compete with other technology providers of solutions that directly compete with, or provide alternatives to, our products, our ability to develop products that can successfully interoperate in different computing environments and the continued belief by our existing and potential customers that we have the expertise and financial stability necessary to provide effective solutions and support in these markets on an ongoing basis. If any of these conditions, among others, are not satisfied, we may not be successful in generating additional opportunities in these markets. As previously noted, the current global economy is in a
16
recession and, in the past, general economic downturns have also adversely affected our ability to generate revenues from customers in the telecommunications and other industries. In addition, the types of applications and commercial products needed by the telecommunications industry and other markets we address are continuing to develop and are rapidly changing, and these markets are characterized by an increasing number of new entrants whose products may compete with ours. As a result, we cannot predict the future growth of (or whether there will be future growth in) these markets, and demand for object-oriented databases applications in these markets may not develop or be sustainable. We also may not be successful in attaining a significant share of these markets due to competition and other factors, such as our limited size and working capital. Moreover, potential customers in these markets generally develop sophisticated and complex applications that require substantial consulting expertise to implement and optimize. There can be no assurance that we can hire and retain adequate skilled personnel to provide such ongoing consulting services.
We rely on a substantial portion of our revenues being generated through our international operations and will continue to do so in the future. A large portion of our revenues is derived from customers located outside North America, and it is critical for us to maintain these international revenues. Following our 2004 acquisition of Poet, which had a strong European presence, international revenues have represented a larger percentage of our total revenues than they had prior to that time. Consequently, we maintain a significant portion of our workforce in Germany and must conduct our operations internationally and maintain a significant presence in international markets. In each of fiscal 2011 and fiscal 2010, international revenues derived from customers outside North America made up approximately 60% of our total revenues for each such fiscal year, and international revenues comprised 62% of our total revenues in fiscal 2009. Most of our non-North American revenues are derived from Europe, but we have taken initial steps to develop new distribution channels in China and India in an effort to expand our customer base and future revenues. We have substantially less experience in the sale and marketing of our products and services in Asia and India and there can be no assurance that our efforts to develop new customers there will be successful or will not result in increased sales and marketing costs that may not generate corresponding revenue, which would adversely affect our operating results. We expect international revenues to continue to be critical to our operations and cash flows.
International Operations pose unique risks. Our international operations are subject to a number of unique risks in addition to the risks faced by our domestic operations. These risks include, but are not limited to the following areas:
• | fluctuations in foreign exchange rates; |
• | longer receivable collection periods; |
• | adverse changes in regulatory requirements; |
• | dependence on independent resellers; |
• | compliance with multiple and conflicting laws, regulations and technology standards in different jurisdictions, some of which are more burdensome and restrictive than U.S. laws; |
• | costs and difficulties in adapting and translating product documentation and materials to meet local market requirements; |
• | import and export restrictions, tariffs, local taxes and other regulatory restrictions; |
• | difficulties in, and increased costs of, staffing and managing foreign operations; |
• | potentially adverse tax consequences arising from international operations and inter-company transactions; |
• | the burdens of complying with a variety of foreign laws, including more protective employment laws affecting our sizable workforce in Germany; |
• | limited ability to enforce agreements, intellectual property rights and other rights in some foreign countries; and |
• | the impact of business cycles, economic and political instability and potential hostilities outside the United States. |
In addition, in light of increasing concerns about global security and terrorism, and the extended global economic downturn, there may be additional risks of disruption to our international sales activities. Any prolonged disruption in the markets in which we derive significant revenues may potentially have a material adverse impact on our revenues and results of operations.
In order to be successful, Versant must attract, retain and motivate key employees, for whom competition is intense; and failure to do so could seriously harm the Company, particularly given the smaller size of our executive management team. In order to effectively execute our business strategy, we must attract, retain and motivate our executives and other key employees, including those in managerial, sales and technical positions. Our future performance depends in significant part upon the continued service of our key technical, sales and senior management personnel. The loss of the services of one or more of our key employees could have a material adverse effect on our business, particularly so given the relatively smaller
17
size of our executive management team, which currently consists of Bernhard Woebker, our President and Chief Executive Officer, and Jerry Wong, our Vice President Finance, Chief Financial Officer and Secretary. Our future success also depends on our continuing ability to attract, train and motivate highly qualified technical, sales and managerial personnel. Constraints on our ability to offer compensation at levels that may be offered by larger competitors and other circumstances may adversely affect our ability to attract and retain key management in the future. We must continue to motivate our employees and keep them focused on the achievement of our strategies and goals. We now employ a sizable German workforce subject to German employment law, which generally provides greater financial protection to terminated employees than does United States law. Consequently, failure to retain our German employees may cause us to incur significant severance costs, which could adversely affect our operating results and financial condition.
Our personnel, management team and operations are located in different countries and as a result, we may experience difficulty in coordinating our activities and successfully implementing Company goals. Following our 2004 merger with Poet, we acquired significant operations and personnel in Europe and now have approximately 41 employees based in Europe, whose activities must be well coordinated with those of our U.S. workforce and our other employees. The significant geographic dispersion of our management team and our workforce may make it more difficult for us to successfully manage our long-term objectives, coordinate activity across the Company, and integrate our operations and business plans, and causes us to incur certain additional travel and other expenses to maintain communications between our various offices.
An impairment loss could have a material adverse impact on our financial condition and results of operations. The continued global economic instability, resulting in, among other things, lower demand for our offerings and disruption of capital and credit markets could significantly affect our stock price and market capitalization. It is possible that further sustained declines in our stock price would result in a goodwill impairment loss that could have a material adverse impact on our financial condition and results of operations.
We are subject to litigation and the risk of future litigation. Litigation can be expensive to defend, can consume significant amounts of management time and can result in judgments or settlements that could have adverse effects on our results of operations, financial condition and cash reserves. We are subject to potential litigation claims and the resulting costs and distraction. For example, during fiscal 2006, we settled a litigation that commenced in the last quarter of fiscal 2004 when we were sued by Systems America, Inc., a privately held company, in an action which alleged that, prior to our acquisition of a smaller privately-held company in November 2002, persons associated with that company misappropriated trade secrets and confidential information of Systems America, unfairly competed with Systems America with respect to its customer relationships, and infringed Systems America's trademarks and trade names. Additionally, during fiscal 2008, we settled another related litigation in which a prior customer was seeking indemnification from us for costs the customer had incurred in defending a suit brought against it by Systems America Inc., which alleged that a Versant product that was discontinued in 2004 infringed Systems America's intellectual property. Such settlements can adversely affect our operating results and reduce our cash reserves.
Our ability to use our net operating loss carry forwards and certain other tax attributes may be limited. Under Section 382 of the Internal Revenue Code of 1986, as amended, if a corporation undergoes an “ownership change” (generally defined as a greater than 50% change (by value) in its equity ownership over a three year period), the corporation's ability to use its pre-change net operating loss carry forwards and other pre-change tax attributes (such as research tax credits) to offset its post-change income may be limited. We may experience ownership changes in the future as a result of shifts in our stock ownership which are beyond our control. As a result, if we earn net taxable income, our ability to use our pre-change net operating loss carry forwards to offset United States federal taxable income may be subject to limitations, which could potentially result in increased tax liability to us in the future. In addition the State of California has in certain cases suspended the ability to utilize net operating loss carry forwards in the current (and certain past) tax years and could do so again in the future.
Although we believe our internal control over financial reporting is effective, there remain risks that our controls may become inadequate. Since we are required to assess our internal control over financial reporting on an annual basis, any future adverse results from such an assessment could result in a loss of investor confidence in our financial reports and have an adverse effect on our stock price. Pursuant to Section 404 of the Sarbanes-Oxley Act of 2002 (“SOX 404”), and the rules and regulations promulgated by the SEC to implement SOX 404, we are required to furnish an annual report in our Form 10-K regarding the effectiveness of our internal control over financial reporting. The report's assessment of our internal control over financial reporting as of the end of our fiscal year must include disclosure of any material weaknesses in our internal control over financial reporting identified by management. Management's assessment of internal control over financial reporting requires management to make subjective judgments and therefore, we may have difficulties in accurately assessing the effectiveness of our internal controls. In addition, if we are unable to assert that our internal control over financial reporting is effective, we could lose investor confidence in the accuracy and completeness of our financial reports, which would have an adverse effect on our stock price.
18
Adoption and application of accounting regulations and related interpretations and policies regarding revenue recognition could cause us to defer recognition of revenue or recognize lower revenues and profits. Although we use standardized license agreements designed to meet current revenue recognition criteria under generally accepted accounting principles, we must often negotiate and revise terms and conditions of these standardized agreements, particularly with new customers and in multi-element or multi-year transactions. Negotiation of mutually acceptable terms and conditions with our customers can extend the sales cycle for our products and, in certain situations, may require us to defer recognition of revenue on such licenses. We believe that we are in compliance with ASC 985-605, Software, Revenue Recognition; however, these future, more complex, multi-element, multi-year license transactions, which may require additional accounting analysis to account for them accurately, could lead to unanticipated changes in our current revenue accounting practices and may contain terms affecting the timing of our revenue recognition.
Failure to adequately protect our intellectual property could impair our ability to successfully compete. Despite our efforts to protect our proprietary rights, third parties may attempt to misappropriate or copy aspects of our products or our technologies, obtain or wrongfully use information we regard as proprietary or use or make unauthorized copies of our products or technologies in violation of license agreements. Policing unauthorized use of our products is difficult and enforcing our proprietary rights is potentially expensive. In addition, we conduct a substantial portion of our business outside the United States and the laws of many jurisdictions do not protect our proprietary rights to as great an extent as do the laws of the United States. Shrink-wrap licenses may be wholly or partially unenforceable under the laws of certain jurisdictions and copyright and trade secret protection for software may be unavailable or very difficult to effectively enforce in certain foreign countries. Our means of protecting our proprietary rights may not be adequate, and our competitors may independently develop similar technologies, which they could then market and sell to our customers, which could have an adverse impact on our revenues.
We may be subject to claims of intellectual property infringement. Developers of software such as the Company are frequently subject to intellectual property infringement claims as the number of products, competitors and patents in our industry sector grows. Intellectual property infringement litigation can also arise when we acquire businesses or assets. For example, in 2004 we were the subject of a suit alleging that a company we purchased misappropriated intellectual property and the plaintiff in that litigation also brought an action against one of our customers on related facts, which resulted in that customer making a claim for indemnification against us. Although these suits were settled, any claim of this type, whether meritorious or not, could be time-consuming, could result in significant litigation expenses, could cause product shipment delays and require us to enter into royalty or licensing agreements or pay amounts in settlement of the claims or pursuant to judgments, which could adversely affect our results of operations. If any of our products or technologies were found to infringe third-party rights, royalty or licensing agreements to use such third-party rights might not be available on terms acceptable to us, or at all, and we might be enjoined from marketing an infringing product or technology, each of which circumstances could have a material adverse effect on our business, operating results and financial condition.
Our use of open source software could negatively impact our ability to sell our products. The products, services or technologies we acquire, license, provide or develop may incorporate or use open source software. We monitor our use of open source software in an effort to avoid unintended consequences, such as reciprocal license grants, patent retaliation clauses, and the requirement to license our products at no cost. There is relatively little or no legal precedent for interpreting the terms of these open source licenses, whose terms may be difficult to interpret or apply, therefore we may be subject to unanticipated obligations regarding our products that incorporate open source software. In addition, disclosing the content of our source code could limit the intellectual property protection we can obtain or maintain for that source code or the products containing that source code and could facilitate intellectual property infringement claims against us.
We may engage in future acquisitions of businesses or assets that could dilute our shareholders and cause us to incur debt or assume contingent liabilities. As part of our strategy, we may from time to time review opportunities to buy other businesses or technologies that would complement our current products, expand the breadth of our markets or enhance our technical capabilities, or that may otherwise offer us growth opportunities. In the event of any future acquisitions, we potentially might take any or all of the following actions:
• | pay amounts of cash to acquire assets or businesses; |
• | issue stock that would dilute current shareholders' percentage ownership; |
• | incur debt; and/or |
• | assume liabilities. |
19
Such acquisitions also involve numerous risks, including the following:
• | problems combining the acquired operations, technologies or products or integration of new personnel; |
• | the incurrence of substantial transaction costs to effect such acquisitions; |
• | the incurrence of unanticipated costs in completing such acquisitions or in inheriting unforeseen liabilities and expenses of acquired businesses; |
• | diversion of management's attention from our core business; |
• | adverse effects on existing business relationships with suppliers and customers; |
• | risks associated with entering markets in which we have no or limited prior experience; and |
• | potential loss of key employees of purchased organizations. |
For example, in December 2008 we acquired for cash from privately-held Servo Software Inc., assets associated with Servo Software's db4o open source database solution for the embedded device market. We acquired these assets with the objective of expanding our product line and obtaining access to new customers and additional revenue opportunities. However this acquisition continues to be subject to many of the risks of acquisitions outlined above, including the fact that this product may generate losses for future fiscal periods and adversely affect our results of operations.
There can be no assurance that we will be able to successfully integrate the db4o business or any other businesses, products or technologies that we might purchase in the future.
Charges to earnings resulting from our acquisition of businesses or assets may adversely affect the market value of our common stock. In accordance with U.S. generally accepted accounting principles, we account for our merger with Poet, our acquisition of FastObjects, Inc. and our fiscal 2009 acquisition of the db4o assets of Servo Software using the purchase method of accounting, which result in charges to earnings that could have a material adverse effect on the market value of our common stock. Under the purchase method of accounting, we have allocated the total estimated purchase price of Poet, FastObjects and db4o to net tangible assets and amortizable intangible assets based on their fair values as of the respective dates of the closing of these acquisitions, and recorded the excess of the purchase price over those fair values as goodwill. We will incur additional amortization expense over the useful lives of certain intangible assets acquired in connection with db4o, which will extend into future fiscal years. In addition, to the extent the value of goodwill or intangible assets is impaired we may be required to incur material charges relating to the impairment of those assets. Such amortization and potential impairment charges could have a material impact on our results of operations.
Our common stock is listed on the NASDAQ Capital Market. The listing of our common stock on The NASDAQ Capital Market may be perceived as a negative by investors and may adversely affect the liquidity and trading price of our common stock. We may be unable to list our common stock on The NASDAQ Global Market System, or NGMS.
The nature of the trading market for our stock makes our stock price volatile. We have a relatively smaller number of holders of our stock and the market for our common stock is characterized by relatively small sales volumes, which contributes to the volatility of our stock price and its sensitivity to larger trades of stock. During fiscal years 2009, 2010 and 2011, our Board of Directors approved annual stock repurchase programs under which the Company repurchased an aggregate total of approximately $10.5 million worth of our outstanding common shares, and in November 2011, our Board of Directors approved a new stock repurchase program pursuant to which the Company is authorized to potentially repurchase up to $5.0 million of its common stock in fiscal 2012. Repurchases of our shares will reduce the number of our outstanding common shares and might incrementally increase the potential for volatility in our stock by reducing the potential volumes at which our common shares may trade in the public markets.
The Company may face risks associated with the trend of increased shareholder activism. Publicly traded companies have increasingly become subject to campaigns by investors seeking to increase short-term shareholder value by advocating corporate actions such as financial restructuring, increased borrowing, special dividends, stock repurchases or even sales of assets or the entire company. Given the Company's market capitalization and other factors, it is possible that shareholders may in the future attempt to effect such changes or acquire control over the Company. Responding to proxy contests and other actions by activist shareholders would be costly and time-consuming, disrupting our operations and diverting the attention of our Board of Directors and senior management from the pursuit of business strategies, which could adversely affect the Company's results of operations and financial condition.
20
Business disruptions could seriously harm our future revenue and financial condition and increase our costs and expenses. Our worldwide operations could be subject to natural disasters and other business disruptions, which could seriously harm our revenue and financial condition and increase our costs and expenses. Our corporate headquarters in Redwood City, California, is located near major earthquake faults. The ultimate impact on us and our general infrastructure of being located near major earthquake faults is unknown, but our revenue, profitability and financial condition could suffer in the event of a major earthquake or other natural disaster. Losses in and interruptions of our business (as well as of our customers' businesses) could also be caused by earthquakes, power shortages, telecommunications failures, water shortages, floods, fires, extreme weather conditions, medical epidemics and other natural or manmade disasters.
Item 1B. Unresolved Staff Comments
None.
Item 2. Properties
Our principal administrative, sales and marketing operations are headquartered at an approximately 6,800 square foot office facility we lease that is located at 255 Shoreline Drive, Suite 450, Redwood City, California 94065. Our current lease of this facility expires in May 2013. In November 2011, we leased an additional 2,500 square feet in the same facility through May 2014 and in January 2012, we leased approximately 1,600 square feet in an office building in Cupertino, California for the twelve months ending January 2013.
Our international subsidiary in Hamburg, Germany entered into a lease which commenced in December 2009 for a term of 60 months ending in November 2014. Our prior Hamburg office lease expired by its terms on December 31, 2009. In January 2011, we entered into a thirty-six month lease for approximately 300 square feet of office space in Munich, Germany.
We believe that all of our current facilities are in reasonably good operating condition and will be adequate for our requirements for the next several years. Based on current commercial real estate market conditions, we believe that we will be able to lease alternative comparable facilities in Germany or in the U.S. if required to do so.
Item 3. Legal Proceedings
We may from time to time be subject to legal proceedings in the ordinary course of business. Currently, we are not subject to any material legal proceedings required to be disclosed under this Item 3.
Item 4. Mine Safety Disclosures
Not applicable.
21
PART II
Item 5. Market for Registrant's Common Equity, Related Stockholder Matters and
Issuer Purchases of Equity Securities.
Price Range of Common Stock
Our common stock is listed on the Nasdaq Capital Market (formerly the Nasdaq SmallCap Market) under the symbol “VSNT.” Our common stock commenced trading on the Nasdaq National Market on July 18, 1996. From July 19, 1999 until March 7, 2000, our common stock was traded on the Nasdaq SmallCap Market. From March 8, 2000 until September 30, 2002, our common stock was traded on the Nasdaq National Market. Our common stock has been traded on the Nasdaq Capital Market since October 1, 2002. We requested that listing of our common stock be transferred to the Nasdaq Capital Market as of October 1, 2002 since at that time it seemed unlikely that, in the near term, we would continue to be able to satisfy the then-applicable listing criteria of the Nasdaq National Market System.
The following table lists the high and low selling price of our common stock, based on the last daily sale reported on the Nasdaq Capital Market for the periods indicated during the last two fiscal years:
High | Low | ||||||
Fiscal year ended October 31, 2011: | |||||||
Fourth quarter | $ | 12.22 | $ | 9.97 | |||
Third quarter | $ | 13.06 | $ | 11.38 | |||
Second quarter | $ | 13.84 | $ | 12.80 | |||
First quarter | $ | 13.97 | $ | 11.07 | |||
Fiscal year ended October 31, 2010: | |||||||
Fourth quarter | $ | 11.94 | $ | 10.58 | |||
Third quarter | $ | 15.05 | $ | 10.63 | |||
Second quarter | $ | 15.58 | $ | 14.35 | |||
First quarter | $ | 19.31 | $ | 14.70 | |||
Shareholders
There were approximately 63 holders of record of our common stock as of January 25, 2012. We believe that a significant number of beneficial owners of our common stock hold their shares in street name.
Dividend policy
We have neither declared nor paid any cash dividends on our common stock in the past. We currently intend to retain future earnings, if any, to fund development and growth of our business and, therefore, do not at this time anticipate that we will declare or pay cash dividends on our common stock in the foreseeable future.
Recent Sales of Unregistered Securities
Versant made no issuances of unregistered securities in fiscal 2011.
Issuer Purchases of Equity Securities
On December 1, 2008, Versant's Board of Directors approved a stock repurchase program authorizing Versant to repurchase up to $5.0 million worth of its outstanding common shares from time to time on the open market, in block trades or otherwise. That stock repurchase program expired by its terms on October 31, 2009. Versant acquired 222,688 common shares on the open market for approximately $3.2 million at an average purchase price of $14.52 per share under this stock repurchase program.
22
On November 30, 2009, our Board of Directors approved a new stock repurchase program authorizing Versant to repurchase up to $5.0 million worth of its outstanding common shares from time to time on the open market, in block trades or otherwise (the “fiscal 2010 stock repurchase program”), which expired by its terms on October 31, 2010. Pursuant to the fiscal 2010 stock repurchase program, Versant acquired 356,104 common shares on the open market and in block trades for approximately $4.3 million at an average purchase price of $12.06 per share.
On November 29, 2010, our Board of Directors approved a new stock repurchase program authorizing Versant to repurchase up to $5.0 million worth of its outstanding common shares from time to time on the open market, in block trades or otherwise (the “fiscal 2011 stock repurchase program”), which expired by its terms on October 31, 2011. Pursuant to this fiscal 2011 stock repurchase program, Versant acquired 240,629 common shares on the open market and in block trades for approximately $3.0 million at an average purchase price of $12.23 per share.
The stock repurchase activity under our stock repurchase program during the three months and fiscal year ended October 31, 2011 is summarized in the following table:
Total Number of Shares Purchased (2) | Average Price Paid Per Share (1) | Total Number of Shares Purchased as Part of Publicly Announced Plan or Program (3) | Maximum Approximate Dollar Value of Shares that May Yet Be Purchased Under the Plan or Program | |||||||||||||||
Period: | ||||||||||||||||||
August 1 - August 31, 2011 | 3,104 | $ | 10.11 | 3,104 | $ | 2,238,081 | ||||||||||||
September 1 - September 30, 2011 | 5,128 | 11.20 | 5,128 | $ | 2,180,672 | |||||||||||||
October 1 - October 31, 2011 | 10,910 | 11.22 | 10,910 | $ | 2,058,286 | |||||||||||||
Three months ended October 31, 2011 | 19,142 | 11.03 | 19,142 | |||||||||||||||
November 30, 2010 - July 31, 2011 | 284,032 | 12.59 | 221,487 | |||||||||||||||
Fiscal year ended October 31, 2011 | 303,174 | $ | 12.49 | 240,629 | ||||||||||||||
1 | Average price paid per share is calculated on a settlement basis and excludes commission. |
2 | On March 28, 2011, the Company repurchased 62,545 shares of its common stock at $13.50 pursuant to the Separation Agreement with its former CEO. |
3 | Except as noted in footnote 2 (regarding a repurchase of stock from Versant's former CEO), all repurchases reflected in the above table were made pursuant to the Company's fiscal 2011 stock repurchase program, which authorizes the repurchase of up to $5,000,000 of common stock. This repurchase program was approved on November 29, 2010 and announced on December 1, 2010 and expired by its own terms on October 31, 2011. |
4 | On November 28, 2011 our Board of Directors approved a new stock repurchase program announced on December 1, 2011 and pursuant to which the Company is authorized to repurchase up to $5.0 million of its common stock in fiscal year 2012. The stock repurchase program is currently scheduled to expire upon the earlier of October 31, 2012, or such time as Versant has expended $5.0 million to repurchase outstanding common shares under the program; however the program may be suspended, discontinued, terminated or extended at any time by the Company. |
23
Securities Authorized for Issuance Under Equity Compensation Plans
The following table sets forth certain information as of October 31, 2011 with respect to compensation plans under which our equity securities are authorized for issuance:
Number of securities to be issued upon exercise of outstanding options, warrants and rights | Weighted-average exercise price of outstanding options, warrants and rights | Number of securities remaining available for future issuance under equity compensation plans (excluding securities reflected in column (a)) | |||||||||||||
(a) | (b) | (c) | |||||||||||||
Plan category: | |||||||||||||||
Equity compensation plans¹ approved by security holders | 650,465 | $ | 15.20 | 375,163 | |||||||||||
Equity compensation plans not approved by security holders | — | — | — | ||||||||||||
Total | 650,465 | $ | 15.20 | 375,163 | |||||||||||
1 Please see Note 10 of our "Notes to Consolidated Financial Statements" in Item 8 of this report for a description of our equity compensation plans. | |||||||||||||||
Stock Price Performance Graph and Cumulative Total Return
The graph below compares the cumulative total shareholder return on Versant common stock with the cumulative total return on the Nasdaq Composite Index and the Nasdaq Computer and Data Processing Index for each of the last five fiscal years ended October 31, 2011, assuming an investment of $100 at the beginning of such period and the reinvestment of any dividends. The comparisons in the graphs below are based upon historical data and are not indicative of, nor intended to forecast, future performance of our common stock.
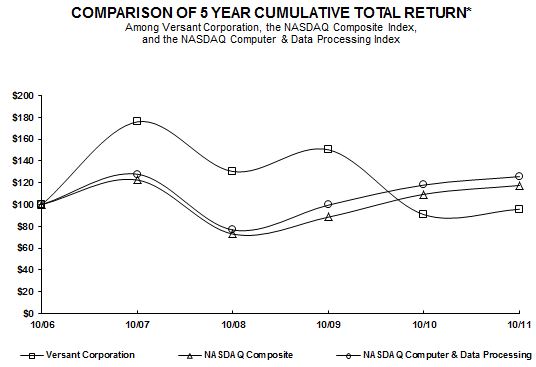
** $100 invested on 10/31/06 in stock or index, including reinvestment of dividends.
Fiscal year ending October 31.
24
Item 6. Selected Financial Data
The following selected consolidated financial data are qualified by reference to, and should be read in conjunction with, “Management's Discussion and Analysis of Financial Condition and Results of Operations” contained in Item 7 of this report and the Consolidated Financial Statements and related Notes of Versant included in Item 8 of this report. The selected consolidated balance sheet data as of October 31, 2011 and 2010 and selected consolidated statements of income data for the years ended October 31, 2011, 2010 and 2009, are derived from our audited consolidated financial statements included elsewhere in this report. The selected consolidated balance sheet data as of October 31, 2009, 2008 and 2007 and the selected consolidated statements of income data for the years ended October 31, 2008 and 2007 were derived from audited consolidated financial statements not included in this report. Our historical results are not necessarily indicative of our future results.
Fiscal Year Ended October 31, | |||||||||||||||||||
2011 | 2010 | 2009 | 2008 | 2007 | |||||||||||||||
Consolidated statements of income data: | |||||||||||||||||||
Total revenues | $ | 16,272 | $ | 15,766 | $ | 18,150 | $ | 25,298 | $ | 21,150 | |||||||||
Gross profit | $ | 14,270 | $ | 13,653 | $ | 15,919 | $ | 23,116 | $ | 19,112 | |||||||||
Income from operations (1, 2, 3) | $ | 946 | $ | 1,971 | $ | 4,045 | $ | 9,951 | $ | 7,664 | |||||||||
Income from continuing operations before income taxes | $ | 984 | $ | 2,121 | $ | 4,277 | $ | 10,822 | $ | 8,196 | |||||||||
Net income from continuing operations (4) | $ | 702 | $ | 1,654 | $ | 4,839 | $ | 9,391 | $ | 7,329 | |||||||||
Net income | $ | 702 | $ | 1,654 | $ | 4,839 | $ | 9,489 | $ | 7,633 | |||||||||
Per share data: | |||||||||||||||||||
Net income from continuing operations, basic | $ | 0.23 | $ | 0.48 | $ | 1.33 | $ | 2.52 | $ | 2.01 | |||||||||
Net income from continuing operations, diluted | $ | 0.23 | $ | 0.48 | $ | 1.32 | $ | 2.48 | $ | 1.98 | |||||||||
Net income, basic | $ | 0.23 | $ | 0.48 | $ | 1.33 | $ | 2.54 | $ | 2.09 | |||||||||
Net income, diluted | $ | 0.23 | $ | 0.48 | $ | 1.32 | $ | 2.51 | $ | 2.06 | |||||||||
October 31, | ||||||||||||||||||||
2011 | 2010 | 2009 | 2008 | 2007 | ||||||||||||||||
Consolidated balance sheets data: | ||||||||||||||||||||
Cash and cash equivalents | $ | 23,145 | $ | 24,911 | $ | 27,812 | $ | 27,234 | $ | 19,086 | ||||||||||
Total assets (5) | $ | 36,636 | $ | 39,129 | $ | 41,373 | $ | 38,561 | $ | 30,466 | ||||||||||
Total long-term liabilities | $ | 178 | $ | 205 | $ | 272 | $ | 374 | $ | 674 | ||||||||||
Total shareholders' equity (6,7,8,9) | $ | 32,535 | $ | 34,444 | $ | 36,257 | $ | 33,154 | $ | 23,165 | ||||||||||
(1) Restructuring charges of approximately $25,000, $39,000 and $139,000 were recorded in fiscal 2011, 2010, and 2009, respectively. | ||||||||||||||||||||
(2) In fiscal 2007, a loss on the liquidation of a foreign subsidiary of approximately $245,000 was recorded. | ||||||||||||||||||||
(3) In fiscal 2008, a charge of $800,000 to settle litigation was recorded in operating expenses. | ||||||||||||||||||||
(4) In fiscal 2009, we released approximately $939,000 of the valuation allowance against our net deferred tax assets. | ||||||||||||||||||||
(5) In fiscal 2009, we acquired the assets of db4o for approximately $2.6 million. $2.4 million of the acquisition costs were paid in fiscal 2009 and $180,000 of the acquisition costs were paid in fiscal 2010. | ||||||||||||||||||||
(6) In fiscal 2009, we repurchased 222,688 shares of Versant common stock for approximately $3.2 million. | ||||||||||||||||||||
(7) In fiscal 2010, we repurchased 356,104 shares of Versant common stock for approximately $4.3 million. | ||||||||||||||||||||
(8) In fiscal 2011, we repurchased 240,629 shares of Versant common stock for approximately $3.0 million. | ||||||||||||||||||||
(9) In fiscal 2011, we repurchased 62,545 shares of Versant common stock for approximately $844,000 pursuant to a separation agreement with our former CEO. | ||||||||||||||||||||
25
Item 7. Management’s Discussion and Analysis of Financial Condition and Results of Operations
As indicated in the paragraph above Item 1 of this report, this report on Form 10-K (including this Item 7) contains certain forward-looking statements within the meaning of the Securities Exchange Act of 1934 and Section 27A of the Securities Act of 1933. These forward-looking statements include, among other things, statements regarding the Company's expected future financial performance, assets, liquidity and trends anticipated for the Company's business. These statements are based on the Company's current expectations, assumptions, estimates and projections about the Company's business, the Company's industry and the market for the Company's goods and services, which are based on information that is reasonably available to the Company as of the date of this report. Forward-looking statements may include words such as "believes," "anticipates," "expects," "intends," "plans," "will," "may," "should," "estimates," "predicts," “forecasts,” "guidance," "potential," "continue" or the negative of such terms, other variants of such terms or other similar expressions.
We caution readers that these forward-looking statements are not assurances of our future performance or financial condition and are subject to and involve significant known and unknown risks, uncertainties and other factors that may cause the Company's actual operating results, financial condition, levels of activity, performance or achievement to be materially different from any future operating results, financial condition, levels of activity, performance or achievements that are expressed, estimated, forecasted, projected, implied in, anticipated or contemplated by the forward-looking statements. These known and unknown risks, uncertainties and other factors include, but are not limited to, those risks, uncertainties and factors discussed in Item 1A of this report under the heading “Risk Factors.” Readers are urged to carefully review and consider the various disclosures made by us in this report and in our other reports filed with the Securities and Exchange Commission that attempt to advise interested parties of the risks and factors that may affect our business, financial performance or financial condition. Versant undertakes no obligation to revise or update any forward-looking statement in order to reflect events or circumstances that may arise or occur after the date of this report.
Background and Overview
We design, develop, market and support high performance, object-oriented database management software solutions and provide related maintenance and professional services. Our products and services address the complex data management needs of enterprises and providers of products requiring data management functions. In December 2011, we announced a strategic product roadmap in which we have outlined our plans to create database software related to very large data problems. The goal of this new product development strategy is to extend Versant's proven ability to provide data solutions for large, distributed systems to emerging so called Big Data and near real-time analytical application opportunities. Our products and services collectively comprise our single operating segment, which we call “Data Management.”
Our end-user customers typically use our products to manage data for business systems and to enable these systems to access and integrate data necessary for the customers' data management applications. Our data management products and services offer customers the ability to manage real-time, XML and other types of hierarchical and navigational data. We believe that by using our data management solutions, customers cut their hardware costs, accelerate and simplify their development efforts, significantly reduce administration costs and deliver products and services with a significant competitive edge.
Our Data Management business is currently comprised of the following key products:
• | Versant Object Database or “VOD”, previously known as VDS, an eighth generation object-oriented database management system that is used in high-performance, large-scale, real-time commercial applications in distributed computing environments. We also offer several optional ancillary products for use with Versant Object Database to extend its capabilities, provide compatibility and additional protection of stored data. |
• | FastObjects, an object-oriented database management system that can be embedded as a high performance component into customers' applications and systems. |
• | db4o, an open source object-oriented database software solution targeting the embedded device market. |
Our Versant Object Database product offerings are used primarily by larger organizations, such as technology providers, telecommunications carriers, government defense agencies, defense contractors, healthcare companies and companies in the financial services and transportation industries, each of which have significant large-scale data management requirements. With the incorporation of the FastObjects solution into our product line following our March 2004 merger with Poet Holdings, Inc., we expanded the scope of our solutions to also address the data management needs of smaller business systems. By our acquisition of db4o in December 2008, we further expanded the scope of our solutions to include the embedded device market.
26
In December 2011, we announced a new strategic product roadmap under which we plan to develop database software products to address very large data problems. Versant plans to develop these new products in order to provide data management software that enables the development of analytical application for the intelligent "real-time enterprise."
Our customers' data management needs can involve many business functions, ranging from management of the use and sharing of a company's internal enterprise data to the processing of externally originated information such as customer enrollment, billing and payment transaction data. Our solutions have also been used to solve complex data management issues such as fraud detection, risk analysis and yield management and can be adapted for use with many different applications.
In addition to our product offerings, we provide maintenance and technical support services to assist users in using our products. We also offer a variety of consulting and training services to assist users in developing and deploying applications based on Versant Object Database, FastObjects and db4o.
We license our products and sell associated maintenance, training and consulting services to end-users through our direct sales force and through value-added resellers, systems integrators and distributors.
In addition to these products and services, we resell related software developed by third parties. To date, substantially all of our revenues have been derived from the following data management products and related services:
• | Sales of licenses for Versant Object Database and FastObjects; |
• | Maintenance and technical support services for our products, including db4o; |
• | Consulting and training services; |
• | Nonrecurring engineering fees received in connection with providing services associated with Versant Object Database; |
• | The resale of licenses, and maintenance, training and consulting services for third-party products that complement Versant Object Database; |
• | Reimbursements received for out-of-pocket expenses, which we incurred and are recorded as revenues in our statements of income. |
Negative and Uncertain Global Economic Conditions Are Continuing to Impact Our Business
Global economic developments like the recent recessions and debt crises in the U.S. and Europe have continued to adversely effect the enterprise software market. Economic growth in the U.S. and many other countries has remained very slow and the length of time these adverse economic conditions may persist is unknown. Our business has been negatively affected by these ongoing worldwide economic conditions. It is unclear when or to what extent the macroeconomic environment may improve. During fiscal year 2011 our selling environment remained very challenging. We are seeing continuing pressures on our customers’ budgets, and as they are facing uncertainty and cost pressures in their own businesses, some of our customers are deferring purchases of our products or electing less expensive levels of our maintenance services. The current difficult and uncertain economic conditions are causing some of our customers to face financial challenges and they may continue to face such challenges for the foreseeable future. The current economic uncertainty could continue to harm our business, operating results and financial condition in the foreseeable future.
Financial Highlights for Fiscal Year 2011
• | Our net revenues in fiscal year 2011 were $16.3 million, an increase of $506,000 (or 3%) from net revenues of $15.8 million in fiscal year 2010. This increase in revenues arose from an increase in license revenue as a result of a modest global increase in the average license volume per customer. One customer accounted for 12% of our total revenues for the fiscal year ended October 31, 2011. |
• | Our net income for fiscal year 2011 was $702,000 compared to a net income of $1.7 million in fiscal year 2010. The decrease in net income in fiscal year 2011 was primarily due to the planned $846,000 expansion of our sales and marketing activities and the $470,000 of nonrecurring separation costs related to the departure of our former CEO, partially offset by a modest increase in revenues. |
27
• | Cash provided by operations in fiscal year 2011 was $2.6 million compared to $2.3 million in fiscal year 2010. This increase in cash provided by operations in fiscal year 2011 was primarily due to an approximate $1.0 million decrease in trade accounts receivable in fiscal year 2011 compared to an approximate $1.0 million increase in trade accounts receivable in fiscal year 2010, partially offset by the $1.0 million decrease in net income and a $606,000 decrease in liabilities in fiscal year 2011. |
• | Cash used in investing activities in fiscal year 2011 was $775,000 compared to $645,000 in fiscal year 2010. The increase in cash used in investing activities was primarily due to a $295,000 increase in purchases of equipment and software that was partially offset by a decrease in cash used in investing activities due to the fact that the remaining contingent cash payments of approximately $180,000 related to our acquisition of the db4o assets were made in fiscal year 2010 and no such corresponding payments were made in fiscal year 2011. |
• | Cash used in financing activities in fiscal year 2011 was $3.6 million compared to $4.1 million in fiscal year 2010. The decrease in cash used in financing activities in fiscal year 2011 when compared to fiscal year 2010 was due to a decrease of approximately $514,000 in funds used to repurchase shares of our common stock pursuant to our stock repurchase programs, together with an increase of $41,000 in the proceeds we received from issuance of common stock. During fiscal year 2011, our cash and cash equivalents balance decreased by $1.8 million to $23.1 million at October 31, 2011 compared to $24.9 million at October 31, 2010. |
Fiscal Year 2012 and Beyond
During fiscal year 2012, we expect to focus our sales and marketing efforts on our data management products, (Versant Object Database, FastObjects and db4o), on related maintenance, consulting and training services and the launch of new products currently being developed to address Big Data problems. Versant Object Database was the key focus of our marketing efforts and the major source of our license and service revenues in fiscal year 2011.
We again expect to derive most of our revenues in fiscal year 2012 from Versant Object Database, FastObjects and db4o licenses and related services. Like many other software companies, we do not operate with a significant backlog of orders. Our license revenues, in particular, are difficult to forecast. The outlook into the Company's anticipated performance in fiscal year 2012 is uncertain, due principally to the prolonged worldwide economic instability. As part of our 2012 strategic initiative, we expect to develop database software related to very large data problems. Versant plans to make significant investments in research and development in order to execute on our new strategic initiative and additional marketing resources are also necessary to make the initiative a success. Versant anticipates revenues from this initiative beginning in fiscal year 2013.
Versant plans to increase its research and development as well as its sales and marketing spending levels by approximately 40% and 30%, respectively, in fiscal year 2012 compared to the prior fiscal year. The Company expects to recognize benefits from these additional investments over the medium term, and currently expects its total revenues in fiscal year 2012 to remain at approximately 2011 levels. As a result of these investments, we currently estimate a net loss of approximately $1.7 to $1.9 million for the fiscal year ending October 31, 2012. Versant expects net cash from operating activities for fiscal year 2012 to be minimal. Without limitation, the estimates, forecasts and other statements in this paragraph are forward-looking statements.
Critical Accounting Policies and Estimates
The preparation of our consolidated financial statements requires us to make estimates and judgments that affect the reported amount of our assets and liabilities at the date of our financial statements and of our revenues and expenses during the reporting period covered by our financial statements. We base these estimates and judgments on information reasonably available to us, such as our historical experience and trends, industry, economic and seasonal fluctuations and on our own internal projections that we derive from that information. Although we believe our estimates to be reasonable under the circumstances, there can be no assurances that such estimates will be accurate given that the application of these accounting policies necessarily involves the exercise of subjective judgment and the making of assumptions regarding many future variables and uncertainties. We consider “critical” those accounting policies that require our most difficult, subjective or complex judgments, and that are most important to the portrayal of our financial condition and results of operations. These critical accounting policies relate to revenue recognition, goodwill and acquired intangible assets, and income taxes.
28
Revenue Recognition
We recognize revenues in accordance with accounting principles generally accepted in the United States of America (“GAAP”), as set forth in:
• | Accounting Standards Codification (ASC) 985-605, Software, Revenue Recognition; and |
• | ASC 605-35, Revenue Recognition, Construction-Type and Production-Type Contracts |
Our revenues consist mainly of revenues earned under software license agreements, maintenance support agreements (otherwise known as post-contract customer support or “PCS”) and, to a lesser degree, agreements for consulting and training activities.
We use the residual method to recognize revenues when a license agreement includes one or more elements to be delivered by us at a future date. If there is an undelivered element under the license arrangement, we defer revenues based on vendor-specific objective evidence (“VSOE”) of the fair value of the undelivered element, as determined by the price charged when the element is sold separately. If VSOE of fair value does not exist for all undelivered elements of a transaction, we defer all revenues from that transaction until sufficient evidence of the fair value exists or until all elements have been delivered. Under the residual method, discounts are allocated only to the delivered elements in a multiple element arrangement, with any undelivered elements being deferred based on the vendor-specific objective evidence of the fair value of such undelivered elements. We typically do not offer discounts on future undeveloped products.
We have established VSOE of fair value of our PCS as evidenced by stand-alone renewal transactions using the “bell shaped curve approach.” PCS of our Versant Object Database is priced as a percentage of the original software license fees. We perform quarterly analysis on a transaction by transaction basis to document the range of pricing in PCS renewals. We conclude that we have established VSOE of fair value for our PCS, if substantial majorities (greater than 80%) of our stand-alone renewal transactions are priced within a reasonably narrow range (plus or minus 15% from the midpoint of the range). For the year ended October 31, 2011, the pricing of over 95% of our stand-alone PCS renewal transactions fell within the predefined pricing range.
Revenues from software license arrangements, including prepaid license fees, are recognized when all of the following criteria are met:
• | Persuasive evidence of an arrangement exists. |
• | Delivery has occurred and there are no future deliverables except PCS. |
• | The fee is fixed and determinable. If we cannot conclude that a fee is fixed and determinable, then assuming all other criteria have been met, we recognize the revenues as payments become due in accordance with ASC 985-605. |
• | Collection is reasonably assured. |
If an acceptance period or other contingency exists, revenues are not recognized until customer acceptance or expiration of the acceptance period, or until satisfaction of the contingency, as applicable. Our license fees are generally non-cancelable and non-refundable. Also, our customer agreements for prepaid deployment licenses typically do not make payment of our license fees contingent upon the actual deployment of the software. Therefore, a customer's delay or acceleration in its deployment schedule generally does not impact our revenue recognition in the case of a prepaid deployment license.
Revenues from related PCS for all product lines are usually billed in advance of the service being provided and are deferred and recognized on a straight-line basis over the term in which the PCS is to be performed, which is generally twelve months. In some cases PCS revenues are paid in arrears of the service being provided and are recognized as revenues at the time the customer provides a report to us for deployments made during a given time period. Training and consulting revenues are recognized when a purchase order is received, the services have been performed and collection is deemed probable. Consulting services are billed on an hourly, daily or monthly rate. Training classes are billed based on group or individual attendance.
We categorize our customers into two broad groups, End-Users and Value Added Resellers (VARs). End-User customers are companies who use our products internally and do not redistribute our product outside of their corporate organizations. VAR
29
customers include traditional Value Added Resellers, Systems Integrators, Original Equipment Manufacturers (“OEMs”) and other vendors who redistribute our products to their external third party customers, either separately or as part of an integrated product.
We license our data management products through two types of perpetual licenses - development licenses and deployment licenses. Development software is typically licensed on a per seat basis and authorizes a customer to develop and test an application program that uses our software product. Before an End-User customer may deploy an application that it has developed under our development license, it must purchase deployment licenses in which the license fees are based on the number of computers connected to the server that will run the application using our product, or for certain applications, are based on the number of users. Pricing of Versant Object Database and FastObjects licenses varies according to several factors, including the number of computer servers on which the application runs and the number of users that are able to access the server at any one time. Customers may elect to simultaneously purchase development and deployment licenses for an entire project. These development and deployment licenses may also provide for prepayment to us of a nonrefundable amount for future deployment.
VARs and distributors license development software from us on a per seat basis on terms similar to those of development licenses that we sell directly to End-Users. VARs are authorized to sublicense deployment copies of our data management products that are either bundled or embedded in the VAR's applications and sold directly to End-Users. VARs are required to report their distribution of our software and are charged a royalty that is either based on the number of copies of the application software that are distributed or computed as a percentage of the selling price charged by the VARs to their end-user customers. These royalties from VARs may be prepaid in full or paid upon deployment. Our VAR agreements for prepaid royalty arrangements are non-cancelable, non-refundable and do not make payment of our license fees contingent upon the actual deployment of our software, and therefore, the future deployment schedules of our VARs have no impact on revenue recognition of such prepaid royalties. Provided that all other conditions for revenue recognition have been met, revenues from arrangements with VARs are recognized, (i) as to prepaid license arrangements, when the prepaid licenses are sold to the VAR, and (ii) as to other license arrangements, at the time the VAR provides a royalty report to us for sales made by the VAR during a given period.
Revenues from our resale of third-party products or services are recorded at total contract value with the corresponding cost included in the cost of sales when we act as a principal in these transactions by assuming the risks and rewards of ownership (including the risk of loss for collection, delivery or returns). When we do not assume the risks and rewards of ownership, revenues from the resale of third-party products or services are recorded at contract value net of the cost of sales.
On occasion, at a customer's request, we perform engineering work to port our products to an unsupported platform, to customize our software for specific functionality, or to perform other non-routine technical assignments for a customer. In these instances, we recognize revenues in accordance with ASC 605-35, Revenue Recognition, Construction-Type and Production-Type Contracts, and use either the time and material percentage of completion method or the completed contract method for recognizing revenues. We use the percentage of completion method if we can make reasonable and dependable estimates of labor costs and hours required to complete the work in question. We periodically review these estimates in connection with the work performed and rates actually charged and recognize any losses when identified. Progress to completion is determined using the cost-to-cost method, whereby cost incurred to date as a percentage of total estimated cost determines the percentage completed and revenue recognized. When using the percentage of completion method, the following conditions must exist:
• | An agreement must include provisions that clearly specify the rights regarding goods or services to be provided and received by both parties, the consideration to be exchanged and the manner and terms of settlement. |
• | The customer is able to satisfy its obligations under the contract. |
• | Versant is able to satisfy its obligations under the contract. |
The completed contract method is used when reasonable or dependable estimates of labor costs and time to complete the work cannot be made. As a result, in such situations, we defer all revenues until such time as the work is fully completed.
Management makes significant judgments and estimates in connection with the determination of the revenue we recognize in each accounting period. If we had made different judgments or utilized different estimates for any period, material differences in the amount and timing of revenue recognized would have resulted.
30
Goodwill and Acquired Intangible Assets
We account for purchases of acquired companies in accordance with ASC 805, Business Combinations, and allocate the cost of the acquired companies to the identifiable tangible and intangible assets acquired according to their respective fair values as of the date of completion of the acquisition, with the remaining amount being classified as goodwill.
In accordance with ASC 350, Intangibles - Goodwill and Other, we test for any goodwill impairment within our single Data Management operating segment and reporting unit. All our goodwill reflected in the financial statements included in this report has been aggregated from, and acquired in connection with, the following acquisitions:
• | Versant Europe, acquired in 1997; |
• | Poet Holdings, Inc., acquired in March 2004; |
• | Technology of JDO Genie (PTY) Ltd, acquired in June 2004; |
• | FastObjects, Inc., acquired in July 2004; and |
• | db4o, acquired in December 2008. |
Financial Accounting Standards Board (“FASB”) guidance requires that goodwill be tested for impairment at the reporting unit level, at least annually and more frequently upon the occurrence of certain events. We use the market approach to assess the fair value of our assets and this value is compared with the carrying value of those assets to test for impairment. The total fair value of our assets is estimated by summing the fair value of our equity (as indicated by Versant's publicly traded share price and shares outstanding plus an estimated control premium) less our liabilities. Under this approach, if the estimated fair value of our assets is greater than their carrying value, then there is no goodwill impairment. If the estimated fair value of our assets is less than their carrying value, then we allocate the reporting unit's estimated fair value to its assets and liabilities as though the reporting unit had just been acquired in a business combination. The impairment loss is the amount, if any, by which the implied fair value of goodwill allocable to the reporting unit is less than that reporting unit's goodwill carrying amount and would be recorded in operating results during the period of such impairment.
Identifiable intangibles are currently amortized using the straight-line method over five years in relation to the JDO Genie (PTY) Ltd acquisition, six years in relation to the FastObjects, Inc. acquisition, seven years in relation to our acquisition of Poet, nine years in relation to the acquisition of the db4o customer relationships, and five years for other db4o related acquired intangible assets.
We performed our annual valuation and analysis of goodwill in October 2011, October 2010 and October 2009. We did not perform impairment tests related to our intangible assets during fiscal years 2011, 2010 and 2009, as there were no triggering events which might indicate impairment. As a result, we determined that the value of our goodwill and intangible assets had been fairly recorded in our financial statements, and therefore no impairment charges were recorded against our goodwill and intangible assets in fiscal years 2011, 2010 and 2009.
Income Taxes
We account for income taxes using the asset and liability method provided by ASC 740, Income taxes. We estimate our income taxes in each of the jurisdictions in which we operate and account for income taxes payable as part of the preparation of our consolidated financial statements. This process involves estimating our actual current tax expense as well as assessing temporary differences resulting from differing treatment of items, such as depreciation and amortization, for financial and tax reporting purposes. These differences result in deferred tax assets and liabilities, which are included in our consolidated balance sheet to the extent deemed realizable. We assess the likelihood that, and the extent to which, our deferred tax assets will be realized and establish a valuation allowance to reduce deferred tax assets to an amount for which realization is more likely than not. If we establish or release a valuation allowance then we must increase or decrease the tax provision in our statements of income.
Significant management judgment is required in determining any valuation allowance recorded against our net deferred tax assets. Based upon our operating results in recent years and through October 31, 2011 as well as an assessment of our expected future results of operations, we determined that it is more likely than not that we will realize the benefit of a portion of our net deferred tax assets in Germany to the extent of our expected taxable income for fiscal year 2012. Due to uncertainties related to
31
our ability to utilize the balance of our deferred tax assets, we have maintained a valuation allowance at October 31, 2011 of $31.6 million. As of October 31, 2010, we had a valuation allowance of $33.9 million for our deferred tax assets.
As required by ASC 740, Income taxes, we recognize the financial statement benefit of a tax position only after determining that the relevant tax authority would more likely than not sustain the position following an audit. For tax positions meeting the more-likely-than-not threshold, the amount recognized in the financial statements is the largest benefit that has a greater than 50 percent likelihood of being realized upon ultimate settlement with the relevant tax authority.
We are subject to U.S. federal income taxes and to income taxes in various states in the U.S. as well as in foreign jurisdictions. Tax regulations within each jurisdiction are subject to the interpretation of the related tax laws and regulations and require significant judgment to apply. With few exceptions, we are no longer subject to U.S. federal, state and local, or foreign tax examinations by tax authorities for tax years before 2006. With respect to prior tax years no longer subject to examination due to expiration of the statute of limitations, income may nevertheless be recomputed for the purpose of determining the amount of NOL that may be carried over to “open” years.
We recognize interest and penalties accrued related to unrecognized tax benefits in the provision for income taxes for all periods presented, which were not significant.
32
Results of Operations
The following table sets forth the historical results of operations for Versant for our three fiscal years ended October 31, 2011, 2010 and 2009, expressed as a percentage of our total revenues for the fiscal year in question:
Percentage of Revenues | |||||||||
Fiscal Year Ended October 31, | |||||||||
2011 | 2010 | 2009 | |||||||
Revenues: | |||||||||
License | 55 | % | 53 | % | 50 | % | |||
Maintenance | 44 | 46 | 49 | ||||||
Professional services | 1 | 1 | 1 | ||||||
Total revenues | 100 | 100 | 100 | ||||||
Cost of revenues: | |||||||||
License | 2 | 2 | 1 | ||||||
Amortization of intangible assets | 1 | 2 | 2 | ||||||
Maintenance | 9 | 9 | 8 | ||||||
Professional services | — | — | 1 | ||||||
Total cost of revenues | 12 | 13 | 12 | ||||||
Gross profit | 88 | 87 | 88 | ||||||
Operating expenses: | |||||||||
Sales and marketing | 34 | 30 | 22 | ||||||
Research and development | 24 | 24 | 22 | ||||||
General and administrative | 24 | 20 | 20 | ||||||
Restructuring | — | — | 1 | ||||||
Total operating expenses | 82 | 74 | 65 | ||||||
Income from operations | 6 | 13 | 23 | ||||||
Interest and other income, net | — | 1 | 1 | ||||||
Income before provision for income taxes | 6 | 14 | 24 | ||||||
Income tax benefit (expense) | (2 | ) | (3 | ) | 3 | ||||
Net income | 4 | % | 11 | % | 27 | % | |||
33
Revenues
The following table summarizes our total revenues (in thousands, except percentages) for fiscal 2011, 2010 and 2009:
Fiscal Year 2011 vs 2010 | Fiscal Year 2010 vs 2009 | ||||||||||||||||||||||||
Fiscal Year Ended October 31, | Change | Change | |||||||||||||||||||||||
2011 | 2010 | 2009 | In Dollars | Percentage | In Dollars | Percentage | |||||||||||||||||||
Total revenues | $ | 16,272 | $ | 15,766 | $ | 18,150 | $ | 506 | 3 | % | $ | (2,384 | ) | (13 | )% | ||||||||||
Total revenues are comprised of license fees and fees for maintenance, training, consulting, technical and other support services. Fluctuations in our total revenues can be attributed to changes in economic and industry conditions, product and customer mix, general trends in information technology spending, changes in geographic mix, the market response to our product and service offerings and the impact of fluctuations in foreign currency exchange rates. Further, product life cycles impact revenues periodically as old contracts expire and new products are released.
Our total revenues increased by $506,000 (or 3%) in fiscal year 2011 compared to fiscal year 2010. This resulted primarily from an increase of $554,000 (or 7%) in license revenues. The increase in license revenues resulted primarily from a modest global increase in the average license volume per customer.
Our total revenues decreased by $2.4 million (or 13%) in fiscal year 2010 compared to fiscal year 2009. This decrease resulted primarily from a decrease of $1.5 million (or 17%) in maintenance revenues and from a decrease of $703,000 (or 8%) in license revenues in fiscal year 2010 compared to fiscal year 2009. The decrease in maintenance revenues in fiscal year 2010 was principally due to fewer back maintenance transactions and customers choosing less expensive support options. The decrease in license revenues in fiscal year 2010 was due to smaller and fewer license transactions than in fiscal year 2009. At a more general level, we believe that an overriding principal factor that caused our license revenues to decrease in fiscal year 2010 was generally prevailing adverse global economic conditions.
One telecommunications customer accounted for approximately 14%, 11% and 15% of total revenues in the second, third and fourth quarters of fiscal year 2011, respectively, as well as approximately 12% of total revenues for the year ended October 31, 2011. One healthcare customer accounted for 10% of total revenues in the first quarter, a second telecommunications customer accounted for 15% of total revenues in the second quarter and a second healthcare customer accounted for approximately 11% of total revenues in the third quarter of fiscal year 2011.
In fiscal year 2010, one customer accounted for 12% of our total revenues for the fiscal year. Two different customers accounted for 12% and 13% of our total revenues in our fourth fiscal quarter of 2010. No one customer accounted for 10% or more of our total revenues in fiscal year 2009.
The inherently unpredictable business cycle of an enterprise software company makes discernment of continued and meaningful business trends difficult. In terms of license revenues, we are still experiencing lengthy sales cycles and customers' preference for licensing our software on an “as needed” basis where payment is tied to actual usage or deployment of our software, versus the older historical practice of prepaying license fees in advance of usage, a factor which can adversely affect the amount of our license revenues. License revenues also are a critical factor in driving the amount of our services revenues, as new license customers typically enter into support and maintenance agreements with us, from which our maintenance revenues are derived over future fiscal periods. The outlook into the Company's anticipated performance in fiscal year 2012 is uncertain, due principally to the significant worldwide economic slowdown.
We are currently expecting our total revenues for the fiscal year 2012 to remain stable at approximately fiscal 2011's level.
34
Revenues by Category: The following table summarizes our revenues by category (in thousands, except percentages) in fiscal 2011, 2010 and 2009: | |||||||||||||||||||||||||
Fiscal Year 2011 vs 2010 | Fiscal Year 2010 vs 2009 | ||||||||||||||||||||||||
Fiscal Year Ended October 31, | Change | Change | |||||||||||||||||||||||
2011 | 2010 | 2009 | In Dollars | Percentage | In Dollars | Percentage | |||||||||||||||||||
Revenues by category: | |||||||||||||||||||||||||
License | $ | 8,896 | $ | 8,342 | $ | 9,045 | $ | 554 | 7 | % | $ | (703 | ) | (8 | )% | ||||||||||
Maintenance | 7,201 | 7,331 | 8,833 | (130 | ) | (2 | ) | (1,502 | ) | (17 | ) | ||||||||||||||
Professional services | 175 | 93 | 272 | 82 | 88 | (179 | ) | (66 | ) | ||||||||||||||||
Total | $ | 16,272 | $ | 15,766 | $ | 18,150 | $ | 506 | 3 | % | $ | (2,384 | ) | (13 | )% | ||||||||||
Percentage of revenues by category: | |||||||||||||||||||||||||
License | 55 | % | 53 | % | 50 | % | |||||||||||||||||||
Maintenance | 44 | 46 | 49 | ||||||||||||||||||||||
Professional services | 1 | 1 | 1 | ||||||||||||||||||||||
Total | 100 | % | 100 | % | 100 | % | |||||||||||||||||||
Fiscal Year 2011 Compared to Fiscal Year 2010
License revenues: License revenues represent perpetual and time-based license fees received and recognized from our End-Users and Value Added Resellers.
License revenues were $8.9 million (or 55% of total revenues) for fiscal year 2011, an increase of approximately $554,000 (or 7%) from $8.3 million (or 53% of total revenues) reported for fiscal year 2010. The increased license revenues were mainly attributable to a modest global increase in the average license volume per customer and a greater number of larger license transactions. The increase in license revenues in fiscal year 2011 compared to fiscal year 2010 included favorable foreign currency fluctuations of approximately $162,000. The majority of our license revenues in fiscal year 2011 continued to be transactions with existing VAR customers in the telecommunications, information technology and healthcare industries, which were our largest vertical markets in fiscal year 2011.
Maintenance revenues: Maintenance and technical support revenues include revenues derived from maintenance agreements, under which we provide customers with internet and telephone access to support personnel and software upgrades, dedicated technical assistance and emergency response support options.
Maintenance revenues were $7.2 million (or 44% of total revenues) for fiscal year 2011, a decrease of $130,000 (or 2%) from $7.3 million (or 46% of total revenues) reported for fiscal year 2010. The decrease in maintenance revenues for fiscal year 2011 was primarily due to an approximate decrease of $429,000 resulting from certain customers electing less expensive support and maintenance options in fiscal year 2011, and was partially offset by an approximate increase of $165,000 related to back maintenance revenues derived from one North American customer and an approximate $154,000 increase from favorable foreign currency fluctuations.
Professional services revenues: Professional services revenues consist of revenues from consulting, training and technical support, as well as billable travel expenses incurred by our professional services organization.
Professional services revenues were $175,000 (or 1% of total revenues) in fiscal year 2011, an increase of $82,000 (or 88%) from $93,000 (or 1% of total revenues) reported in fiscal year 2010. This increase in the absolute dollar amount of professional services revenues was largely attributable to one consulting engagement with a European customer for approximately $53,000 in addition to a modest increase in consulting services performed in North America.
35
Fiscal Year 2010 Compared to Fiscal Year 2009
License revenues: License revenues were $8.3 million (or 53% of total revenues) for fiscal year 2010, a decrease of approximately $703,000 (or 8%) from $9.0 million (or 50% of total revenues) reported for fiscal year 2009. The reduced license revenues in absolute dollars for fiscal year 2010 were mainly attributable to fewer and smaller license transactions. The decrease in license revenues from fiscal year 2010 compared to fiscal year 2009 included unfavorable foreign currency fluctuations of approximately $14,000.
Maintenance revenues: Maintenance revenues were $7.3 million (or 46% of total revenues) for fiscal year 2010, a decrease of $1.5 million (or 17%) from $8.8 million (or 49% of total revenues) reported for fiscal year 2009. The decrease in maintenance revenues for fiscal year 2010 was principally due to an approximate decrease of $671,000 in recognized back maintenance compared to fiscal year 2009 and an approximate decrease of $441,000 resulting from certain customers electing less expensive support and maintenance options in fiscal year 2010. The decrease in maintenance revenues from fiscal year 2010 compared to fiscal year 2009 also included unfavorable foreign currency fluctuations of approximately $27,000.
Professional services revenues: Professional services revenues were $93,000 (or 1% of total revenues) in fiscal year 2010, a decrease of $179,000 (or 66%) from $272,000 (or 1% of total revenues) reported in fiscal year 2009. This decrease in the absolute dollar amount of professional services revenues for fiscal year 2010 compared to fiscal year 2009 was attributable to decreases in consulting and training revenues in both the US and the European operations including the absence in fiscal year 2010 of $62,000 of consulting revenue derived from one customer that was recognized in fiscal year 2009.
International Revenues. The following table summarizes our total revenues by geographic area (in thousands, except percentages) in fiscal years 2011, 2010 and 2009:
Fiscal Year 2011 vs 2010 | Fiscal Year 2010 vs 2009 | ||||||||||||||||||||||||
Fiscal Year Ended October 31, | Change | Change | |||||||||||||||||||||||
2011 | 2010 | 2009 | Dollars | Percentage | Dollars | Percentage | |||||||||||||||||||
Revenues by region: | |||||||||||||||||||||||||
North America | $ | 6,457 | $ | 6,232 | $ | 6,964 | $ | 225 | 4 | % | $ | (732 | ) | (11 | )% | ||||||||||
Europe | 9,020 | 8,764 | 10,656 | 256 | 3 | (1,892 | ) | (18 | ) | ||||||||||||||||
Asia | 795 | 770 | 530 | 25 | 3 | 240 | 45 | ||||||||||||||||||
$ | 16,272 | $ | 15,766 | $ | 18,150 | $ | 506 | 3 | % | $ | (2,384 | ) | (13 | )% | |||||||||||
Percentage of revenues by region: | |||||||||||||||||||||||||
North America | 40 | % | 40 | % | 38 | % | |||||||||||||||||||
Europe | 55 | 55 | 59 | ||||||||||||||||||||||
Asia | 5 | 5 | 3 | ||||||||||||||||||||||
Total | 100 | % | 100 | % | 100 | % | |||||||||||||||||||
Fiscal Year 2011 Compared to Fiscal Year 2010
Total revenues increased $506,000 (or 3%) in fiscal year 2011 compared to fiscal year 2010. The increase in total revenues occurred across geographic regions. As a percentage of total revenues, international (non-North American) revenues remained stable, representing approximately 60% of our total revenues in both fiscal years 2011 and 2010.
Revenues from North America: The $225,000 (or 4%) increase in revenues from North America in fiscal year 2011 compared to fiscal year 2010 was primarily due to a $448,000 increase in license revenues that was partially offset by a $223,000 decrease in services revenues. North American maintenance revenues declined from fiscal year 2010 to fiscal year 2011 as customers chose less expensive support options or maintained fewer licenses. In fiscal year 2010, North American license revenues included the recognition of an approximate $170,000 decrease that resulted from one customer's previous misreporting and overpayment of royalties. The absence of a comparable transaction in fiscal year 2011 resulted in a relative increase in North American license revenues which were also increased in fiscal year 2011 by a larger average license volume per customer.
36
Revenues from Europe: The $256,000 (or 3%) increase in revenues from Europe in fiscal year 2011 compared to fiscal year 2010 was primarily due to an increase of approximately $316,000 resulting from favorable foreign currency exchange rate fluctuations.
Since the Company's acquisition of Poet Holdings, Inc. in early 2004, we have generally derived a higher percentage of international revenues due to stronger demand for our products in Europe. We expect in the future to continue to experience a somewhat stronger demand for our products in Europe as compared to our other geographic markets.
Revenues from Asia: We experienced an increase of $25,000 (or 3%) in revenues from our Asia Pacific region during fiscal year 2011 compared to fiscal year 2010, primarily due to increased revenues from a customer in Singapore.
A variety of factors may impact Versant’s future revenues, including the potential strengthening of the U.S. dollar (which would have the effect of reducing portions of our revenue resulting from favorable currency exchange fluctuations), the generally more difficult economic environment currently being experienced in the global economy, which may negatively impact demand for our products and services, and competitive market conditions.
Fiscal Year 2010 Compared to Fiscal Year 2009
Total revenues decreased $2.4 million (or 13%) in fiscal year 2010 compared to fiscal year 2009. The decrease in total revenues occurred across geographic regions as the global economy remained weak. The decrease in total revenues in absolute dollars from fiscal year 2010 compared to fiscal year 2009 was primarily due to a revenue decrease of $1.9 million in Europe, and to a lesser extent a revenue decrease of $732,000 in North America, partially offset by a revenue increase of $240,000 in Asia. As a percentage of total revenues, international (non-North American) revenues decreased slightly representing approximately 60% and 62% of our total revenues in fiscal year 2010 and fiscal year 2009, respectively.
Revenues from North America: The $732,000 (or 11%) decrease in revenues from North America in fiscal year 2010 compared to fiscal year 2009 was primarily due to a decrease of $432,000 in maintenance revenues and a decrease of $300,000 in license revenues. North American maintenance revenues declined from fiscal year 2009 to fiscal year 2010 as customers chose less expensive support options or maintained fewer licenses. North American license revenues decreased due to fewer license transactions and an approximate $170,000 decrease to license revenues resulting from one customer's previous misreporting and overpayment of royalties to Versant.
Revenues from Europe: The $1.9 million (or 18%) decrease in revenues from Europe in fiscal year 2010 compared to fiscal year 2009 was primarily due to a decrease of $1.3 million in European maintenance revenues and to a lesser extent, a $594,000 decrease in European license revenues. The decrease in European maintenance revenues in fiscal year 2010 compared to fiscal year 2009 included an approximate $663,000 decrease in back maintenance transactions and an approximate $394,000 decrease as a result of customers choosing less expensive support options. The decrease in European license revenues in fiscal year 2010 compared to fiscal year 2009 reflected fewer license transactions in Europe and the relative absence of larger license transactions. The decrease in total revenues from Europe also included approximately $42,000 resulting from unfavorable foreign currency exchange rate fluctuations.
Revenues from Asia: We experienced an increase of $240,000 (or 45%) in revenues from our Asia Pacific region during fiscal year 2010 compared to fiscal year 2009, primarily due to increased revenues from our distributor in Japan.
37
Cost of Revenues
The following table summarizes the revenues, cost of revenues and gross profit (in thousands, except percentages) in fiscal 2011, 2010 and 2009:
Fiscal Year 2011 vs 2010 | Fiscal Year 2010 vs 2009 | ||||||||||||||||||||||||
Fiscal Year Ended October 31, | Change | Change | |||||||||||||||||||||||
2011 | 2010 | 2009 | Dollars | Percentage | Dollars | Percentage | |||||||||||||||||||
Total revenues: | $ | 16,272 | $ | 15,766 | $ | 18,150 | $ | 506 | 3 | % | $ | (2,384 | ) | (13 | )% | ||||||||||
Cost of revenues: | |||||||||||||||||||||||||
License | $ | 252 | $ | 279 | $ | 273 | $ | (27 | ) | (10 | )% | $ | 6 | 2 | % | ||||||||||
Amortization of intangible assets | 190 | 303 | 373 | (113 | ) | (37 | ) | (70 | ) | (19 | ) | ||||||||||||||
Maintenance | 1,475 | 1,470 | 1,452 | 5 | — | 18 | 1 | ||||||||||||||||||
Professional services | 85 | 61 | 133 | 24 | 39 | (72 | ) | (54 | ) | ||||||||||||||||
Total | $ | 2,002 | $ | 2,113 | $ | 2,231 | $ | (111 | ) | (5 | )% | $ | (118 | ) | (5 | )% | |||||||||
Gross profit | $ | 14,270 | $ | 13,653 | $ | 15,919 | $ | 617 | 5 | % | $ | (2,266 | ) | (14 | )% | ||||||||||
Gross margin percentage | 88 | % | 87 | % | 88 | % | |||||||||||||||||||
Cost of revenues was $2.0 million (or 12% of total revenues) in fiscal year 2011, a decrease of $111,000 (or 5%) from the cost of revenues of $2.1 million (or 13% of total revenues) reported in fiscal year 2010. The decrease resulted primarily from a $113,000 reduction in amortization of intangible assets.
Cost of revenues was $2.1 million (or 13% of total revenues) in fiscal year 2010, a decrease of $118,000 (or 5%) from the cost of revenues of $2.2 million (or 12% of total revenues) reported in fiscal year 2009. The decrease resulted from a $70,000 reduction in amortization of intangible assets and a $72,000 reduction in the cost of professional services revenue in fiscal year 2010 compared to fiscal year 2009 and was partially offset by slight increases in the cost of license and maintenance revenues.
Gross margin percentages (gross margin as a percentage of total revenues) remained relatively stable at 88% in fiscal year 2011, 87% in fiscal year 2010 and 88% in fiscal year 2009.
Cost of license revenues: Cost of license revenues consists primarily of royalties and costs of third party products, which we resell to our customers, as well as product media, shipping and packaging costs.
The following table summarizes the revenue, cost and gross profit for licensing (in thousands, except percentages) in fiscal 2011, 2010 and 2009:
Fiscal Year 2011 vs 2010 | Fiscal Year 2010 vs 2009 | ||||||||||||||||||||||||
Fiscal Year Ended October 31, | Change | Change | |||||||||||||||||||||||
2011 | 2010 | 2009 | Dollars | Percentage | Dollars | Percentage | |||||||||||||||||||
License: | |||||||||||||||||||||||||
Revenues | $ | 8,896 | $ | 8,342 | $ | 9,045 | $ | 554 | 7 | % | $ | (703 | ) | (8 | )% | ||||||||||
Cost | 252 | 279 | 273 | (27 | ) | (10 | ) | 6 | 2 | ||||||||||||||||
Gross profit | $ | 8,644 | $ | 8,063 | $ | 8,772 | $ | 581 | 7 | % | $ | (709 | ) | (8 | )% | ||||||||||
Margin percentage | 97 | % | 97 | % | 97 | % | |||||||||||||||||||
38
Fiscal Year 2011 Compared to Fiscal Year 2010
Cost of license revenues was $252,000 (or 3% of license revenues) in fiscal year 2011, remaining stable as a percentage of license revenues and decreasing slightly in absolute dollars compared to $279,000 (or 3% of license revenues) in fiscal year 2010.
Fiscal Year 2010 Compared to Fiscal Year 2009
Cost of license revenues was $279,000 (or 3% of license revenues) in fiscal year 2010, remaining stable in both absolute dollars and as a percentage of license revenues compared to $273,000 (or 3% of license revenues) in fiscal year 2009.
Cost of maintenance revenues: Cost of maintenance revenues consists primarily of salaries, bonuses and consulting fees for customer support personnel and related expenses, including employee benefits and allocated overhead.
The following table summarizes the revenue, cost and gross profit for maintenance (in thousands, except percentages) in fiscal years 2011, 2010 and 2009:
Fiscal Year 2011 vs 2010 | Fiscal Year 2010 vs 2009 | ||||||||||||||||||||||||
Fiscal Year Ended October 31, | Change | Change | |||||||||||||||||||||||
2011 | 2010 | 2009 | Dollars | Percentage | Dollars | Percentage | |||||||||||||||||||
Maintenance: | |||||||||||||||||||||||||
Revenues | $ | 7,201 | $ | 7,331 | $ | 8,833 | $ | (130 | ) | (2 | )% | $ | (1,502 | ) | (17 | )% | |||||||||
Cost | 1,475 | 1,470 | 1,452 | 5 | — | 18 | 1 | ||||||||||||||||||
Gross profit | $ | 5,726 | $ | 5,861 | $ | 7,381 | $ | (135 | ) | (2 | )% | $ | (1,520 | ) | (21 | )% | |||||||||
Margin percentage | 80 | % | 80 | % | 84 | % | |||||||||||||||||||
Fiscal Year 2011 Compared to Fiscal Year 2010
Cost of maintenance revenues was $1.5 million (or 20% of maintenance revenues) in fiscal year 2011, remaining consistent in absolute dollars and as a percentage of maintenance revenues compared to $1.5 million (or 20% of maintenance revenues) in fiscal year 2010.
Fiscal Year 2010 Compared to Fiscal Year 2009
Cost of maintenance revenues was $1.5 million (or 20% of maintenance revenues) in fiscal year 2010, remaining consistent in absolute dollars compared to $1.5 million (or 16% of maintenance revenues) in fiscal year 2009. The Company has elected to maintain our core technical support team and its associated costs, which resulted in the slight increase in the cost of maintenance revenues as a percentage of maintenance revenues in fiscal year 2010, when our maintenance revenues were lower than in fiscal year 2009.
39
Cost of professional services revenues: Cost of professional services consists of salaries, bonuses, third party consulting fees and other costs associated with supporting our professional services organization.
The following table summarizes the revenue, cost and gross profit for professional services (in thousands, except percentages) in fiscal 2011, 2010 and 2009:
Fiscal Year 2011 vs 2010 | Fiscal Year 2010 vs 2009 | ||||||||||||||||||||||||
Fiscal Year Ended October 31, | Change | Change | |||||||||||||||||||||||
2011 | 2010 | 2009 | Dollars | Percentage | Dollars | Percentage | |||||||||||||||||||
Professional services: | |||||||||||||||||||||||||
Revenues | $ | 175 | $ | 93 | $ | 272 | $ | 82 | 88 | % | $ | (179 | ) | (66 | )% | ||||||||||
Cost | 85 | 61 | 133 | 24 | 39 | (72 | ) | (54 | ) | ||||||||||||||||
Gross profit | $ | 90 | $ | 32 | $ | 139 | $ | 58 | 181 | % | $ | (107 | ) | (77 | )% | ||||||||||
Margin percentage | 51 | % | 34 | % | 51 | % | |||||||||||||||||||
Fiscal Year 2011 Compared to Fiscal Year 2010
Cost of professional services revenues was $85,000 (or 49% of professional services revenues) in fiscal year 2011, an increase of $24,000 (or 39%) compared to $61,000 (or 66% of professional services revenues) in fiscal year 2010.
Cost of professional services as a percentage of professional services revenues is affected by the mix of services provided (i.e., training vs. consulting) and the travel costs incurred. Versant provided more consulting and training services in fiscal year 2011 when compared to fiscal year 2010.
Fiscal Year 2010 Compared to Fiscal Year 2009
Cost of professional services revenues was $61,000 (or 66% of professional services revenues) in fiscal year 2010, a decrease of $72,000 (or 54%) compared to $133,000 (or 49% of professional services revenues) in fiscal year 2009.
Versant provided fewer consulting and training services in fiscal 2010 compared to fiscal year 2009, and incurred higher costs related to fewer students per training class, which resulted in cost of professional services comprising a higher percentage of professional services revenues in fiscal year 2010.
Amortization of Intangible Assets: The amortization of intangible assets in fiscal year 2011 related to our fiscal year 2004 acquisition of Poet Holdings, Inc. and our fiscal year 2009 acquisition of db4o.
The following table summarizes the amortization of intangible assets (in thousands, except percentages) in fiscal years 2011, 2010 and 2009: | |||||||||||||||||||||||||
Fiscal Year 2011 vs 2010 | Fiscal Year 2010 vs 2009 | ||||||||||||||||||||||||
Fiscal Year Ended October 31, | Change | Change | |||||||||||||||||||||||
2011 | 2010 | 2009 | In Dollars | Percentage | In Dollars | Percentage | |||||||||||||||||||
Amortization of intangible assets: | |||||||||||||||||||||||||
Poet Holdings, Inc. | $ | 87 | $ | 189 | $ | 189 | $ | (102 | ) | (54 | )% | $ | — | — | % | ||||||||||
JDO Genie (PTY), LTD | — | — | 73 | — | — | (73 | ) | (100 | ) | ||||||||||||||||
FastObjects, Inc. | — | 11 | 16 | (11 | ) | (100 | ) | (5 | ) | (31 | ) | ||||||||||||||
db4o | 103 | 103 | 95 | — | — | 8 | 8 | ||||||||||||||||||
Total | $ | 190 | $ | 303 | $ | 373 | $ | (113 | ) | (37 | )% | $ | (70 | ) | (19 | )% | |||||||||
40
Fiscal Year 2011 Compared to Fiscal Year 2010
Amortization of intangible assets was $190,000 (or 2% of license revenues) in fiscal year 2011, a $113,000 (or 37%) decrease compared to $303,000 (or 4% of license revenues) in fiscal year 2010. Intangible assets related to FastObjects customer relationships were fully amortized in the third quarter of fiscal year 2010 and intangible assets related to Poet Holdings, Inc., developed technology and customer relationships were fully amortized in the second quarter of fiscal year 2011, resulting in a decrease of $113,000 in amortization of intangible assets in fiscal year 2011 as compared to fiscal year 2010.
Based on current conditions, and assuming no future acquisitions of intangible assets, we expect to incur quarterly amortization charges of approximately $26,000 in each quarter of fiscal year 2012.
Fiscal Year 2010 Compared to Fiscal Year 2009
Amortization of intangible assets was $303,000 (or 4% of license revenues) in fiscal year 2010, a $70,000 (or 19%) decrease compared to $373,000 (or 4% of license revenues) in fiscal year 2009. Intangible assets related to JDO Genie technology were fully amortized in the third quarter of fiscal year 2009 and intangible assets related to FastObjects customer relationships were fully amortized in the third quarter of fiscal year 2010, resulting in a decrease of $70,000 in amortization of intangible assets in fiscal year 2010 as compared to fiscal year 2009.
Operating Expenses
The following table summarizes our operating expenses (in thousands, except percentages) for fiscal 2011, 2010 and 2009:
Fiscal Year 2011 vs 2010 | Fiscal Year 2010 vs 2009 | ||||||||||||||||||||||||
Fiscal Year Ended October 31, | Change | Change | |||||||||||||||||||||||
2011 | 2010 | 2009 | In Dollars | Percentage | In Dollars | Percentage | |||||||||||||||||||
Operating expenses: | |||||||||||||||||||||||||
Sales and marketing | $ | 5,568 | $ | 4,722 | $ | 4,101 | $ | 846 | 18 | % | $ | 621 | 15 | % | |||||||||||
Research and development | 3,921 | 3,778 | 3,969 | 143 | 4 | (191 | ) | (5 | ) | ||||||||||||||||
General and administrative | 3,810 | 3,143 | 3,665 | 667 | 21 | (522 | ) | (14 | ) | ||||||||||||||||
Restructuring | 25 | 39 | 139 | (14 | ) | (36 | ) | (100 | ) | (72 | ) | ||||||||||||||
Total | $ | 13,324 | $ | 11,682 | $ | 11,874 | $ | 1,642 | 14 | % | $ | (192 | ) | (2 | )% | ||||||||||
Fiscal Year 2011 Compared to Fiscal Year 2010
Total operating expenses were $13.3 million (or 82% of total revenues) for fiscal year 2011 compared to $11.7 million (or 74% of total revenues) for fiscal year 2010. The increase of $1.6 million (or 14%) in total operating expenses in fiscal year 2011 (discussed further below) resulted primarily from an $846,000 increase in sales and marketing costs related to the planned expansion of our global sales and marketing efforts, a $667,000 increase in our general and administrative expenses principally attributable to the non-recurring costs related to the separation of our former CEO, and to a lesser extent, a $143,000 increase in research and development expenses predominantly related to unfavorable foreign currency exchange fluctuations. Operating expenses for fiscal year 2011 include total unfavorable foreign currency exchange fluctuations of approximately $218,000 when compared to fiscal year 2010.
Sales and Marketing: Sales and marketing expenses consist primarily of personnel and related expenses, commissions earned by sales personnel, lead generation and qualification, website development and maintenance costs, trade shows, travel and other marketing communication costs, such as advertising.
Sales and marketing expenses were $5.6 million (or 34% of revenues) for fiscal year 2011 and $4.7 million (or 30% of total revenues) for fiscal year 2010. The $846,000 (or 18%) increase for fiscal year 2011 was primarily due to the planned expansion of our global marketing operations, including a $334,000 increase due to the addition of our VP Marketing and Strategic Product Development and a marketing manager, who were hired in the second and third quarters of fiscal year 2010, respectively, as well as the hiring of a marketing communications professional and product manager in the second and fourth quarters of 2011, respectively, and a $103,000 increase in marketing costs primarily associated with lead generation and website development costs. The increase in sales and marketing costs in fiscal year 2011 also included a $163,000 increase resulting from the costs of distribution and of localization of our products in the Asia Pacific markets, a $148,000 increase
41
related to the expansion of our sales operations and an approximate $61,000 increase related to unfavorable foreign currency fluctuations.
We expect our sales and marketing expenses to increase approximately 30% in fiscal year 2012 over fiscal year 2011 due to anticipated increases in sales and marketing programs to implement our Big Data strategic initiative and we expect that sales and marketing expenses will continue to represent a considerable percentage of our total operating expenditures in the future.
Research and Development: Research and development expenses consist primarily of personnel and related expenses, including payroll and employee benefits, expenses for facilities and payments made to outside software development contractors.
Research and development expenses were $3.9 million (or 24% of revenues) for fiscal year 2011 and $3.8 million (or 24% of revenues) in fiscal year 2010. The $143,000 (or 4%) increase in absolute dollars for research and development expenses in fiscal year 2011 was due primarily to an approximate $121,000 increase due to unfavorable foreign currency exchange fluctuations. The increase included an increase in salary and related costs for personnel additions in our European operations consolidating our engineering activities into one location, which were largely offset by the decrease in costs related to the wind-down of our former operations in India.
We expect our research and development expenses to increase approximately 40% in fiscal year 2012 compared to our research and development expense levels in fiscal year 2011. We plan to invest significant resources in new product developments to pursue our 2012 strategic roadmap to develop data management software that enables the development of analytical applications.
General and Administrative: General and administrative expenses consist primarily of personnel and related expenses, professional services and general operating expenses.
General and administrative expenses were $3.8 million (or 24% of total revenues) in fiscal year 2011 and $3.1 million (or 20% of total revenues) in fiscal year 2010. The $667,000 (or 21%) increase in general and administrative expenses in fiscal year 2011 was primarily due to an approximate $470,000 increase attributable to one-time separation costs related to the departure of the Company's former CEO, including additional share based compensation resulting from modifications to existing stock option grants. The increase in general and administrative expenses in fiscal year 2011 also included an approximate $125,000 increase in professional and outside services costs, an approximate $40,000 increase in bad debt expense and an approximate $36,000 increase due to unfavorable foreign currency exchange fluctuations. These increases were partially offset by an approximate $132,000 decrease in share based compensation expense (primarily for the Board of Directors) due to the lower average fair value of the options being amortized in fiscal year 2011.
We expect our general and administrative expenses in fiscal year 2012 to decrease moderately compared to fiscal year 2011.
Restructuring: On September 22, 2009, the Company committed to the implementation of a restructuring pursuant to which it closed its research and development facility in Pune, India. The restructuring plan was undertaken to consolidate our research and development efforts into one location in Germany in order to streamline operations, create management efficiencies and increase productivity. The restructuring was substantially completed during the second fiscal quarter ended April 30, 2010.
The following table reflects the restructuring charges included in operating expenses for fiscal years 2011, 2010 and 2009 (in thousands):
Fiscal Year Ended October 31, | ||||||||||||
2011 | 2010 | 2009 | ||||||||||
Restructuring: | ||||||||||||
Severance, retention and related charges | $ | — | $ | 38 | $ | 32 | ||||||
Impairment of fixed assets | 20 | 2 | 61 | |||||||||
Impairment to other assets | 5 | (29 | ) | 42 | ||||||||
Contract termination costs | — | 8 | — | |||||||||
Other direct costs of closure | — | 20 | 4 | |||||||||
Total restructuring charges | $ | 25 | $ | 39 | $ | 139 | ||||||
42
Fiscal Year 2010 Compared to Fiscal Year 2009
Total operating expenses were $11.7 million (or 74% of total revenues) for fiscal year 2010 and $11.9 million (or 65% of total revenues) for fiscal year 2009. The decrease of $192,000 (or 2%) in total operating expenses in fiscal year 2010 (discussed further below) resulted from a $522,000 decrease in our general and administrative expenses primarily related to reduced professional services and regulatory compliance costs, a $191,000 decrease in research and development expenses predominantly related to the reduced use of outside consultants, and a $100,000 decrease in restructuring costs related to the substantial completion of the restructuring plan for our facility in India in our second fiscal quarter, with these decreases being partially offset by increases in sales and marketing costs of $621,000 primarily related to the expansion of our global sales and marketing efforts. Operating expenses for fiscal year 2010 include favorable foreign currency exchange fluctuations of approximately $47,000 when compared to fiscal year 2009. However, due to the decrease in total revenues from fiscal year 2009 to fiscal year 2010, total operating expenses represented a higher percentage of total revenues in fiscal year 2010 than in fiscal year 2009.
Sales and Marketing: Sales and marketing expenses were $4.7 million (or 30% of revenues) for fiscal year 2010 and $4.1 million (or 22% of total revenues) for fiscal year 2009. The $621,000 (or 15%) increase in fiscal year 2010 was primarily due to an expansion of our global sales operations, including increases in total compensation expense, recruiting, higher facility costs attributable to additional personnel, travel and related costs resulting in an approximate increase of $331,000 related to U.S. sales operations, an approximate increase of $103,000 in European sales operations and an approximate increase of $66,000 in Asian sales operations. The year over year increase also includes an approximate $451,000 increase in global marketing programs including the addition of a new marketing manager and our VP Marketing and Strategic Product Development, along with lead generation and qualification, e-marketing and other new initiatives. These increases in sales and marketing costs for fiscal year 2010 when compared to fiscal year 2009 were partially offset by an approximate decrease of $275,000 related to a non-recurring separation payment made to the former Executive Vice President of Field Operations in the first quarter of fiscal year 2009, an approximate reduction of $29,000 in executive bonuses and a decrease of $22,000 in favorable foreign exchange fluctuations.
Research and Development: Research and development expenses were $3.8 million (or 24% of revenues) for fiscal year 2010 and $4.0 million (or 22% of revenues) in fiscal year 2009. The $191,000 (or 5%) decrease in research and development expenses in fiscal year 2010 was due primarily to an approximate $157,000 decrease related to the reduced use of outside engineering services and an approximate $16,000 decrease due to favorable foreign currency exchange fluctuations. The closure of our Indian operations resulted in an approximate $472,000 decrease in research and development costs in fiscal year 2010 compared to fiscal year 2009, and this decrease was fully offset by an approximate $489,000 increase in salary and related costs for personnel additions in our European operations to consolidate our engineering activities into one location.
General and Administrative: General and administrative expenses were $3.1 million (or 20% of total revenues) in fiscal year 2010 and $3.7 million (or 20% of total revenues) in fiscal year 2009. The $522,000 (or 14%) decrease in general and administrative expenses in fiscal year 2010 was primarily due to an approximate $231,000 decrease in professional services and regulatory compliance costs, including audit fees, consulting services and salary related expenses. The year over year decrease also included an approximate $82,000 decrease in share based compensation and travel expenses of the executives and directors, a decrease of $50,000 in bad debt expense, a decrease of $37,000 in facilities costs and favorable foreign currency exchange fluctuations of approximately $9,000.
Restructuring: On September 22, 2009, the Company committed to the implementation of a restructuring pursuant to which it closed its research and development facility in Pune, India. The restructuring plan was undertaken to consolidate our research and development efforts into one location in Germany in order to streamline operations, create management efficiencies and increase productivity. The restructuring was substantially completed during the second fiscal quarter ended April 30, 2010.
43
Interest and Other Income (Expense), Net
Interest and other income, net consists of interest income earned from our cash and cash equivalents net of interest expense due to our financing activities, miscellaneous refunds and foreign exchange rate gains and losses as a result of settling transactions denominated in currencies other than our functional currency.
The following table summarizes our interest and other income, net (in thousands, except percentages) in fiscal years 2011, 2010 and 2009:
Fiscal Year 2011 vs 2010 | Fiscal Year 2010 vs 2009 | ||||||||||||||||||||||||
Fiscal Year Ended October 31, | Change | Change | |||||||||||||||||||||||
2011 | 2010 | 2009 | In Dollars | Percentage | In Dollars | Percentage | |||||||||||||||||||
Interest and other income, net: | |||||||||||||||||||||||||
Interest income | $ | 61 | $ | 59 | $ | 267 | $ | 2 | 3 | % | $ | (208 | ) | (78 | )% | ||||||||||
Interest expense | — | (1 | ) | — | 1 | 100 | (1 | ) | (100 | ) | |||||||||||||||
Foreign exchange gain (loss) | (23 | ) | 91 | (35 | ) | (114 | ) | (125 | ) | 126 | 360 | ||||||||||||||
Other income | — | 1 | — | (1 | ) | (100 | ) | 1 | 100 | ||||||||||||||||
Total | $ | 38 | $ | 150 | $ | 232 | $ | (112 | ) | (75 | )% | $ | (82 | ) | (35 | )% | |||||||||
Fiscal Year 2011 Compared to Fiscal Year 2010
Interest and other income, net was $38,000 (or less than 1% of total revenues) in fiscal year 2011 compared to $150,000 (or 1% of revenues) in fiscal year 2010. The decrease of $112,000 (or 75%) was primarily due to an unfavorable change of approximately $114,000 in foreign exchange gains and losses resulting from settling transactions denominated in currencies other than our functional currency.
Fiscal Year 2010 Compared to Fiscal Year 2009
Interest and other income, net was $150,000 (or 1% of total revenues) in fiscal year 2010 compared to $232,000 (or 1% of revenues) in fiscal year 2009. The decrease of $82,000 (or 35%) was primarily due to a decrease of $208,000 in interest income from both our European and U.S. operations as a result of significantly reduced interest rates, partially offset by a favorable change of approximately $126,000 in foreign exchange gains and losses resulting from settling transactions denominated in currencies other than our functional currency.
Provision for Income Taxes
Provision for income taxes primarily consists of corporate income taxes for our subsidiary in Germany, foreign withholding taxes and state income and franchise taxes in the U.S. The provision also reflects the release of the estimated realizable portion of the valuation allowance against the net deferred tax assets.
The following table summarizes our provision for (benefit from) income taxes (in thousands, except percentages) in fiscal 2011, 2010 and 2009:
Fiscal Year 2011 vs 2010 | Fiscal Year 2010 vs 2009 | ||||||||||||||||||||||||
Fiscal Year Ended October 31, | Change | Change | |||||||||||||||||||||||
2011 | 2010 | 2009 | In Dollars | Percentage | In Dollars | Percentage | |||||||||||||||||||
Provision for income taxes: | |||||||||||||||||||||||||
Foreign withholding taxes | $ | 64 | $ | 68 | $ | 54 | $ | (4 | ) | (6 | )% | $ | 14 | 26 | % | ||||||||||
Provision for income taxes - Europe | 242 | 395 | (653 | ) | (153 | ) | (39 | ) | 1,048 | 160 | |||||||||||||||
Provision for income taxes - India | — | — | 14 | — | — | (14 | ) | (100 | ) | ||||||||||||||||
Federal, state and franchise taxes | (24 | ) | 4 | 23 | (28 | ) | (700 | ) | (19 | ) | (83 | ) | |||||||||||||
Total | $ | 282 | $ | 467 | $ | (562 | ) | $ | (185 | ) | (40 | )% | $ | 1,029 | 183 | % | |||||||||
44
Fiscal Year 2011 Compared to Fiscal Year 2010
In evaluating our ability to utilize our deferred tax assets, we consider all available positive and negative evidence, including our past operating results in the most recent fiscal years and our assessment of expected future results of operations on a jurisdiction by jurisdiction basis. As of October 31, 2011, we have concluded that it is more likely than not that the Company will realize the benefit of its deferred tax assets related to its German net operating loss carry forwards only to the extent of its expected taxable income in fiscal year 2012. We have a remaining valuation allowance of approximately $31.6 million against net deferred tax assets in the U.S. and foreign jurisdictions. Significant management judgment is required to determine when, in the future, the realization of our net deferred tax assets will become more likely than not. The Company will continue to assess the realizability of the tax benefit available based on actual and forecasted operating results.
As of October 31, 2011, we had U.S. federal and state net operating loss carry forwards of approximately $61.5 million and $13.0 million, respectively, and U.S. federal and state tax credit carry forwards of approximately $1.5 million and $664,000, respectively. The federal and state net operating loss carry forwards expire on various dates through 2031, including $2.9 million of federal net operating loss carry forward expiring in 2012 and use of net operating loss carry forwards in the State of California is currently subject to a moratorium. The U.S. federal tax credit carry forwards expire on various dates through 2024, if not utilized. The state tax credit can be carried forward indefinitely. Additionally, at October 31, 2011, we had German net operating tax loss carry forwards of approximately $24.2 million. The German tax code provides for certain annual statutory limitations related to the use of tax loss carry forward amounts. For each taxable year, we may utilize German tax loss carry forwards fully up to the first million euros of taxable income, and thereafter, the tax loss carry forwards are limited to 60% of taxable income. The provision for income taxes in Germany included approximately $212,000 and $395,000 for fiscal years 2011 and 2010, respectively, attributable to taxable income related to our German operations that were in excess of the allowable utilization of the tax loss carry forwards, and therefore, subject to corporate taxes. The provision for income taxes in Germany also included approximately $30,000 related to uncertain tax positions.
Due to "change in ownership" provisions of the Internal Revenue Code of 1986, the availability of net operating loss and tax carry forwards to offset federal taxable income in future periods is subject to an annual limitation. Future shifts in our stock ownership could subject our net operating loss and tax carry forwards to additional limitations restricting their use in sheltering future taxable income.
We incurred foreign withholding taxes and state income and franchise taxes of approximately $40,000 and $72,000 in fiscal years 2011 and 2010, respectively, which we have included in our income tax provision.
A portion of deferred tax assets relating to net operating losses pertains to net operating loss carry forwards resulting from tax deductions upon the exercise of employee stock options of approximately $1.6 million. When recognized, the tax benefit of these loss carry forwards will be accounted for as a credit to additional paid-in capital rather than a reduction of income tax expense.
Fiscal Year 2010 Compared to Fiscal Year 2009
The provision for income taxes in Germany included approximately $395,000 and $285,000 for fiscal year 2010 and fiscal year 2009, respectively, attributable to taxable income related to our German operations that were in excess of the allowable utilization of the tax loss carry forwards, and therefore, subject to corporate taxes. During fiscal year 2010, the strengthening of the US dollar against the euro created taxable gains from US denominated currencies held by our German operations which increased our taxable income in Germany.
We incurred foreign withholding taxes and state income and franchise taxes of approximately $72,000 and $77,000 in fiscal year 2010 and fiscal year 2009, respectively, which we have included in our income tax provision.
As of October 31, 2010, we had a remaining valuation allowance of approximately $33.9 million against net deferred tax assets in the U.S. and foreign jurisdictions.
45
Liquidity and Capital Resources The following table sets forth certain consolidated balance sheets data as of October 31, 2011 and October 31, 2010 and certain consolidated statements of cash flows data for the fiscal years ended October 31, 2011 and 2010 (in thousands, except percentages): | |||||||||
October 31, 2011 | October 31, 2010 | Percentage Change | |||||||
(unaudited) | |||||||||
Working capital | $ | 22,784 | $ | 24,889 | (8%) | ||||
Cash and cash equivalents | $ | 23,145 | $ | 24,911 | (7%) | ||||
Fiscal Year Ended | |||||||||
October 31, | October 31, | Percentage | |||||||
2011 | 2010 | Change | |||||||
(unaudited) | |||||||||
Net cash provided by operating activities | $ | 2,625 | $ | 2,285 | 15% | ||||
Net cash used in investing activities | (775 | ) | (645 | ) | 20% | ||||
Net cash used in financing activities | $ | (3,588 | ) | $ | (4,143 | ) | (13)% | ||
Cash and Cash Equivalents
In fiscal year 2011, we funded our business from cash generated by our operations and cash reserves. As of October 31, 2011, we had cash and cash equivalents of approximately $23.1 million, a decrease of $1.8 million from the $24.9 million of cash and cash equivalents we held at October 31, 2010.
As of October 31, 2011, $9.4 million of our $23.1 million in cash and cash equivalents was held in foreign financial institutions, of which $3.0 million was held in foreign currencies.
The following table summarizes our cash balances held in foreign currencies and their equivalent U.S. dollar amounts (in thousands):
October 31, 2011 | October 31, 2010 | ||||||||||||||||
Local Currency | U.S. Dollar | Local Currency | U.S. Dollar | ||||||||||||||
(unaudited) | (unaudited) | ||||||||||||||||
Cash in foreign currency: | |||||||||||||||||
Euros | € | 1,919 | $ | 2,716 | € | 1,375 | $ | 1,917 | |||||||||
British Pound | £ | — | — | £ | 32 | 52 | |||||||||||
Indian Rupee | Rs | 12,824 | 265 | Rs | 13,692 | 302 | |||||||||||
Total | $ | 2,981 | $ | 2,271 | |||||||||||||
We transact business in various foreign currencies and, accordingly, we are subject to exposure from adverse movements in foreign currency exchange rates. The effect of changes in foreign currency exchange rates on our net operating results in fiscal year 2011, as compared to fiscal year 2010, was comprised of approximately $316,000 of favorable foreign currency fluctuations on our revenues, $34,000 of unfavorable foreign currency fluctuations on our cost of revenues, and $218,000 of unfavorable foreign currency fluctuations on our operating expenses, resulting in a net favorable effect of approximately $64,000 on our income from operations for the year ended October 31, 2011.
Operating expenses incurred by our foreign subsidiaries are denominated primarily in local currencies. We currently do not use financial instruments to hedge these operating expenses. While we intend to assess the need to utilize financial instruments to hedge currency exposures on an ongoing basis, we do not at this time anticipate establishing any hedging during fiscal year 2012.
Our exposure to foreign exchange risk is primarily related to the magnitude of foreign net profits and losses denominated in euros, as well as our net position of monetary assets and monetary liabilities in the euro (though in the future the same could be
46
true of other foreign currencies depending on the source of our revenues). This exposure has the potential to produce either gains or losses within our consolidated results. However, in some instances our European operations act as a natural hedge, since both operating expenses as well as revenues are denominated in local currencies. In these instances, although an unfavorable change in the exchange rate of the euro against the U.S. dollar will result in lower revenues when translated into U.S. dollars, our European operating expenditures will be lower as well.
Additionally, we held approximately 87% of our total cash balances at October 31, 2011 in the form of U.S. dollars to assist in minimizing the impact of foreign currency fluctuations.
In relation to our cash balances held overseas, there were no European Union foreign exchange restrictions on repatriating our overseas-held cash to the United States. However, we may be subject to income tax withholding in the source countries and to U.S. federal and state income taxes in the future if the cash payment or transfer from our subsidiaries to the U.S. parent were to be characterized as a dividend. Other payments made by our European overseas subsidiaries in the ordinary course of business (e.g. payment of royalties or interest from the subsidiaries to the U.S. parent) were generally not subject to income tax withholding under existing tax treaties.
Our cash equivalents primarily consist of money market accounts; accordingly, our interest rate risk is not considered significant.
On November 30, 2009, Versant’s Board of Directors approved a stock repurchase program authorizing Versant to repurchase up to $5.0 million of its outstanding common shares on the open market, in block trades or otherwise. This stock repurchase program expired by its terms on October 31, 2010. Pursuant to this program, Versant acquired 356,104 common shares on the open market and in block trades for approximately $4.3 million at an average purchase price of $12.06 per share.
On November 29, 2010 Versant’s Board of Directors approved a stock repurchase program authorizing Versant to repurchase up to $5.0 million of its outstanding common shares on the open market, in block trades or otherwise. This stock repurchase program expired by its terms on October 31, 2011. Pursuant to this program, Versant acquired 240,629 common shares on the open market for approximately $3.0 million at an average purchase price of $12.23 per share.
On November 28, 2011 Versant’s Board of Directors approved a new stock repurchase program, announced on December 1, 2011, pursuant to which Versant is authorized to repurchase up to $5.0 million of its common stock in fiscal year 2012. This stock repurchase program is currently scheduled to expire upon the earlier of October 31, 2012, or at such time as Versant has expended $5.0 million to repurchase outstanding common shares under the program; however the program may be suspended, discontinued or extended at any earlier time by the Company.
On March 28, 2011, pursuant to a separation agreement with our former CEO, Versant repurchased 62,545 shares of Versant common stock owned by the former CEO at a price of $13.50 per share, reflecting recent market trading prices of Versant’s common stock as of the date of the separation agreement.
Taking into consideration the contingent cash outflows related to potential common stock repurchases, our current cost structure and our current estimates of revenues and collections in fiscal year 2012, we expect to operate with a moderate negative cash flow in fiscal year 2012.
Cash Flow provided by Operating Activities
The main source of our operating cash flows is cash collections from customers who have purchased our products and services. Our primary uses of cash in operating activities are for personnel related expenditures and facility costs.
Fiscal Year 2011
We generated $2.6 million of cash flows from operations in fiscal year 2011. This amount resulted from $702,000 in net income, adjusted for non-cash charges of $1.6 million and partially offset by a $318,000 decrease in operating assets net of liabilities since the beginning of fiscal year 2011. The decrease in operating assets net of liabilities was primarily attributable to a decrease of $1.0 million in trade accounts receivable partially offset by decreases of $207,000 and $386,000 in accrued and other long term liabilities and deferred revenues, respectively.
Non-cash adjustments were approximately $1.6 million, as reflected in our cash flow statement in fiscal year 2011, which were primarily share based compensation expense of $1.0 million and depreciation and amortization expense of $584,000. Non-cash adjustments may increase or decrease in the future and, as a result, this might positively or negatively impact our future
47
operating results, but they will not have a direct impact on our cash flows.
The timing of payments to our vendors for accounts payable and collections from our customers for accounts receivable will significantly impact cash flows in our operating activities. We typically pay our vendors and service providers in accordance with their invoice terms and conditions. Our standard payment terms for our invoices are usually between 30 and 90 days net.
We measure the effectiveness of our collection efforts by an analysis of our accounts receivable and our days sales outstanding (DSO). We calculate DSO by taking the ending accounts receivable balances (net of bad debt allowance) divided by the average daily sales amount. Average daily sales amount is calculated by dividing the total quarterly revenue recognized net of changes in deferred revenues by 91.25 days. Our DSOs were 57 days, 69 days and 55 days for the three months ended October 31, 2011, 2010 and 2009 respectively. Collections of accounts receivable and related DSO could fluctuate in future periods due to the timing and amount of our revenues and the effectiveness of our collection efforts.
Fiscal Year 2010
We generated $2.3 million of cash flows from operations in fiscal year 2010. This amount resulted from $1.7 million in net income, adjusted for non-cash charges of $1.6 million and partially offset by a $1.0 million increase in operating assets net of liabilities since the beginning of fiscal year 2010. The increase in operating assets net of liabilities was primarily attributable to an increase of $979,000 in trade accounts receivable.
Non-cash adjustments were approximately $1.6 million, as reflected in our cash flow statement in fiscal year 2010, which were primarily share based compensation expense of $1.1 million and depreciation and amortization expense of $612,000.
Our working capital was $24.9 million as of October 31, 2010 compared to $26.8 million as of October 31, 2009.
Fiscal Year 2009
We generated $5.8 million of cash flows from operations in fiscal year 2009. This was primarily derived from $4.8 million in net income, adjusted for non-cash charges of $895,000.
Non-cash adjustments were approximately $895,000, as reflected in our cash flow statement in fiscal year 2009, which were primarily share based compensation expense of $970,000, depreciation and amortization expense of $710,000 and restructuring charges of $135,000, partially offset by the deferred income tax benefit of $939,000.
Our working capital was $26.8 million as of October 31, 2009 compared to $25.4 million as of October 31, 2008.
Cash Flow used in Investing Activities
Our primary uses of cash in investing activities have typically been for the purchases of property and equipment (mostly information technology related equipment and software). Purchases of property and equipment were $775,000, $480,000 and $164,000 in fiscal years 2011, 2010 and 2009, respectively. Our cash used in investing activities also reflects our acquisition of db4o for $180,000 and $2.4 million in fiscal years 2010 and 2009, respectively.
We anticipate a moderate increase in our overall spending related to property and equipment in fiscal year 2012 compared to fiscal year 2011.
Cash Flow used in Financing Activities
Our primary use of cash in financing activities has been the repurchase of common stock under our stock repurchase programs, partially offset by cash proceeds from sales of common stock under our employee stock option and stock purchase plans. Purchases of our common stock were approximately $3.8 million, $4.3 million and $3.2 million in fiscal years 2011, 2010 and 2009, respectively. Proceeds from issuance of our common stock were approximately $208,000, $167,000 and $285,000 in fiscal years 2011, 2010 and 2009, respectively.
Our future liquidity and capital resources could be impacted by the exercise of outstanding common stock options and the cash proceeds we receive upon exercise of these securities. As of October 31, 2011 we had approximately 345,000 shares available to issue under our current equity incentive and director plans. The timing of the issuance of options under these plans, the duration and timing of their vesting schedules and their grant price will all impact the timing of any exercises and proceeds. Accordingly, we cannot estimate the amount of such proceeds at this time.
48
On November 28, 2011 Versant’s Board of Directors approved a new stock repurchase program pursuant to which Versant is authorized to repurchase up to $5.0 million of its common stock in fiscal year 2012. This stock repurchase program is currently scheduled to expire upon the earlier of October 31, 2012, or such time as Versant has expended $5.0 million to repurchase outstanding common shares under the program; however the program may be suspended, discontinued or extended at any earlier time by the Company.
We currently do not anticipate establishing a credit or loan facility in fiscal year 2012.
Commitments and Contingencies
Our principal commitments as of October 31, 2011 consist of obligations under operating leases for facilities and equipment. As reported in Notes 6 and 7, Lease Obligations and Contingencies of the Notes to Consolidated Financial Statements under Item 8 of Part II, of this Report, the Company leases office space for its U.S. headquarters in Redwood City, California and also leases field office space in Hamburg and Munich, Germany under multi-year operating lease agreements.
On November 3, 2011, the Company entered into an amendment of its office building lease in Redwood City, California leasing approximately 2,500 square feet of additional space for the thirty months ending May 31, 2014. The total rent payable over the lease term is approximately $252,000.
On January 11, 2012, the Company entered into an office building lease in Cupertino, California leasing approximately 1,600 square feet for the twelve months ending January 15, 2013. The total rent payable over the lease term is approximately $42,000.
The change to future minimum lease payments resulting from leases entered into or amended subsequent to fiscal year end is reflected in our minimum commitments table below.
Our minimum commitments under non-cancelable operating leases not recorded on our Consolidated Balance Sheet are as follows (in thousands):
Facilities Leases | Equipment Leases | Total | |||||||||
Fiscal year ending October 31, | |||||||||||
2012 | $ | 531 | $ | 5 | $ | 536 | |||||
2013 | 437 | 2 | 439 | ||||||||
2014 | 247 | 247 | |||||||||
2015 | 15 | 15 | |||||||||
Total | $ | 1,230 | $ | 7 | $ | 1,237 | |||||
The Company enters into indemnification agreements in the ordinary course of business. The Company's license agreements with customers generally require it to indemnify the customer against claims that its software infringes third party patent, copyright, trademark or other proprietary rights. Such indemnification obligations are generally limited in a variety of industry-standard respects. If a liability associated with any of the Company's indemnifications becomes probable and the amount of the liability is reasonably estimable or the minimum amount of a range of loss is reasonably estimable, then an appropriate liability will be established. The estimated fair value of these indemnification clauses is minimal, and the Company has not provided for any reserves for such indemnity liabilities.
On November 28, 2011 Versant’s Board of Directors approved a new stock repurchase program announced on December 1, 2011 pursuant to which Versant is authorized to repurchase up to $5.0 million of its common stock in fiscal year 2012. This stock repurchase program is currently scheduled to expire upon the earlier of October 31, 2012, or such time as Versant has expended $5.0 million to repurchase outstanding common shares under the program; however the program may be suspended, discontinued or extended at any earlier time by the Company.
After taking into account potential common stock repurchases under our current stock repurchase program, we believe that our existing cash and cash equivalents and cash to be generated from operations will be sufficient to finance our operations during the next twelve months. However, if we fail to generate adequate cash flows from operations in the future, due to an unexpected decline in our revenues, difficulties or delays in collection of revenues or due to a sustained increase in cash expenditures in excess of the revenues generated, then our cash balances may not be sufficient to fund our continuing operations without obtaining additional debt or equity financing. Additional cash may also be needed to acquire or invest in
49
complementary businesses or products or to obtain the right to use complementary technologies, and we expect that, in the event of such an acquisition or investment that is significant, it will be necessary for us to seek additional debt or equity financing.
Recent Accounting Pronouncements
For recent accounting pronouncements see Note 2, Summary of Significant Accounting Policies of Notes to Consolidated Financial Statements under Part II, Item 8 of this Report.
Item 7A . Quantitative and Qualitative Disclosures About Market Risk.
Foreign currency exchange risk
We transact business in various foreign currencies and, accordingly, we are subject to exposure from adverse movements in foreign currency exchange rates.
The effect of changes in foreign currency exchange rates on our net operating results in fiscal year 2011, as compared to fiscal year 2010, was comprised of approximately $316,000 of favorable foreign currency fluctuations on our revenues, $34,000 of unfavorable foreign currency fluctuations on our cost of revenues, and $218,000 of unfavorable foreign currency fluctuations on our operating expenses, resulting in a net favorable effect of approximately $64,000 on our income from operations for the year ended October 31, 2011.
Operating expenses incurred by our foreign subsidiaries are denominated primarily in local currencies. We currently do not use financial instruments to hedge these operating expenses. While we intend to assess the need to utilize financial instruments to hedge currency exposures on an ongoing basis, we do not at this time anticipate establishing any hedging during fiscal year 2012.
Our exposure to the risk of changes in foreign currency exchange rates is primarily related to the magnitude of foreign net profits and losses denominated in euros, as well as our net position of monetary assets and monetary liabilities in the euro (though in the future the same could be true of other foreign currencies depending on the source of our revenues). This exposure has the potential to produce either gains or losses within our consolidated results. However, in some instances our European operations act as a natural hedge, since both operating expenses as well as revenues are denominated in local currencies. In these instances, although an unfavorable change in the exchange rate of the euro against the U.S. dollar will result in lower revenues when translated into U.S. dollars, our European operating expenditures will be lower as well.
Additionally, we held approximately 87% of our total cash balance at October 31, 2011 in the form of U.S. dollars to assist in minimizing the impact of foreign currency fluctuations.
We did not own any derivative financial instruments as of October 31, 2011.
Interest rate risk
Our cash equivalents primarily consist of money market accounts; therefore, we do not believe that our interest rate risk is significant at this time.
Item 8. Financial Statements and Supplementary Data.
The following consolidated financial statements, and the related notes thereto, of Versant Corporation and the Report of Independent Registered Public Accounting Firm are filed as a part of this Form 10-K.
50
REPORT OF INDEPENDENT REGISTERED PUBLIC ACCOUNTING FIRM
Board of Directors and Shareholders of Versant Corporation and Subsidiaries:
We have audited the accompanying consolidated balance sheets of Versant Corporation and Subsidiaries (the “Company”) as of October 31, 2011 and 2010, and the related consolidated statements of income, stockholders' equity and comprehensive income, and cash flows for each of the three years in the period ended October 31, 2011. These financial statements are the responsibility of the Company's management. Our responsibility is to express an opinion on these financial statements based on our audits.
We conducted our audits in accordance with the standards of the Public Company Accounting Oversight Board (United States). Those standards require that we plan and perform the audit to obtain reasonable assurance about whether the financial statements are free of material misstatement. The Company is not required to have, nor were we engaged to perform an audit of its internal control over financial reporting. Our audit included consideration of internal control over financial reporting as a basis for designing audit procedures that are appropriate in the circumstances, but not for the purpose of expressing an opinion on the effectiveness of the Company's internal control over financial reporting. Accordingly, we express no such opinion. An audit also includes examining, on a test basis, evidence supporting the amounts and disclosures in the financial statements, assessing the accounting principles used and significant estimates made by management, as well as evaluating the overall financial statement presentation. We believe that our audits provide a reasonable basis for our opinion.
In our opinion, the consolidated financial statements referred to above present fairly, in all material respects, the financial position of Versant Corporation and Subsidiaries as of October 31, 2011 and 2010, and the results of their operations and their cash flows for each of the three years in the period ended October 31, 2011, in conformity with accounting principles generally accepted in the United States of America.
/s/ GRANT THORNTON LLP
San Francisco, California
January 30, 2012
51
VERSANT CORPORATION AND SUBSIDIARIES
CONSOLIDATED BALANCE SHEETS
(in thousands, except for share amounts)
October 31, 2011 | October 31, 2010 | ||||||||||
ASSETS | |||||||||||
Current assets: | |||||||||||
Cash and cash equivalents | $ | 23,145 | $ | 24,911 | |||||||
Trade accounts receivable, net | 2,183 | 3,186 | |||||||||
Deferred income taxes | 898 | 884 | |||||||||
Other current assets | 481 | 388 | |||||||||
Total current assets | 26,707 | 29,369 | |||||||||
Property and equipment, net | 993 | 634 | |||||||||
Goodwill | 8,589 | 8,589 | |||||||||
Intangible assets, net | 309 | 499 | |||||||||
Other assets | 38 | 38 | |||||||||
Total assets | $ | 36,636 | $ | 39,129 | |||||||
LIABILITIES AND SHAREHOLDERS’ EQUITY | |||||||||||
Current liabilities: | |||||||||||
Accounts payable | $ | 152 | $ | 164 | |||||||
Accrued liabilities | 1,076 | 1,294 | |||||||||
Deferred revenues | 2,695 | 3,022 | |||||||||
Total current liabilities | 3,923 | 4,480 | |||||||||
Other long-term liabilities | 178 | 205 | |||||||||
Total liabilities | 4,101 | 4,685 | |||||||||
Commitments and contingencies (Notes 6 & 7) | |||||||||||
Shareholders’ equity: | |||||||||||
Common stock, no par value, 7,500,000 shares authorized, 2,935,125 shares issued and outstanding at October 31, 2011, and 3,213,122 shares issued and outstanding at October 31, 2010 | 90,055 | 92,654 | |||||||||
Accumulated other comprehensive income, net | 31 | 43 | |||||||||
Accumulated deficit | (57,551 | ) | (58,253 | ) | |||||||
Total shareholders’ equity | 32,535 | 34,444 | |||||||||
Total liabilities and shareholders’ equity | $ | 36,636 | $ | 39,129 | |||||||
See accompanying notes to consolidated financial statements.
52
VERSANT CORPORATION AND SUBSIDIARIES
CONSOLIDATED STATEMENTS OF INCOME
(in thousands, except for per share amounts)
Fiscal Year Ended | |||||||||||||||||
October 31, | October 31, | October 31, | |||||||||||||||
2011 | 2010 | 2009 | |||||||||||||||
Revenues: | |||||||||||||||||
License | $ | 8,896 | $ | 8,342 | $ | 9,045 | |||||||||||
Maintenance | 7,201 | 7,331 | 8,833 | ||||||||||||||
Professional services | 175 | 93 | 272 | ||||||||||||||
Total revenues | 16,272 | 15,766 | 18,150 | ||||||||||||||
Cost of revenues: | |||||||||||||||||
License | 252 | 279 | 273 | ||||||||||||||
Amortization of intangible assets | 190 | 303 | 373 | ||||||||||||||
Maintenance | 1,475 | 1,470 | 1,452 | ||||||||||||||
Professional services | 85 | 61 | 133 | ||||||||||||||
Total cost of revenues | 2,002 | 2,113 | 2,231 | ||||||||||||||
Gross profit | 14,270 | 13,653 | 15,919 | ||||||||||||||
Operating expenses: | |||||||||||||||||
Sales and marketing | 5,568 | 4,722 | 4,101 | ||||||||||||||
Research and development | 3,921 | 3,778 | 3,969 | ||||||||||||||
General and administrative | 3,810 | 3,143 | 3,665 | ||||||||||||||
Restructuring | 25 | 39 | 139 | ||||||||||||||
Total operating expenses | 13,324 | 11,682 | 11,874 | ||||||||||||||
Income from operations | 946 | 1,971 | 4,045 | ||||||||||||||
Interest and other income, net | 38 | 150 | 232 | ||||||||||||||
Income before provision for income taxes | 984 | 2,121 | 4,277 | ||||||||||||||
Income tax benefit (expense) | (282 | ) | (467 | ) | 562 | ||||||||||||
Net income | $ | 702 | $ | 1,654 | $ | 4,839 | |||||||||||
Net income per share: | |||||||||||||||||
Basic | $ | 0.23 | $ | 0.48 | $ | 1.33 | |||||||||||
Diluted | $ | 0.23 | $ | 0.48 | $ | 1.32 | |||||||||||
Shares used in per share calculation: | |||||||||||||||||
Basic | 3,078 | 3,411 | 3,626 | ||||||||||||||
Diluted | 3,083 | 3,444 | 3,663 | ||||||||||||||
See accompanying notes to consolidated financial statements.
53
VERSANT CORPORATION AND SUBSIDIARIES
CONSOLIDATED STATEMENTS OF SHAREHOLDERS' EQUITY
AND COMPREHENSIVE INCOME
(in thousands, except for share amounts)
Common | Accumulated Deficit | Accumulated Other Comprehensive Income | Total Shareholders' Equity | Total Comprehensive Income | ||||||||||||||||||||||||||
Shares | Amount | |||||||||||||||||||||||||||||
Balance at October 31, 2008 | 3,746,581 | $ | 97,717 | $ | (64,746 | ) | $ | 183 | $ | 33,154 | ||||||||||||||||||||
Repurchases of common stock | (222,688 | ) | (3,242 | ) | (3,242 | ) | ||||||||||||||||||||||||
ESPP | 15,691 | 164 | 164 | |||||||||||||||||||||||||||
Exercise of stock options | 13,362 | 121 | 121 | |||||||||||||||||||||||||||
Share based compensation expense | 970 | 970 | ||||||||||||||||||||||||||||
Net income | 4,839 | 4,839 | 4,839 | |||||||||||||||||||||||||||
Foreign currency translation adjustments | 251 | 251 | 251 | |||||||||||||||||||||||||||
Total comprehensive income | $ | 5,090 | ||||||||||||||||||||||||||||
Balance at October 31, 2009 | 3,552,946 | $ | 95,730 | $ | (59,907 | ) | $ | 434 | $ | 36,257 | ||||||||||||||||||||
Repurchases of common stock | (356,104 | ) | (4,310 | ) | (4,310 | ) | ||||||||||||||||||||||||
ESPP | 13,093 | 132 | 132 | |||||||||||||||||||||||||||
Exercise of stock options | 3,187 | 35 | 35 | |||||||||||||||||||||||||||
Share based compensation expense | 1,067 | 1,067 | ||||||||||||||||||||||||||||
Net income | 1,654 | 1,654 | 1,654 | |||||||||||||||||||||||||||
Foreign currency translation adjustments | (391 | ) | (391 | ) | (391 | ) | ||||||||||||||||||||||||
Total comprehensive income | $ | 1,263 | ||||||||||||||||||||||||||||
Balance at October 31, 2010 | 3,213,122 | $ | 92,654 | $ | (58,253 | ) | $ | 43 | $ | 34,444 | ||||||||||||||||||||
Repurchases of common stock | (303,174 | ) | (3,796 | ) | (3,796 | ) | ||||||||||||||||||||||||
ESPP | 17,750 | 176 | 176 | |||||||||||||||||||||||||||
Exercise of stock options | 7,427 | 32 | 32 | |||||||||||||||||||||||||||
Share based compensation expense | 989 | 989 | ||||||||||||||||||||||||||||
Net income | 702 | 702 | 702 | |||||||||||||||||||||||||||
Foreign currency translation adjustments | (12 | ) | (12 | ) | (12 | ) | ||||||||||||||||||||||||
Total comprehensive income | $ | 690 | ||||||||||||||||||||||||||||
Balance at October 31, 2011 | 2,935,125 | $ | 90,055 | $ | (57,551 | ) | $ | 31 | $ | 32,535 | ||||||||||||||||||||
See accompanying notes to consolidated financial statements.
54
VERSANT CORPORATION AND SUBSIDIARIES
CONSOLIDATED STATEMENTS OF CASH FLOWS
(in thousands)
Fiscal Year Ended October 31, | |||||||||||
2011 | 2010 | 2009 | |||||||||
Cash flows from operating activities: | |||||||||||
Net income | $ | 702 | $ | 1,654 | $ | 4,839 | |||||
Adjustments to reconcile net income to net cash provided by operating activities: | |||||||||||
Deferred income tax benefit | — | — | (939 | ) | |||||||
Depreciation and amortization | 394 | 309 | 337 | ||||||||
Amortization of intangible assets | 190 | 303 | 373 | ||||||||
Share based compensation | 989 | 1,067 | 970 | ||||||||
Provision for (recovery of) allowance for doubtful accounts receivable | 7 | (26 | ) | 19 | |||||||
Restructuring (reduction of) charges | 25 | (19 | ) | 135 | |||||||
Changes in assets and liabilities: | |||||||||||
Trade accounts receivable | 1,014 | (979 | ) | 778 | |||||||
Other assets | (90 | ) | 235 | (75 | ) | ||||||
Accounts payable | (13 | ) | (40 | ) | (233 | ) | |||||
Accrued liabilities and other long-term liabilities | (207 | ) | 222 | (418 | ) | ||||||
Deferred revenues | (386 | ) | (441 | ) | (15 | ) | |||||
Net cash provided by operating activities | 2,625 | 2,285 | 5,771 | ||||||||
Cash flows from investing activities: | |||||||||||
Acquisition of business | — | (180 | ) | (2,383 | ) | ||||||
Purchases of property and equipment | (775 | ) | (480 | ) | (164 | ) | |||||
Proceeds from the sale of property and equipment | — | 15 | — | ||||||||
Net cash used in investing activities | (775 | ) | (645 | ) | (2,547 | ) | |||||
Cash flows from financing activities: | |||||||||||
Proceeds from issuance of common stock | 208 | 167 | 285 | ||||||||
Repurchases of common stock | (3,796 | ) | (4,310 | ) | (3,242 | ) | |||||
Principal payments under capital lease obligations | — | — | (4 | ) | |||||||
Net cash used in financing activities | (3,588 | ) | (4,143 | ) | (2,961 | ) | |||||
Effect of foreign exchange rate changes on cash and cash equivalents | (28 | ) | (398 | ) | 315 | ||||||
Net increase (decrease) in cash and cash equivalents | (1,766 | ) | (2,901 | ) | 578 | ||||||
Cash and cash equivalents at beginning of period | 24,911 | 27,812 | 27,234 | ||||||||
Cash and cash equivalents at end of period | $ | 23,145 | $ | 24,911 | $ | 27,812 | |||||
Supplemental disclosures of cash flows information: | |||||||||||
Cash paid for: | |||||||||||
Income taxes | $ | 393 | $ | 385 | $ | 713 | |||||
See accompanying notes to consolidated financial statements.
55
VERSANT CORPORATION AND SUBSIDIARIES
NOTES TO CONSOLIDATED FINANCIAL STATEMENTS
October 31, 2011
Note 1. | The Company and Basis of Presentation |
Versant Corporation (with its subsidiaries, collectively referred to in this report as “Versant” or “the Company”) was incorporated in California in August 1988. Versant is a leading provider of object-oriented data management software that forms a critical component of the infrastructure of enterprise computing. The Company designs, develops, markets and supports object-oriented database management system products to solve complex data management and data integration problems of enterprises. Versant also provides related product support, training and consulting services to assist users in the use of its products and in development and deployment of software applications based on its products. The Company operates its business within a single operating segment referred to as Data Management. Versant's principal executive offices are located in Redwood City, California. Versant has international operations in Germany and markets its software products and related maintenance services directly through telesales and field sales organizations in North America and Germany and indirectly through distributors and resellers worldwide.
Note 2. | Summary of Significant Accounting Policies |
Principles of Consolidation
The consolidated financial statements include 100% of the assets, liabilities, revenues, expenses and cash flows of Versant and all entities in which Versant has a controlling voting interest (subsidiaries) required to be consolidated in accordance with Financial Accounting Standards Board (FASB) guidance pursuant to Accounting Standards Codification (ASC) 810, Consolidation. All significant intercompany accounts and transactions among consolidated companies have been eliminated in consolidation.
The financial position and operating results of foreign operations are consolidated using the local currency as their functional currency. Local currency assets and liabilities are translated into U.S. dollars at the rates of exchange on the balance sheet date, and local currency revenues and expenses are translated using rates that approximate the average rates of exchange during the period. Resulting translation gains or losses are included in the accompanying consolidated statement of shareholders' equity as a component of accumulated other comprehensive income.
Use of Estimates
The preparation of financial statements, in conformity with accounting principles generally accepted in the United States of America (“GAAP”), requires management to make estimates and assumptions which affect the reported amounts of assets and liabilities and disclosure of contingent assets and liabilities at the date of the financial statements and the reported amounts of revenues and expenses during the reporting period. Actual results could differ from the estimates.
Cash and Cash Equivalents
Cash and cash equivalents include all highly liquid investments with an original maturity of three months or less at the time of purchase. The Company's cash and cash equivalents at October 31, 2011 and October 31, 2010 consisted of deposits in banks and money market funds. As of October 31, 2011 and 2010 cash balances held in foreign financial institutions were $9.4 million and $6.6 million, respectively.
Concentration of Credit Risk
The Company's financial instruments, which potentially subject the Company to concentrations of credit risk, consist primarily of cash and cash equivalents and trade accounts receivable. The Company maintains its cash and cash equivalents, with balances which may exceed insured limits, with financial institutions and invests in highly rated short-term securities. The Company maintains an allowance for doubtful accounts as an estimate of the inability of its customers to make required payments. The allowance was $16,000 and $8,000 at October 31, 2011 and October 31, 2010, respectively. The amount of the Company's allowance is based on historical experience and an analysis of its accounts receivable balances. Credit losses to date have been within management's expectations. However, actual results could differ from such estimates.
56
VERSANT CORPORATION AND SUBSIDIARIES
NOTES TO CONSOLIDATED FINANCIAL STATEMENTS (Continued)
October 31, 2011
Note 2. | Summary of Significant Accounting Policies (Continued) |
The following table summarizes trade accounts receivable balances in excess of 10% of the Company's total trade accounts receivable as of October 31, 2011 and 2010 (in thousands):
As of October 31, | ||||||||
2011 | 2010 | |||||||
Customer A | $ | 225 | $ | 475 | ||||
Customer B | * | 519 | ||||||
Customer C | * | 504 | ||||||
Customer D | 311 | * | ||||||
Customer E | 362 | * | ||||||
* not in excess of 10% of trade accounts receivable | ||||||||
Property and Equipment
Property and equipment are stated at cost less accumulated depreciation, computed using the straight-line method based on the estimated useful lives of the assets, generally ranging from three to five years. Depreciation commences upon placing the asset in service. Leasehold improvements are amortized over the shorter of the useful life or the remaining lease term. The Company reviews its property and equipment for impairment periodically or whenever events or changes in circumstances indicate that the carrying amount of an asset may not be recoverable.
The following table summarizes the breakdown of the Company's property and equipment as of October 31, 2011 and October 31, 2010 (in thousands):
As of October 31, | ||||||||
2011 | 2010 | |||||||
Property and equipment: | ||||||||
Computer equipment | $ | 1,660 | $ | 1,395 | ||||
Furniture and fixtures | 237 | 222 | ||||||
Software | 1,009 | 694 | ||||||
Leasehold improvements | 401 | 393 | ||||||
Other assets | 35 | 35 | ||||||
3,342 | 2,739 | |||||||
Less: accumulated depreciation and amortization | (2,349 | ) | (2,105 | ) | ||||
Total | $ | 993 | $ | 634 | ||||
Total depreciation expense for fiscal years 2011, 2010 and 2009 was $394,000, $309,000, and $337,000, respectively.
Impairment of Goodwill and Intangible Assets
Goodwill represents the excess of the purchase price of an acquired business over the fair value of the identifiable assets acquired and liabilities assumed in business combinations. As required by ASC 350, Intangibles - Goodwill and Other, the Company evaluates its goodwill for impairment on an annual basis.
In accordance with ASC 350, Goodwill, we test for any goodwill impairment within our single Data Management operating segment and reporting unit. FASB guidance requires that goodwill be tested for impairment at the reporting unit level, at least annually and more frequently upon the occurrence of certain events. The Company uses the market approach to assess the fair value of its assets and this value is compared with the carrying value of those assets to test for impairment. The total fair value of the Company's assets is estimated by summing the fair value of the Company's equity (as indicated by the publicly traded share price for Versant's shares and the number of shares outstanding plus an estimated control premium) and its liabilities. Under this approach, if the estimated fair value of the Company's assets is greater than their carrying value, then there is no
57
VERSANT CORPORATION AND SUBSIDIARIES
NOTES TO CONSOLIDATED FINANCIAL STATEMENTS (Continued)
October 31, 2011
Note 2. Summary of Significant Accounting Policies (Continued)
goodwill impairment. If the estimated fair value of the Company's assets is less than their carrying value, an allocation would be made of the reporting unit's estimated fair value to its assets and liabilities as though the reporting unit had just been acquired in a business combination. The impairment loss is the amount, if any, by which the implied fair value of goodwill allocable to the reporting unit is less than that reporting unit's goodwill carrying amount and would be recorded in operating results during the period of such impairment.
Versant performed its annual evaluations of the Company's goodwill based on the requirements of ASC 350 in October 2011, October 2010 and October 2009. As a result of these impairment tests and valuation analyses, Versant determined that no impairment charges against the Company's goodwill were required in fiscal years 2011, 2010 or 2009.
Purchased intangible assets other than goodwill are amortized over their useful lives unless such lives are determined to be indefinite. Purchased intangible assets with definite lives are carried at cost less accumulated amortization. Identifiable intangibles are currently amortized using the straight-line method over useful lives ranging from 5-9 years. Intangible assets consist of acquired technology, customer relationships and trade names. Versant tests and evaluates its intangible assets for impairment whenever indicators of potential impairment are identified.
In fiscal years 2011, 2010 and 2009, there were no triggering events to indicate impairment of Versant's intangible assets, and the Company did not perform impairment tests and valuation analyses of its intangible assets. Versant determined that the value of the Company's intangible assets had been fairly recorded in its financial statements, and therefore, no impairment charges against the Company's intangible assets related to the Company's Poet, FastObjects, JDO Genie and db4o acquisitions were recorded in fiscal years 2011, 2010 or 2009.
Revenue Recognition
We recognize revenues in accordance with GAAP, as set forth in:
• | ASC 985-605, Software, Revenue Recognition; and |
• | ASC 605-35, Revenue Recognition, Construction-Type and Production-Type Contracts |
The Company's revenues consist mainly of revenues earned under software license agreements, maintenance support agreements (otherwise known as post-contract customer support or “PCS”) and, to a lesser degree, agreements for consulting and training activities.
Versant uses the residual method to recognize revenues when a license agreement includes one or more elements to be delivered by the Company at a future date. If there is an undelivered element under the license arrangement, the Company defers revenues based on vendor-specific objective evidence (“VSOE”) of the fair value of the undelivered element, as determined by the price charged when the element is sold separately. If VSOE of fair value does not exist for all undelivered elements of a transaction, the Company defers all revenues from that transaction until sufficient evidence of the fair value exists or until all elements have been delivered. Under the residual method, discounts are allocated only to the delivered elements in a multiple element arrangement, with any undelivered elements being deferred based on the vendor-specific objective evidence of the fair value of such undelivered elements. Versant typically does not offer discounts on future undeveloped products.
The Company has established VSOE of fair value of PCS as evidenced by stand-alone renewal transactions using the “bell shaped curve approach.” PCS of the Versant Object Database is priced as a percentage of the original software license fees. The Company performs quarterly analysis on a transaction by transaction basis to document the range of pricing in PCS renewals. The Company has established VSOE of fair value for PCS, if substantial majorities (greater than 80%) of stand-alone renewal transactions are priced within a reasonably narrow range (plus or minus 15% from the midpoint of the range). For the year ended October 31, 2011, the pricing of over 95% of stand-alone PCS renewal transactions fell within the predefined pricing range.
58
VERSANT CORPORATION AND SUBSIDIARIES
NOTES TO CONSOLIDATED FINANCIAL STATEMENTS (Continued)
October 31, 2011
Note 2. Summary of Significant Accounting Policies (Continued)
Revenues from software license arrangements, including prepaid license fees, are recognized when all of the following criteria are met:
• | Persuasive evidence of an arrangement exists. |
• | Delivery has occurred and there are no future deliverables except PCS. |
• | The fee is fixed and determinable. If the Company cannot conclude that a fee is fixed and determinable, then assuming all other criteria have been met, the Company recognizes the revenues as payments become due in accordance with ASC 985-605. |
• | Collection is reasonably assured. |
If an acceptance period or other contingency exists, revenues are not recognized until customer acceptance or expiration of the acceptance period, or until satisfaction of the contingency, as applicable. The Company's license fees are generally non-cancelable and non-refundable. Also, the Company's customer agreements for prepaid deployment licenses generally do not make payment of the Company's license fees contingent upon the actual deployment of the software. Therefore, a customer's delay or acceleration in its deployment schedule typically does not impact the Company's revenue recognition in the case of a prepaid deployment license.
Revenues from related PCS for all product lines are usually billed in advance of the service being provided and are deferred and recognized on a straight-line basis over the term in which the PCS is to be performed, which is generally twelve months. In some cases PCS revenues are paid in arrears of the service being provided and are recognized as revenues at the time the customer provides the Company a report for deployments made during a given time period. Training and consulting revenues are recognized when a purchase order is received, the services have been performed and collection is deemed probable. Consulting services are billed on an hourly, daily or monthly rate. Training classes are billed based on group or individual attendance.
Versant categorizes its customers into two broad groups, End-Users and Value Added Resellers (VARs). End-User customers are companies who use Versant's products internally and do not redistribute the Company's product outside of their corporate organizations. VAR customers include traditional Value Added Resellers, Systems Integrators, Original Equipment Manufacturers (“OEMs”) and other vendors who redistribute Versant's products to their external third party customers, either separately or as part of an integrated product.
Versant licenses its data management products through two types of perpetual licenses - development licenses and deployment licenses. Development licenses are typically licensed on a per seat basis and authorize a customer to develop and test an application program that uses Versant's software product. Before an End-User customer may deploy an application that it has developed under the Company's development license, it must purchase deployment licenses in which the license fees are based on the number of computers connected to the server that will run the application using Versant's product or, for certain applications, the number of users. Pricing of Versant Object Database and FastObjects licenses varies according to several factors, including the number of computer servers on which the application runs and the number of users that are able to access the server at any one time. Customers may elect to simultaneously purchase development and deployment licenses for an entire project. These development and deployment licenses may also provide for prepayment to Versant of a nonrefundable amount for future deployment.
VARs and distributors license development software from Versant on a per seat basis on terms similar to those of development licenses that the Company sells directly to End-Users. VARs are authorized to sublicense deployment copies of Versant's data management products that are either bundled or embedded in the VAR's applications and sold directly to End-Users. VARs are required to report their distribution of Versant's software and are charged a royalty that is either based on the number of copies of the application software that are distributed or computed as a percentage of the selling price charged by the VARs to their end-user customers. These royalties from VARs may be prepaid in full or paid upon deployment. VAR agreements for prepaid royalty arrangements are non-cancelable, non-refundable and do not make payment of the license fees contingent upon the actual deployment of the software, and therefore, the future deployments of the VARs have no impact on revenue recognition of such prepaid royalties. Provided that all other conditions for revenue recognition have been met, revenues from arrangements
59
VERSANT CORPORATION AND SUBSIDIARIES
NOTES TO CONSOLIDATED FINANCIAL STATEMENTS (Continued)
October 31, 2011
Note 2. Summary of Significant Accounting Policies (Continued)
with VARs are recognized, (i) as to prepaid license arrangements, when the prepaid licenses are sold to the VAR, and (ii) as to other license arrangements, at the time the VAR provides a royalty report to Versant for sales made by the VAR during a given period.
On occasion, at a customer's request, Versant performs engineering work to port the Company's products to an unsupported platform, to customize its software for specific functionality, or other non-routine technical assignments. In these instances, Versant recognizes revenues in accordance with ASC 605-35, Revenue Recognition: Construction-Type and Production-Type Contracts, and uses either the time and material percentage of completion method or the completed contract method for recognizing revenues. The Company uses the percentage of completion method if it can make reasonable and dependable estimates of labor costs and hours required to complete the work in question. The Company periodically reviews these estimates in connection with the work performed and rates actually charged and recognizes any losses when identified. Progress to completion is determined using the cost-to-cost method, whereby cost incurred to date as a percentage of total estimated cost determines the percentage completed and revenue recognized. When using the percentage of completion method, the following conditions must exist:
• | An agreement must include provisions that clearly specify the rights regarding goods or services to be provided and received by both parties, the consideration to be exchanged and the manner and terms of settlement. |
• | The customer is able to satisfy its obligations under the contract. |
• | Versant is able to satisfy its obligations under the contract. |
The completed contract method is used when reasonable or dependable estimates of labor costs and time to complete the work cannot be made. As a result, in such situations, Versant defers all revenues until such time as the work is fully completed.
Management of the Company makes significant judgments and estimates in connection with the determination of the revenue Versant recognizes in each accounting period. If Versant had made different judgments or utilized different estimates for any period, material differences in the amount and timing of revenue recognized would have resulted.
Foreign Currency
The functional currencies of the Company's foreign subsidiaries are their respective local currencies. The Company translates the assets and liabilities of international subsidiaries into the U.S. dollar at the current exchange rates in effect on the balance sheet date and revenues and expenses are translated using rates that approximate the average rates of exchange during the period. Gains and losses from translation adjustments are included in shareholders' equity on the consolidated balance sheets captioned as accumulated other comprehensive income, net.
The Company records net gains and losses resulting from settling transactions denominated in currencies other than its functional currency as a component of interest and other income, net. Foreign exchange gain (loss) was approximately $(23,000), $91,000 and $(35,000), respectively, for the fiscal years ended October 31, 2011, October 31, 2010 and October 31, 2009, respectively.
Other Comprehensive Income
Accumulated other comprehensive income, net presented in the accompanying consolidated balance sheets consist of cumulative foreign currency translation adjustments.
Warranties and Indemnification Obligations
The Company recognizes warranty and indemnification obligations under ASC 460, Guarantees. This FASB guidance requires a guarantor to recognize and disclose a liability for obligations it has undertaken in relation to the issuance of the guarantee.
The Company enters into indemnification agreements in the ordinary course of business. The Company's license agreements with customers generally require it to indemnify the customer against claims that its software infringes third party patent,
60
VERSANT CORPORATION AND SUBSIDIARIES
NOTES TO CONSOLIDATED FINANCIAL STATEMENTS (Continued)
October 31, 2011
Note 2. Summary of Significant Accounting Policies (Continued)
copyright, trademark or other proprietary rights. Such indemnification obligations are generally limited in a variety of industry-standard respects. If a liability associated with any of the Company's indemnifications becomes probable and the amount of the liability is reasonably estimable or the minimum amount of a range of loss is reasonably estimable, then an appropriate liability will be established. The estimated fair value of these indemnification clauses is minimal. The Company has not provided any reserves for such indemnity liabilities.
The Company's software license agreements also generally include a warranty that the Company's software products will substantially operate as described in the applicable program documentation. The Company also warrants that services the Company performs will be provided in a manner consistent with industry standards. In Europe, there is typically a one-year warranty period for all of the Company's products and services. To date, Versant has not incurred any material costs associated with these product and service performance warranties, and as such the Company has provided no warranty reserve balance in its consolidated financial statements.
Deferred Revenue
Deferred revenue represents amounts billed to customers under certain maintenance, software and service contracts for which the revenue earning process has not been completed and revenue has not been recognized. Deferred revenues are recognized as revenue ratably over the life of the contract or when the service is rendered and the Company has satisfied all other revenue recognition criteria.
The following table summarizes the breakdown of the Company's deferred revenue as of October 31, 2011 and October 31, 2010 (in thousands):
As of October 31, | ||||||||
2011 | 2010 | |||||||
Deferred revenue: | ||||||||
Short-term deferred maintenance, software and professional services | $ | 2,695 | $ | 3,022 | ||||
Long-term deferred maintenance | 23 | 66 | ||||||
Total deferred revenue | $ | 2,718 | $ | 3,088 | ||||
Accrued Liabilities
The breakdown of short-term accrued liabilities as of October 31, 2011 and October 31, 2010 was as follows (in thousands):
As of October 31, | ||||||||
2011 | 2010 | |||||||
Accrued liabilities: | ||||||||
Payroll and related | $ | 832 | $ | 804 | ||||
Taxes payable | 89 | 105 | ||||||
Deferred rent | 21 | 14 | ||||||
Other | 134 | 371 | ||||||
Total accrued liabilities | $ | 1,076 | $ | 1,294 | ||||
Software Development Costs
Software development costs are included in research and development and are expensed as incurred. After technological feasibility is established, material software development costs are capitalized in accordance with ASC 985-20, Software, Costs of Software to Be Sold, Leased or Marketed. The time period between achieving technological feasibility, which Versant has defined as the establishment of a working model, which typically occurs when the beta testing commences, and the general availability of such software has generally been short and therefore to date software development costs qualifying for
capitalization have been insignificant. No software development costs have been capitalized for the years ended October 31, 2011, 2010 and 2009.
61
VERSANT CORPORATION AND SUBSIDIARIES
NOTES TO CONSOLIDATED FINANCIAL STATEMENTS (Continued)
October 31, 2011
Note 2. Summary of Significant Accounting Policies (Continued)
Income Taxes
The Company accounts for income taxes pursuant to the provisions of ASC 740, Income Taxes, which requires an asset and liability approach to accounting for income taxes. Deferred tax assets and liabilities are determined based on the difference between the financial statement carrying amounts and the tax basis of assets and liabilities and are measured using the enacted statutory tax rates in effect at the balance sheet date. The Company records a valuation allowance to reduce its deferred tax assets when uncertainty regarding realizability exists.
The Company is subject to U.S. federal income taxes and to income taxes in various states in the U.S. as well as in foreign jurisdictions. Tax regulations within each jurisdiction are subject to the interpretation of the related tax laws and regulations and require significant judgment to apply. With few exceptions, the Company is no longer subject to U.S. federal, state and local, or foreign tax examinations by tax authorities for tax years before 2006. However, with respect to prior tax years no longer subject to examination due to the expiration of the statute of limitations, income may nevertheless be recomputed for the purpose of determining the amount of NOL that may be carried over to “open” years.
The Company recognizes interest and penalties accrued related to unrecognized tax benefits in the provision for income taxes for all periods presented, which were not significant. The Company applies the net basis of income statement presentation for taxes collected from customers and remitted to government authorities.
Share Based Compensation
The Company accounts for share-based compensation costs in accordance with ASC 718, Compensation, Stock Compensation. Under the fair value recognition guidance of ASC 718, share based compensation cost is estimated at the grant date based on the fair value of the award and is recognized as expense over the requisite service period of the award.
The Company utilizes the Black-Scholes option pricing model to estimate the fair value of employee share based compensation awards at the date of grant. This model requires the use of assumptions, including expected volatility, expected term, risk-free interest rate and dividend yield, some of which require significant management judgment. Further, the Company estimates forfeiture rates for those options granted which are not expected to vest. Changes in these inputs and assumptions can materially affect the measure of estimated fair value of our share-based compensation. The estimated fair value is charged to earnings on a straight-line basis over the vesting period of the underlying awards, which are generally three years under the Company's Equity Incentive Plans and two years under the Directors Stock Option Plans. While the estimate of fair value and the associated charge to earnings materially impacts the Company's results of operations, it has no impact on its cash position.
Versant employs historical volatility over a period equal to the expected term of the options as the basis for estimating expected volatility. The Company, however, takes into account all available current information to determine the expected volatility. Versant bases the expected term of its options on historical exercise data, while considering other factors that could possibly impact the future life of the options. Versant uses the Treasury Constant Maturities rates reported by The Federal Reserve to approximate the risk free interest rate. Versant has not distributed any dividends to its common shareholders and does not expect to do so in the near future.
Versant uses historical forfeiture data, modified by any available relevant information, to arrive at the estimated forfeiture rate. ASC 718 requires that forfeitures be estimated at the time of grant and revised, if necessary, in subsequent periods if actual forfeitures differ from those estimates. Versant applies the forfeiture rate to the unvested portion of the option valuation and performs a true up if the actual forfeiture rate is different from the one applied in prior periods.
Versant estimates the fair value of employee rights to purchase shares under its employee stock purchase plan, or “ESPP”, using the Black-Scholes Option Pricing Model. The purchase price of shares which employees may acquire under the Company's ESPP, at any purchase period, is 85% of the lesser of either of the following: the fair market value of the shares on the offering date or the fair market value of the shares on the purchase date. Versant records compensation expense based on the estimated fair value of the shares granted under the ESPP.
62
VERSANT CORPORATION AND SUBSIDIARIES
NOTES TO CONSOLIDATED FINANCIAL STATEMENTS (Continued)
October 31, 2011
Note 2. Summary of Significant Accounting Policies (Continued)
Employee Benefit Plans
The Company's employee savings and retirement plan is qualified under Section 401(k) of the United States Internal Revenue Code. Employees may make voluntary, tax-deferred contributions to the 401(k) Plan up to the statutorily prescribed annual limit. No matching contributions to employees' voluntary contributions to the 401(k) plan were made by the Company in fiscal years 2011, 2010 and 2009.
Restructuring and Related Charges
Restructuring charges are recognized and measured according to the provisions of ASC 420, Exit or Disposal Cost Obligations, which requires a liability for a cost associated with an exit or disposal activity to be recognized at its fair value in the period in which the liability is incurred, except for a liability for one-time termination benefits that is incurred over time. Restructuring charges include employee termination and related costs, contract termination costs, and other costs directly associated with exit activities, including impairment of property and other assets. Costs for such activities are estimated by management after evaluating detailed analyses of the cost to be incurred.
Segment and Geographic Information
ASC 280, Segment Reporting establishes standards for the manner in which public companies report information about operating segments in annual and interim financial statements. It also establishes standards for related disclosures about products and services, geographic areas, and major customers. The method for determining what information to report is based on the way management organizes the operating segments within the Company for making operating decisions and assessing financial performance. The Company's chief operating decision-maker is considered to be the Company's chief executive officer (CEO). The CEO reviews financial information presented on an entity level basis accompanied by non-aggregated information about revenues by product type and certain information about geographic regions for purposes of making operating decisions and assessing financial performance. The entity level financial information is identical to the information presented in the accompanying consolidated statements of income. Therefore, the Company has determined that it operates in a single operating segment, Data Management.
In aggregate, the revenues generated by one significant telecommunications customer accounted for approximately 12% of total revenues in the fiscal years 2011 and 2010.
The Company operates in North America, Europe and Asia. In general, revenues are attributed to the country in which the contract originates.
The following tables summarize revenues and long-lived assets by each geographic region (in thousands):
Fiscal Year Ended October 31, | ||||||||||||
2011 | 2010 | 2009 | ||||||||||
Total revenues by geographic area: | ||||||||||||
North America | $ | 6,457 | $ | 6,232 | $ | 6,964 | ||||||
Europe | 9,020 | 8,764 | 10,656 | |||||||||
Asia | 795 | 770 | 530 | |||||||||
Total | $ | 16,272 | $ | 15,766 | $ | 18,150 | ||||||
63
VERSANT CORPORATION AND SUBSIDIARIES
NOTES TO CONSOLIDATED FINANCIAL STATEMENTS (Continued)
October 31, 2011
Note 2. Summary of Significant Accounting Policies (Continued)
The following table summarizes long-lived assets by each geographic region (in thousands):
As of October 31, | ||||||||
2011 | 2010 | |||||||
Total long-lived assets by geographic area: | ||||||||
North America | $ | 438 | $ | 127 | ||||
Germany | 588 | 506 | ||||||
Asia | 5 | 39 | ||||||
Total | $ | 1,031 | $ | 672 | ||||
Recently Adopted Accounting Pronouncements
Fair Value Measurement Disclosure
In January 2010, the Financial Accounting Standards Board ("FASB") amended the disclosure requirements for the fair value measurements for recurring and nonrecurring non-financial assets and liabilities. The guidance requires new disclosures about transfers into and out of Levels 1 and 2 and separate disclosures about purchases, sales, issuances, and settlements relating to Level 3 measurements. It also clarifies existing fair value disclosures about the level of disaggregation and about inputs and valuation techniques used to measure fair value. The new disclosures and clarifications of existing disclosures were effective for the Company’s second quarter of fiscal year 2010, except for the disclosures about purchases, sales, issuances, and settlements relating to Level 3 measurements, which are effective for the Company’s first quarter of fiscal year 2012. The adoption of this guidance had no material impact on the Company’s consolidated financial statements.
Amendments to Variable Interest Entity Guidance
In June 2009, new guidance was issued which requires an enterprise to determine whether its variable interest or interests give it a controlling financial interest in a variable interest entity. The primary beneficiary of a variable interest entity is the enterprise that has both (1) the power to direct the activities of a variable interest entity that most significantly impact the entity’s economic performance, and (2) the obligation to absorb losses of the entity that could potentially be significant to the variable interest entity or the right to receive benefits from the entity that could potentially be significant to the variable interest entity. The guidance also requires ongoing reassessments of whether an enterprise is the primary beneficiary of a variable interest entity. The guidance was effective for Versant beginning November 1, 2010. The adoption of this guidance had no material impact on the Company’s consolidated financial statements.
Multiple-Deliverable Revenue Arrangements
In October 2009, new guidance was issued by the FASB related to the revenue recognition of multiple element arrangements. The new guidance states that if vendor specific objective evidence, or third party evidence, of fair value for deliverables in an arrangement cannot be determined, companies will be required to develop a best estimate of the selling price for separate deliverables and allocate arrangement consideration using the relative selling price method. The new guidance is effective for Versant for revenue arrangements entered into or materially modified beginning on November 1, 2010. The adoption of this guidance had no material impact on the Company’s consolidated financial statements.
Revenue Recognition for Certain Arrangements that Include Software Elements
In October 2009, new guidance was issued by FASB related to certain revenue arrangements that include software elements. Previously, companies that sold tangible products with “more than incidental” software were required to apply software revenue recognition guidance. This guidance often delayed revenue recognition for the delivery of the tangible product. Under the new guidance, tangible products that have software components that are “essential to the functionality” of the tangible product will be excluded from the software revenue recognition guidance. The new guidance includes factors to help companies determine what is “essential to the functionality.” Software-enabled products will now be subject to other revenue guidance and will likely follow the guidance for multiple deliverable arrangements issued by the FASB in October 2009. The
64
VERSANT CORPORATION AND SUBSIDIARIES
NOTES TO CONSOLIDATED FINANCIAL STATEMENTS (Continued)
October 31, 2011
Note 2. Summary of Significant Accounting Policies (Continued)
new guidance was effective for Versant for revenue arrangements entered into or materially modified beginning on November 1, 2010. The adoption of this guidance had no material impact on the Company’s consolidated financial statements.
Revenue Recognition — Milestone Method
In April 2010, the FASB issued guidance on the criteria that should be met for determining whether the milestone method of revenue recognition is appropriate for research and development arrangements. A vendor can recognize consideration that is contingent upon achievement of a milestone in its entirety as revenue in the period in which the milestone is achieved only if the milestone meets all criteria to be considered substantive. The guidance was effective for Versant beginning November 1, 2010. The adoption of this guidance had no material impact on the Company’s consolidated financial statements.
Receivables Disclosure
In July 2010, the FASB issued guidance which amends ASC 310, Receivables. This Accounting Standards Update (“ASU”) requires disclosures related to financing receivables and the allowance for credit losses by portfolio segment. The ASU also requires disclosures of information regarding the credit quality, aging, nonaccrual status and impairments by class of receivable. Trade accounts receivable with maturities of one year or less are excluded from the disclosure requirements. The effective date for disclosures as of the end of the reporting period was the first quarter of the Company's fiscal year 2011. The effective date for disclosures for activity during the reporting period is the second quarter of the Company's fiscal year 2011. The adoption of this guidance had no material impact on the Company’s consolidated financial statements.
Interactive Data Reporting
In January 2009, the SEC issued Release No. 33-9002, Interactive Data to Improve Financial Reporting. The final rule requires companies to provide their financial statements and financial statement schedules to the SEC and on their corporate websites in interactive data format using the eXtensible Business Reporting Language (“XBRL”). The rule was adopted by the SEC to improve the ability of financial statement users to access and analyze financial data. The SEC adopted a phase-in schedule indicating when registrants must furnish interactive data. Under this schedule, the Company was required to submit filings with financial statement information using XBRL commencing with the quarterly report on Form 10-Q for the quarter ended July 31, 2011.
Recent Accounting Pronouncements Not Yet Adopted
Goodwill Impairment Testing
In December 2010, the FASB issued guidance which amends ASC 350, Intangibles - Goodwill and Other. This Accounting Standards Update amends the criteria for performing Step 2 of the goodwill impairment test for reporting units with zero or negative carrying amounts and requires performing Step 2 if qualitative factors indicate that it is more likely than not that a goodwill impairment exists. This guidance is effective for fiscal years beginning after December 15, 2011 (November 1, 2012 for the Company). The adoption of this guidance is not expected to have a material impact on the Company’s consolidated financial statements.
Presentation of Comprehensive Income
In June 2011, the FASB issued ASU No. 2011-05, Presentation of Comprehensive Income. The issuance of ASU 2011-5 is intended to improve the comparability, consistency and transparency of financial reporting and to increase the prominence of items reported in other comprehensive income. The guidance in ASU 2011-5 supersedes the presentation options in ASC Topic 220 and facilitates convergence of U.S. generally accepted accounting principles and International Financial Reporting Standards by eliminating the option to present components of other comprehensive income as part of the statement of changes in shareholders' equity and requiring that all non-owner changes in shareholders' equity be presented either in a single continuous statement of comprehensive income or in two separate but consecutive statements. This guidance will be applied retrospectively and early adoption is permitted. This guidance is effective for fiscal years and interim periods within those years, beginning after December 15, 2011 (November 1, 2012 for the Company). The adoption of this guidance is not expected to have a material impact on the Company’s consolidated financial statements.
65
VERSANT CORPORATION AND SUBSIDIARIES
NOTES TO CONSOLIDATED FINANCIAL STATEMENTS (Continued)
October 31, 2011
Note 2. Summary of Significant Accounting Policies (Continued)
Goodwill Impairment Testing
In September 2011, the FASB issued guidance to amend and simplify the rules related to testing goodwill for impairment. The revised guidance allows an entity to make an initial qualitative evaluation, based on the entity’s events and circumstances, to determine whether it is more likely than not that the fair value of a reporting unit is less than its carrying amount. The results of this qualitative assessment determine whether it is necessary to perform the currently required two-step impairment test. The new guidance is effective for annual and interim goodwill impairment tests performed for fiscal years beginning after December 15, 2011 (November 1, 2012 for the Company). Early adoption is permitted. The adoption of this guidance is not expected to have a material impact on the Company’s consolidated financial statements.
Note 3. | Fair Value Measurements |
Accounting Standards Codification (ASC) 820, Fair Value Measurements and Disclosures, defines fair value as the price that would be received from selling an asset or paid to transfer a liability in an orderly transaction between market participants at the measurement date. When determining the fair value measurements for assets and liabilities required to be recorded at fair value, the Company considers the principal or most advantageous market for the transaction and considers assumptions that market participants would use when pricing the asset or liability, such as inherent risk, transfer restrictions, and risk of nonperformance.
The Financial Accounting Standards Board (FASB) guidance also establishes a fair value hierarchy that requires an entity to maximize the use of observable inputs and minimize the use of unobservable inputs when measuring fair value. A financial instrument's categorization within the fair value hierarchy is based upon the lowest level of input that is significant to the fair value measurement. The three levels of inputs that may be used to measure fair value are as follows:
• | Level 1: quoted prices in active markets for identical assets or liabilities; |
• | Level 2: inputs other than Level 1 that are observable, either directly or indirectly, such as quoted prices in active markets for similar assets or liabilities, quoted prices for identical or similar assets or liabilities in markets that are not active, or other inputs that are observable or can be corroborated by observable market data for substantially the full term of the assets or liabilities; or |
• | Level 3: unobservable inputs that are supported by little or no market activity and that are significant to the fair value of the assets or liabilities. |
Financial Assets Measured at Fair Value on a Recurring Basis
Our significant financial assets measured at fair value on a recurring basis consisted of the following types of instruments as of October 31, 2011 (Level 1, 2 and 3 inputs are defined above):
Fair Value Hierarchy | As of October 31, 2011 | ||||||
(in thousands) | |||||||
Financial assets: | |||||||
Money market funds | Level 1 | $ | 13,575 | ||||
Total | $ | 13,575 | |||||
The fair value of money market funds reflect quoted market prices in an active market.
Note 4. | Valuation and Qualifying Accounts and Reserves |
Versant evaluates and revises its allowance for doubtful accounts receivable as part of its quarter end process at the subsidiary and corporate level. Company management assigns a risk factor and percentage of risk to each account receivable, the collection of which is considered non-routine. Accounts are considered past due in accordance with contractual terms which usually provide for payment within 30 to 90 days. Company management also assigns a general reserve to all its overdue accounts, excluding the non-routine items.
66
Note 4. | Valuation and Qualifying Accounts and Reserves (Continued) |
The following table summarizes the activities in the Company’s allowance for doubtful accounts (in thousands):
Fiscal Year Ended October 31, | |||||||||||
2011 | 2010 | 2009 | |||||||||
Allowance for doubtful accounts: | |||||||||||
Beginning balance | $ | 8 | $ | 36 | $ | 16 | |||||
Adjustments to provision | 8 | (28 | ) | 20 | |||||||
Ending balance | $ | 16 | $ | 8 | $ | 36 | |||||
Note 5. | Acquisitions, Goodwill and Intangible Assets |
Acquisition
On December 1, 2008, the Company acquired the assets of the database software business of privately-held Servo Software, Inc. or “Servo” (formerly known as db4objects, Inc.) pursuant to an asset purchase agreement between Versant and Servo dated December 1, 2008 (the “db4o Purchase Agreement”). The acquisition of the db4o assets allows Versant to provide an open source object database software solution targeting the embedded device market. Our results of operations include db4o transactions from the acquisition date of December 1, 2008.
The total purchase price of $2.6 million for the db4o assets consisted of the following:
a) Initial cash payment of $2.1 million made in December 2008;
b) Direct transaction costs of $183,000; and
c) Contingent deferred payments of $280,000.
Under the terms of the db4o Purchase Agreement, in consideration of its acquisition of the assets of the db4o business, Versant paid Servo the above-mentioned closing payment of $2.1 million in cash, agreed to pay up to a maximum of an additional $300,000 payable in three contingent deferred payments of up to $100,000 each during the 18-month period immediately following the December 1, 2008 acquisition date and assumed certain liabilities of Servo under certain contracts included among the db4o assets. The three contingent deferred payments of up to $100,000 each were payable six months, twelve months and eighteen months, respectively, following the December 1, 2008 acquisition date. The Company made the first contingent deferred payment of $100,000 to Servo on May 29, 2009, the second payment of $90,000 on November 30, 2009 and the third payment of $90,000 on May 28, 2010.
The total purchase price for the db4o assets was allocated to db4o's net tangible and identifiable intangible assets based on their estimated fair values as of the acquisition date, with the excess of the purchase price over these aggregate fair values recorded as goodwill. The fair value assigned to identifiable intangible assets acquired is determined using the income approach, which values each intangible asset based upon its estimated impact on the Company's expected future after-tax cash flows and discounts the net changes in the Company's expected future after-tax cash flows to present value. The discount was based on an analysis of the weighted-average cost of capital for the industry.
The Company's allocation of the purchase price for the db4o assets and liabilities is summarized below (in thousands):
As of October 31, 2011 | |||||
Allocation of purchase price: | |||||
Tangible net assets acquired | $ | 84 | |||
Customer relationships | 210 | ||||
Developed technology | 300 | ||||
Trade name | 100 | ||||
Goodwill | 1,869 | ||||
Total | $ | 2,563 | |||
67
Note 5. | Acquisitions, Goodwill and Intangible Assets (Continued) |
Purchased identifiable intangible assets are amortized on a straight-line basis over their useful lives. The estimated useful economic lives of the acquired customer relationships, developed technology and trade name are nine, five and five years, respectively. The weighted average amortization period of the db4o intangible assets is 6.4 years. db4o's results of operations for periods prior to this acquisition were not material to the Company's consolidated statements of income and, accordingly, pro forma financial information has not been presented.
Goodwill
The following table presents the Company's goodwill balance as of October 31, 2011 and 2010 (in thousands):
Net Carrying Amount | |||||
Goodwill: | |||||
Versant Europe | $ | 241 | |||
Poet Holdings, Inc. | 5,752 | ||||
FastObjects, Inc. | 677 | ||||
JDO Genie (PTY), Ltd | 50 | ||||
db4o | 1,869 | ||||
Total | $ | 8,589 | |||
Goodwill is subject to at least an annual assessment for impairment, applying a fair-value based test. Versant conducted its annual impairment test in October 2011 and determined there was no impairment.
The goodwill acquired in the db4o acquisition will be deductible for tax purposes based upon a 15 year tax life.
Intangible Assets The Company’s intangible asset balances as of October 31, 2011 and October 31, 2010 are as follows (in thousands): | |||||||||||||||||||||||||||
As of October 31, 2011 | As of October 31, 2010 | ||||||||||||||||||||||||||
Gross Carrying Amount | Accumulated Amortization | Net Carrying Amount | Gross Carrying Amount | Accumulated Amortization | Net Carrying Amount | ||||||||||||||||||||||
Intangible assets: | |||||||||||||||||||||||||||
Poet Holdings, Inc.- Developed Technology & Customer Relationships (Amortized over 7 years) | $ | 1,919 | $ | 1,919 | $ | — | $ | 1,919 | $ | 1,832 | $ | 87 | |||||||||||||||
db4o-Developed Technology (Amortized over 5 years) | 300 | 175 | 125 | 300 | 115 | 185 | |||||||||||||||||||||
db4o-Customer Relationships (Amortized over 9 years) | 210 | 68 | 142 | 210 | 44 | 166 | |||||||||||||||||||||
db4o-Trade Name (Amortized over 5 years) | 100 | 58 | 42 | 100 | 39 | 61 | |||||||||||||||||||||
Total | $ | 2,529 | $ | 2,220 | $ | 309 | $ | 2,529 | $ | 2,030 | $ | 499 | |||||||||||||||
Aggregate amortization expense for intangible assets was $190,000, $303,000 and $373,000 respectively, for the fiscal years ended October 31, 2011, 2010 and 2009.
68
Note 5. | Acquisitions, Goodwill and Intangible Assets (Continued) |
The projected amortization of the Company’s existing intangible assets as of October 31, 2011 is as follows (in thousands):
Amortization | |||||
Fiscal year ending October 31, | |||||
2012 | $ | 104 | |||
2013 | 103 | ||||
2014 | 30 | ||||
2015 | 23 | ||||
2016 | 23 | ||||
Thereafter | 26 | ||||
Total | $ | 309 | |||
Note 6. | Lease Obligation |
Lease commitments
Versant’s principal commitments as of October 31, 2011 consist of obligations under operating leases for facilities and equipment.
Versant leases office space for its U.S. headquarters in Redwood City, California and also leases field office space in Hamburg and Munich, Germany under multi-year operating lease agreements. The Company's operating lease arrangements as of October 31, 2011 are summarized below:
Leased Office Facility: | Lease Expiration Date | Total Rent Payable over the Remaining Lease Term | Options to Renew at Fair Value | ||||
Hamburg, Germany | 11/30/2014 | $ | 548,000 | Two three year renewal options | |||
Redwood City, California | 5/31/2013 | $ | 323,000 | Single one year renewal option | |||
Munich, Germany | 2/28/2014 | $ | 64,000 | Single two year renewal option | |||
Consolidated rent expense in fiscal years ended October 31, 2011, 2010 and 2009, was approximately $397,000, $427,000 and $507,000, respectively.
Our minimum commitments under non-cancelable operating leases as of October 31, 2011 are as follows (in thousands): | |||||||||||||
Facilities Leases | Equipment Leases | Total | |||||||||||
Fiscal year ending October 31, | |||||||||||||
2012 | $ | 407 | $ | 5 | $ | 412 | |||||||
2013 | 326 | 2 | 328 | ||||||||||
2014 | 187 | — | 187 | ||||||||||
2015 | 15 | — | 15 | ||||||||||
Total | $ | 935 | $ | 7 | $ | 942 | |||||||
On November 3, 2011, the Company entered into an amendment of its office building lease in Redwood City, California leasing approximately 2,500 square feet of additional space for the thirty months ending May 31, 2014. The total rent payable over the lease term is approximately $252,000.
69
Note 7. | Contingencies |
The Company is subject to various legal proceedings and disputes that arise in the ordinary course of business from time to time. There were no ongoing material legal proceedings as of October 31, 2011.
The Company enters into indemnification agreements in the ordinary course of business. The Company's license agreements with customers generally require it to indemnify the customer against claims that its software infringes third party patent, copyright, trademark or other proprietary rights. Such indemnification obligations are generally limited in a variety of industry-standard respects. If a liability associated with any of the Company's indemnifications becomes probable and the amount of the liability is reasonably estimable or the minimum amount of a range of loss is reasonably estimable, then an appropriate liability will be established. The estimated fair value of these indemnification clauses is minimal. The Company has not provided for any reserves for such indemnity liabilities.
Note 8. | Net Income Per Share |
Basic and diluted net income per common share has been computed using the weighted average number of shares of common stock outstanding during the period, less shares subject to repurchase. The following table presents the calculation of basic and diluted net income per share (in thousands, except per share amounts):
Fiscal Year Ended October 31, | |||||||||||
2011 | 2010 | 2009 | |||||||||
Net income | $ | 702 | $ | 1,654 | $ | 4,839 | |||||
Calculation of basic net income per share: | |||||||||||
Weighted average - common shares outstanding | 3,078 | 3,411 | 3,626 | ||||||||
Net income per share, basic | $ | 0.23 | $ | 0.48 | $ | 1.33 | |||||
Calculation of diluted net income per share: | |||||||||||
Weighted average - common shares outstanding | 3,078 | 3,411 | 3,626 | ||||||||
Dilutive effect of employee and director stock options | 5 | 33 | 37 | ||||||||
Weighted average - common shares outstanding and potentially dilutive common shares | 3,083 | 3,444 | 3,663 | ||||||||
Net income per share, diluted | $ | 0.23 | $ | 0.48 | $ | 1.32 | |||||
For the years ended October 31, 2011, 2010, and 2009, 403,000, 352,000 and 182,000 potentially dilutive shares, respectively, were excluded from the computation of diluted net income per share by the application of the treasury stock method.
Note 9. | Common Stock Repurchases |
Fiscal Year 2010 Stock Repurchase Program
On November 30, 2009, Versant’s Board of Directors approved a stock repurchase program authorizing Versant to repurchase up to $5.0 million of its outstanding common shares on the open market, in block trades or otherwise. This stock repurchase program expired by its terms on October 31, 2010. Pursuant to this program, Versant acquired 356,104 common shares on the open market and in block trades for approximately $4.3 million at an average purchase price of $12.06 per share.
Fiscal Year 2011 Stock Repurchase Program
On November 29, 2010 Versant’s Board of Directors approved a stock repurchase program authorizing Versant to repurchase up to $5.0 million of its outstanding common shares on the open market, in block trades or otherwise. This stock repurchase program expired by its terms on October 31, 2011. Pursuant to this program, Versant acquired 240,629 common shares on the open market for approximately $3.0 million at an average purchase price of $12.23 per share.
70
Note 9. | Common Stock Repurchases (Continued) |
Fiscal Year 2012 Stock Repurchase Program
On November 28, 2011 Versant’s Board of Directors approved a new stock repurchase program announced on December 1, 2011 pursuant to which Versant is authorized to repurchase up to $5.0 million of its common stock in fiscal year 2012. This stock repurchase program is currently scheduled to expire upon the earlier of October 31, 2012, or at such time as Versant has expended $5.0 million to repurchase outstanding common shares under the program; however the program may be suspended, discontinued or extended at any earlier time by the Company.
Other Stock Repurchase
On March 10, 2011, Versant and the Company’s then Chief Executive Officer ("Former CEO") entered into a separation agreement (the “Separation Agreement”). On March 28, 2011, pursuant to the Separation Agreement, Versant repurchased 62,545 shares of Versant common stock owned by the Former CEO at a price of $13.50 per share, which price reflected recent market trading prices of Versant’s common stock as of the date of the Separation Agreement.
Note 10. | Employee and Director Benefit Plans |
Versant has, or had during fiscal year 2011, the following option plans in place:
2005 Equity Incentive Plan
The 2005 Equity Incentive Plan was approved by Versant's shareholders in August 2005 to replace the Company's 1996 Equity Incentive Plan. Upon adoption of the 2005 Equity Incentive Plan, the Company immediately terminated use of the 1996 Equity Incentive Plan. Under the 2005 Equity Incentive Plan, the Company is authorized to grant stock options, restricted stock awards and stock bonuses. These options are generally granted to its employees with a three-year vesting schedule in which 25% of the option vests and becomes exercisable nine months from the grant date and the remaining 75% vests ratably, on a monthly-basis thereafter over the remaining 27 months of the vesting schedule. All options granted to employees under the Company's 2005 Equity Incentive Plan expire no later than ten years after the grant date.
1996 Equity Incentive Plan
Although the 1996 Equity Incentive Plan has since expired by its terms, options to purchase a total of 7,655 shares originally granted under this Plan were still outstanding as of October 31, 2011.
2005 Directors' Stock Option Plan
The 2005 Directors' Stock Option Plan was approved by Versant's shareholders in August 2005 to replace the Company's 1996 Directors' Stock Option Plan. Upon adoption of the 2005 Directors' Stock Option Plan, the Company immediately terminated use of the 1996 Directors' Stock Option Plan. Under the 2005 Directors' Stock Option Plan, Versant grants 4,000 options as an initial grant to new directors on the Board who are not employees of the Company or of a parent, subsidiary or affiliate of the Company (“Outside Directors”) and grants 4,000 additional options to each Outside Director as an annual succeeding grant thereafter. Both initial and succeeding option grants vest 50% on the first and second anniversaries of the option grant, though the options are immediately exercisable upon grant subject to the Company's option to repurchase outstanding unvested option shares at their issue price if the option holder ceases to be a member of the Company's Board of Directors. The options granted under the 2005 Directors' Stock Option Plan must expire no more than ten years after the grant date.
1996 Directors' Stock Option Plan
As of October 31, 2011, a total of 15,000 options remain outstanding under Versant's 1996 Directors' Stock Option Plan. Versant ceased granting options under its 1996 Directors' Stock Option Plan in August 2005 and no further options will be granted under the 1996 Directors' Stock Option Plan.
Assumed Poet Options and Plans
Versant acquired all of Poet's stock option plans in connection with our March 2004 acquisition of Poet. As of October 31, 2011, a total of 14,363 options remain outstanding under these Poet plans. No further options will be granted under any of Poet's option plans.
71
Note 10. | Employee and Director Benefit Plans (Continued) |
2005 Employee Stock Purchase Plan
The 2005 Employee Stock Purchase Plan was approved by Versant's shareholders in August 2005 to replace the Company's 1996 Employee Stock Purchase Plan. Upon adoption of the 2005 Employee Stock Purchase Plan, the Company immediately terminated use of the 1996 Employee Stock Purchase Plan and ceased to issue stock under the 1996 Employee Stock Purchase Plan, and instead thereafter issued stock under the 2005 Employee Stock Purchase Plan. The number of common shares initially reserved under the 2005 Employee Stock Purchase Plan was equal to the number of shares that were reserved and available for issuance under the 1996 Employee Stock Purchase Plan on the date of the approval of the new plan.
Under the Employee Stock Purchase Plan, employees may generally defer up to 10% of their compensation to purchase shares of our common stock at a purchase price equal to 85% of the lower of the fair market value per share of our common stock on the commencement date of the applicable six month offering period or the applicable purchase date. As of October 31, 2011, approximately 30,000 shares were available for future issuance under the Employee Stock Purchase Plan.
Shares Reserved for Future Issuance
At the Company's 2011 annual shareholder meeting, held on April 18, 2011, the shareholders approved an increase of 300,000 shares and 20,000 shares in the numbers of shares reserved under the Company's 2005 Equity Incentive Plan and 2005 Directors' Stock Option Plan, respectively.
As of October 31, 2011, the Company has reserved shares of common stock for the following purposes (in thousands):
Shares | ||
Reserved for issuance: | ||
Employee stock purchase plan | 30 | |
Stock options available for grant | 345 | |
Outstanding stock options | 651 | |
Balance as of October 31, 2011 | 1,026 | |
The stock option activities in fiscal years 2011, 2010 and 2009 were as follows:
Options available for grant | Number of options outstanding | Weighted average exercise price | |||||||
(in thousands) | |||||||||
Balance as of October 31, 2008 | 188 | 303 | $ | 20.40 | |||||
Authorized | 220 | — | — | ||||||
Granted | (153 | ) | 153 | 13.55 | |||||
Exercised | — | (13 | ) | 9.09 | |||||
Forfeited and expired | 52 | (57 | ) | 17.88 | |||||
Balance as of October 31, 2009 | 307 | 386 | $ | 18.45 | |||||
Authorized | — | — | — | ||||||
Granted | (164 | ) | 164 | 17.42 | |||||
Exercised | — | (3 | ) | 10.85 | |||||
Forfeited and expired | 29 | (32 | ) | 39.89 | |||||
Balance as of October 31, 2010 | 172 | 515 | $ | 16.84 | |||||
Authorized | 320 | — | — | ||||||
Granted | (177 | ) | 177 | 11.84 | |||||
Exercised | — | (7 | ) | 4.35 | |||||
Forfeited and expired | 30 | (34 | ) | 24.75 | |||||
Balance as of October 31, 2011 | 345 | 651 | $ | 15.20 | |||||
72
Note 11. | Share Based Compensation |
Versant accounts for share-based compensation costs in accordance with ASC 718, Compensation, Stock Compensation. The Company utilizes the Black-Scholes option pricing model to estimate the fair value of employee stock option compensation at the date of grant.
Versant bases the expected term of its options on historical exercise data, while considering other factors that could possibly impact the future life of the options. As of October 31, 2011, the Company determined that the estimated expected life of an employee share option granted under the Company's Equity Incentive Plan was 4.2 years. The expected life for the options granted under the Directors' Plans to the board members who are not full time employees of Versant is 5.75 years. Versant used the simplified method allowed by SEC Staff Accounting Bulletin Nos.107 and 110 to arrive at this calculation. Under the simplified method, the expected term is equal to vesting term plus original contractual term divided by two. As of October 31, 2011, Versant uses historical volatility as the best estimate of the future volatility of its common stock.
Versant does not expect to realize any current tax benefits in fiscal year 2011 related to stock options or shares issued under its ESPP. Versant currently provides a full valuation allowance for its domestic deferred tax assets and accordingly, a valuation allowance is also provided for any tax effects of share based compensation expense.
The fair values of each option granted and each share issued under the ESPP are estimated on the date of grant, using the Black-Scholes Option Pricing Model, based on the following weighted average assumptions: | |||||||||||
Stock Options | ESPP | ||||||||||
Fiscal Year Ended October 31, | Fiscal Year Ended October 31, | ||||||||||
2011 | 2010 | 2009 | 2011 | 2010 | 2009 | ||||||
Assumptions: | |||||||||||
Volatility | 46% - 53% | 53% - 65% | 56% - 73% | 23% - 31% | 33% - 42% | 59% - 65% | |||||
Expected life | 3.6 - 5.75 years | 3.3 - 5.75 years | 2.4 - 5.75 years | 6 - 12 months | 6 - 12 months | 6 - 12 months | |||||
Weighted average risk-free interest rate | 1.14% - 1.95% | 1.43% - 1.87% | .82% - 2.58% | 0.10% - 0.28% | 0.15% - 0.35% | 0.29% - 0.45% | |||||
Dividend yield | — | — | — | — | — | — | |||||
Share based compensation expense recognized in the consolidated statements of income related to the Company’s stock option plans and the ESPP for fiscal years 2011, 2010 and 2009 was as follows (in thousands): | ||||||||||||
Fiscal Year Ended October 31, | ||||||||||||
2011 | 2010 | 2009 | ||||||||||
Share based compensation expense: | ||||||||||||
Stock options | $ | 932 | $ | 1,022 | $ | 933 | ||||||
ESPP | 57 | 45 | 37 | |||||||||
Total | $ | 989 | $ | 1,067 | $ | 970 | ||||||
Share based compensation recognized in the consolidated statements of income, by income statement caption, was as follows (in thousands): | ||||||||||||
Fiscal Year Ended October 31, | ||||||||||||
2011 | 2010 | 2009 | ||||||||||
Share based compensation expense: | ||||||||||||
Cost of revenues | $ | 64 | $ | 76 | $ | 59 | ||||||
Sales and marketing | 255 | 224 | 137 | |||||||||
Research and development | 207 | 232 | 218 | |||||||||
General and administrative | 463 | 535 | 556 | |||||||||
Total | $ | 989 | $ | 1,067 | $ | 970 | ||||||
73
Note 11. | Share Based Compensation (Continued) |
The following table summarizes significant ranges of outstanding and exercisable options as of October 31, 2011: | |||||||||||||||||||||||||||||||||
As of October 31, 2011 | |||||||||||||||||||||||||||||||||
Options Outstanding | Options Exercisable | ||||||||||||||||||||||||||||||||
Number of Options (in thousands) | Weighted average remaining life (in years) | Weighted average exercise price | Number of Options (in thousands) | Weighted average remaining life (in years) | Weighted average exercise price | ||||||||||||||||||||||||||||
Exercise Prices: | |||||||||||||||||||||||||||||||||
From $3.00 - $11.12 | 107 | 4.39 | $ | 8.69 | 107 | 4.39 | $ | 8.69 | |||||||||||||||||||||||||
From $11.13 - $11.81 | 134 | 8.33 | 11.81 | 48 | 7.03 | 11.81 | |||||||||||||||||||||||||||
From $11.82 - $15.06 | 135 | 6.62 | 13.26 | 113 | 6.18 | 13.19 | |||||||||||||||||||||||||||
From $15.07 - $18.80 | 145 | 6.74 | 18.42 | 108 | 6.28 | 18.33 | |||||||||||||||||||||||||||
From $18.81 - $30.50 | 130 | 5.03 | 22.50 | 130 | 5.03 | 22.50 | |||||||||||||||||||||||||||
651 | 6.32 | $ | 15.20 | 506 | 5.61 | $ | 15.59 | ||||||||||||||||||||||||||
Options expected to vest as of October 31, 2011 | 638 | ||||||||||||||||||||||||||||||||
Aggregate intrinsic value of options (in thousands) | $ | 327 | $ | 327 | |||||||||||||||||||||||||||||
Aggregate intrinsic value of shares expected to vest (in thousands) | $ | 327 | |||||||||||||||||||||||||||||||
The aggregate intrinsic value of stock options outstanding and exercisable, and vested or expected to vest, at October 31, 2011 was based on the closing price of our common stock on October 31, 2011 of $11.75 per share.
The summary of the status of Versant's nonvested shares as of October 31, 2011 and changes during the fiscal year ended October 31, 2011 is as follows:
Shares (in thousands) | Weighted average grant date fair value | |||||||||
Nonvested shares: | ||||||||||
Nonvested shares as of October 31, 2010 | 167 | $ | 6.81 | |||||||
Granted | 177 | 4.73 | ||||||||
Vested | (163 | ) | 5.60 | |||||||
Forfeited | (16 | ) | 5.25 | |||||||
Nonvested shares as of October 31, 2011 | 165 | $ | 5.47 | |||||||
Additional information related to the fair value of Versant's stock options as of October 31, 2011, 2010 and 2009 is as follows (in thousands, except for per share amounts):
Fiscal Year Ended October 31, | ||||||||||||
2011 | 2010 | 2009 | ||||||||||
Weighted average grant date fair value of options granted (per share) | $ | 4.73 | $ | 7.23 | $ | 5.52 | ||||||
Total value of options granted | $ | 837 | $ | 1,183 | $ | 844 | ||||||
Total fair value of shares vested | $ | 913 | $ | 1,030 | $ | 898 | ||||||
Total intrinsic value of options exercised | $ | 63 | $ | 8 | $ | 89 | ||||||
74
Note 11. | Share Based Compensation (Continued) |
The total unrecognized compensation costs related to nonvested options were $813,000 at October 31, 2011 and will be recognized over a weighted average period of approximately 1.5 years. Future stock option grants and the intrinsic value of ESPP shares will increase the unrecognized compensation, whereas quarterly amortization and the vesting of the existing stock option grants will reduce it.
Note 12. | Restructuring |
In the fourth quarter of fiscal year 2009, the Company committed to the implementation of a restructuring plan pursuant to which it closed its research and development facility in Pune, India and is winding down the affairs of its subsidiary, Versant India Private Limited (“Versant India”). The restructuring plan was undertaken to consolidate the Company’s research and development efforts into one location in Germany in order to streamline operations, create management efficiencies and increase productivity. Since the plan was undertaken, Versant has incurred restructuring costs of $203,000 as of October 31, 2011. The restructuring was substantially completed during the second quarter ended April 30, 2010.
The following table reflects the type and amount of these restructuring charges (accrual reversal) included in operating expenses for fiscal years 2011, 2010 and 2009 (in thousands): | ||||||||||||
Fiscal Year Ended October 31, | ||||||||||||
2011 | 2010 | 2009 | ||||||||||
Restructuring: | ||||||||||||
Severance, retention and related charges | $ | — | $ | 38 | $ | 32 | ||||||
Impairment of fixed assets | 20 | 2 | 61 | |||||||||
Impairment to other assets | 5 | (29 | ) | 42 | ||||||||
Contract termination costs | — | 8 | — | |||||||||
Other direct costs of closure | — | 20 | 4 | |||||||||
$ | 25 | $ | 39 | $ | 139 | |||||||
The following table reflects the restructuring charges included in accrued liabilities on the consolidated balance sheets (in thousands):
Restructuring accrual balance as of October 31, 2009 | $ | 32 | |
Payment of employee termination costs | (32 | ) | |
Restructuring accrual balance as of October 31, 2010 | — | ||
No payments or accruals | — | ||
Restructuring accrual balance as of October 31, 2011 | $ | — | |
Note 13. | Income Taxes |
The Company accounts for income taxes pursuant to the provisions of ASC 740, Income Taxes, which requires an asset and liability approach to accounting for income taxes. Deferred tax assets and liabilities are determined based on the difference between the financial statement carrying amounts and the tax basis of assets and liabilities and are measured using the enacted statutory tax rates in effect at the balance sheet date. The Company records a valuation allowance to reduce its deferred tax assets when uncertainty exists regarding the realizability of the deferred tax assets.
Income before provision for income tax expense (benefit) consisted of the following (in thousands): | ||||||||||||
Fiscal Year Ended October 31, | ||||||||||||
2011 | 2010 | 2009 | ||||||||||
Region: | ||||||||||||
United States | $ | (1,973 | ) | $ | (1,261 | ) | $ | (1,015 | ) | |||
International | 2,957 | 3,382 | 5,292 | |||||||||
$ | 984 | $ | 2,121 | $ | 4,277 | |||||||
75
Note 13. | Income Taxes (Continued) |
The provision for income tax expense (benefit) consisted of the following (in thousands): | ||||||||||||
Fiscal Year Ended October 31, | ||||||||||||
2011 | 2010 | 2009 | ||||||||||
Current: | ||||||||||||
Federal | $ | — | $ | — | $ | — | ||||||
State | (24 | ) | 4 | 23 | ||||||||
Foreign | 242 | 395 | 300 | |||||||||
Foreign withholding | 64 | 68 | 54 | |||||||||
Total current | 282 | 467 | 377 | |||||||||
Deferred: | ||||||||||||
Federal | — | — | — | |||||||||
State | — | — | — | |||||||||
Foreign | — | — | (939 | ) | ||||||||
Total deferred | — | — | (939 | ) | ||||||||
Total provision for income tax expense (benefit) | $ | 282 | $ | 467 | $ | (562 | ) | |||||
The provision for income taxes in Germany included approximately $212,000 and $395,000 for fiscal year 2011 and fiscal year 2010, respectively, attributable to taxable income related to our German operations that were in excess of the allowable utilization of the tax loss carry forwards, and therefore, subject to corporate taxes. The provision for income taxes in Germany also included approximately $30,000 related to uncertain tax positions.
The provision for income tax expense (benefit) differs from the amount estimated by applying the statutory federal income tax rate (35%) to income before taxes as follows (in thousands):
Fiscal Year Ended October 31, | ||||||||||||
2011 | 2010 | 2009 | ||||||||||
Federal tax at statutory rate | $ | 344 | $ | 742 | $ | 1,497 | ||||||
State tax at statutory rate, net of federal benefit | (89 | ) | 32 | (138 | ) | |||||||
Change in valuation allowance | (2,318 | ) | (2,560 | ) | (711 | ) | ||||||
Foreign tax differential | (161 | ) | 886 | (1,299 | ) | |||||||
Foreign tax dividend | — | 1,361 | — | |||||||||
Decrease in net operating loss carry forwards | 2,405 | — | — | |||||||||
Other | 101 | 6 | 89 | |||||||||
$ | 282 | $ | 467 | $ | (562 | ) | ||||||
The components of the net deferred tax asset were as follows (in thousands):
As of October 31, | ||||||||
2011 | 2010 | |||||||
Deferred tax assets: | ||||||||
Net operating loss carry forwards | $ | 30,116 | $ | 32,543 | ||||
Tax credit carry forwards | 1,930 | 1,880 | ||||||
Other | 453 | 394 | ||||||
32,499 | 34,817 | |||||||
Valuation allowance | (31,601 | ) | (33,933 | ) | ||||
Net deferred tax asset | $ | 898 | $ | 884 | ||||
76
Note 13. | Income Taxes (Continued) |
At October 31, 2011, the Company had federal and state net operating loss carry forwards of $61.5 million and $13.0 million, respectively, and federal and state tax credit carry forwards of $1.5 million and $664,000, respectively. The federal and state net operating loss carry forwards expire on various dates through 2031 including $2.9 million of federal net operating loss carry forwards expiring in 2012. The federal tax credit carry forwards expire on various dates through 2024. The state tax credit can be carried forward indefinitely. Additionally, at October 31, 2011, the Company had German net operating tax loss carry forwards of approximately $24.2 million. The German tax code provides for certain annual statutory limitations related to the use of tax loss carry forward amounts. For each taxable year, the Company may utilize German tax loss carry forwards fully up to the first million euros of taxable income, and thereafter, the tax loss carry forwards are limited to 60% of taxable income. Ultimately, the realization of the deferred tax assets is dependent upon the Company's generation of sufficient future taxable income to enable it to use net operating loss and tax credit carry forwards during those periods in which such carry forwards can be utilized by the Company.
In evaluating Versant's ability to utilize its deferred tax assets, management of the Company considers all available positive and negative evidence, including past operating results in the most recent fiscal years and an assessment of expected future results of operations on a jurisdiction by jurisdiction basis. As of October 31, 2011, the Company had a valuation allowance of approximately $31.6 million recorded against the Company's net deferred tax assets in the U.S. and foreign jurisdictions.
The Company has experienced substantial past tax losses in its U.S. operations. Due to the lack of forecasted future taxable income and the relative size of the Company's Federal and California net operating loss carry forwards, considerable uncertainty exists that the Company will realize these deferred tax assets. Based on this objective evidence, a full valuation allowance has been recorded against the Company's deferred tax assets related to its U.S. operations.
The Company has also experienced substantial past tax losses in its European operations. In its most recent fiscal years, the Company has generated taxable income and begun to utilize its deferred tax assets related to its German net operating loss carry forwards. Management of the Company has forecasted taxable income for its European operations for fiscal year 2012. The global economic downturn has negatively impacted the Company's operating results in all regions. The Company has experienced declining revenues as economic conditions have remained difficult. Given the uncertainty of the macroeconomic environment, future revenues and operating results are difficult to forecast. Therefore, management has concluded it is more likely than not that the Company will realize the benefit of its deferred tax assets related to its German net operating loss carry forwards only to the extent of its expected taxable income in fiscal year 2012.
Significant management judgment is required to determine when, in the future, it will become more likely than not that additional net deferred tax assets will be realized. Management will continue to assess the realizability of the tax benefit available based on actual and forecasted operating results. Management does not anticipate significant changes to its uncertain tax positions through October 31, 2012.
Due to "change in ownership" provisions of the Internal Revenue Code of 1986, the availability of net operating loss and tax credit carry forwards to offset federal taxable income in future periods is subject to an annual limitation. In addition, the State of California has in certain cases suspended the ability to utilize net operating loss carry forwards in the current (and certain past) tax years and could do so again in the future.
A portion of deferred tax assets relating to net operating losses pertains to net operating loss carry forwards resulting from tax deductions upon the exercise of employee stock options of approximately $1.6 million. When recognized, the tax benefit of these loss carry forwards will be accounted for as a credit to additional paid-in capital rather than a reduction of income tax expense.
The Company adopted the provisions of ASC 740, Income Taxes related to uncertain tax positions on November 1, 2007.
A reconciliation of the beginning and ending amount of unrecognized tax benefits is as follows (in thousands):
Balance as of October 31, 2010 | $ | 1,629 | |
Additions for current year tax positions | 124 | ||
Additions for prior years' tax positions | — | ||
Reductions for prior years' tax positions | (94 | ) | |
Balance as of October 31, 2011 | $ | 1,659 | |
If recognized, $1.4 million of these unrecognized tax benefits would affect the effective tax rate.
77
Note 13. | Income Taxes (Continued) |
The Company is subject to U.S. federal income taxes and to income taxes in various states in the U.S. as well as in foreign jurisdictions. Tax regulations within each jurisdiction are subject to the interpretation of the related tax laws and regulations and require significant judgment to apply. With few exceptions, the Company is no longer subject to U.S. federal, state and local, or foreign tax examinations by tax authorities for tax years before 2006. However, with respect to prior tax years no longer subject to examination due to expiration of the statute of limitations, income may nevertheless be recomputed for the purpose of determining the amount of NOL that may be carried over to "open" years.
Note 14. | Selected Quarterly Information (unaudited) |
Summarized quarterly supplemental consolidated financial information for fiscal years 2011 and 2010 is as follows (in thousands, except per share amounts):
Fiscal Year 2011 Quarters Ended | Fiscal Year 2010 Quarters Ended | ||||||||||||||||||||||||||||||||||||||||||||||
October 31, | July 31, | April 30, | January 31, | October 31, | July 31, | April 30, | January 31, | ||||||||||||||||||||||||||||||||||||||||
Revenues | $ | 3,979 | $ | 4,204 | $ | 3,512 | $ | 4,577 | $ | 4,372 | $ | 3,424 | $ | 3,515 | $ | 4,455 | |||||||||||||||||||||||||||||||
Cost of revenues | 460 | 502 | 505 | 535 | 521 | 495 | 539 | 558 | |||||||||||||||||||||||||||||||||||||||
Gross profit | 3,519 | 3,702 | 3,007 | 4,042 | 3,851 | 2,929 | 2,976 | 3,897 | |||||||||||||||||||||||||||||||||||||||
Operating expenses | 3,078 | 3,207 | 3,562 | 3,477 | 2,927 | 2,733 | 2,826 | 3,196 | |||||||||||||||||||||||||||||||||||||||
Income (loss) from operations | 441 | 495 | (555 | ) | 565 | 924 | 196 | 150 | 701 | ||||||||||||||||||||||||||||||||||||||
Net income (loss) | $ | 304 | $ | 474 | $ | (537 | ) | $ | 461 | $ | 921 | $ | 130 | $ | 98 | $ | 505 | ||||||||||||||||||||||||||||||
Net income (loss) per share | |||||||||||||||||||||||||||||||||||||||||||||||
Basic | $ | 0.10 | $ | 0.16 | $ | (0.17 | ) | $ | 0.14 | $ | 0.28 | $ | 0.04 | $ | 0.03 | $ | 0.14 | ||||||||||||||||||||||||||||||
Diluted | $ | 0.10 | $ | 0.16 | $ | (0.17 | ) | $ | 0.14 | $ | 0.28 | $ | 0.04 | $ | 0.03 | $ | 0.14 | ||||||||||||||||||||||||||||||
78
Item 9. Changes in and Disagreements with Accountants on Accounting and Financial Disclosure
Not applicable.
Item 9A. Controls and Procedures
Evaluation of Disclosure Controls and Procedures
Our management (with the participation of our Chief Executive Officer and our Chief Financial Officer) evaluated the effectiveness of our disclosure controls and procedures (as defined in Rules 13a-15(e) and 15d-15(e) under the Securities Exchange Act of 1934, as amended, or the Exchange Act), as of October 31, 2011, the end of the fiscal period covered by this report on Form 10-K.
Based on the evaluation of the effectiveness of our disclosure controls and procedures by our management, with the participation of our Chief Executive Officer and Chief Financial Officer, as of October 31, 2011, the end of the period covered by this report, our Chief Executive Officer and Chief Financial Officer have concluded that our disclosure controls and procedures were effective to provide reasonable assurance that information required to be disclosed in the reports that the Company files or submits under the Exchange Act is (i) recorded, processed, summarized and reported, within the time periods specified in the Commission's rules and forms and (ii) is accumulated and communicated to the Company's management, including its principal executive and principal financial officers, or persons performing similar functions, as appropriate to allow timely decisions regarding required disclosure.
Management's Report on Internal Control over Financial Reporting
Our management is responsible for establishing and maintaining adequate internal control over financial reporting as defined in Rules 13a-15(f) and 15d-15(f) under the Exchange Act.
Management assessed the effectiveness of Versant's internal control over financial reporting as of October 31, 2011, the end of the period covered by this report. In making its evaluation of the effectiveness of Versant's internal control over financial reporting, management used the criteria set forth in Internal Control-Integrated Framework issued by the Committee of Sponsoring Organizations of the Treadway Commission (“COSO”).
Based on its assessment of internal control over financial reporting and the above criteria, Versant's management has concluded that, as of October 31, 2011, Versant's internal control over financial reporting was effective to provide reasonable assurance regarding the reliability of financial reporting and the preparation of financial statements for external purposes in accordance with generally accepted accounting principles.
Because of its inherent limitations, internal control over financial reporting may not prevent or detect misstatements due to human error, or the improper circumvention or overriding of internal controls. In addition, projections of any evaluation of the effectiveness of internal control over financial reporting to future periods are subject to the risk that controls may become inadequate because of changes in conditions and that the degree of compliance with the policies or procedures may change adversely over time.
This annual report does not include an attestation report by the Company's independent registered public accounting firm regarding the effectiveness of internal control over financial reporting. Management's report was not subject to attestation by the Company's independent registered public accounting firm pursuant to rules of the Securities Exchange Commission that permit the Company to provide only management's report in this annual report.
Changes in Internal Control over Financial Reporting
There was no change in our internal control over financial reporting that occurred during the fourth quarter of the fiscal year ended October 31, 2011 that has materially affected, or is reasonably likely to materially affect, our internal control over financial reporting.
Item 9B. Other Information
None.
79
PART III
Item 10. Directors, Executive Officers and Corporate Governance
Directors of the Company
The following table sets forth certain information concerning the members of the Board of Directors:
Name of Director | Age | Principal Occupation | Versant Board Member Since | |||
Bernhard Woebker | 62 | President & Chief Executive Officer of Versant | 2005 | |||
Uday Bellary | 57 | Chief Financial Officer of Greenvolts, Inc. | 2003 | |||
Anthony Bettencourt | 51 | President, Chief Executive Officer and Chairman of the Board of Coverity, Inc. | January 2, 2012 | |||
Robert Brammer | 65 | President & Chief Executive Officer of Brammer Technology, LLC | November 28, 2011 | |||
William Henry Delevati | 63 | Chairman of the Board of Versant | 1999 | |||
Herbert May | 62 | Consultant | 2004 | |||
Bernhard Woebker is Versant's President and Chief Executive Officer and a member of Versant's Board of Directors and the Managing Director of the Company's subsidiary, Versant GmbH. He has served as a director of the Company since June 2005 and was previously a director of the Company from June 1999 until the Company's merger with Poet Holdings, Inc. in March 2004. Mr. Woebker has been a consultant to various investment banking and venture capital firms in Europe and the United States since late 1999. From January 1999 until July 2001, he served as Executive Vice President of the Company and from March 1997 until January 1999 he served as the Company's Vice President and General Manager in Europe. From 1994 to March 1997, he was the President of Versant Object Technology GmbH, an independently-owned distributorship for Versant products in Europe, which was acquired by Versant in March 1997. From 1976 until 1994, Mr. Woebker held a variety of positions in Germany and the United States with Nixdorf Computer AG, Nixdorf Computer Engineering Corp. and Siemens Nixdorf Informationssysteme AG, all information technology companies, including the position of President and CEO of Nixdorf Computer Engineering Corp. in Boston, Massachusetts from 1986 to 1989. Mr. Woebker has also served as Senior Vice President of Pyramid Technology Corp. in Europe and as Vice President of NeXT Computer, Inc. in Europe. From March 2010 to September 2010, Mr. Woebker served on the board of directors of Intershop Communications AG, a publicly held German company listed in Germany that provides software solutions for ecommerce applications. Mr. Woebker received a Masters of Science degree in Mathematics and Computer Science from the University of Hannover.
Uday Bellary has served as a director of Versant since July 2003. From February 2010 to the present, Mr. Bellary has served as the Chief Financial Officer of GreenVolts, Inc., a privately held company that develops and commercializes concentrating photovoltaic (CPV) technology for solar energy applications. From May 2007 to December 2009, Mr. Bellary served as President, Chief Executive Officer and Chief Financial Officer of Wortal, Inc., and currently serves as a member of its Board of Directors and its Secretary. Wortal, Inc. is a privately-held company that provided consumers with value-added information on consumer and community-related topics such as entertainment, services, local activities, home needs and work-related matters through community-oriented portals accessible from the Internet and mobile platforms. Wortal sold its intellectual property assets to a corporate acquiror in December 2011 and thereupon ceased active business operations. He also previously served as the Chief Financial Officer of Atrica, Inc., a privately held optical Ethernet company, on a full-time basis from November 2005 to January 2008, when Atrica was sold to Nokia Siemens Networks, and on a part-time basis between April 2005 and October 2005. Mr. Bellary also served as part time Executive Vice President, Finance, Administration and Operations and Chief Financial Officer of VL, Inc. a privately held VoIP services company, and as a member of its board of directors from September 2003 to November 2005 and remained an advisor until 2007. From February 2000 to August 2003, he served as the Senior Vice President, Finance & Administration and Chief Financial Officer of Metro Optix, Inc., a privately held provider of optical networking equipment, which, to satisfy its liabilities, disposed of its intellectual property and other assets to Xtera Communications and ceased operations in August of 2003. Since July 2004 Mr. Bellary has also been a member of the board of directors of Backweb Technologies Ltd., a publicly held provider of software that enables mobile workers to access web-based applications, that is no longer a reporting company under the Securities Exchange Act of 1934. Mr. Bellary received a B.S. degree in Finance, Accounting and Economics from Karnatak University and a DMA degree in Finance from the University of Bombay, India. Mr. Bellary is a Certified Public Accountant and a Chartered Accountant.
80
Anthony Bettencourt joined the Board of Directors on January 2, 2012. From November 2010 to the present, Mr. Bettencourt has served as the President, Chief Executive Officer and Chairman of the Board of Coverity, Inc., a privately held company that develops and markets development testing solutions that assist software developers in detecting and fixing quality and security problems. Prior to joining Coverity in 2010, Mr. Bettencourt served as the Chief Executive Officer of Verity Inc., a leader in enterprise search, and led the company through its acquisition by Autonomy Corporation plc in 2005. After Verity's acquisition by Autonomy, Mr. Bettencourt served as Senior Vice President of Special Projects at Autonomy from 2006 to 2009, during which time he also served successively as CEO of several Autonomy subsidiaries. Mr. Bettencourt currently serves as the non-executive chairman of the board of directors of Blinkx, Inc., an Internet video search engine company whose stock trades on the AIM market of the London Stock Exchange, and also serves on the board of directors of several privately held companies. Mr. Bettencourt holds a B.A. in English from Santa Clara University.
Robert Brammer joined the Board of Directors on November 28, 2011. He is the President and CEO of Brammer Technology, LLC, a consulting firm. From July 2004 to July 2011, Dr. Brammer was employed by Northrop Grumman Information Systems, a division of Northrop Grumman Corporation that provides advanced information enterprise solutions to government and civilian customers, where he most recently served as Vice-President for Advanced Technology and CTO. Previous to that, Dr. Brammer was Vice President and Chief Technology Officer at TASC, Inc., a privately held company (formerly a subsidiary of Northrop Grumman) that provides advanced systems engineering, integration and decision-support services to agencies of the federal government. Dr. Brammer received a Ph.D in Mathematics from the University of Maryland College Park and a B.S. in Mathematics from the University of Michigan.
William Henry Delevati has been the Chairman of the Board since June 2005 and has served as a director of the Company since October 1999. Mr. Delevati has also served as a consultant to various companies located in the Silicon Valley area since April 2000. From October 1999 to April 2000, Mr. Delevati served as the Senior Vice President, Information Technology and Chief Information Officer of Aspect Communications Corporation, a provider of customer call center solutions. From November 1995 to April 1999, he served as Vice President of Worldwide Information Services for Quantum Corporation, a storage device company. From April 1995 to November 1995, he was the Chief Information Officer, Senior Vice President of MIS for Conner Peripherals, a storage device company. From September 1994 to April 1995, he was the Chief Information Officer, Vice President of Worldwide MIS for Borland Corporation, a software tools company. From September 1993 to September 1994, he was the Chief Information Officer, Vice President of Worldwide MIS for Logitech, a computer peripheral device company. From December 1987 to September 1993, he was the Director of Application Development and Global Information Resources for Sun Microsystems, Inc. Mr. Delevati received a Bachelor of Science degree in Computer Science from UC Berkeley and an MBA from Arizona State University.
Dr. Herbert May has served as a director of the Company since March 2004. From November 2000 to March 2004, he served as Chairman of the board of directors of Poet Holdings, Inc., a company that merged with Versant in March 2004. In addition, Dr. May served as a member of both the Audit and Compensation Committees of Poet Holdings, Inc. Dr. May has held several leading positions at Alcatel in both Stuttgart and Paris. His last position at Alcatel was Head of the Office of Communication Division. From February 1994 to September 1995, Dr. May took a leading role as CEO in establishing DeTeSystems, a German wholly owned subsidiary of Deutsche Telekom AG that provides system solutions for telecommunications services to significant accounts in Germany. In 1995, he was appointed to the Board of Management of Deutsche Telekom AG, where he was responsible for large business customers, multimedia and systems solutions until May 1998. Currently, Dr. May manages his own consulting and investment company and is a member of the advisory boards of several IT and multimedia companies. From June 2000 to December 2008 he served on the board of directors of InfoVista S.A., a publicly held French company that provides software products that monitor and analyze the performance of telecommunications and IT infrastructures. Since October 2010 Dr. May has also served as chairman of the Supervisory Board of Intershop Communications AG, a publicly held German company listed in Germany that provides software solutions for ecommerce applications.
Board Leadership Structure
Versant's Board of Directors is currently composed of six directors: five Outside Directors and Bernhard Woebker, the Company's President and Chief Executive Officer. William Henry Delevati, an Outside Director, serves as Chairman of the Board of Directors. In addition, the Chairman of each Versant Board Committee having a chair is also an Outside Director, and different Outside Directors currently serve as chairmen of the Audit, Compensation and Nominating Committees of the Board. Mr. Woebker does not serve on the Audit or Compensation Committees of the Board, nor does he chair any Board Committee. The Board believes that the existing leadership structure of the Board and its Committees is appropriate based on the size of the Board and the Company's current circumstances. The Board takes an active role in its oversight function and periodically holds executive sessions of Board and Board committee meetings to enable and encourage candid discussions of issues. The Board administers its oversight function, in part, by having key authority roles on various Board committees held by different Outside Directors, and the Board believes that this shared leadership practice encourages greater interest and participation in risk oversight by all members of the Board.
81
Audit Committee of the Board of Directors. Versant's Board of Directors maintains a standing Audit Committee of the Board. Messrs. Bellary, Delevati and May are the current members of the Audit Committee. Messrs. Bellary, Delevati and May served as such throughout fiscal 2011 and Mr. Woebker, who joined the committee in May 2010, resigned from the committee when he became CEO of the Company. Mr. Bellary serves as the Chairman of the Audit Committee and was appointed to that position in July 2003. The Board has determined that Mr. Bellary is the “audit committee financial expert” as defined by the rules of the United States Securities and Exchange Commission (the “SEC”) and is independent as independence for audit committee members is defined in the listing standards for the Nasdaq Stock Market. The principal responsibilities of the Audit Committee are as follows:
• | to monitor the periodic reviews of the adequacy of the accounting and financial reporting processes and systems of internal control that are conducted by the Company's independent auditors and the Company's financial and senior management; |
• | to facilitate communication among the Company's independent registered public accounting firm, the Company's financial and senior management and the Board; |
• | to oversee the Company's accounting and financial reporting processes and the audit of the Company's financial statements; and |
• | to oversee the Company's relationship with its independent registered public accounting firm and review and evaluate that accounting firm's independence and performance. |
The Board has adopted a written charter for the Audit Committee. The Audit Committee's charter is available on the Investor Relations section of our website at www.versant.com/en_US/aboutus/investorrelations. Each current member of the Audit Committee meets the independence and other requirements to serve on our Audit Committee under applicable securities laws and the rules of the SEC and listing standards of The NASDAQ Stock Market.
Named Executive Officers
SEC regulations define “Named Executive Officers” of the Company as the individuals (i) who served as the Company's Chief Executive Officer during fiscal 2011, (ii) the Company's two most highly compensated executive officers (other than the Chief Executive Officer) who were serving as executive officers at the end of fiscal 2011, if any, and (iii) up to two other persons who would have come within the description of other highly compensated officers in clause (ii) but for the fact that they were not serving as an executive officer of the Company at the end of fiscal 2011, if any.
Mr. Woebker and Mr. Wong currently serve as Versant's President and Chief Executive Officer and Versant's Vice President, Finance, Chief Financial Officer and Secretary, respectively, and Mr. Witte's employment with Versant terminated effective as of March 10, 2011 (they are together referred to in this Proxy Statement as the “Named Executive Officers”). Versant has no other executive officers as of the date of this Proxy Statement and, except for Messrs. Woebker, Witte and Wong, had no other executive officers during fiscal 2011.
Mr. Woebker and Mr. Wong currently serve in the positions indicated for them in the following table. Biographical information for Mr. Woebker is found in Part III, Item 10 of this report ("Directors, Executive Officers and Corporate Governance") under the heading "Directors of the Company" and biographical information for Messrs. Witte and Wong is set forth immediately below the following table.
Name of Officer | Age | Title |
Bernhard Woebker | 62 | President and Chief Executive Officer |
Jochen Witte | 51 | Former President and Chief Executive Officer |
Jerry Wong | 60 | Vice President, Finance, Chief Financial Officer and Secretary |
Jerry Wong has been Versant's Vice President, Finance and Chief Financial Officer and Secretary since June 2006. Prior to his appointment to these positions with Versant, from March 2003 to December 2005 Mr. Wong served as Chief Financial Officer and a consultant for Companion Worlds, Inc., a privately held company that provided technology enabling instructional content for mobile digital devices. From March 2004 to June 2006 Mr. Wong also served as a financial consultant for Vega Vista, Inc., a privately held company developing solutions for accessing and interacting with rich content on small displays, such as those on handheld devices. From January 2000 to November 2008 Mr. Wong served as an independent trustee for Firsthand Mutual Funds and also served for four years as chairperson of the Firsthand Mutual Fund's audit committee. From 1995 to October 2002 Mr. Wong was Vice President of Finance for Poet Software Corporation and Poet Holdings, Inc. and from 2000 to October 2002 he was Executive Vice President of U.S. operations for Poet Software Corporation, an affiliate of Poet
82
Holdings, Inc. Poet Holdings, Inc. was a provider of object-oriented database and e-catalog solutions that merged with Versant in March 2004. Mr. Wong holds a B.S. degree in Business Administration from the University of San Francisco.
Jochen Witte served as Versant's President and Chief Executive Officer from June 2005 until March 10, 2011 and as a member of Versant's Board of Directors from March 2004 until November 28, 2011. Mr. Witte served as the Company's Chief Financial Officer and Secretary from June 2005 to June 2006. From March 2004 to June 2005, he served as President, European Operations of Versant. Prior to joining Versant, Mr. Witte was CEO of Poet Holdings Inc., a company that merged with Versant in 2004 and which he co-founded in 1993. He initially worked as Poet's Managing Director of Germany and became Poet's Chief Financial Officer in 1999 when Poet went public. Mr. Witte received a degree in Business Administration from the Berlin Technical University and also attended the University of Wales as an exchange student.
Shareholder Communications to the Board of Directors
Shareholders of the Company may communicate with the Company's Board of Directors or any individual director through the Company's Secretary by sending an email to directors@versant.com or by writing to the following address:
Versant Corporation
Attention: Board of Directors c/o Secretary
255 Shoreline Drive, Suite 450
Redwood City, CA 94065 USA
The Company's Secretary will forward the correspondence to the Board (or any indicated individual director), except for spam, junk mail, mass mailings, product complaints or inquiries, job inquiries, surveys, business solicitations or advertisements, or patently offensive or otherwise inappropriate material. The Company's Secretary may forward certain correspondence, such as product-related inquiries, to the appropriate destinations within the Company for review and possible response.
Code of Conduct and Ethics
The Board has adopted a Code of Conduct and Ethics that applies to the Company's Board of Directors, principal executive officer, principal financial officer, principal accounting officer and all other employees of the Company. The Code of Conduct and Ethics is intended to provide our employees, officers and directors with an understanding of how Versant does business. The Code of Conduct and Ethics is posted on the Investor Relations section of our website at http://www.versant.com/pdf/vsnt_code_of_conduct_rev2008.pdf. The Company intends to satisfy the disclosure requirement under Item 5.05 of Form 8-K regarding any amendment to, or waiver from, a provision of this Code of Conduct and Ethics by posting such information on our website at http://www.versant.com/company/Investor_Relations.aspx.
Section16(a) Beneficial Ownership Reporting Compliance
Section 16 of the Exchange Act requires Versant's directors and officers, and persons who own more than 10% of a registered class of Versant's equity securities, to file initial reports of ownership and reports of changes in ownership with the SEC. Such persons are required by SEC regulations to furnish Versant with copies of all Section 16(a) forms they file. Based solely on the review of the copies of such forms furnished to Versant and written representations from the executive officers and directors of the Company, Versant believes that all Section 16(a) filing requirements were met during fiscal 2011with the exception of a Form 4 for Mr. Woebker filed on June 8, 2011 reporting the purchase of 1,100 shares of common stock purchased on June 2, 2011 and 2,900 shares of common stock purchased on June 3, 2011.
83
Item 11. Executive Compensation
Compensation of Directors
The following table sets forth compensation earned by the Company's Outside Directors during fiscal year 2011:
Summary Compensation Table - Directors
Name | Fees Earned or Paid in Cash ($) | Option Awards ($) 4 | Total ($) | |||||||||
Bernhard Woebker 1, 6 | $ | 8,967 | $ | 28,104 | $ | 37,071 | ||||||
Uday Bellary | $ | 25,000 | $ | 30,021 | $ | 55,021 | ||||||
Anthony Bettencourt 2 | $ | — | $ | — | $ | — | ||||||
Robert Brammer 3 | $ | — | $ | — | $ | — | ||||||
William Henry Delevati | $ | 25,000 | $ | 30,021 | $ | 55,021 | ||||||
Herbert May | $ | 25,000 | $ | 30,021 | $ | 55,021 | ||||||
Jochen Witte 5, 6 | $ | 12,592 | $ | — | $ | 12,592 | ||||||
1 Mr. Woebker served as an outside director until March 10, 2011 when he became CEO of the Company. These fees represent the compensation he received as an outside director. The share-based compensation expense relates to those option awards granted from the 2005 Directors Stock Option Plan he received as an outside director. As stated in note 6 below, Mr. Woebker's compensation for his services in the capacity as an employee are set forth elsewhere in this Item 11. | ||||||||||||
2 Mr. Bettencourt joined the Board of Directors in January 2012 and received no compensation in fiscal 2011. | ||||||||||||
3 Mr. Brammer joined the Board of Directors in November 2011 and received no compensation in fiscal 2011. | ||||||||||||
4 Amounts reflect the share-based compensation expense recognized in fiscal 2011 by the Company for financial statement reporting purposes. For a discussion of valuation assumptions, see Note 2 to the consolidated financial statements included in Item 8 of this report under the heading "Share Based Compensation." | ||||||||||||
5 Jochen Witte served as an outside director from March 10, 2011 (when he resigned as CEO) until November 28, 2011 during which time he received directors fees. As stated in note 6 below, Mr. Witte's compensation for his services in the capacity as an employee are set forth elsewhere in this Item 11. Mr. Witte was granted no option awards under the 2005 Directors Stock Option Plan. | ||||||||||||
6 Compensation for Messrs. Woebker and Witte, the Directors who also served as Executive Officers, is also included in the Summary of Compensation - Executive Officers table under the heading Executive Compensation in this Item. | ||||||||||||
Our directors who are not employees of Versant or any of its parents, subsidiaries or affiliates (“Outside Directors”) receive a combination of stock options and cash compensation for serving on our Board. Any director who is also a Company employee does not receive board fees or equity for his Board service. In fiscal 2011, Mr. Woebker served as an Outside Director until March 2011 when he became CEO of the Company. Mr. Woebker received cash compensation for his services as an Outside Director through March 2011. Mr. Witte served as the Company's CEO until March 2011 when he resigned from that position. Mr. Witte remained on the Board of Directors until November 28, 2011 and received cash compensation for his services as a director from March 2011 through November 2011, but was not granted any stock options under the 2005 Directors Stock Option Plan.
Cash Compensation. In fiscal 2011, Versant paid its Outside Directors cash compensation for their services as directors at a rate of $25,000 per year. The amount of compensation paid by Versant to its Outside Directors is determined by Versant's Board or a committee of the Board authorized to make such determination.
Equity Compensation. Outside Directors have previously been granted stock options under Versant's 1996 Directors Stock Option Plan (the “1996 Directors Plan”) and since August 2005 have received stock options under Versant's 2005 Directors Stock Option Plan (the “2005 Directors Plan”), which replaced the 1996 Directors Plan as of August 22, 2005. The purpose of the 2005 Directors Plan is to align the Outside Directors' interests with the interests of the Company's shareholders and to provide Outside Directors an opportunity to purchase shares of Versant Common Stock.
Under the terms of the 2005 Directors Plan, each Outside Director who first becomes a member of the Board after August 22, 2005 receives an option to purchase 4,000 shares of Versant Common Stock (i) upon initially joining the Board (an “Initial
84
Grant”), and (ii) so long as he or she continues to serve on the Board as an Outside Director, on each successive August 22 thereafter (each, such August 22 a “Succeeding Grant Date”), he or she will receive an additional option to purchase 4,000 shares of Versant Common Stock (a “Succeeding Grant”); except that, if such Outside Director has not been a member of the Board for the entire one-year period immediately preceding such Succeeding Grant Date, then the number of shares subject to the Succeeding Grant received by the Outside Director on that Succeeding Grant Date are reduced and prorated in proportion to the time during which such Outside Director served on the Board during such one-year period.
The following stock option grants have been made under the 2005 Directors Plan:
Number of Shares Granted to Outside Directors as a Group (1) | Grant Date Fair Value (per share) | Exercise Price (per share) | ||||||||||
Date of Grants: | ||||||||||||
August 22, 2005 (2) | 3,784 | $ | 2.86 | $ | 4.10 | |||||||
August 22, 2006 | 8,000 | $ | 5.23 | $ | 6.13 | |||||||
August 22, 2007 (3) | 15,716 | $ | 18.11 | $ | 22.00 | |||||||
August 22, 2008 | 16,000 | $ | 22.19 | $ | 30.50 | |||||||
August 22, 2009 | 16,000 | $ | 9.73 | $ | 15.06 | |||||||
August 22, 2010 | 16,000 | $ | 6.19 | $ | 10.58 | |||||||
August 22, 2011 (4) | 12,000 | $ | 5.01 | $ | 10.20 | |||||||
75,500 | ||||||||||||
1 | Except as noted in footnotes 2 and 4 below, the number of options granted to each Outside Director was equal in each year indicated in the table. The Outside Directors group includes Uday Bellary, William Delevati, Herbert May and until March 2011, Bernhard Woebker. Jochen Witte received no option grants in his role as a Director. | ||||||||
2 | In 2005, immediately after the shareholder approval of the 2005 Directors Plan, each Outside Director was granted a Succeeding Grant which was prorated to account for any grant made to the Outside Director in the preceding twelve months. Each Outside Director received a grant ranging from 131 to 1,671 shares on August 22, 2005. | ||||||||
3 | In 2007, the 2005 Directors Plan was amended to increase the Succeeding Grant from 2,000 shares to 4,000 shares. Despite this amendment, the Succeeding Grants made on August 22, 2007 were reduced to 3,929 shares per Outside Director because there were then insufficient shares available under the 2005 Directors Plan to enable such Succeeding Grant to be 4,000 shares on that date, so the remaining available options were prorated among the Outside Directors. | ||||||||
4 | On August 22, 2011, Bernhard Woebker was serving as CEO of the Company and did not receive a succeeding grant. | ||||||||
Options granted under the 2005 Directors Plan are immediately exercisable in full. However the options granted under the 2005 Directors Plan are subject to vesting provisions pursuant to which 50% of the shares vest free of a potential repurchase option of the Company on each of the first two anniversaries of the date of grant of the option, so long as the optionee continuously remains a member of the Board or a consultant to the Company. If an Outside Director's service with the Company as a director or consultant terminates, then any shares purchased by such Outside Director under an option granted under the 2005 Directors Plan that are unvested on the termination date are subject to repurchase by the Company at the option exercise price paid for such shares. In the event of certain corporate transactions (including certain change of control transactions) involving the Company, the vesting of all unvested shares subject to options granted under the 2005 Directors Plan may be accelerated.
The Outside Directors' aggregate holdings of stock options at the end of fiscal year 2011 were as follows:
Name 1, 2 | Number of Shares | ||
Uday Bellary | 30,060 | ||
William Henry Delevati | 31,100 | ||
Herbert May | 25,529 | ||
1 Bernhard Woebker was no longer an Outside Director as of March 10, 2011 when he began to serve as CEO of the Company. Mr. Woebker's aggregate holding of stock options is found in this item under the heading "Executive Compensation." | |||
2 Jochen Witte's aggregate holding of stock options is found below in this item under the heading "Executive Compensation." | |||
85
Compensation of Executives
Role of the Compensation Committee and Processes
The Compensation Committee has the exclusive authority to establish the level of base salary payable to Versant's executive officers and also has the responsibility for approving the individual bonus programs for Versant's Chief Executive Officer and its other executive officers for each fiscal year, and to determine at the end of the fiscal year the extent to which the bonus has been earned. The Compensation Committee also reviews and makes recommendations to the Company's Board of Directors to ensure that other aspects of Versant's compensation and benefit programs are consistent with Versant's compensation philosophy.
Versant's Chief Executive Officer has historically annually reviewed the performance of each of Versant's other executive officers. The conclusions reached by the Chief Executive Officer and his recommendations based on these reviews, including his recommendations with respect to base salary, target annual bonus levels and performance targets, and target annual long-term incentive option award values, have typically been presented by the Chief Executive Officer to the Compensation Committee, which may modify or supplement any recommendation made by the Chief Executive Officer in its discretion, and the Compensation Committee has historically made adjustments and additions modifying the Chief Executive Officer's recommendations and/or adopted compensation terms devised by the Compensation Committee. The Compensation Committee makes all final compensation decisions for each of Versant's Named Executive Officers (as defined below). Compensation Committee meetings typically have included, for all or a portion of each meeting, not only the Compensation Committee members but also Versant's Chief Executive Officer and Chief Financial Officer, although these officers do not attend those portions of the Compensation Committee meetings in which their personal compensation program is determined by the Compensation Committee.
The Compensation Committee has the authority to engage the services of outside advisors. However, historically, including for fiscal 2011, the Committee has not done so, given the Company's size, the small number of the Company's executive officers, the relative lack of complexity of the Company's compensation programs and the costs associated with retaining such an advisor. In fiscal 2011 management did not engage any compensation consultants to provide advice or recommendations on the amount or form of executive and director compensation.
86
Executive Compensation
Provided in the tables and narrative below is certain information regarding compensation earned by our Named Executive Officers for fiscal years 2011 and 2010.
Summary Compensation Table - Executives
Name and Principal Position | Fiscal Year | Salary ($) | Option Awards (1) | Non-Equity Incentive Plan Compensation ($) | All Other Compensation | Total ($) | |||||||||||||||||
Bernhard Woebker (2, 3, 7) | |||||||||||||||||||||||
Director | 2010 | $ | 25,000 | $ | 57,534 | $ | — | $ | — | $ | 82,534 | ||||||||||||
Director | 2011 | $ | 8,967 | $ | 28,104 | $ | — | $ | — | $ | 37,071 | ||||||||||||
President and Chief Executive Officer | 2011 | $ | 197,597 | $ | 81,667 | $ | 16,000 | $ | 8,419 | $ | 303,683 | ||||||||||||
Fiscal 2011 total - Mr. Woebker | $ | 206,564 | $ | 109,771 | $ | 16,000 | $ | 8,419 | $ | 340,754 | |||||||||||||
Jerry Wong (8) | |||||||||||||||||||||||
Vice President, Finance, Secretary & CFO | 2010 | $ | 190,000 | $ | 96,968 | $ | 78,532 | $ | — | $ | 365,500 | ||||||||||||
Vice President, Finance, Secretary & CFO | 2011 | $ | 190,000 | $ | 83,709 | $ | 75,000 | $ | — | $ | 348,709 | ||||||||||||
Jochen Witte (4, 5, 6, 7, 9) | |||||||||||||||||||||||
Former President and CEO | 2010 | $ | 291,034 | $ | 141,383 | $ | 62,798 | $ | 12,552 | $ | 507,767 | ||||||||||||
Former President and CEO | 2011 | $ | 152,922 | $ | 120,218 | $ | 154,285 | $ | 318,289 | $ | 745,714 | ||||||||||||
Director | 2011 | $ | 12,592 | $ | — | $ | — | $ | — | $ | 12,592 | ||||||||||||
Fiscal 2011 total - Mr. Witte | 2011 | $ | 165,514 | $ | 120,218 | $ | 154,285 | $ | 318,289 | $ | 758,306 | ||||||||||||
1 | Amounts reflect the share-based compensation expense recognized by the Company for financial statement reporting purposes. For a discussion of valuation assumptions, see Note 2 to the consolidated financial statements included in this report in Item 8 under the heading "Share Based Compensation." See the Plan Based Awards table below for information on fiscal 2011 stock option grants. | ||||||||||||||||||||||
2 | Mr. Woebker's salary was paid by Versant GmbH in euros and translated each month at the exchange rate used for inclusion in the Company's financial statements. For fiscal 2011, Mr. Woebker was paid €138,522 which translated to approximately $197,597 at an average exchange rate of 1.4265 dollars per euro | ||||||||||||||||||||||
3 | Mr. Woebker's compensation for his service as a Director, prior to the date he become Versant's Chief Executive Officer and President, is included in this table and also included in the "Summary Compensation Table - Directors" under the heading "Compensation of Directors" in this report in this Item 11. | ||||||||||||||||||||||
4 | Mr. Witte's salary was paid by Versant GmbH in euros and translated each month at the exchange rate used for inclusion in the Company's financial statements. For fiscal 2011, Mr. Witte was paid €111,130, which translated to approximately $152,922 at an average exchange rate of 1.3761 dollars per euro. For fiscal 2010, Mr. Witte was paid €216,000 which translated to approximately $291,034 at an average exchange rate of 1.3474 dollars per euro. | ||||||||||||||||||||||
5 | Mr. Witte's compensation for his service as a Director is included in this table and also included in the "Summary Compensation Table - Directors" under the heading "Compensation of Directors" in this report in this Item 11. | ||||||||||||||||||||||
6 | Incentive compensation for fiscal 2010 was payable in the first quarter following the fiscal year in which it was earned. | ||||||||||||||||||||||
7 | "All Other Compensation" includes amounts paid by the Company for life insurance premiums and auto lease payments. | ||||||||||||||||||||||
8 | Incentive compensation payable in the first quarter following the fiscal quarter or fiscal year in which it is earned. | ||||||||||||||||||||||
9 | a) On March 10, 2011, Versant Corporation and Jochen Witte, the Company’s then President and Chief Executive Officer, agreed to Mr. Witte’s resignation and entered into a separation agreement. Under this separation agreement, Mr. Witte continued to serve as a part-time employee at a salary of €9,000 per month and assisted in transitioning his responsibilities until June 30, 2011 when Mr. Witte’s employment terminated. | ||||||||||||||||||||||
b) The terms of Mr. Witte’s separation agreement provided that in exchange for a general release of claims, he received the following: (i) a severance payment consisting of €216,000 (equivalent to approximately $309,658) and reflected in "All Other Compensation" above plus a bonus of approximately €65,768 (equivalent to approximately $94,285) and reflected in "Non-Equity Incentive Plan Compensation" above. | |||||||||||||||||||||||
c) The terms of Mr. Witte's separation agreement also provided that the vesting of Mr. Witte’s Versant stock options was accelerated by 12 months of vesting and his then outstanding vested Versant stock options will continue to be exercisable until March 31, 2012. The additional share-based compensation expense recognized by the Company as a result of these stock option modifications is included in "Option Awards" above. | |||||||||||||||||||||||
87
Mr. Woebker. Mr. Woebker, who is based in Germany and whose base salary is paid in Euros, had an annual base salary in fiscal 2011 of €216,000 per year. He was also eligible for discretionary bonuses to be determined by the Compensation Committee of the Board of Directors.
Mr. Wong. Mr. Wong's annual base salary rate for fiscal 2010 and fiscal 2011 was $190,000. Mr. Wong's fiscal 2011 bonus program had the following principal terms: 1) a bonus based on Fiscal 2011 Income from Operations equal to ten percent (10%) of that portion of the Company’s 2011 Income from Operations that exceeded a target level of 2011 Income from Operations which he did not earn; and 2) a discretionary bonus of up to $60,000 by achieving certain operational objectives in Fiscal 2011, as determined by Versant’s Chief Executive Officer under which he earned $60,000. In addition, Mr. Wong received a discretionary bonus from the Board of Directors of $15,000.
For his fiscal 2010 bonus program, Mr. Wong was entitled to receive cash bonuses based on two separate components: (1) a bonus based on the amount of the Company's Income from Operations for fiscal 2010, under which he earned $8,532 and (2) a bonus based on achievement by Mr. Wong of certain operational objectives determined by Versant's Chief Executive Officer under which he earned $70,000.
Mr. Witte. In September 2009, the Compensation Committee approved an employment agreement for Mr. Witte, who was based in Germany and whose base salary was paid in Euros, which continued his base salary at the annual rate of €216,000. For fiscal 2011 and 2010, Mr. Witte's annual base salary rate was €216,000.
On March 10, 2011, the Company and Jochen Witte, the Company’s former President and Chief Executive Officer and the managing director of its Versant GmbH subsidiary, agreed to Mr. Witte’s resignation from these positions and entered into a separation agreement. Under this separation agreement, Mr. Witte continued to serve as a part-time employee at a salary of €9,000 per month to assist in transitioning his responsibilities until June 30, 2011, when Mr. Witte’s employment terminated. Mr. Witte continued to serve on Versant’s Board of Directors until November 28, 2011. The terms of Mr. Witte’s separation payment provided that, upon his termination, in exchange for a general release of claims, he received the following separation benefits: (i) a severance payment consisting of €216,000 (equivalent to approximately $309,658) plus a bonus of approximately €65,768 (equivalent to approximately $94,285); (ii) the vesting of Mr. Witte’s Versant stock options were accelerated by 12 months of vesting; and (iii) his outstanding vested Versant stock options will continue to be exercisable until March 31, 2012. Pursuant to the separation agreement, Versant also repurchased approximately 62,545 shares of Versant common stock owned by Mr. Witte (including 15,120 shares owned by his spouse) at a price of $13.50 per share, which price reflected recent market trading prices of Versant’s common stock as of the date of the separation agreement.
For fiscal 2010, Mr. Witte's bonus program entitled him to earn cash bonuses based on three separate components: (1) a bonus based on the amount of the Company's Income from Operations for fiscal 2010, under which he earned $12,798, (2) a bonus based on the Company's revenues for fiscal year 2010, which he did not earn, and (3) a discretionary bonus of $50,000 based on strategic progress in Versant's business as determined in the discretion of the Compensation Committee.
Employment Contracts, Termination of Employment and Change-in-Control Arrangements
Chief Executive Officer's Employment Arrangements. Mr. Woebker does not have an employment agreement with the Company.
Chief Financial Officer's Employment Arrangements. On September 9, 2009, Versant entered into a Retention Incentive Agreement with Mr. Wong which provides him with severance benefits upon his termination of employment following certain change of control transactions involving the Company. The agreement provides that if Mr. Wong's employment is terminated without cause or is terminated by him for “good reason” within 12 months of a change of control transaction involving the Company, then (i) the vesting of Mr. Wong's then outstanding unvested stock options or other unvested equity awards of the Company may be accelerated for up to a maximum of 36 months of vesting (with the extent of vesting based on Mr. Wong's tenure with the Company) and (ii) Mr. Wong would be entitled to be paid cash severance in an amount not to exceed 50% of his annual target compensation (with the actual amount payable determined in part on Mr. Wong's tenure with the Company), in each case subject to Mr. Wong signing a release.
88
Grants of Plan-Based Awards, Fiscal Year 2011
The following table shows all plan-based awards granted to our Named Executive Officers during fiscal year 2011. Certain of the stock option awards shown in this table (those granted in fiscal year 2011) are also reported in the Outstanding Equity Awards at Fiscal Year End table below.
Option Awards: Number of Underlying Options | Option Awards: Number of Underlying Options | Grant Date Fair Value of Stock and Option Awards | |||||||||||
Name | Grant Date | (#) | ($/Sh) | ($) (1) | |||||||||
Bernhard Woebker 3 | 5/23/2011 | 20,000 | $ | 12.83 | $ | 127,652 | |||||||
Jerry Wong 2 | 11/29/2010 | 15,000 | $ | 11.81 | $ | 67,071 | |||||||
Jochen Witte 2, 4 | 11/29/2010 | 20,000 | $ | 11.81 | $ | 89,428 | |||||||
1 These amounts do not reflect compensation actually received. Rather, they reflect the share based compensation valuation for financial reporting purposes. The assumptions used to calculate the value of these stock option grants are set forth in Note 11 of the Notes to the Consolidated Financial Statements included in this Form 10-K for fiscal year 2011. | |||||||||||||
2 These options first vest and become exercisable with respect to 25% of the shares subject to the option nine months after the grant date, and thereafter vest and become exercisable with respect to 2.78% of the shares subject to the option each month thereafter, subject to the option holder’s continued employment or service relationship with the Company. The options are subject to potential acceleration under Mr. Wong's Retention Incentive Agreement with Versant. | |||||||||||||
3 These options were granted from the 2005 Equity Incentive Plan and vest ratably over the twelve months beginning 3/11/11, subject to the option holder’s continued employment or service relationship with the Company. | |||||||||||||
4 These options were modified by the separation agreement between Jochen Witte and the Company to accelerate 12 months of vesting as of Mr. Witte's termination date, June 30, 2011. | |||||||||||||
Equity-Based Long Term Incentive Compensation. We do not have any program, plan or practice that requires us to grant stock options to Versant's executive officers on specified dates, however, we generally (but not exclusively) consider stock option grants to Versant's executives on an annual basis, typically following fiscal year end when preliminary results for the preceding fiscal year are available for review by the Compensation Committee and forecasts for the following fiscal year are presented by management for review by the Board of Directors.
On May 23, 2011, the Compensation Committee of the Board of Directors approved the grant to Bernhard Woebker, Versant's Chief Executive Officer and President, of a stock option pursuant to the Company's 2005 Equity Incentive Plan, in order to provide Mr. Woebker with an appropriate equity incentive. The option entitled Mr. Woebker to potentially purchase up to 20,000 shares of Versant Common Stock at an exercise price of $12.83 per share, which price is equal to 100% of the fair market value of a share of Versant common stock on the date of grant. The option vests and becomes exercisable ratably on a monthly basis over the twelve month period beginning March 10, 2011 (the date of Mr. Woebker's appointment as Chief Executive Officer and President) and will generally expire on the earlier of (i) ten years after the date of grant or (ii) seven months after Mr. Woebker ceases to be employed by the Company (or an affiliate of the Company).
89
Outstanding Equity Awards at Fiscal Year-End, Fiscal Year 2011
The following table shows all outstanding equity awards held by our Named Executive Officers at the end of fiscal year 2011, including Jochen Witte who remained on the Board of Directors as of October 31, 2011. Certain of the stock option awards shown in this table (those granted in fiscal year 2011) are also reported in the Grants of Plan-Based Awards table above.
Option Awards | |||||||||||||||||||
No. of securities underlying unexercised options at October 31, 2011 - Exercisable (#) | Equity incentive plan awards: Number of securities underlying unexercised unearned options (#) | Option Exercise Price ($) | Option Expiration Date | ||||||||||||||||
Name | |||||||||||||||||||
Bernhard Woebker | 186 | $ | 4.10 | 8/22/2015 | |||||||||||||||
2,000 | $ | 3.00 | 6/15/2015 | ||||||||||||||||
2,000 | $ | 6.13 | 8/22/2016 | ||||||||||||||||
3,929 | $ | 22.00 | 8/22/2017 | ||||||||||||||||
4,000 | $ | 30.50 | 8/22/2018 | ||||||||||||||||
4,000 | $ | 15.06 | 8/22/2019 | ||||||||||||||||
2,000 | 1 | 2,000 | $ | 10.58 | 8/22/2020 | ||||||||||||||
11,666 | 2 | 8,334 | $ | 12.83 | 5/23/2021 | ||||||||||||||
Total | 29,781 | 10,334 | |||||||||||||||||
Jerry Wong | 7,800 | — | $ | 6.80 | 6/27/2016 | ||||||||||||||
6,500 | — | $ | 18.18 | 2/26/2017 | |||||||||||||||
10,000 | — | $ | 20.98 | 11/29/2017 | |||||||||||||||
14,583 | 417 | $ | 12.47 | 11/25/2018 | |||||||||||||||
9,582 | 5,418 | $ | 18.80 | 11/30/2019 | |||||||||||||||
3,750 | 11,250 | $ | 11.81 | 11/29/2020 | |||||||||||||||
Total | 52,215 | 3 | 17,085 | ||||||||||||||||
Jochen Witte 5 | 2,800 | — | $ | 10.50 | 1/24/2012 | ||||||||||||||
875 | — | $ | 3.50 | 3/31/2012 | |||||||||||||||
4,200 | — | $ | 27.50 | 3/31/2012 | |||||||||||||||
500 | — | $ | 3.69 | 3/31/2012 | |||||||||||||||
20,000 | — | $ | 10.37 | 3/31/2012 | |||||||||||||||
20,000 | — | $ | 20.98 | 3/31/2012 | |||||||||||||||
20,000 | — | $ | 12.47 | 3/31/2012 | |||||||||||||||
17,222 | — | $ | 18.80 | 3/31/2012 | |||||||||||||||
10,555 | — | $ | 11.81 | 3/31/2012 | |||||||||||||||
Total | 96,152 | 4 | — | ||||||||||||||||
1 | These options were granted from the 2005 Directors Stock Option Plan when Mr. Woebker was an Outside Director and vest 50% on each of the first two anniversaries of the date of the grant. These options are fully exercisable on the date of grant but the unvested shares are subject to repurchase by the Company. | ||||||||||||||||||
2 | These options were granted from the 2005 Equity Incentive Plan and vest ratably over the twelve months beginning 3/11/11, subject to the option holder’s continued employment or service relationship with the Company. | ||||||||||||||||||
3 | These options first vest and become exercisable with respect to 25% of the shares subject to the option nine months after the grant date, and thereafter vest and become exercisable with respect to 2.78% of the shares subject to the option each month thereafter, subject to the option holder’s continued employment or service relationship with the Company. These options are subject to potential acceleration under Mr. Wong's Retention Incentive Agreement with Versant. | ||||||||||||||||||
4 | On March 10, 2011, Versant Corporation and Jochen Witte, the Company’s then President and Chief Executive Officer, agreed to Mr. Witte’s resignation and entered into a separation agreement. Pursuant to the terms of Mr. Witte's separation agreement, the vesting of Mr. Witte’s Versant stock options was accelerated by 12 months and his then outstanding vested Versant stock options will continue to be exercisable until March 31, 2012. | ||||||||||||||||||
5 | Mr. Witte resigned as President and CEO of the Company as of March 10, 2011 but remained a part time employee until June 30, 2011 and a Board Member until November 28, 2011. | ||||||||||||||||||
90
Item 12. Security Ownership of Certain Beneficial Owners and Management and Related Stockholder Matters
Our only class of voting securities is our Common Stock. The following table presents information regarding the beneficial ownership of our Common Stock (which includes certain securities exercisable for or convertible into Common Stock) as of February 17, 2012 by:
• | each shareholder known by us to be the beneficial owner of more than 5% of our Common Stock; |
• | each of our directors; |
• | each “Named Executive Officer” (as defined below under “Executive Compensation - Versant's Named Executive Officers”); and |
• | all current directors and executive officers as a group. |
The percentage of beneficial ownership for the following table is based on 2,931,424 shares of Common Stock outstanding as of February 17, 2012. Unless otherwise indicated below, the persons and entities named in the table have sole voting and sole investment power with respect to all shares beneficially owned, subject to community property laws where applicable. Shares issuable upon the exercise of options and warrants within 60 days of February 17, 2012 (that is, April 17, 2012) are deemed to be outstanding and to be beneficially owned by the person holding such options or warrants for the purpose of computing the number of shares beneficially owned and the percentage ownership of Common Stock of such person but are not deemed to be outstanding and to be beneficially owned for the purpose of computing the percentage ownership of Common Stock of any other person. Unless otherwise indicated, each beneficial owner listed below maintains a mailing address of c/o Versant Corporation, 255 Shoreline Drive, Suite 450, Redwood City, California 94065.
Shares of Common Stock Beneficially Owned | |||||||
Number | Percentage of | ||||||
Name of Beneficial Owner | of Shares | Shares Outstanding | |||||
5% Shareholders: | |||||||
Nantahala Capital Management, LLC 1 | 339,784 | 11.6 | % | ||||
100 First Stamford Plaza, Second Floor | |||||||
Stamford, Connecticut 06902 | |||||||
Renaissance Technologies LLC 2 | 190,000 | 6.5 | % | ||||
800 Third Avenue, 33rd Floor | |||||||
New York, New York 10022 | |||||||
Andalusian Capital Partners, LP 3 | 182,385 | 6.2 | % | ||||
Two Greenwich Office Park, Suite 300 | |||||||
Greenwich, CT 06831 | |||||||
Skellig Capital Management LLC 4 | 157,722 | 5.4 | % | ||||
117 East 55th Street | |||||||
New York, NY 10022 | |||||||
Punch & Associates Investment Management, Inc. 5 | 147,902 | 5.0 | % | ||||
3601 West 76th Street, Suite 225 | |||||||
Edina, Minnesota 55435 | |||||||
91
Beneficial Ownership - Continued | |||||||
Shares of Common Stock Beneficially Owned | |||||||
Number | Percentage of | ||||||
Name of Beneficial Owner | of Shares | Shares Outstanding | |||||
5% Shareholders: | |||||||
Directors and Executive Officers: | |||||||
Jochen Witte 6 | 86,977 | 3.0 | % | ||||
Bernhard Woebker 7 | 58,840 | 2.0 | % | ||||
Jerry Wong 8 | 67,133 | 2.3 | % | ||||
Uday Bellary 9 | 30,060 | 1.0 | % | ||||
Anthony Bettencourt 10 | 4,000 | * | |||||
Robert Brammer 11 | 4,000 | * | |||||
William Henry Delevati 12 | 29,600 | 1.0 | % | ||||
Herbert May 13 | 25,529 | * | |||||
All directors and executive officers as a group ( 8 persons) | 306,139 | 10.4 | % | ||||
1 | Based solely on information contained in a Form 13F filed by Nantahala Capital Management, LLC with the Securities and Exchange Commission on February 13, 2012. | ||||||
2 | Based solely on information contained in a Schedule 13G filed by Renaissance Technologies LLC with the Securities and Exchange Commission on February 13, 2012. | ||||||
3 | Based solely on information contained in a Schedule 13D/A filed by Andalusian Capital Partners, LP with the Securities and Exchange Commission on September 22, 2011. | ||||||
4 | Based solely on information contained in a Schedule 13G filed by Skellig Capital Management LLC with the Securities and Exchange Commission on February 13, 2012. | ||||||
5 | Based solely on information contained in a Schedule 13G filed by Punch & Associates Investment Management, Inc. with the Securities and Exchange Commission on February 9, 2012. | ||||||
6 | Includes 86,977 shares of Common Stock subject to options exercisable within 60 days of February 17, 2012. | ||||||
7 | Includes 40,115 shares of Common Stock subject to options exercisable within 60 days of February 17, 2012. | ||||||
8 | Includes 58,464 shares of Common Stock subject to options exercisable within 60 days of February 17, 2012. | ||||||
9 | Includes 30,060 shares of Common Stock subject to options exercisable within 60 days of February 17, 2012. | ||||||
10 | Includes 4,000 shares of Common Stock subject to options exercisable within 60 days of February 17, 2012. | ||||||
11 | Includes 4,000 shares of Common Stock subject to options exercisable within 60 days of February 17, 2012. | ||||||
12 | Includes 28,600 shares of Common Stock subject to options exercisable within 60 days of February 17, 2012. | ||||||
13 | Includes 25,529 shares of Common Stock subject to options exercisable within 60 days of February 17, 2012. | ||||||
Securities Authorized for Issuance Under Equity Compensation Plans
This information is provided under the heading "Securities Authorized for Issuance Under Equity Compensation Plans" in Item 5 of this report.
92
Item 13. Certain Relationships and Related Transactions, and Director Independence
Related Party Transactions Policy and Procedures
Excluding compensation (whether cash, equity or otherwise), any related party transaction involving a Company director or executive officer must be reviewed and approved by the Audit Committee of the Board of Directors. Any member of the Audit Committee who is a related party with respect to a transaction under review may not participate in the deliberations or vote on the approval or ratification of the transaction. Related parties include any director or executive officer, any nominee for election to the Board, certain shareholders and any of their “immediate family members” (as defined by SEC regulations). To identify any related party transaction, the Company requires each director and executive officer to complete each year a questionnaire requiring disclosure of any transaction in which the director, executive officer or any immediate family member might have an interest. In addition, the Board of Directors determines annually which directors are “independent” under the rules of the NASDAQ Stock Market and reviews any director relationship that would potentially interfere with his or her exercise of independent judgment in carrying out the responsibilities of a director.
Certain Related Party Transactions
The Company's Articles of Incorporation and Bylaws contain provisions that limit the liability of directors and require the Company to indemnify directors and executive officers against expenses, judgments, fines, settlements and other amounts actually and reasonably incurred in connection with any proceedings arising out of their services to the Company. Under those Articles of Incorporation, to the extent permitted under the California General Corporation Law, directors are not liable to the Company or its shareholders for monetary damages arising from a breach of their fiduciary duty of care as directors. In addition, the Company has entered into an indemnity agreement with each director and executive officer that provides for indemnification of the directors and executive officers against certain liabilities that may arise by reason of their status or service as a director or executive officer. The Company purchases insurance to cover claims or a portion of any claims made against its directors and executive officers. These provisions and arrangements do not, however, affect liability for any breach of a director's duty of loyalty to the Company or its shareholders, liability for acts or omissions not in good faith or involving intentional misconduct or knowing violations of law, liability for transactions in which the director derived an improper personal benefit or liability for the payment of a dividend or distribution in violation of California law. Such limitation of liability also does not limit a director's liability for violation of, or otherwise relieve our directors or executive officers from the necessity of complying with, federal and state securities laws or affect the availability of equitable remedies such as injunctive relief or rescission. In addition, certain executive officers of the Company have certain employment and/or retention incentive agreements with the Company, which are summarized above under “Executive Compensation - Employment Contracts, Termination of Employment and Change-in-Control Agreements”.
Other than these indemnification arrangements and the compensation of directors and Named Executive Officers as described elsewhere in this Proxy Statement, to the Company's knowledge there has not been since the beginning of fiscal year 2011 and there is not currently proposed any transaction in which the Company was or is to be a participant, in which the amount involved exceeds $120,000 or one percent of the average of Versant's total assets at year end for the last two completed fiscal years; and in which any director, executive officer, 5% shareholder or any of their “immediate family members” (as defined by SEC regulations) had or will have a direct or indirect material interest.
Director Independence
The Board has determined that directors Uday Bellary, Anthony Bettencourt, Robert Brammer, William Henry Delevati and Dr. Herbert May qualify as independent directors under the rules of The NASDAQ Stock Market. The NASDAQ independence definition includes a series of objective tests, including that a director may not be a Company employee and that the director has not engaged in various types of business dealings with the Company. In addition, as further required by the NASDAQ rules, the Board of Directors has made a subjective determination as to each independent director that no relationship exists which, in the opinion of the Board of Directors, would interfere with the exercise of such director's independent judgment in carrying out the responsibilities of a director.
93
Item 14. Principal Accountant Fees and Services
The independent registered public accounting firm of Grant Thornton LLP was selected to serve as the Company's independent registered public accountant to perform the audit of the Company's financial statements for the fiscal years ended October 31, 2011 and 2010.
The table below sets forth the aggregate audit fees, audit-related fees, tax fees and all other fees billed for services rendered by the Company's principal accountant in our fiscal years ended October 31, 2011 and 2010.
Fiscal 2011 | Fiscal 2010 | |||||||
Audit Fees | $ | 392,225 | $ | 399,907 | ||||
Audit-Related Fees | — | — | ||||||
Tax Fees | — | — | ||||||
All Other Fees | — | — | ||||||
Total All Fees | $ | 392,225 | $ | 399,907 | ||||
Audit Fees. These amounts include aggregate fees billed for professional services rendered in connection with Grant Thornton LLP's audit of Versant's annual consolidated financial statements for fiscal 2010 and fiscal 2011, the reviews of Versant's consolidated financial statements included in its Quarterly Reports on Forms 10-Q for each of those fiscal years, and the attestation services for the statutory audits of international subsidiaries.
• | Audit-Related Fees. These amounts include professional services rendered in connection with a certain regulatory filing made by the Company. |
• | Tax Fees. We did not incur any Tax Fees during these periods. |
• | All Other Fees. We did not incur any Other Fees during these periods. |
Policy on Audit Committee Pre-Approval of Services Performed by the Independent Registered Public Accounting Firm
The Audit Committee's policy is to pre-approve at the beginning of each fiscal year all audit and permissible non-audit services to be provided by the independent registered public accounting firm during that fiscal year. The Audit Committee pre-approves these services by authorizing specific projects within the categories of service outlined above. In addition, the Audit Committee may also pre-approve particular services on a case-by-case basis.
The Audit Committee considered the services listed above to be compatible with maintaining Grant Thornton LLP's independence.
94
PART IV
Item 15. Exhibits and Financial Statement Schedules
The exhibit list in the “Exhibit Index” is incorporated herein by reference as the list of exhibits required as part of this report.
95
SIGNATURES
Pursuant to the requirements of Section 13 or 15(d) of the Securities Exchange Act of 1934, the Registrant has duly caused this amendment #1 to be signed on its behalf by the undersigned, thereunto duly authorized.
VERSANT CORPORATION | ||||
Dated: February 28, 2012 | /s/ Jerry Wong | |||
Jerry Wong | ||||
Vice President, Finance, Chief Financial Officer | ||||
(Duly Authorized Officer, Principal Financial Officer | ||||
and Principal Accounting Officer) | ||||
/s/ Bernhard Woebker | ||||
Bernhard Woebker | ||||
President and Chief Executive Officer (Duly Authorized Officer and Principal Executive Officer) and Director | ||||
Pursuant to the requirements of the Securities Exchange Act of 1934, this report has been signed below by the following persons on behalf of the Registrant and in the capacities and on the dates indicated.
/s/ Bernhard Woebker | President and Chief Executive Officer | February 28, 2012 | |
Bernhard Woebker | |||
/s/ Jerry Wong | Vice President, Finance, Chief Financial Officer | February 28, 2012 | |
Jerry Wong | |||
Directors: | |||
* | Director | February 28, 2012 | |
Uday Bellary | |||
* | Director | February 28, 2012 | |
Anthony Bettencourt | |||
* | Director | February 28, 2012 | |
Robert Brammer | |||
* | Director | February 28, 2012 | |
William Henry Delevati | |||
* | Director | February 28, 2012 | |
Herbert May | |||
* By the signatures set forth below, the undersigned, pursuant to the duly authorized power of attorney filed with the Securities and Exchange Commission have signed this Amendment No. 1 on Form 10-K/A on behalf of the person indicated.
/s/ Bernhard Woebker | Attorney-in-fact | February 28, 2012 | |
Bernhard Woebker | |||
/s/ Jerry Wong | Attorney-in-fact | February 28, 2012 | |
Jerry Wong | |||
96
EXHIBIT INDEX (continued)
EXHIBIT INDEX
Incorporated by Reference | ||||||
Exhibit Number | Exhibit Description | Form | File No. | Filing Date | Exhibit | Filed Herewith |
2.01 | Agreement and Plan of Merger with Poet Holdings, Inc. dated September 27, 2003 by and among the Registrant, Puma Acquisition Inc. and Poet Holdings Inc. * | 8-K | 000-28540 | 09/29/03 | 99.10 | |
2.02 | Amendment to Agreement and Plan of Merger, dated as of January 20, 2004, by and among the Registrant, Poet Holdings, Inc. and Puma Acquisition, Inc. | S-4/A | 333-110444 | 02/02/04 | 2.20 | |
2.03 | Share Purchase and Transfer Agreement dated as of September 13, 2004 between Poet Software GmbH and ems ePublishing AG and attached list of annexes thereto (translated to English from the original German text). * | 8-K | 000-28540 | 09/17/04 | 2.01 | |
3.01 | Amended and Restated Articles of Incorporation of the Registrant, filed with the California Secretary of State on March 18, 2004 | S-8 | 333-113871 | 03/24/04 | 4.01 | |
3.02 | Certificate of Amendment of Amended and Restated Articles of Incorporation of the Registrant, filed with the California Secretary of State on August 22, 2005 | 8-K | 000-28540 | 08/26/05 | 3.10 | |
3.03 | Registrant's Amended and Restated Bylaws | 8-K | 000-28540 | 03/02/07 | 3.01 | |
10.01 | Registrant's 2005 Equity Incentive Plan, as amended ** | S-8 | 333-174018 | 05/06/11 | 99.01 | |
10.02 | Forms of Stock Option Agreements and Stock Option Exercise Agreements under Registrant's 2005 Equity Incentive Plan** | S-8 | 333-130601 | 12/22/05 | 99.02 | |
10.03 | Registrant's 2005 Directors' Stock Option Plan, as amended** | S-8 | 333-174018 | 05/06/11 | 99.05 | |
10.04 | Forms of Stock Option Grants and Stock Option Exercise Agreements under Registrant's 2005 Directors Stock Option Plan** | S-8 | 333-130601 | 12/22/05 | 99.04 | |
10.05 | Registrant's 2005 Employee Stock Purchase Plan, as amended ** | S-8 | 333-159931 | 06/12/09 | 99.03 | |
10.06 | Forms of Enrollment Form and Subscription Agreement under Registrant's 2005 Employee Stock Purchase Plan** | S-8 | 333-130601 | 12/22/05 | 99.06 | |
10.07 | Registrant's 1996 Directors Stock Option Plan, as amended as of July 30, 2003, and related documents** | S-8 | 333-107956 | 08/14/03 | 4.06 | |
97
EXHIBIT INDEX (continued)
Incorporated by Reference | ||||||
Exhibit Number | Exhibit Description | Form | File No. | Filing Date | Exhibit | Filed Herewith |
10.08 | Registrant's 1996 Employee Stock Purchase Plan, as amended as of August 17, 2004 and related documents** | 10-K | 000-28540 | 02/15/05 | 10.02 | |
10.09 | Registrant's 1996 Equity Incentive Plan, as amended as of April 18, 2002, and related documents** | S-8 | 333-87922 | 05/09/02 | 4.05 | |
10.10 | Poet Holdings, Inc. Amended and Restated 1995 Stock Plan and Forms of Stock Option Agreement and Exercise Notice thereunder** | S-8 | 333-113871 | 03/24/04 | 4.05 | |
10.11 | Poet Holdings, Inc. 1999 Director Option Plan and Forms of Director Option Agreement and Director Option Exercise Notice thereunder** | S-8 | 333-113871 | 03/24/04 | 4.06 | |
10.12 | Poet Holdings, Inc. 2001 Non Statutory Stock Option Plan and Forms of Stock Option Agreement and Exercise Notice thereunder** | S-8 | 333-113871 | 03/24/04 | 4.07 | |
10.13 | Form of Letter from Registrant to option holders of Poet Holdings, Inc., regarding assumption of options by Registrant** | S-8 | 333-113871 | 03/24/04 | 99.01 | |
10.14 | Form of Indemnity Agreement entered into by Registrant with each of its directors and executive officers | 10-K | 000-28540 | 02/15/05 | 10.09 | |
10.15 | Form of Amendment to Versant Corporation Stock Option Agreement** | SB-2 | 07/16/96 | |||
10.16 | Joint Employment Agreement and Managing Director Service Contract with CEO** | 10-Q | 000-28540 | 09/09/09 | 10.03 | |
10.17 | Retention Incentive Agreement with Chief Financial Officer** | 10-Q | 000-28540 | 09/09/09 | 10.04 | |
10.18 | Registration Rights Agreement dated December 28, 1998 between the Registrant and the parties listed on the Schedule of Investors attached thereto | 10-KSB | 000-28540 | 03/31/99 | 10.35 | |
10.19 | Supplement dated June 28, 1999 to Registration Rights Agreement among the Registrant and the parties listed on the Schedule of Investors attached thereto | 8-K | 000-28540 | 07/13/99 | 10.04 | |
10.20 | Office Building Lease dated March 23, 2007, between Versant Corporation and CA-Shorebreeze Limited Partnership | 10-Q | 000-28540 | 6/13/07 | 10.01 | |
10.21 | Separation Agreement between Thomas Huben and Versant Gmbh dated as of December 2, 2008** | 10-Q | 000-28540 | 03/13/09 | 10.01 | |
10.22 | First Amendment dated September 3, 2009 to Office Building Lease dated March 23, 2007, between Versant Corporation and CA-Shorebreeze Limited Partnership | 10-Q | 000-28540 | 09/09/09 | 10.01 | |
98
EXHIBIT INDEX (continued)
Incorporated by Reference | ||||||
Exhibit Number | Exhibit Description | Form | File No. | Filing Date | Exhibit | Filed Herewith |
10.23 † | English Summary of Office Building Lease dated July 17, 2009 between Versant Gmbh and DIC DP Hamburg Halanreie Gmbh † | 10-Q | 000-28540 | 09/09/09 | 10.02 | |
10.24 | Joint Transition and Separation Agreement dated as of March 10, 2011 between Versant Corporation and Versant GmbH and Jochen Witte** | 10-Q | 000-28540 | 06/14/11 | ||
21.01 | Subsidiaries of the Registrant | 10-K | 000-28540 | 01/30/2012 | 21.01 | |
23.01 | Consent of Grant Thornton LLP, Independent Registered Public Accounting Firm | 10-K | 000-28540 | 01/30/2012 | 23.01 | |
31.01 | Certification of Chief Executive Officer pursuant to Section 302 of the Sarbanes-Oxley Act of 2002 | X | ||||
31.02 | Certification of Chief Financial Officer pursuant to Section 302 of the Sarbanes-Oxley Act of 2002 | X | ||||
32.01* | Certification of Chief Executive Officer pursuant to Section 906 of the Sarbanes-Oxley Act of 2002 | X | ||||
32.02* | Certification of Chief Financial Officer pursuant to Section 906 of the Sarbanes-Oxley Act of 2002 | X | ||||
101.ins* | XBRL Instance Document | 10-K | 000-28540 | 1/30/2012 | 101.ins | |
101.sch* | XBRL Schema Document | 10-K | 000-28540 | 1/30/2012 | 101.sch | |
101.cal* | XBRL Calculation Linkbase Document | 10-K | 000-28540 | 1/30/2012 | 101.cal | |
101.pre* | XBRL Presentation Linkbase Document | 10-K | 000-28540 | 1/30/2012 | 101.pre | |
101.lab* | XBRL Label Linkbase Document | 10-K | 000-28540 | 1/30/2012 | 101.lab | |
101.def* | XBRL Definition Linkbase Document | 10-K | 000-28540 | 1/30/2012 | 101.def | |
___________________________________________________
* | This exhibit is being furnished rather than filed, and shall not be deemed incorporated by reference into any filing, in accordance with Item 601 of Regulation S-K. |
** | Management contract or compensatory plan. |
† | This exhibit is an English summary of a foreign language document pursuant to Rule 306 of Regulation S-T. |
99