Attached files
| file | filename |
|---|---|
| 8-K - FORM 8-K - SunCoke Energy, Inc. | d303387d8k.htm |
 J.P. Morgan
Global High Yield & Leveraged Finance Conference
February 28, 2012
Exhibit 99.1 |
 1
Safe Harbor Statement
Some
of
the
information
included
in
this
presentation
contains
“forward-looking
statements”
(as
defined
in
Section
27A
of
the
Securities
Act
of
1933,
as
amended
and
Section
21E
of
the
Securities
Exchange
Act
of
1934,
as
amended).
Such
forward-looking
statements
are
based
on
management’s
beliefs
and
assumptions
and
on
information
currently
available.
Forward-looking
statements
include
the
information
concerning
SunCoke’s
possible
or
assumed
future
results
of
operations,
business
strategies,
financing
plans,
competitive
position,
potential
growth
opportunities,
potential
operating
performance
improvements,
effects
resulting
from
our
separation
from
Sunoco,
the
effects
of
competition
and
the
effects
of
future
legislation
or
regulations.
Forward-looking
statements
include
all
statements
that
are
not
historical
facts
and
may
be
identified
by
the
use
of
forward-looking
terminology
such
as
the
words
“believe,”
“expect,”
“plan,”
“intend,”
“anticipate,”
“estimate,”
“predict,”
“potential,”
“continue,”
“may,”
“will,”
“should”
or
the
negative
of
these
terms
or
similar
expressions.
Forward-looking
statements
involve
risks,
uncertainties
and
assumptions.
Actual
results
may
differ
materially
from
those
expressed
in
these
forward-looking
statements.
You
should
not
put
undue
reliance
on
any
forward-looking
statements.
In
accordance
with
the
safe
harbor
provisions
of
the
Private
Securities
Litigation
Reform
Act
of
1995,
SunCoke
has
included
in
its
filings
with
the
Securities
and
Exchange
Commission
cautionary
language
identifying
important
factors
(but
not
necessarily
all
the
important
factors)
that
could
cause
actual
results
to
differ
materially
from
those
expressed
in
any
forward-looking
statement
made
by
SunCoke.
For
more
information
concerning
these
factors,
see
SunCoke's
Securities
and
Exchange
Commission
filings.
All
forward-
looking
statements
included
in
this
presentation
are
expressly
qualified
in
their
entirety
by
such
cautionary
statements.
SunCoke
undertakes
no
obligation
to
update
publicly
any
forward-looking
statement
(or
its
associated
cautionary
language)
whether
as
a
result
of new information or future events or otherwise.
This
presentation
includes
certain
non-GAAP
financial
measures
intended
to
supplement,
not
substitute
for,
comparable
GAAP
measures.
Reconciliations
of
non-GAAP
financial
measures
to
GAAP
financial
measures
are
provided
in
the
Appendix
at
the
end
of
the
presentation.
Investors
are
urged
to
consider
carefully
the
comparable
GAAP
measures
and
the
reconciliations
to
those
measures
provided in the Appendix, or on our website at www.suncoke.com.
J.P. Morgan Global High Yield & Leveraged Finance Conference
|
 2
SunCoke Introduction
2011 Adjusted EBITDA
(1)
(excluding Corporate Segment)
(1) For a definition of Adjusted EBITDA, please see the appendix.
J.P. Morgan Global High Yield & Leveraged Finance Conference
Largest independent producer of
metallurgical coke in the Americas
with nearly 50 years experience
~85% of Adjusted EBITDA
(1)
generated
by cokemaking business
–
Secure, long-term take-or-pay
contracts with leading steelmakers
Metallurgical coal mining operations in
Virginia and West Virginia
–
2011 production of approximately
1.4 million tons
–
High quality metallurgical coal
reserves; primarily mid-vol.
2011 Results:
•Revenue of $1.5 billion
•Adjusted EBITDA
(1)
of $140.5 million |
 3
5.9 million tons of capacity with
new Middletown, Ohio facility
–
Six cokemaking facilities; five in
U.S. and one in Brazil
–
More than doubled capacity
since 2005
Proven ability to permit, develop,
construct and start up new facilities
and work internationally
Industry leading environmental
signature: U.S. EPA Maximum
Achievable Control Technology
The Leading Independent Cokemaker
SunCoke
Cokemaking Capacity
(Tons in thousands)
J.P. Morgan Global High Yield & Leveraged Finance Conference
0
1,000
2,000
3,000
4,000
5,000
6,000
7,000
2004
2005
2006
2007
2008
2009
2010
2011
Jewell Coke
Indiana Harbor
Haverhill I
Vitória
Haverhill II
Granite City
Middletown |
 4
$227
$141
2010
2011
2011 Overview
2011 Net Income
(1)
of $60.6 million, EPS of $0.87,
and Adjusted EBITDA
(2)
of $140.5 million
($ in millions)
(1)
Attributable to shareholders
(2)
For a definition of Adjusted EBITDA and reconciliation of Adjusted EBITDA to net
income and operating income, please see the appendix. J.P.
Morgan Global High Yield & Leveraged Finance Conference Adjusted EBITDA
(2) |
 5
Cash Flow Update
•
Working capital change reflects
higher coal and coke inventory in
2011
•
Expect to decline
in first
half 2012 •
Solid year end liquidity position
with $128 million cash balance
and undrawn revolver
•
Intend to build liquidity near term
to support potential future
growth projects
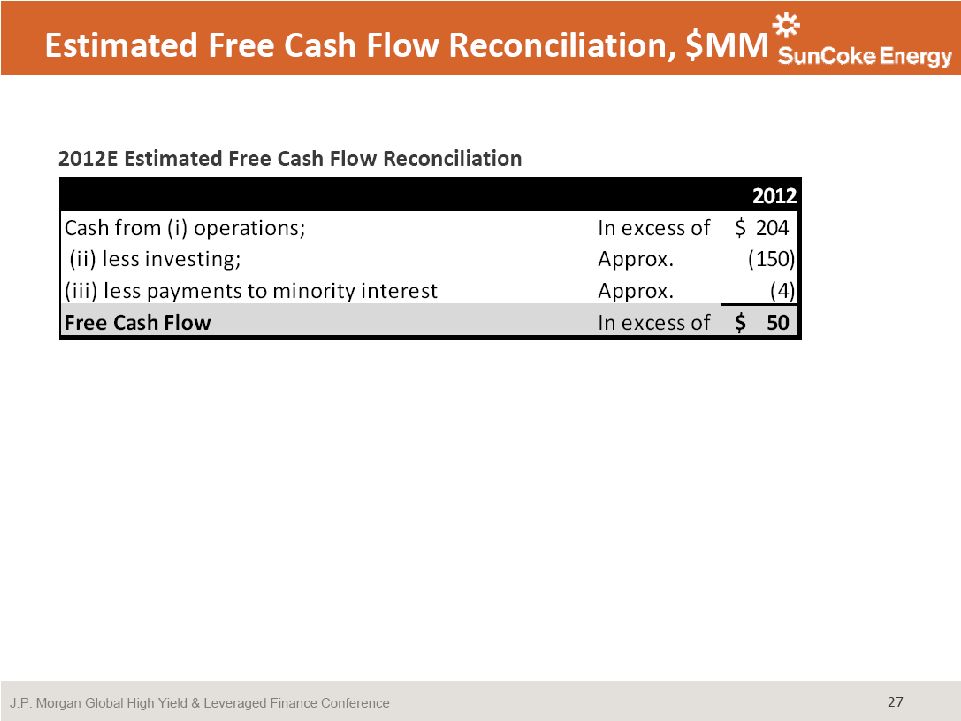
•
Expect 2012 free cash flow of
$50+ million, weighted to second
half 2012
(1) Free Cash Flow represents cash from operations less cash from investing less
payments to minority interest. For a definition of Free
Cash Flow and a reconciliation of Free Cash Flow, please see the appendix. (2)
For a
definition
of
Adjusted
EBITDA
and
reconciliation
of
Adjusted
EBITDA
to
net
income
and
operating
income,
please
see
the
appendix.
J.P. Morgan Global High Yield & Leveraged Finance Conference
Summary Cash Flow
($ in millions, except where indicated)
Net Income
$59
$146
Loss on firm purchase commitment
18
-
Depreciation, depletion, and amortization
58
48
Deferred income tax expense
24
15
Payments (in excess of) less than expense for retirement plans
6
(6)
Changes in working capital pertaining to operating activities
(61)
91
Other
(3)
2
Net cash provided by operations
$101
$297
Capital Expenditures
Ongoing
($59)
($46)
Expansion
(179)
(170)
Proceeds from sale of assets
-
2
Acquisition of business, net of cash received
(38)
-
Net cash used in investing activities
($276)
($214)
Proceeds from issuance of long-term debt/costs/repayments
$707
$0
Contribution from parent
-
$1
Purchase of noncontrolling interest in Indiana Harbor facility
(34)
-
Distributions to noncontrolling interests in cokemaking operations
(2)
(21)
Increase (decrease) in advances/payable to/from affiliate
(408)
(25)
Repayment of notes payable assumed in acquisition
(2)
-
Net cash provided by (used in) financing activities
$261
($45)
Net increase in cash
$87
$36
Cash balance at beginning of period
$40
$3
Cash balance at end of period
$128
$40
Free Cash Flow
(1)
($177)
$62
For Year
Ended
December 31,
2011
For Year
Ended
December 31,
2010 |
 6
SunCoke‘s Value Proposition
Provide an assured supply of coke to steelmakers
Larger, stronger coke for improved blast furnace performance
Demonstrated sustained 30% turndown; higher turndown on temporary basis
High quality coke with cheaper coal blends
–
Burn loss vs. by-product
Capital preservation and lower capacity cost per ton; particularly relative to
greenfield investment
Stringent U.S. regulatory environment
Power prices and reliability versus value of coke oven gas and by-product
"credits"
High Quality &
Reliable Coke
Supply
Turndown
Flexibility
Coal Flexibility
Capital
Efficiency
and Flexibility
Environmental /
Economic
Trade-offs
J.P. Morgan Global High Yield & Leveraged Finance Conference
|
 7
SunCoke’s Heat Recovery Oven vs. By-Product Oven
SunCoke’s technology is the industry’s environmental standard and provides
many advantages over the traditional cokemaking process
J.P. Morgan Global High Yield & Leveraged Finance Conference
|
 8
SunCoke’s Contract Proposition
Plant Production and Environmental
Compliance
Permits and Approvals
Engineering, Procurement &
Construction
Capital Funding and Ownership
Reliable, High-Quality Coke Supply
Deliver coke to customers through a competitive turnkey solution,
which produces a consistent stream of earnings
Operating Cost Component
(Pass-Through)
Fixed Fee
(Profit and Return on Capital)
Coal Cost Component
(Pass-Through)
Take-Or-Pay
Taxes and Transportation and Future
Environmental Costs (Pass-Through)
Coke fee
Energy fee
SunCoke
Energy
Typical Key Coke Sales
Agreement Provisions
What SunCoke Offers
J.P. Morgan Global High Yield & Leveraged Finance Conference
|
 9
Focused Growth Strategy
Expand domestic coal production from current reserves and
improve efficiency of existing mines
We believe
SunCoke Energy
is uniquely
positioned for
continued
investment and
earnings
growth
Continue to grow our cokemaking businesses in the U.S. and
Canada; reserving portion of future capacity for market sales
Grow international footprint in key growth markets with
immediate focus on India
Growth Initiatives
J.P. Morgan Global High Yield & Leveraged Finance Conference
|
 SunCoke's U.S.
and Canada Market Position North American Coke Imports
SunCoke believes it has the opportunity to displace higher cost coke imports
(Tons in millions)
Source: CRU, The Annual Outlook for Metallurgical Coke 2011.
(1)
Represents SunCoke’s domestic cokemaking capacity weighted by the number of
months each facility operated during that year.
(1)
5.4
3.6
5.6
1.3
2.5
2.4
2.8
2.3
2.6
2.8
3.6
–
1.0
2.0
3.0
4.0
5.0
6.0
2006
2007
2008
2009
2010
2011
2012E2013E
2014E
2015E2021E
SunCoke domestic coke sales volumes
SunCoke weighted-average domestic cokemaking capacity
10
J.P. Morgan Global High Yield & Leveraged Finance Conference
|
 11
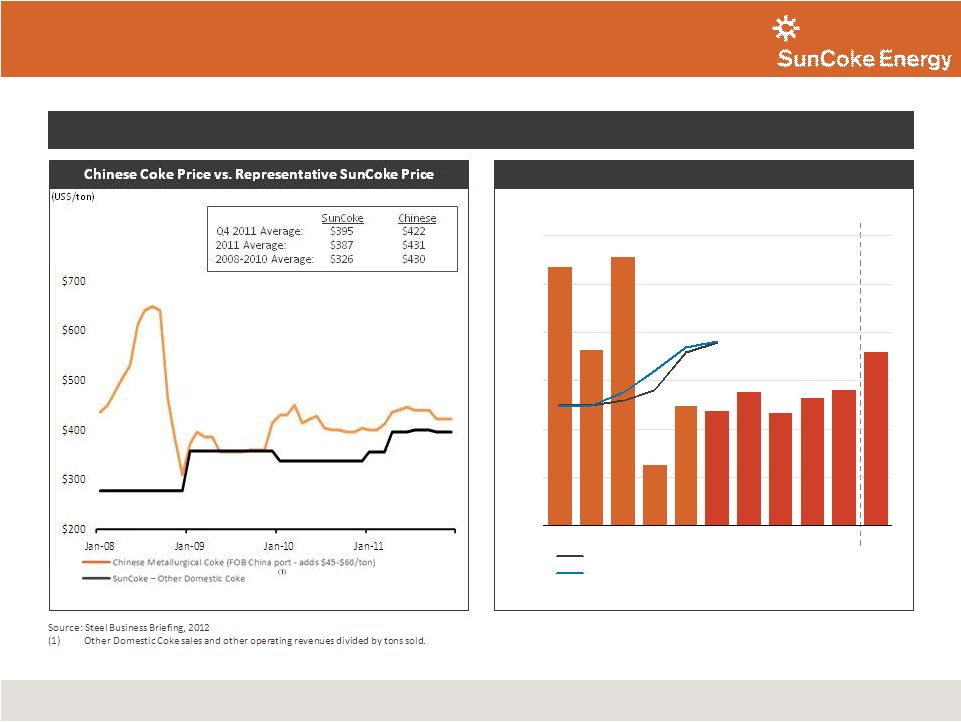
SunCoke's U.S. and Canada Market Position
Source: CRU, The Annual Outlook for Metallurgical Coke 2011;
Company estimates. (1) Chinese coke production costs net of by-product
credits; does not include return on capital. J.P. Morgan Global High Yield
& Leveraged Finance Conference SunCoke Domestic Coke pricing is competitive
versus Chinese imports in the event the 40% tariff on exports is reduced or
removed |
 12
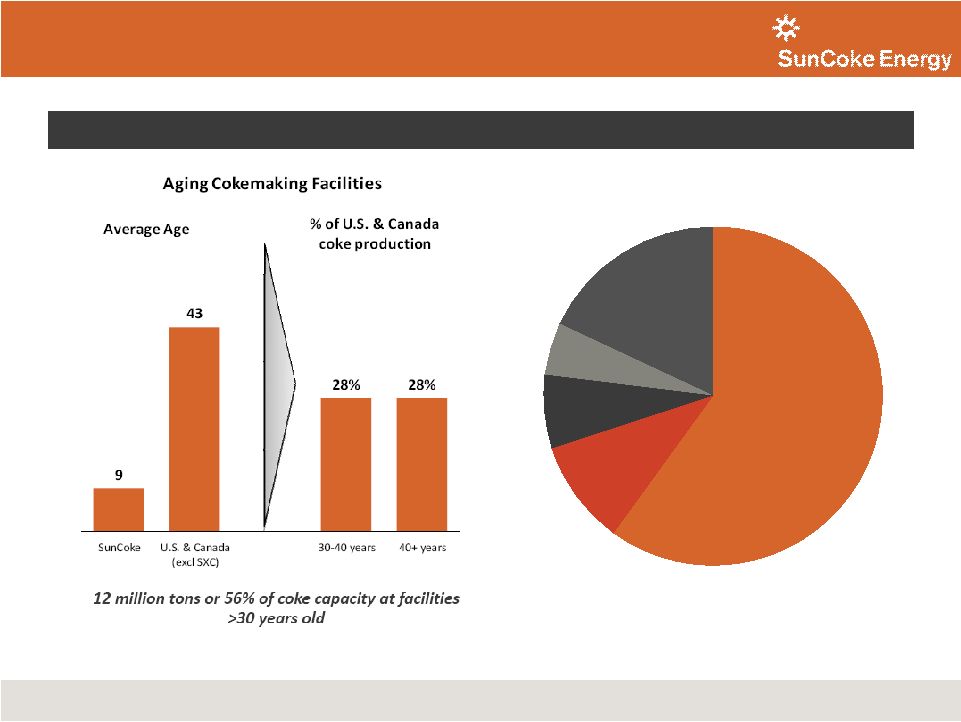
U.S. & Canada Coke Supply
SunCoke’s U.S. and Canada Market Position
Source: CRU, The Annual Outlook for Metallurgical Coke 2011.
Replace aging coke batteries operated by integrated steel producers
Source: CRU, The Annual Outlook for Metallurgical Coke 2011.
J.P. Morgan Global High Yield & Leveraged Finance Conference
Integrated
Steel
Producers
60%
SunCoke
18%
DTE
5%
Other Merchant &
Foundry
7%
Imports
10% |
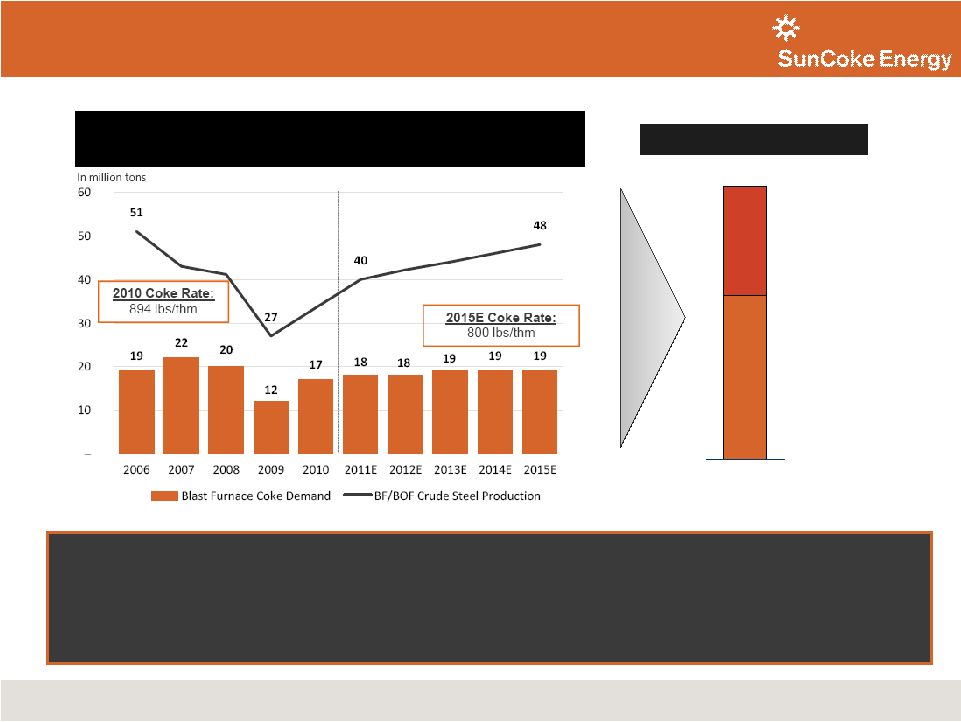  13
SunCoke's U.S. and Canada Market Position
BF/BOF Crude Steel Production
and Blast Furnace Coke Demand
3
2
Aging battery
replacement
Demand growth with
market recovery
Expected demand
opportunity by
2015
5
Market Opportunity
Source: CRU, The Annual Outlook for Metallurgical Coke 2011;
Company estimates. million tons
J.P. Morgan Global High Yield & Leveraged Finance Conference
•
We
believe
SunCoke
is
positioned
to
capture
significant
share
of
market
opportunity
•
Next U.S. coke plant size anticipated to be up to 1.1 million tons
•
Near-term focus remains on obtaining permits; anticipated in second half of 2012
•
Will defer seeking customer commitments until further progress on permits achieved in view of
current economic outlook |
    14
India –
Macro Outlook
Population growth
•
1.2 billion people today
•
Projected 1.5 billion by 2030
•
Growth equal to the entire U.S.
population
Urbanization
•
Less than 50% urban population
•
Vehicle production 3.6 MM (’11)
vs. 13 MM in NAFTA
•
Lowest steel intensity of BRICs
Economic prosperity
•
Economy expected to grow
6-8% per year
•
Per capital income could triple
Per Capita Crude Steel Use
(2010)
Kg/y
India
58
Brazil
147
United States
292
China
445
World Avg.
221
Source: World Steel Association, 2011.
Source: Census.gov, United States Census Bureau -
International Data Base, CIA World Factbook.
Significant
Expected
GDP
Growth
Source: CIA World Factbook.
J.P. Morgan Global High Yield & Leveraged Finance Conference
|
 15
India Opportunity for SunCoke
J.P. Morgan Global High Yield & Leveraged Finance Conference
|
 16
Why is China Important?
Source: CRU, The Annual Outlook for Metallurgical Coke 2011;
Company estimates. Rest of
World
48%
China
45%
U.S. & Canada
2011E World Steel Production
Rest of
World
35%
China
62%
U.S. &
Canada
2011E World Coke Production
7%
3%
J.P. Morgan Global High Yield & Leveraged Finance Conference
•
Chinese steel market represents 45% of
world production
•
Steel market expected to grow
46% over the next 10 years producing
an incremental 300+ million tons (more
than 2x entire U.S. market)
•
Integrated steelmaking comprises
90% of production, driving China to
represent 62% of the world coke
market
•
China’s coke demand expected to grow
approximately 160 million tons in the
next 10 years (equivalent to nearly
7 U.S. markets)
•
Chinese government has targeted
closure of nearly 40 million tons of
older/inefficient coke capacity
Source:
CRU,
The
Annual
Outlook
for
Metallurgical
Coke
2011;
Companyestimates.
Source: CRU, The Annual Outlook for Metallurgical Coke 2011;
Company estimates. |
 17
Coal Expansion
0.35 million tons expected
surface mining
1.15 million tons
expected production from Jewell
underground mines
0.30 million tons HKCC acquisition
Projected 2012 Coal Production
Planned Growth
Current Operations
Underground
Mining
Surface
Mining
Selective
Reserve
Additions
Projected 1.80 million tons in 2012
(A
projected
increase
of
approximately
0.4
million
tons
from
2011
)
+
+
=
106 million tons of proven and
probable reserves
Reserve life of 50+ years
Near
term
focus
on
increasing
productivity
at
existing
mines;
will
defer
opening
new
mines
until
2013
Currently limited to highwall
mining at HKCC
Signed agreement to extract
additional surface tons
–
Expect 1.2 million tons over
3 years beginning in 2012
Acquired Harold Keene Coal
Companies (HKCC) in January
2011
Open to opportunistic
additions of coal reserves
J.P. Morgan Global High Yield & Leveraged Finance Conference
|
 18
2012 Priorities
J.P. Morgan Global High Yield & Leveraged Finance Conference
•
Execute the ramp up of Middletown; expect to reach full
production levels in Q2 2012
•
Achieve targeted coke production volumes of 4.0
to 4.2 million
tons •
Continue permitting work for potential new U.S. plant in
anticipation of a market recovery
•
Implement India entry strategy
•
Drive improved productivity at existing mines; mining a
projected 1.8 million tons and positioning segment for future
expansion |
 19
Coal Expansion
Coal prices offer attractive growth and
return on capital in our coal mining business
SunCoke’s Mid-Vol. Coal
Contract Prices
$130
$165
2010
2011
2012E
$170 - $190
2012
Estimates
MV
(2)
HV
Thermal
Total
Sales Tons
(1)
1,550k
150k
150k
1,850k
% Committed
88%
27%
40%
79%
Price of
Committed
Tons (per ton)
$177
$130
$81
$171
Estimated Price Range of Uncommitted Tons (per ton)
High
$170
$120
$80
Low
$150
$100
$60
(1)
Includes approximately 50k of purchased coal.
(2)
Includes approximately 200k of 2011 carryover tonnage at $165.
J.P. Morgan Global High Yield & Leveraged Finance Conference
($ per ton) |
 20
$141
$74 -
$84
$25 -
$40
$10 -
$15
2011
Adj. EBITDA
Coke
Coal Mining
Corporate
and Other
2012E
Adj. EBITDA
$250 -
$280
$250 -
$280
2012 Adjusted EBITDA
(1)
Outlook
Estimated 2012 Adjusted EBITDA
(1)
projected to increase by $109 million to $139 million over 2011;
expect 80% -
85% of 2012 Adjusted EBITDA
(1, 2)
to be generated by cokemaking business
($ in millions)
(1)
For a definition of Adjusted EBITDA, please see the appendix.
(2)
Excluding corporate costs.
•
Middletown
•
Indiana Harbor
improvement
•
Higher prices and
volumes
J.P. Morgan Global High Yield & Leveraged Finance Conference
|
 21
2012 Outlook Summary
Metric
Expected 2012 Outlook
Adjusted EBITDA
(1)
$250 million –
$280 million
Capital Expenditures
& Investments
Approximately $150 million
Free Cash Flow
(2)
$50 million +
Cash Tax Rate
10% –
15%
Effective Tax Rate
20% –
24%
Corporate Costs
$30 million -
$35 million
Coke Production
4.0 -
4.2 million tons
Coal Production
Approximately 1.8 million tons
EPS (at 22% tax rate)
$1.30 -
$1.65
(1) For a definition of Adjusted EBITDA, please see the appendix
(2) For a definition of Free Cash Flow, please see the appendix
J.P. Morgan Global High Yield & Leveraged Finance Conference
|
 22
Leverage Ratios
J.P. Morgan Global High Yield & Leveraged Finance Conference
$ in millions
2011
Estimated
2012
(1)
Total Debt
$726
$723
Total Debt / Adj. EBITDA
(2)
5.1x
2.7x
Net Debt
(3)
$598
$545
Net Debt / Adj. EBITDA
(2)
4.2x
2.1x
(1) Estimated
2012
ratios
using
mid-point
of
estimated
2012
Adjusted
EBITDA
guidance
range
of
$250
million
to
$280
million.
(2) For
a
definition
of
Adjusted
EBITDA
and
reconciliation
of
Adjusted
EBITDA
to
net
income
and
operating
income,
please
see
the
appendix.
(3) Net
Debt
represents
Total
Debt
less
cash
balances.
Net
Debt
as
of
12/31/2011
was
calculated
using
Total
Debt
of
$726
million
less
12/31/2011
cash balances of $128 million. Estimated 2012 Net Debt was calculated by
subtracting estimated 2012 Total Debt of $723 million less the sum of our
12/31/2011 cash balances plus our projected 2012 free cash flow of $50 million. Net Debt provides a perspective on the company’s
overall debt position.
Key Leverage Ratios |
 23
J.P. Morgan Global High Yield & Leveraged Finance Conference
Strategy for Shareholder Value Creation |
 |
 25
Adjusted
EBITDA
represents
earnings
before
interest,
taxes,
depreciation,
depletion
and
amortization
(“EBITDA”)
adjusted
for
sales discounts and the deduction of income attributable to non-controlling
interests in our Indiana Harbor cokemaking operations. EBITDA
reflects
sales
discounts
included
as
a
reduction
in
sales
and
other
operating
revenue.
The
sales
discounts
represent
the
sharing
with
our
customers
of
a
portion
of
nonconventional
fuels
tax
credits,
which
reduce
our
income
tax
expense.
However,
we
believe that our Adjusted EBITDA would be inappropriately penalized if these
discounts were treated as a reduction of EBITDA since they represent sharing
of a tax benefit which is not included in EBITDA. Accordingly, in computing Adjusted EBITDA, we have
added back these sales discounts. Our Adjusted EBITDA also reflects the deduction
of income attributable to noncontrolling interest in our Indiana Harbor
cokemaking operations. EBITDA and Adjusted EBITDA do not represent and should not be considered
alternatives to net income or operating income under United States generally
accepted accounting principles (GAAP) and may not be comparable to other
similarly titled measures of other businesses. Management believes Adjusted EBITDA is an important
measure of the operating performance of the Company’s assets and is indicative
of the Company’s ability to generate cash from operations.
Free Cash Flow
equals cash from operations less cash used in investing activities less cash
distributions to non-controlling interests.
Management
believes
Free
Cash
Flow
information
enhances
an
investor’s
understanding
of
a
business’
ability
to
generate cash. Free Cash Flow does not represent and should not be considered
an alternative to net income or cash flows from operating activities as
determined under GAAP and may not be comparable to other similarly titled measures of other businesses.
Definitions
J.P. Morgan Global High Yield & Leveraged Finance Conference
|
 |
 |
 |
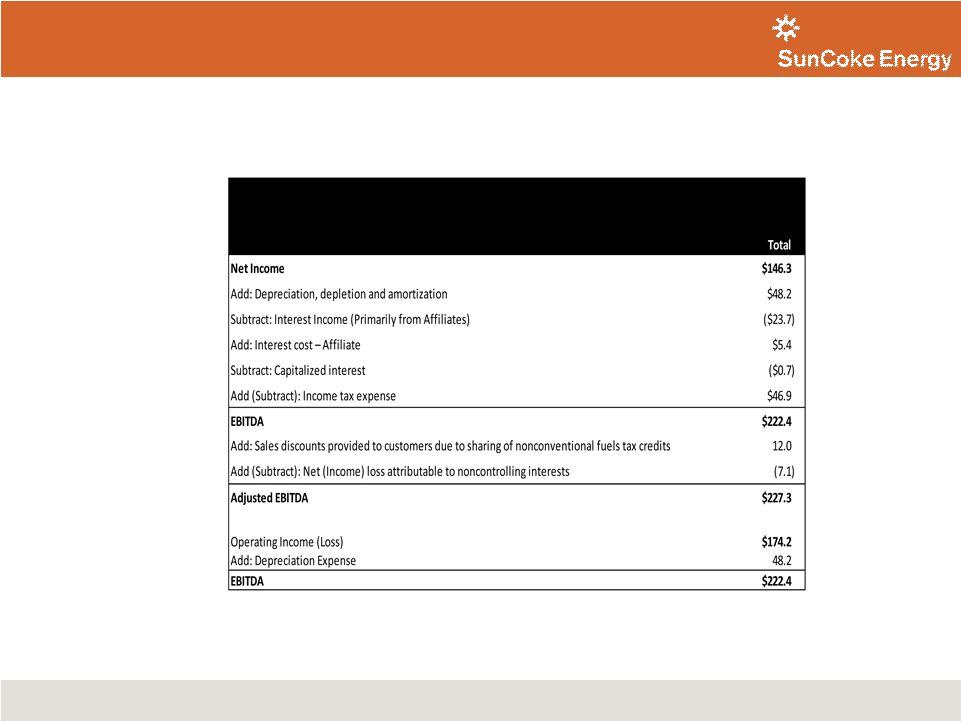 29
EBITDA Reconciliation, $MM
For The Year Ended 2010
J.P. Morgan Global High Yield & Leveraged Finance Conference
|
 |