Attached files
| file | filename |
|---|---|
| 8-K - 8-K - KAR Auction Services, Inc. | a12-5873_18k.htm |
Exhibit 99.1
|
|
Corporate Update March 2012 |
|
|
2 Forward-Looking Statements This presentation includes forward-looking statements as that term is defined in the Private Securities Litigation Reform Act of 1995. Such forward looking statements are subject to certain risks, trends, and uncertainties that could cause actual results to differ materially from those projected, expressed or implied by such forward-looking statements. Many of these risk factors are outside of the company’s control, and as such, they involve risks which are not currently known to the company that could cause actual results to differ materially from forecasted results. Factors that could cause or contribute to such differences include those matters disclosed in the company’s Securities and Exchange Commission filings. The forward-looking statements in this document are made as of the date hereof and the company does not undertake to update its forward-looking statements. |
|
|
3 Non-GAAP Financial Measures EBITDA, Adjusted EBITDA, free cash flow, adjusted net income and adjusted net income per share, and percentages or calculations using these measures, as presented herein, are supplemental measures of the company's performance that are not required by, or presented in accordance with, generally accepted accounting principles in the United States, or GAAP. They are not measurements of the company's financial performance under GAAP and should not be considered as substitutes for net income (loss) or any other performance measures derived in accordance with GAAP. See Appendix for additional information and a reconciliation of these non-GAAP measures to GAAP net income (loss). |
|
|
2011 Revenue: $1,886mm 2011 Adj. EBITDA: $487mm1 ~3.1mm Vehicles Sold in 2011 Top 2 whole car auction position 25% market share (Including OPENLANE) 69 ADESA locations 103 AFC locations OPENLANE online auctions 2011 Revenue2: $1,186mm 2011 Adj. EBITDA2: $334mm 2011 Revenue: $700mm 2011 Adj. EBITDA: $212mm Top 2 salvage vehicle auction position 35% - 40% market share 160 locations Live and live online auctions 1 Includes corporate charges of $59mm 2 Includes AFC revenue of $169mm and adjusted EBITDA of $102mm 4 Leading Provider of Vehicle Auction Services in North America |
|
|
5 Salvage Market Share Manheim Other ADESA Leader in Whole Car and Salvage Auction Markets Copart IAAI Other Source: North American market share based on company estimates. |
|
|
Visio Source <\\IBNJS003VF\HOTWHEELS\Roadshow\Presentation\Backup\The Vehicle_v4.vsd> Source: Used vehicle (whole car) per National Auto Auction Association. New vehicle registrations, vehicles in operation and vehicles removed from operation per R.L. Polk & Co. Used vehicle transactions and consumer to consumer transactions per CNW Marketing for the U.S. and DesRosiers Automotive Consultants for Canada as well as company estimates. New Vehicle Registrations 10 - 15 Million units Removed from Operation 12 Million units Vehicles in Operation 270 Million units Salvage Auctions 3 - 4 Million units Dealer Trades 11 Million units Wholesalers & Virtual Auctions 7 Million units Consumer - to - Consumer 12 Million units KAR’s Core Markets NAAA Used Vehicle (Whole Car) Auctions Used Vehicle Transactions in North America ~ 40 Million units 7– 9 Million units 6 Vehicle Remarketing Life Cycle |
|
|
Value-Added Ancillary Services Seller Whole Car Consignors Dealers OEMs and their Captive Finance Arms Commercial Fleet Customers Financial Institutions Rental Car Companies Salvage Vehicle Consignors Insurance Companies Charities Whole Car Providers Whole Car Buyers Salvage Buyers Buyer Auction Fee Franchised Dealers Independent Dealers Wholesale Dealers Dismantlers Rebuilders & Resellers Recyclers Auction Fee 7 Vehicle Flow – Whole Car and Salvage Markets Used Vehicle Transactions in North America ~40 million units |
|
|
* Manheim - Manheim Consulting/Goldman Sachs * Kontos TME – Kontos Total Market Estimates Units Sold (Millions) Peak to trough -22% 8 North American Wholesale Volume Forecasts (1) (1) Excludes OPENLANE units sold. |

|
|
Recovery administration (PAR/RDN) Towing / Transportation Vehicle Tracking (AuctionTrac) Inspections and Condition Reports (AutoVin) Marshalling OPENLANE online auctions Secured storage Inspections Body Mechanical Detailing Glass, Keys, PDR (Dent Demon) Titling e-Business Floorplan Financing (AFC) Post-Sale Inspections Reporting Collection and Funds Transfer Vehicle Logistics (CarsArrive) Lot Audits (AutoVin) e-Business Before Auction At Auction After Auction 9 Comprehensive End-to-End Remarketing Solutions |
|
|
10 OPENLANE Integration Update Consolidated and combined sales teams One voice to the customer Positive feedback from customers Single sign-on for ADESA Dealerblock and OPENLANE Q2: ADESA vehicles to be posted to OPENLANE By year end, Dealerblock integrated into OPENLANE CarsArrive rolled out to 7 sites Synergies in line with expectations |
|
|
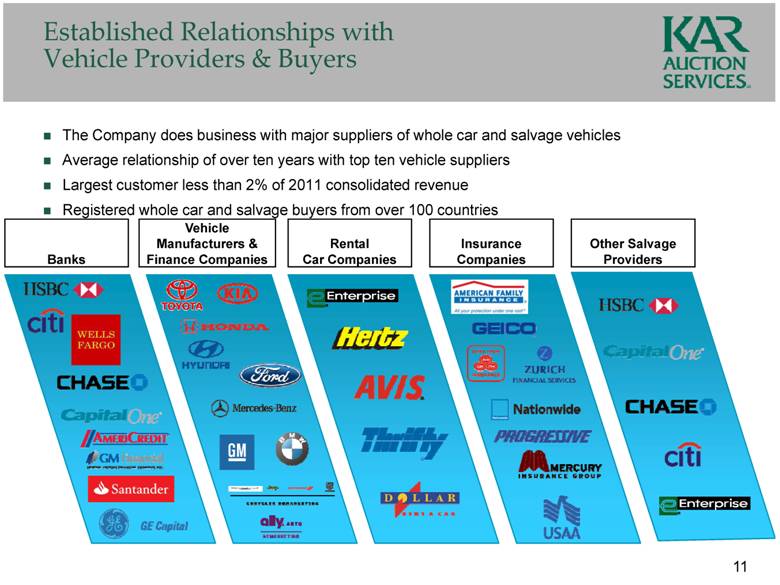
Established Relationships with Vehicle Providers & Buyers The Company does business with major suppliers of whole car and salvage vehicles Average relationship of over ten years with top ten vehicle suppliers Largest customer less than 2% of 2011 consolidated revenue Registered whole car and salvage buyers from over 100 countries Vehicle Manufacturers & Finance Companies Banks Rental Car Companies Insurance Companies Other Salvage Providers 11 |
|
|
Technology Driven 2011 Growth Revenue Adjusted EBITDA Volume Approximately 50% of units sold on-line Integrated into major providers via CSAToday Applications for use on mobile devices Overview Leading seller of total loss vehicles Largest facility footprint in N.A. Live and “live on-line” model 12 IAA – Providing the Advantage in Salvage Auto Auctions |
|
|
Portfolio 2011 Growth Revenue Margins Adjusted EBITDA Loan Transactions $883M at 12/31/11 99% current $750M committed liquidity* $610M drawn Overview Compliments KAR’s offerings Fee driven business Retain title as collateral * U.S. & Cdn facility commitments through June 2014. 13 AFC – Disciplined Growth |
|
|
14 Revenue Gross Profit* ($mm) ($mm) Adjusted EBITDA Adjusted Net Income Per Share ($mm) 44.2% 23.4% 23.2% * Excludes depreciation and amortization expense Fourth Quarter Performance $443 $480 $0 $100 $200 $300 $400 $500 Q4 2010 Q4 2011 $ 0.20 $0.21 $0.00 $0.20 $0.40 $0.60 Q4 2010 Q4 2011 $189 $211 $0 $100 $200 $300 Q4 2010 Q4 2011 42.7% 43.9% $103 $112 $0 $50 $100 $150 Q4 2010 Q4 2011 |
|
|
15 Revenue Gross Profit* ($mm) ($mm) Adjusted EBITDA Adjusted Net Income Per Share ($mm) 44.2% 42.3% 45.1% * Excludes depreciation and amortization expense 25.8% 26.1% 24.5% 44.7% Consolidated Annual Financial Highlights $0 $500 $1,000 $1,500 $2,000 2009 2010 2011 $1,736 $1,823 $1,886 $ 1.05 $1.16 $0.00 $0.50 $1.00 $1.50 2010 2011 $734 $815 $851 $0 $300 $600 $900 2009 2010 2011 $426 $475 $487 $0 $200 $400 $600 2009 2010 2011 |
|
|
16 * KAR adjusted EBITDA includes holding company $211.7 $232.2 $487.2 Attractive 2011 Adjusted EBITDA Margins (US$ in millions) 30.2% 22.8% 25.8% $0 $100 $200 $300 $400 $500 AFC IAAI ADESA KAR* 60.4% $101.9 |
|
|
17 Annual Free Cash Flow as a % of revenues 10.6 % 13.1% 13.4% Free cash flow represents Adjusted EBITDA less capital expenditures, adjusted cash interest paid and cash taxes paid. Cash paid for interest excludes interest paid for standby letters of credit of $0.6 million for the year ended December 31, 2009. Cash paid for interest excludes interest paid for standby letters of credit and securitization interest paid on obligations for securitization receivables of $0.8 million and $6.8 million, respectively, for the year ended December 31, 2010. Cash paid for interest excludes interest paid for standby letters of credit and securitization interest paid on obligations for securitization receivables of $0.6 million and $10.1 million, respectively, for the year ended December 31, 2011. Cash paid for interest in 2011 also excludes $14.5 million related to the early termination and settlement of an interest rate swap agreement. Significant Free Cash Flow Generation (US$ in millions) (1) (4) (3) $184 $238 $253 $0 $100 $200 $300 2009 2010 2011 (2) |
|
|
18 December 31, 2011 Capital Structure (US$ in millions) * Various maturities 12/31/2011 Maturity Term Loan Facilities $1,683.9 2017 Revolving Credit Facility $68.9 2016 Floating Rate Notes 150.0 2014 Capital Leases 27.3 * Total 1,930.1 Less: Available Cash (52.7) Net Debt $1,877.4 Net Debt /Adjusted EBITDA 3.85X |
|
|
*Percentage calculations exclude holding company. $396M** $394M $426M $475M ** Represents pro forma results for the year ended December 31, 2007 so as to illustrate the estimated effects of the 2007 transactions as if they had occurred on January 1, 2007. $487M 2007 2008 2009 2010 2011 19 KAR’s Diverse Business Model – Adjusted EBITDA Contribution by Segment* 0% 20% 40% 60% 80% 100% 53% 59% 60% 50% 42% 25% 30% 30% 35% 39% 22% 11% 10% 15% 19% ADESA IAA AFC |
|
|
Strategic Initiatives Capital Structure Growth Dealer consignment IAA non-insurance vehicles OPENLANE integration Revenue Gross Margins Adjusted EBITDA Reduced net debt prior to OPENLANE(1) Benefits from new Term Loan B U.S. & Canadian Securitizations 20 2011 Accomplishments (1) Following the October 3, 2011 acquisition of OPENLANE, KAR repaid approximately $41 million in revolving debt. |
|
|
21 Appendix |
|
|
22 EBITDA is defined as net income (loss), plus interest expense net of interest income, income tax provision (benefit), depreciation and amortization. Adjusted EBITDA is EBITDA adjusted for the items of income and expense and expected incremental revenue and cost savings as described in the company's senior secured credit agreement covenant calculations. Management believes that the inclusion of supplementary adjustments to EBITDA applied in presenting Adjusted EBITDA is appropriate to provide additional information to investors about one of the principal measures of performance used by the company’s creditors. In addition, management uses Adjusted EBITDA to evaluate the company’s performance and to evaluate results relative to incentive compensation targets. Free cash flow is defined as Adjusted EBITDA minus cash paid for capital expenditures, taxes (net) and interest on corporate debt. Management believes that free cash flow is useful to investors and other users of our financial information because management regularly reviews free cash flow as an indicator of how much cash is generated by normal business operations. The revaluation of certain assets of the company, and resultant increase in depreciation and amortization expense which resulted from the 2007 merger, as well as stock-based compensation expense incurred in connection with service and exit options tied to the 2007 merger, have had a continuing effect on the company’s reported results. Non-GAAP measures of adjusted net income and adjusted net income per share, in the opinion of the company, provide comparability to other companies that may have not incurred these types of noncash expenses. In addition, net income and net income per share for 2010 and 2011 have been adjusted to exclude the loss on extinguishments of debt, as well as a charge in the second quarter of 2011 to settle and terminate the Company’s swap agreement. Lastly, net income and net income per share for the year ended December 31, 2011 have been adjusted for accrued contingent consideration that was reversed related to certain prior year acquisitions. EBITDA, Adjusted EBITDA, free cash flow, adjusted net income and adjusted net income per share have limitations as analytical tools, and should not be considered in isolation, or as a substitute for analysis of the results as reported under GAAP. These measures may not be comparable to similarly titled measures reported by other companies. Non-GAAP Financial Measures |
|
|
23 2007 Adjusted EBITDA Reconciliation Year Ended December 31, 2007 (Dollars in millions) ADESA IAAI AFC Corporate Consolidated Net Income (Loss) $37.0 $2.2 $25.9 $(103.4) $(38.3) Add Back: ADESA 2007 Net Income 39.4 – 16.2 (28.7) 26.9 Add Back: ADESA 2007 Discontinued Ops 0.1 – – – 0.1 Add back: IAAI 2007 Net Loss – (0.4) – – (0.4) Income (Loss) from Continuing Operations $76.5 $1.8 $42.1 $(132.1) $(11.7) Add Back: Income Taxes $30.0 $2.4 $17.2 $(59.6) $(10.0) ADESA 2007 Income Taxes 22.2 – 10.5 (7.8) 24.9 IAAI 2007 Income Taxes – 1.5 – – 1.5 Interest Expense, Net of Interest Income (0.4) (0.3) – 156.7 156.0 ADESA 2007 Interest Expense, Net of Interest Income (0.1) – – 6.4 6.3 IAAI 2007 Interest Expense, Net of Interest Income – 9.9 – – 9.9 Depreciation and Amortization 64.6 40.0 17.8 4.2 126.6 ADESA 2007 Depreciation and Amortization 14.7 – 0.9 0.3 15.9 IAAI 2007 Depreciation and Amortization – 7.9 – – 7.9 Intercompany 20.2 22.2 1.1 (43.5) – ADESA 2007 Intercompany (4.6) 11.1 2.2 (8.7) – EBITDA $223.1 $96.5 $91.8 $(84.1) $327.3 Adjustments 13.4 17.3 5.5 32.0 68.2 Adjusted EBITDA $236.5 $113.8 $97.3 $(52.1) $395.5 Revenue ADESA - January 1 - April 19, 2007 $287.8 $37.6 $47.3 $ – $372.7 IAAI - January 1 - April 19, 2007 – 114.8 – – 114.8 KAR - April 20 - December 31, 2007 677.7 330.1 98.3 – 1,106.1 Total Revenue $965.5 $482.5 $145.6 – $1,593.6 Adjusted EBITDA Margin % 24.5% 23.6% 66.8% 24.8% |
|
|
24 2008 Adjusted EBITDA Reconciliation Year Ended December 31, 2008 (Dollars in millions) ADESA IAAI AFC Corporate Consolidated Net Income (Loss) $52.5 $9.2 $(151.3) $(126.6) $(216.2) Add back: Income Taxes 33.7 6.3 10.2 (81.6) (31.4) Interest Expense, Net of Interest Income – 0.2 – 213.2 213.4 Depreciation and Amortization 93.2 61.6 25.3 2.7 182.8 Intercompany 44.4 38.4 (0.7) (82.1) – EBITDA $223.8 $115.7 $(116.5) $(74.4) $148.6 Adjustments 41.3 17.5 166.9 19.2 244.9 Adjusted EBITDA $265.1 $133.2 $50.4 $(55.2) $393.5 Revenue $1,123.4 $550.3 $102.3 $– $1,776.0 Adjusted EBITDA Margin % 23.6% 24.2% 49.3% 22.2% |
|
|
25 2009 Adjusted EBITDA Reconciliation Year Ended December 31, 2009 (Dollars in millions) ADESA IAAI AFC Corporate Consolidated Net Income (Loss) $94.4 $25.8 $19.1 $(116.1) $23.2 Add back: Income Taxes 56.0 16.2 8.4 (69.5) 11.1 Interest Expense, Net of Interest Income 0.5 1.4 – 170.3 172.2 Depreciation and Amortization 88.4 58.3 24.7 1.0 172.4 Intercompany 28.9 36.2 (6.8) (58.3) – EBITDA $268.2 $137.9 $45.4 $(72.6) $378.9 Adjustments 18.1 8.7 3.8 16.4 47.0 Adjusted EBITDA $286.3 $146.6 $49.2 $(56.2) $425.9 Cash Paid for Capital Expenditures (65.6) Cash Paid for Taxes, Net of Refunds (18.8) Cash Paid for Interest, as Adjusted (1) (157.2) Free Cash Flow $184.3 Revenue $1,088.5 $553.1 $93.9 $– $1,735.5 Adjusted EBITDA Margin % 26.3% 26.5% 52.4% 24.5% Free Cash Flow as % of Revenue 10.6% Cash paid for interest excludes interest paid for standby letters of credit of $0.6 million for the year ended December 31, 2009. |
|
|
26 2010 Adjusted EBITDA Reconciliation Year Ended December 31, 2010 (Dollars in millions) ADESA IAAI AFC Corporate Consolidated Net Income (Loss) $80.1 $44.7 $38.4 $(93.6) $69.6 Add back: Income Taxes 43.6 26.7 21.1 (64.2) 27.2 Interest Expense, Net of Interest Income 0.9 2.3 7.2 130.9 141.3 Depreciation and Amortization 86.9 58.9 25.0 0.5 171.3 Intercompany 42.3 38.2 (11.7) (68.8) – EBITDA $253.8 $170.8 $80.0 $(95.2) $409.4 Adjustments 16.0 15.2 (0.4) 35.0 65.8 Adjusted EBITDA $269.8 $186.0 $79.6 $(60.2) $475.2 Cash Paid for Capital Expenditures (78.9) Cash Paid for Taxes, Net of Refunds (36.3) Cash Paid for Interest, as Adjusted (1) (121.8) Free Cash Flow $238.2 Revenue $1,075.9 $610.4 $136.3 $– $1,822.6 Adjusted EBITDA Margin % 25.1% 30.5% 58.4% 26.1% Free Cash Flow as % of Revenue 13.1% Cash paid for interest excludes interest paid for standby letters of credit and securitization interest paid on obligations for securitization receivables of $0.8 million and $6.8 million, respectively, for the year ended December 31, 2010. |
|
|
27 2011 Adjusted EBITDA Reconciliation Year Ended December 31, 2011 (Dollars in millions) ADESA IAA AFC Corporate Consolidated Net Income (Loss) $55.8 $65.5 $57.2 $(106.3) $72.2 Add back: Income Taxes 17.9 36.1 29.6 (65.8) 17.8 Interest Expense, Net of Interest Income 0.7 2.1 12.0 128.0 142.8 Depreciation and Amortization 88.1 65.8 24.7 1.2 179.8 Intercompany 52.4 38.3 (14.4) (76.3) – EBITDA $214.9 $207.8 $109.1 $(119.2) $412.6 Adjustments 17.3 3.9 (7.2) 60.6 74.6 Adjusted EBITDA $232.2 $211.7 $101.9 $(58.6) $487.2 Cash Paid for Capital Expenditures (85.8) Cash Paid for Taxes, Net of Refunds (36.5) Cash Paid for Interest, as Adjusted (1) (111.6) Free Cash Flow $253.3 Revenue $1,017.4 $700.1 $168.8 $– $1,886.3 Adjusted EBITDA Margin % 22.8% 30.2% 60.4% 25.8% Free Cash Flow as % of Revenue 13.4% Cash paid for interest excludes interest paid for standby letters of credit and securitization interest paid on obligations for securitization receivables of $0.6 million and $10.1 million, respectively, for the year ended December 31, 2011. Cash paid for interest in 2011 also excludes $14.5 million related to the early termination and settlement of an interest rate swap agreement. |
|
|
28 LTM Adjusted EBITDA Reconciliation Three Months Ended Twelve Months Ended (Dollars in millions) (Unaudited) March 31, 2011 June 30, 2011 September 30, 2011 December 31, 2011 December 31, 2011 Net income (loss) $39.8 ($14.3) $32.2 $14.5 $72.2 Add back: Income taxes 1.0 (6.9) 14.7 9.0 17.8 Interest expense, net of interest income 33.2 49.6 29.3 30.7 142.8 Depreciation and amortization 44.1 43.6 43.8 48.3 179.8 EBITDA 118.1 72.0 120.0 102.5 412.6 Nonrecurring charges 2.8 16.2 5.8 5.2 30.0 Noncash charges 8.5 46.2 (7.5) 7.1 54.3 AFC interest expense (2.1) (2.3) (2.6) (2.7) (9.7) Adjusted EBITDA $127.3 $132.1 $115.7 $112.1 $487.2 |
|
|
29 Q4 2010 Adjusted EBITDA Reconciliation Three Months Ended December 31, 2010 (Dollars in millions) ADESA IAA AFC Corporate Consolidated Net Income (Loss) $8.1 $11.4 $11.2 $(23.4) $7.3 Add back: Income Taxes 4.9 5.2 3.7 (16.3) (2.5) Interest Expense, Net of Interest Income 0.1 0.6 2.1 32.2 35.0 Depreciation and Amortization 22.3 15.2 6.4 0.1 44.0 Intercompany 11.3 9.6 (3.2) (17.7) – EBITDA $46.7 $42.0 $20.2 $(25.1) $83.8 Adjustments 4.7 3.4 0.3 10.8 19.2 Adjusted EBITDA $51.4 $45.4 $20.5 $(14.3) $103.0 Revenue $254.8 $152.0 $36.4 $– $443.2 Adjusted EBITDA Margin % 20.2% 29.9% 56.3% 23.2% |
|
|
30 Q4 2011 Adjusted EBITDA Reconciliation Three Months Ended December 31, 2011 (Dollars in millions) ADESA IAA AFC Corporate Consolidated Net Income (Loss) $(2.0) $15.9 $15.0 $(14.4) $14.5 Add back: Income Taxes 3.0 7.2 7.3 (8.5) 9.0 Interest Expense, Net of Interest Income 0.2 0.5 3.5 26.5 30.7 Depreciation and Amortization 24.9 16.9 6.1 0.4 48.3 Intercompany 14.9 9.5 (3.8) (20.6) – EBITDA $41.0 $50.0 $28.1 $(16.6) $102.5 Adjustments 6.7 1.3 (2.3) 3.9 9.6 Adjusted EBITDA $47.7 $51.3 $25.8 $(12.7) $112.1 Revenue $250.3 $186.3 $43.2 $– $479.8 Adjusted EBITDA Margin % 19.1% 27.5% 59.7% 23.4% |
|
|
31 Adjusted Net Income Per Share Reconciliation In the second quarter of 2011, there were losses on extinguishments of debt totaling $53.5 million ($33.2 million net of tax). In addition, there was a loss on extinguishment of debt of $25.3 million ($15.7 million net of tax) incurred in the first quarter 2010 and another loss on extinguishment of debt of $7.4 million ($4.6 million net of tax) incurred in the fourth quarter 2010. In connection with our debt refinancing, in the second quarter of 2011 we de-designated our interest rate swap and entered into a swap termination agreement. We paid $14.5 million ($9.0 million net of tax) to settle and terminate the swap agreement. Increased depreciation and amortization expense was $15.0 million ($9.3 million net of tax) and $15.6 million ($10.0 million net of tax) for the three months ended December 31, 2011 and 2010. For the years ended December 31, 2011 and 2010, increased depreciation and amortization expense was $61.4 million ($38.6 million net of tax) and $63.6 million ($40.1 million net of tax). Stock-based compensation resulting from the 2007 merger was $5.9 million ($4.7 million net of tax) and $7.4 million ($5.6 million net of tax) for the three months ended December 31, 2011 and 2010. For the years ended December 31, 2011 and 2010, such stock-based compensation was $16.1 million ($10.4 million net of tax) and $19.8 million ($13.2 million net of tax). In 2011, we reversed accrued contingent consideration of approximately $4.6 million ($2.9 million benefit net of tax). The net adjustments to accrued contingent consideration related to certain prior year acquisitions based on revised forecasts, which indicated the unit volumes required during the measurement period in order for the contingent consideration to become payable would not be met. ( In millions, except per share amounts ) 2011 2010 2011 2010 Net income 14.5 $ 7.3 $ 72.2 $ 69.6 $ Loss on extinguishment of debt, net of tax (1) - 4.6 33.2 20.3 Swap termination, net of tax (2) - - 9.0 - Stepped up depreciation and amortization expense, net of tax (3) 9.3 10.0 38.6 40.1 Stock-based compensation, net of tax (4) 4.7 5.6 10.4 13.2 Contingent consideration adjustment, net of tax (5) - - (2.9) - Adjusted net income 28.5 $ 27.5 $ 160.5 $ 143.2 $ Net income per share - diluted 0.11 $ 0.05 $ 0.52 $ 0.51 $ Loss on extinguishment of debt, net of tax - 0.04 0.24 0.15 Swap termination, net of tax - - 0.07 - Stepped up depreciation and amortization expense, net of tax 0.07 0.07 0.28 0.29 Stock-based compensation, net of tax 0.03 0.04 0.07 0.10 Contingent consideration adjustment, net of tax - - (0.02) - Adjusted net income per share 0.21 $ 0.20 $ 1.16 $ 1.05 $ Weighted average diluted shares 137.9 136.4 137.8 135.9 Three Months Ended Year Ended December 31, December 31, |