Attached files
| file | filename |
|---|---|
| 8-K - FORM 8-K - JONES LANG LASALLE INC | d305949d8k.htm |
 Investor Presentation
February 2012
..45,500 employees….200 offices….70 countries….1 global platform..
Exhibit 99.1 |
 Table of Contents
I.
Company Description
II.
Global Growth Strategy
III.
Financial Overview
IV.
Appendix
2 |
 Company
Description |
 Global
real estate services Premier global investment manager
•
LaSalle Investment Management provides outstanding
performance and service for clients with global real estate
investment portfolios
Shareholder opportunity
Jones Lang LaSalle
Shareholder value
2011 Revenue =
$3.6 billion
4
Value creating real estate services and investment management firm
•
Investment expertise including core, value
add, opportunistic and private investing
across major property types
•
More than 300 institutional clients worldwide
•
Leading global markets positions
•
Consolidator in a consolidating industry
•
Productivity and margin expansion
•
Strategic, fully integrated services for real estate
owners, occupiers and investors
•
Productivity and cost solutions for corporate clients
seeking to optimize space and location
•
Industry leader recognized for deep market
knowledge and execution expertise
•
Strong cash-generating business model
•
Revenue growth
•
Investment-grade balance sheet
•
Effective tax and interest expense management |
 Jones
Lang Wootton founded in London 1783
1968
1997
1999
LaSalle Partners founded, operating primarily in the Americas
LaSalle Partners initial public offering
LaSalle Partners and Jones Lang Wootton merge to create Jones Lang LaSalle
Integrated global platform (NYSE ticker
“JLL”)
Transformational M&A Extends Market Positions
2011
2008
The Staubach Company and Jones Lang LaSalle combine operations
Largest merger in JLL history transforms U.S. local markets position
5
King Sturge (est. 1760) and Jones Lang LaSalle merge EMEA operations
Enhances strength and depth of service capabilities in the UK and EMEA
1760
14% compound annual revenue growth rate since 1999 merger between LaSalle Partners and
JLW 1957
Jones Lang Wootton expands into Asia Pacific
2007
Jones Lang LaSalle acquires Meghraj Property Consultants Private
Ltd. (est. 1995)
Establishes dominant market leading position in India
|
 Leading Brand Well Positioned for Growth
6
Market
Trends
Emerging markets
to lead global
expansion
Demand for
local and global
services
Outsourcing
growth
continues
Top performers
winning investor
mandates
Industry
consolidation
2011 Revenue = $3.6B
Jones Lang LaSalle Opportunity
•
Capitalize on leading global markets positions for
improved transactional and annuity revenue
•
Continue Corporate Solutions leadership; capture
emerging sectors (e.g. Healthcare, Infrastructure)
•
Leverage LaSalle’s investment performance and
client loyalty for continued wins and capital raising
•
Pursue growth within G5 strategy and financial
objectives |
 Global
Growth Strategy |
 Jones Lang LaSalle Global Growth Strategy
G2
G1
G4
G3
G5
Connections
Build our local and regional
leasing and capital markets
businesses
Strengthen our winning
positions in Corporate
Solutions
Capture the leading
share of global capital
Grow LaSalle Investment
Management’s leadership
position
flows for investment sales
8 |
 as of
Q4 2011 Rental Value
growth slowing
Rental Value
growth
accelerating
Rental Values
bottoming out
Rental Values
falling
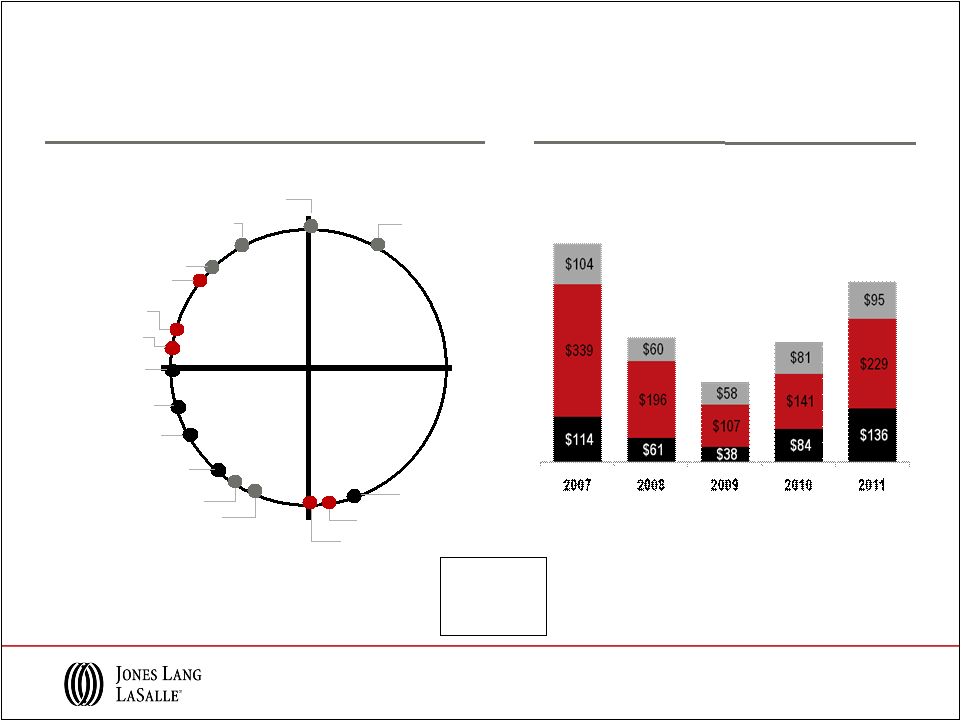
Leasing
$593
$781
$753
($ in millions)
$1,000
JLL Leasing Revenue
JLL Property Clock
SM
–
Leasing Values
$1,188
Dubai
San Francisco
Berlin
Dallas, New York
Atlanta, Washington DC
Johannesburg, Frankfurt, Tokyo
Chicago,
Rome
Los Angeles, Madrid
Shanghai
Singapore
Hong Kong
Seoul
Mexico City
Brussels
Stockholm
Sao Paulo
Moscow
London, Paris
Sydney
Milan
Beijing
Toronto
Detroit
Mumbai
*
Americas
EMEA
Asia Pacific
*In July 2008, JLL acquired the Staubach Company
with annual revenue of approximately $375 million.
9
Source: Jones Lang LaSalle |
 Capital Markets
$557
$317
$203
$306
$460
*
Atlanta
Dallas
Toronto
Mexico City
Capital Value
growth slowing
Capital Value
growth
accelerating
Capital Values
bottoming out
Capital Values
falling
Mumbai
Beijing, Stockholm
Shanghai,
Washington DC, London
Singapore
Hong Kong
Paris
Milan,
New York
Madrid,
Seoul, Detroit
Frankfurt
Los Angeles
Berlin, Moscow
Sydney
Chicago
San Francisco
Sao Paulo
Tokyo, Brussels
Americas
EMEA
Asia Pacific
*In May 2011, JLL acquired King Sturge with
annual revenue of approximately $260 million
(approx. 30% from Capital Markets).
as of Q4 2011
($ in millions)
JLL Capital Markets Revenue
JLL Property Clock
SM
–
Capital Values
10
Source: Jones Lang LaSalle |
 2012 Projected Value Changes for Prime Offices
Click here
to see the complete JLL Global Markets Perspective, including our 2012 outlook
11
Capital Values
Rental Values
+ 10-20%
+ 5-10%
+ 0-5%
-
0-5%
-
5-10%
+ 20%
-
10-20%
Moscow, Shanghai, Mumbai
Sydney, Tokyo
Sao Paulo, New York*
London*, Frankfurt, Paris,
Stockholm, Boston, Chicago,
Los Angeles, Washington DC
Toronto, Tokyo, Moscow
San Francisco, New York*
Sydney, Mumbai, Boston,
Chicago, Los Angeles,
Washington DC, Sao Paulo,
Stockholm
Shanghai, London*, Frankfurt
Dubai
Brussels, Madrid, Mexico City
Brussels, Madrid, Paris
Mexico City
Dubai
Toronto, San Francisco
Hong Kong, Singapore
Hong Kong, Singapore
Beijing
Beijing
*New York –
Midtown, London –
West End. Nominal rates in local currency.
Source: Jones Lang LaSalle, January 2012 |
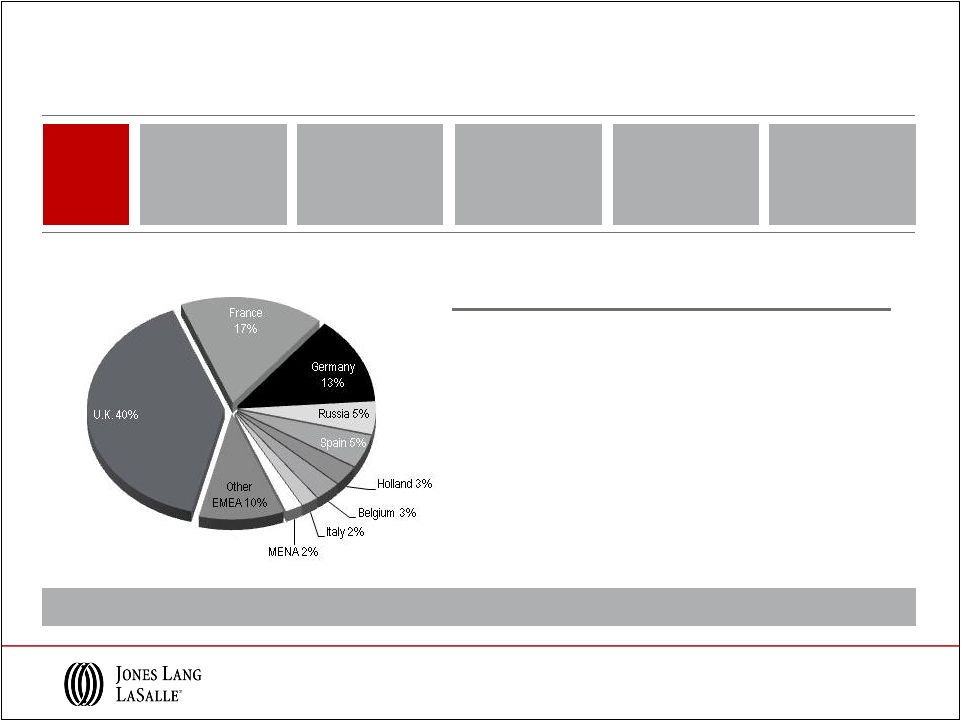
 Global Capital Flows for Investment Sales
* EMEA: In US$ terms, unchanged in Euro terms.
Source: Jones Lang LaSalle, January 2012
Direct Commercial Real Estate Investment, 2005-2012
2012 volumes expected to match 2011, with downside risk
12
+10-15%
-5-10%*
0%
($ in billions) |
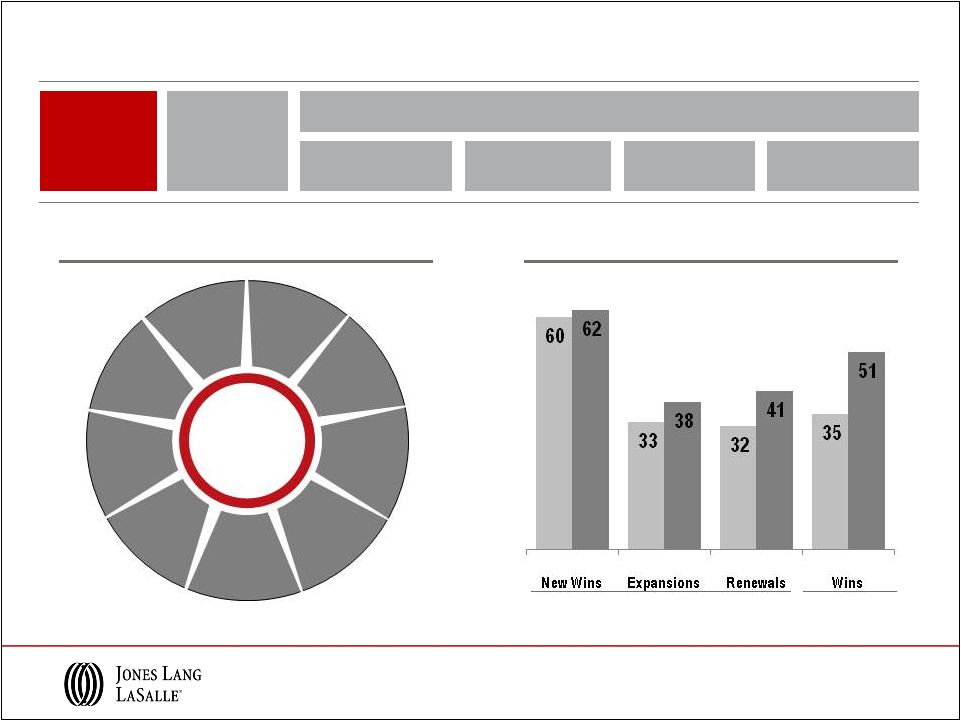 Corporate Solutions
13
JLL Service Offerings
JLL Client Wins
Competitive
Advantages
Global
Position
Expertise across services & geographies to capitalize on market trends
Space
optimization
Portfolio
transparency
Energy
management
Transformational
outsourcing
Large Corporates
Middle Market
Integrated
Facility
Management
Transaction
Advisory
Services
Project
Management
Lease
Administration
Labwell
Lab
Management
Energy &
Sustainable
Services
Strategic
Consulting
Corporate
Finance /
CMG
Client
Relationship
Management
Corporate
Retail
Services
2010 2011
2010 2011
2010 2011
2010 2011 |
 $40.6
B $49.7 B
$46.2 B
AUM
($ millions)
$39.9 B
2005 to 2011 Advisory Fees: 11% Compound Annual Growth Rate
LaSalle Investment Management
$41.3 B
$29.8 B
Global Financial Crisis
Stabilized Advisory Fees
Building Advisory Fees in Healthy Markets
14
$47.7 B
Competitive
Advantages
Diversified
global
platform
Investment performance at or above benchmarks for all business segments
Core, Value Add,
Opportunistic,
Public Equity
300+
institutional
clients
Consistent client
services delivery
model
Financial backing
of well-capitalized
parent company |
 15
JLL Acquisition Objectives and Transformative Results
The Staubach
Company
King Sturge
Meghraj
Trinity Funds
Management
Strategy
Establish leading U.S. local
market tenant rep position
Strengthen local market
scale, particularly in the U.K.
Augment India corporate business
with leading local presence
Gain scale and credibility
in Australia for LaSalle
Purchase Price
$613 million
£197 million
$60 million
A$9 million
Upfront
Consideration
36%
50%
50%
100%
Deferred
Payment terms
5 years
5 years
5 years
n/a
EBITDA
multiple
8.0x notional,
7.0x on PV basis
7.5x notional,
7.0x on PV basis
7.5x
4.0x
Strategic
Align with
G5 strategy
Enhance service
delivery for clients
Cultural
alignment
Meet
financial goals
Financial
Profit growth to
shareholders
Neutral to accretive
EBITDA multiples
EPS accretive within
12-18 months
Maintain investment
grade strength |
 Financial Overview |
 2010
Consolidated Earnings Scorecard
Note: 2011 adjusted for restructuring and intangible amortization, 2010 adjusted for
restructuring and non-cash co-investment charges. 17
2011
Revenue
$3.6B
Adjusted
Net Income
$215M
US GAAP: $164M
Adjusted
EPS
$4.83
US GAAP: $3.70
Adjusted
Operating Income
$319M
US GAAP: $251M
Adj. Operating
Income Margin
8.9%
US GAAP: 7.0%
$166M
$3.77
$267M
9.1%
$2.9B
US GAAP: $158M
US GAAP: $3.48
US GAAP: $261M
US GAAP: 8.9%
Revenue Contribution
Operating Income Contribution
YoY Growth: 23%
YoY Growth: 18% |
 Asia
Pacific FY 2011 Real Estate Services Revenue
($ in millions; % change in USD )
Americas
EMEA
Leasing
Capital Markets &
Hotels
Property & Facility
Management
Project &
Development Services
Advisory, Consulting
& Other
Total RES
Operating Revenue
$760.2
$136.1
$335.6
$178.5
$112.2
$1,522.6
19%
62%
25%
12%
2%
21%
$236.1
$229.1
$152.8
$182.5
$173.5
$974.0
17%
62%
7%
59%
36%
34%
$192.3
$94.8
$364.6
$80.8
$83.8
$816.3
22%
16%
20%
27%
17%
20%
$1,188.6
$460.0
$853.0
$441.8
$369.5
$3,312.9
19%
50%
19%
31%
20%
24%
Total RES
Revenue
Note: Segment and Consolidated Real Estate Services (“RES”) operating
revenue exclude Equity earnings (losses). 18 |
 Adjusted Operating Income and Medium Term Targets
19
Segment Contribution
Consolidated
(1)
2011 Operating income for EMEA adjusted for intangible amortization related to the
King Sturge acquisition. (3)
2006 Operating income for LIM adjusted to exclude a large incentive fee from a single
client; 2010 Operating income adjusted to exclude non-cash
co-investment charges. (2)
2007 Operating income for Asia Pacific adjusted to exclude a large incentive fee from
a single client. |
 Americas Real Estate Services
20
2011
Segment
Profile
•
Strong leasing performance with increased
market share and productivity; revenue up 21%
•
Robust Capital Markets growth driven by
enhanced teams and broadened service offering;
well-positioned to capture recovering markets
•
High margin Corporate Solutions business with
annuity-like revenue
•
Focus for 2012 on productivity gains and margin
improvement
Performance and Priorities
Revenue
$1,525M
Operating Income
$163M
Operating Income
Margin
10.7%
EBITDA
$201M
EBITDA Margin
13.2%
2011 Americas Contribution: 42% of Total Firm Revenue, 52% of Adjusted Operating
Income |
 EMEA Real Estate Services
21
2011
Segment
Profile
•
Successful 2011 integration of King Sturge;
particularly strong performance in Capital
Markets and Advisory
•
Improved profitability in large markets (e.g. UK,
Germany) and stabilized performance from
previous loss-makers
•
Eurozone crisis impact on 2012 performance
remains unknown; potential to advise banks and
other clients on portfolio repositioning or sales
Revenue
$974M
Adj. Operating
Income
$39M
Adj. Operating
Income Margin
4.0%
EBITDA
$57M
EBITDA Margin
5.9%
2011 EMEA Contribution: 27% of Total Firm Revenue, 9% of Adjusted Operating Income
Note: EMEA results adjusted to exclude intangible amortization related to the King
Sturge acquisition. Performance and Priorities |
 Asia Pacific Real Estate Services
22
2011
Segment
Profile
•
Robust revenue and margin growth in 2011
•
Winning Corporate Solutions business provides
profitable, recurring revenue
•
Strong market positions in important developed
markets (Australia, Hong Kong, Singapore)
•
Significant growth opportunities in developing
markets (China, India, Indonesia)
Revenue
$817M
Operating Income
$66M
Operating Income
Margin
8.1%
EBITDA
$78M
EBITDA Margin
9.6%
2011 Asia Pacific Contribution: 23% of Total Firm Revenue, 21% of Adjusted Operating
Income Performance and Priorities |
 LaSalle Investment Management
23
2011
Segment
Profile
Revenue
$275M
Operating Income
$57M
Operating Income
Margin
20.7%
EBITDA
$60M
EBITDA Margin
21.7%
2011
LIM
Contribution:
8%
of
Total
Firm
Revenue,
18%
of
Adjusted
Operating
Income
Product
Assets Under
Management
($ in billions)
Average
Performance
Private Equity
U.K.
$11.9
Above benchmark
Continental Europe
$4.3
Return: >1x equity
North America
$10.7
Above benchmark
Asia Pacific
$9.0
Return: >1x equity
Public Securities
$11.8
Above benchmark
Total Q4 2011 AUM
$47.7 B
Note: AUM data reported on a one-quarter lag.
Performance and Priorities
•
High margin advisory fees contribute to
operating margin of 21%
•
Maximize incentive fees and equity
earnings from performance of older
vintage funds
•
Capital raising to replace maturing funds
•
Continue winning new separate account
mandates |
 Credit
Facility Capacity
$1.1B
Solid Cash Flows and Balance Sheet Position
($ in millions)
24
2011 Key
Highlights
Cash from
Earnings
$311M
Total
Net Debt
$643M
Net Interest
Expense
$35.6M
Investment Grade
Ratings
Baa2
|
BBB-
2011
Q1
Q2
Q3
Q4
FY
Cash from Earnings
$42
$81
$68
$120
$311
Change in Working Capital
(239)
(20)
27
133
(99)
Cash from / (used in) Operations
($197)
$61
$95
$253
$212
Primary Uses
Capital Expenses
(17)
(19)
(20)
(36)
(92)
Acquisitions & Deferred Payment Obligations
(25)
(210)
(162)
(19)
(416)
Co-Investment
(2)
2
(47)
2
(45)
Dividends
-
(7)
-
(7)
(14)
Net Cash Outflows
($44)
($234)
($229)
($60)
($567)
Net Share Activity & Other Financing
(4)
(2)
(8)
(2)
(16)
Net Bank Debt Borrowings
($245)
($175)
($142)
$191
($371)
(1)
(1)
Restructuring
and
acquisition
related
charges
of
$16
million
and
$34
million
are
included
in
Q3
and
Q4
2011,
respectively.
Strong differentiating balance sheet supports business growth and opportunity
|
 Continued growth in corporate
outsourcing
Americas and Asia real estate
growth tempered by EMEA
uncertainty
Key Takeaways
25
JLL
Integrated
global
services
Industry leading
research and
market expertise
Superior client
relationship
management
Strong
brand
Investment grade
balance sheet
JLL Actions
Market Outlook
Steady institutional capital flows
into global real estate
Leverage global positions to grow market share
and continue client success in local markets
Increase productivity and manage costs to
improve margin
Maintain financial strength and flexibility to
respond to opportunities and challenges
Continue to invest selectively and strategically
to capitalize on market consolidation |
 Appendix |
 ($ in
millions) Reconciliation of GAAP Net Income to Adjusted Net Income
and Adjusted EPS
Twelve Months Ended
December 31,
2011
2010
GAAP Net income attributable to common
shareholders
$ 164.0
$ 153.5
Shares (in 000s)
44,367
44,084
GAAP earnings per share
$ 3.70
$ 3.48
GAAP Net income attributable to common
shareholders
$ 164.0
$ 153.5
Restructuring and acquisition charges, net
41.9
4.9
Intangible amortization, net
8.6
-
Non-cash co-investment charges, net
-
7.9
Adjusted net income
$ 214.5
$ 166.3
Shares (in 000s)
44,367
44,084
Adjusted earnings per share
$ 4.83
$ 3.77
27 |
 Reconciliation of GAAP Operating Income to Adjusted
Operating Income and Net Income to Adjusted EBITDA
Twelve Months Ended
December 31,
2011
2010
Operating Income
$251.2
$260.7
Restructuring and acquisition charges
56.1
6.4
Intangible amortization
11.4
-
Adjusted Operating Income
$ 318.7
$267.1
GAAP Net income attributable to
common shareholders
$164.0
$153.5
Interest expense, net of interest income
35.6
45.8
Provision for income taxes
56.4
49.0
Depreciation and amortization
82.8
71.6
EBITDA
$ 338.8
$ 319.9
Restructuring and acquisition charges
56.1
6.4
Non-cash co-investment charges
-
10.4
Adjusted EBITDA
$ 394.9
$ 336.7
28
($ in millions) |
 Forward looking statements
29
Statements in this presentation regarding, among other things, future financial results
and performance, achievements, plans and objectives and dividend payments may be
considered forward-looking statements within the meaning of the Private
Securities Litigation Reform Act of 1995. Such statements involve known and unknown risks,
uncertainties and other factors which may cause actual results, performance,
achievements, plans and objectives of Jones Lang LaSalle to be materially
different from those expressed or implied by such forward-looking statements.
Factors that could cause actual results to differ materially include those discussed
under “Business,” “Risk Factors,” “Management’s
Discussion and Analysis of Financial Condition and Results of Operations,” “Quantitative and
Qualitative Disclosures about Market Risk,” “Cautionary Note Regarding
Forward-Looking Statements” and elsewhere in Jones Lang LaSalle’s
Annual Report on Form 10-K for the year ended December 31, 2010 and in the Quarterly
Report on Form 10-Q for the quarters ended March 31, 2011, June 30, 2011 and
September 30, 2011, and in other reports filed with the Securities and Exchange
Commission. There can be no assurance that future dividends will be declared since
the actual declaration of future dividends, and the establishment of record and payment dates, remains
subject to final determination by the Company’s Board of Directors. Statements
speak only as of the date of this presentation. Jones Lang LaSalle expressly
disclaims any obligation or undertaking to update or revise any forward-
looking statements contained herein to reflect any change in Jones Lang LaSalle’s
expectations or results, or any change in events.
© Jones Lang LaSalle IP, Inc. 2012. All rights reserved. No part of this publication
may be reproduced by any means, whether graphically, electronically, mechanically
or otherwise howsoever, including without limitation photocopying and recording on
magnetic tape, or included in any information store and/or retrieval system without prior written
permission of Jones Lang LaSalle IP, Inc. |