Attached files
| file | filename |
|---|---|
| EX-23.01 - EX-23.01 - WEST CORP | d157581dex2301.htm |
| EX-23.03 - EXHIBIT 23.03 - WEST CORP | d157581dex2303.htm |
Table of Contents
As filed with the Securities and Exchange Commission on February 24, 2012
Registration No. 333-162292
UNITED STATES
SECURITIES AND EXCHANGE COMMISSION
Washington, D.C. 20549
AMENDMENT NO. 9 TO
Form S-1
REGISTRATION STATEMENT
UNDER
THE SECURITIES ACT OF 1933
West Corporation
(Exact name of Registrant as specified in its charter)
| Delaware | 7389 | 47-0777362 | ||
| (State or other jurisdiction of incorporation or organization) |
(Primary Standard Industrial Classification Code Number) |
(IRS Employer Identification No.) |
11808 Miracle Hills Drive
Omaha, Nebraska 68154
(402) 963-1200
(Address, including zip code, and telephone number, including area code, of Registrant’s principal executive offices)
David C. Mussman
Executive Vice President,
Secretary and General Counsel
West Corporation
11808 Miracle Hills Drive
Omaha, Nebraska 68154
(402) 963-1200
(Name, address, including zip code, and telephone number, including area code, of agent for service)
Copies to:
| Frederick C. Lowinger Robert L. Verigan Sidley Austin LLP One South Dearborn Street Chicago, Illinois 60603 (312) 853-7000 |
Keith F. Higgins Andrew J. Terry Ropes & Gray LLP Prudential Tower 800 Boylston Street Boston, Massachusetts 02199-3600 (617) 951-7000 |
Approximate date of commencement of proposed sale to public: As soon as practicable after this registration statement becomes effective.
If any of the securities being registered on this Form are to be offered on a delayed or continuous basis pursuant to Rule 415 under the Securities Act of 1933, check the following box. ¨
If this Form is filed to register additional securities for an offering pursuant to Rule 462(b) under the Securities Act, check the following box and list the Securities Act registration statement number of the earlier effective registration statement for the same offering. ¨
If this Form is a post-effective amendment filed pursuant to Rule 462(c) under the Securities Act, check the following box and list the Securities Act registration statement number of the earlier effective registration statement for the same offering. ¨
If this Form is a post-effective amendment filed pursuant to Rule 462(d) under the Securities Act, check the following box and list the Securities Act registration statement number of the earlier effective registration statement for the same offering. ¨
Indicate by check mark whether the registrant is a large accelerated filer, an accelerated filer, a non-accelerated filer, or a smaller reporting company. See the definitions of “large accelerated filer,” “accelerated filer” and “smaller reporting company” in Rule 12b-2 of the Exchange Act. (Check one).
| Large accelerated Filer ¨ | Accelerated filer ¨ | Non-accelerated filer x | Smaller reporting company ¨ | |||
| (Do not check if a smaller reporting company) |
The Registrant hereby amends this registration statement on such date or dates as may be necessary to delay its effective date until the Registrant shall file a further amendment which specifically states that this registration statement shall thereafter become effective in accordance with Section 8(a) of the Securities Act of 1933, as amended, or until this registration statement shall become effective on such date as the Securities and Exchange Commission, acting pursuant to said Section 8(a), may determine.
Table of Contents
The information in this preliminary prospectus is not complete and may be changed. These securities may not be sold until the registration statement filed with the Securities and Exchange Commission is effective. This preliminary prospectus is not an offer to sell these securities, nor does it seek an offer to buy these securities in any jurisdiction where the offer or sale is not permitted.
PROSPECTUS (Subject to completion)
Issued February 24, 2012
Shares

West Corporation
This is an initial public offering of shares of common stock of West Corporation. No public market for our common stock has existed since our recapitalization in 2006.
We are offering of the shares to be sold in the offering. The selling stockholders identified in this prospectus are offering an additional shares of our common stock. We will not receive any of the proceeds from the sale of the shares being sold by the selling stockholders.
We anticipate that the initial public offering price per share will be between $ and $ .
We have applied to list our common stock on the Nasdaq Global Select Market under the symbol “WSTC.”
Investing in our common stock involves risks. See “Risk Factors” beginning on page 15.
Price $ Per Share
| Price to |
Underwriting |
Proceeds to |
Proceeds to Selling Stockholders | |||||
| Per Share |
$ | $ | $ | $ | ||||
| Total |
$ | $ | $ | $ |
We have granted the underwriters a 30-day option to purchase up to an aggregate of additional shares of common stock on the same terms set forth above. See the section of this prospectus entitled “Underwriting.”
The Securities and Exchange Commission and state securities regulators have not approved or disapproved of these securities or determined if this prospectus is truthful or complete. Any representation to the contrary is a criminal offense.
The underwriters expect to deliver the shares to purchasers on or about , 2012.
| Goldman, Sachs & Co. |
Morgan Stanley |
| BofA Merrill Lynch |
Citi |
| Deutsche Bank Securities | Wells Fargo Securities |
Barclays Capital
Baird Sanford C. Bernstein William Blair & Company Credit Suisse
Raymond James Signal Hill
, 2012
Table of Contents

Table of Contents
You should rely only on the information contained in this prospectus and any free writing prospectus we provide to you. Neither we nor the underwriters have authorized any other person to provide you with different information. If anyone provides you with different or inconsistent information, you should not rely on it. Neither we nor the underwriters are making an offer to sell these securities in any jurisdiction where the offer or sale is not permitted. You should assume that the information appearing in this prospectus is accurate only as of the date on the front cover of this prospectus or such other date stated in this prospectus.
Until , 2012 (25 days after the date of this prospectus), all dealers that buy, sell or trade our common stock, whether or not participating in this offering, may be required to deliver a prospectus. This is in addition to the dealers’ obligation to deliver a prospectus when acting as underwriters and with respect to their unsold allotments or subscriptions.
We obtained the industry, market and competitive position data used throughout this prospectus from our own research, internal surveys and studies conducted by third parties, independent industry associations or general publications and other publicly available information.
i
Table of Contents
This summary highlights selected information about us and this offering. This summary may not contain all of the information that you should consider before making an investment decision. You should read carefully the more detailed information set forth under “Risk Factors” and the other information included in this prospectus. Except where the context suggests otherwise, the terms “company,” “we,” “us” and “our” refer to West Corporation and its consolidated subsidiaries. Unless indicated otherwise, the information in this prospectus assumes the common stock to be sold in this offering is to be sold at $ per share and no exercise by the underwriters of their option to purchase additional shares.
We refer to Adjusted EBITDA in various places in this prospectus. The definitions of EBITDA and Adjusted EBITDA and a reconciliation of Adjusted EBITDA to net income is set forth in note 2 to “Prospectus Summary—Summary Consolidated Financial Data” and a reconciliation of Adjusted EBITDA to cash flows from operating activities is set forth under “Management’s Discussion and Analysis of Financial Results of Operations—Debt Covenants.” References in this prospectus to compound annual growth rate, or CAGR, refer to the growth rate of the item measured over the applicable period as if it had grown at a constant rate on an annually compounded basis. We believe that the presentation of CAGR is useful to investors in assessing growth over time but caution should be taken in reliance on CAGR as a sole measure of growth as it may understate the potential effects of volatility by presenting trends at a steady rate.
Our Company
We are a leading provider of technology-driven communication services. The scale and processing capacity of our proprietary technology platforms, combined with our expertise in managing voice and data transactions, enable us to offer a broad portfolio of services, including conferencing and collaboration, alerts and notifications, emergency communications and business processing outsourcing. Our services provide reliable, high-quality, mission-critical communications designed to maximize return on investment for our clients. Our clients include Fortune 1000 companies, along with small and medium enterprises in a variety of industries, including telecommunications, retail, financial services, public safety, technology and healthcare. We have sales and operations in the United States, Canada, Europe, the Middle East, Asia Pacific and Latin America.
Our focus on large addressable markets with attractive growth characteristics has allowed us to deliver steady, profitable growth. Over the past ten years, we have grown our revenue at a compound annual growth rate (“CAGR”), of 12%, and improved our Adjusted EBITDA margin from 20.7% to 27.3%. For the fiscal year ended December 31, 2011, we grew revenue by 4.3% over 2010 to $2,491.3 million and generated $681.4 million in Adjusted EBITDA, or 27.3% Adjusted EBITDA margin, and $127.5 million in net income and $348.2 million in net cash flows from operating activities.
Evolution into a Predominately Platform-Based Solutions Business
Since our founding in 1986, we have invested significantly to expand our technology platforms and develop our operational processes to meet the complex communications needs of our clients. We have evolved our business mix from labor-intensive communications services to predominantly diversified and platform-based, technology-driven services. As a result, our revenue from platform-based services grew from 37% of total revenue in 2005 to 71% in 2011, and our operating income from platform-based services grew from 53% of total operating income to 91% over the same period.
Since 2005, we have invested approximately $1.9 billion in strategic acquisitions. We have increased our penetration into higher growth international conferencing markets, strengthened our alerts and notifications
1
Table of Contents
services business and established a leadership position in emergency communication services. As technology has advanced, consumers are now able to choose how they prefer to communicate with enterprises. As a result, we have reoriented our business to address the emergence of fast-growing trends such as unified communications (“UC”) products and mobility.
Today, our platform-based service lines include conferencing and event services, alerts and notifications, UC solutions, emergency communications services and our automated customer service platforms such as interactive voice response (“IVR”), natural language speech recognition and network-based call routing services. As we continue to increase the variety of platform-based services we provide, we intend to pursue opportunities in markets where we have strong client relationships and where clients place a premium on the quality of service provided.
The following summaries further highlight the steps we have taken to improve our business:
| — | Developed and Enhanced Large Scale Technology Platforms. Investing in technology and developing specialized expertise in the industries we serve are critical components to our strategy of enhancing our services and delivering operational excellence. Our approximately 662,000 telephony ports, including approximately 303,000 Internet Protocol (“IP”) ports, provide us with what we believe is the only large-scale proprietary IP-based global conferencing platform deployed and in use today. Our acquisitions of TuVox Incorporated (“TuVox”) and Holly Australia Pty Ltd (“Holly”) significantly advanced the development capabilities of our existing platform. The resulting open standards-based platform allows for the flexibility to add new capabilities as our clients demand. In addition, we have integrated mobile, social media and cloud computing capabilities into our platforms and are able to offer those services to our clients. |
| — | Expanded Emergency Communications Services Platform. We have invested significant resources into our emergency communications services. Since 2006, we have made several strategic acquisitions, including Intrado, Inc. (“Intrado”) and Positron Public Safety Systems, which provided us with the leading platform in communication services for public safety. Today, we believe we are one of the largest providers of emergency communications services to telecommunications service providers, government agencies and public safety organizations, based on the number of 9-1-1 calls that we and other participants in the industry facilitate. We have steadily increased our presence in this market through substantial investments in proprietary systems to develop programs designed to upgrade the capabilities of 9-1-1 centers by delivering a broader set of features. |
| — | Expanded Our Unified Communications Business Segment. Through both organic growth and acquisitions, we have been successful in strengthening our unified communications service offering. We have grown our sales force to expand the reach of our conferencing services both domestically and internationally. We have developed and integrated proprietary global and large enterprise-based services into our platform which allow for streamlined, cost-effective conferencing capabilities. With the acquisitions of Stream57 LLC (“Stream57”) and Unisfair, Inc. (“Unisfair”), we have enhanced our event services offerings. We have increased our capabilities in IP-based UC solutions through the acquisitions of SKT Business Communications Solutions division of the Southern Kansas Telephone Company, Inc. (“SKT”) and Smoothstone IP Communciations Corporation (“Smoothstone”). We are able to offer system design, project management and implementation to clients with our sales engineering and integration services. |
We have also increased our presence in the high growth alerts and notifications market. We now provide platform-based communication services across several industries, including financial services, communications, transportation, government and public safety. Additionally, through our acquisitions of TeleVox Software, Inc. and Twenty First Century Communications, Inc. (“TFCC”) we have a strong presence in the medical and dental markets and the electric utilities industry.
2
Table of Contents
Market Opportunity
We are focused on voice and data markets. Consistent with our investment strategy, we have and will continue to target new and complementary markets that leverage our depth of expertise in voice and data services. We believe these markets, including unified communications, emergency communications and alerts and notifications services, are large, have relatively predictable and steady growth, and are characterized by recurring, valuable transactions and strong margin profiles.
Unified Communications
We entered the conferencing and collaboration services market with our acquisition of InterCall in 2003. Through organic growth and multiple strategic acquisitions, we have become the leading global provider of conferencing services since 2008 based on revenue, according to Wainhouse Research. The market for unified communications services, which includes hosted and managed unified communications services, audio, web, video and operator-assisted conferencing was $7.3 billion in 2011 and is expected to grow at a CAGR of 9% through 2015 according to Wainhouse Research.
According to Tern Systems, the market for automated message delivery in the U.S. was over $635 million in 2011, and is expected to grow at an annual growth rate of 21% through 2015. We believe this growth is being driven by a number of factors, including increased globalization of business activity, focus on lower costs, increased adoption of unified communications services, and increasing awareness of the need for rapid communication during emergencies. By leveraging our global sales team and diversified client base, we intend to continue targeting higher growth markets.
Communication Services
The market for emergency communications services represents a highly attractive opportunity, allowing us to diversify into an end-market that we believe is less volatile with respect to downturns in the economy. According to Compass Intelligence, approximately $3.9 billion of government-sponsored funds were estimated to be available for 9-1-1 and Enhanced 9-1-1 (“E9-1-1”) applications, hardware and systems expenditures in 2011 and such funds are expected to grow at a 6.4% CAGR through 2016. Given the critical nature of these systems and services, government agencies and other public safety organizations prioritize funding for such services to ensure dependable delivery. Further, as communities across the U.S. upgrade outdated 9-1-1 systems to next generation 9-1-1 platforms, we believe our suite of services is best suited to capture the demand.
We deliver critical agent-based and automated services for our enterprise clients. Today, the market for these services remains attractive given its size and steady growth characteristics. We target select opportunities within the global customer care business process outsourcing market which was estimated to be approximately $54 billion in 2011 with a projected CAGR through 2015 of approximately 5% according to International Data Corporation (“IDC”). We focus on high-value transactions that utilize our specialized knowledge and scale to drive enhanced profitability. We have built on our leading position in this market by investing in emerging service delivery models that provide a higher quality of service to our clients.
3
Table of Contents
Our Services
We believe we have built our reputation as a best-in-class service provider by delivering differentiated, high-quality services for our clients. Our portfolio of technology-driven communication services includes:
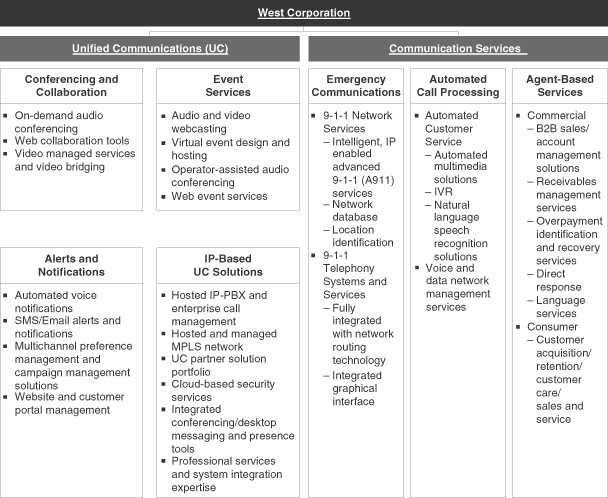
Unified Communications
| — | Conferencing & Collaboration Services. Operating under the InterCall® brand, we are the largest conferencing services provider in the world based on conferencing revenue, according to Wainhouse Research. We managed approximately 121 million conference calls in 2011, a 13 percent increase over 2010. We provide our clients with an integrated global suite of meeting services. These include on-demand audio conferencing services, video managed services and web collaboration tools that allow clients to make presentations and share applications and documents over the Internet. |
| — | Event Services. InterCall offers an event services team to help clients who would like extra assistance planning, conducting and gathering report information for large scale or high-value meetings or conferences. Event services include audio and video webcasting services, virtual event design and hosting operator-assisted audio conferencing and web event services. |
4
Table of Contents
| — | Alerts & Notifications Services. Our technology platforms allow clients to manage and deliver automated, proactive and personalized communications. We use multiple delivery channels (voice, text messaging, email, social media and fax) based on the preference of the recipient. For example, we deliver patient notifications, send and confirm appointments and prescription reminders on behalf of our healthcare clients, provide travelers with flight arrival and departure updates on behalf of our transportation clients, send and receive automated outage notifications on behalf of our utility clients and transmit emergency evacuation notices on behalf of municipalities. Our scalable platform enables a high volume of messages to be sent in a short amount of time. Our platform also enables two-way communication which allows the recipients of a message to respond with relevant information to our clients. |
| — | IP-Based Unified Communications Solutions. We provide our clients with enterprise class IP-based communications solutions enabled by our technology. We offer hosted IP-private branch exchange (“PBX”) and enterprise call management, hosted and managed multi-protocol label switching (“MPLS”) network solutions, unified communications partner solution portfolio services, cloud-based security services, integrated conferencing/desktop messaging and presence tools, and professional services and systems integration expertise. |
Communication Services
| — | Emergency Communications Services. We believe we are one of the largest providers of emergency communications services, based on the number of 9-1-1 calls that we and other participants in the industry facilitate. Our services are critical in facilitating public safety agencies’ ability to receive emergency calls from citizens. Our clients generally enter into long-term contracts and fund their obligations through monthly charges on users’ telephone bills. |
| — | Automated Call Processing. We believe we have developed a best-in-class automated customer service platform. Our services allow our clients to effectively communicate with their customers through inbound and outbound IVR applications using natural language speech recognition, automated voice prompts and network-based call routing services. In addition to these front-end customer service applications, we also provide analyses that help our clients improve their automated communications strategy. Our open standards-based platform allows the flexibility to integrate new capabilities such as mobility, social media and cloud-based services. |
| — | Agent-Based Services. We provide our clients with large-scale, agent-based services, including inbound customer care, customer retention, business-to-business, account management, receivables management, overpayment identification and recovery solutions, as well as direct response and language services. We target opportunities to provide our agent-based services as part of larger strategic client engagements and with clients for whom these services can add value. We believe that we are known in the industry as a premium provider of these services. We have a flexible model that offers on-shore, off-shore and virtual home-based capabilities to fit our clients’ needs. |
5
Table of Contents
Our Competitive Strengths
We have developed expertise to serve the needs of clients who place a premium on the services we provide. We believe the following strengths have helped us to establish a leading competitive position in the markets we serve and enable us to deliver operational excellence to clients.
| — | Broad Portfolio of Product Offerings with Attractive Value Proposition. Our technology platforms combined with our operational expertise and processes allow us to provide a broad range of service offerings for our clients. Our ability to efficiently and cost-effectively process high volume, complex voice and data transactions for our clients facilitates their critical communications and helps improve their cost structure. |
| — | Robust Technology Capabilities Enable Scalable Operating Model. Our strengths across technology and multiple channels allow us to process data and communications transactions for our clients. We cross-utilize our assets and shared service platforms across our businesses, providing scale and flexibility to handle greater transaction volume, offer superior service and develop new offerings more effectively and efficiently. We foster a culture of innovation and have been issued approximately 172 patents and have approximately 349 pending patent applications for technology and processes that we have developed. We continue to invest in new platform technologies, including IP-based cloud computing environments, as well as to enhance our portfolio with patented technologies, which allow us to deliver premium services to our clients. |
| — | Strong Client Relationships. We have built long-lasting relationships with our clients who operate in a broad range of industries, including telecommunications, retail, financial services, public safety, technology and healthcare. Our top ten clients by revenue in 2011 had an average tenure with us of over 11 years. In 2011, our 100 largest clients by revenue represented approximately 55% of our revenue and approximately 45% of our revenue came from clients purchasing multiple service offerings. |
| — | Operational Excellence. We increase productivity and performance for our clients by leveraging our expertise to efficiently deliver communications services. Our ability to improve these processes for our clients is an important aspect of our value proposition. We leverage our proprietary technology infrastructure and shared services platforms to manage higher value transactions and achieve cost savings for our clients and ourselves. |
| — | Experienced Management Team with Track Record of Growth. Our senior leadership has an average tenure of approximately 13 years with us and has delivered strong results through various market cycles, both as a public and a private company. As a group, this team has created a culture of superior client service and, through acquisitions and organic growth, has been able to achieve a 12% revenue CAGR over the past ten years. Our team has established a long track record of successfully acquiring and integrating companies to drive growth. |
As demand for outsourced services grows with greater adoption of our technologies and services and the global trend toward business process outsourcing, we believe our long history of delivering results for our clients combined with our scale and the investments we have made in our businesses provide us with a significant competitive advantage.
Our Growth Strategy
Our strategy is to identify growing markets where we can deploy our existing assets and expertise to strengthen our competitive position. Our strategy is supported by our commitment to superior client service, operational excellence and market leadership. Key aspects of our strategy include the following:
| — | Expand Relationships with Existing Clients. We are focused on deepening and expanding relationships with our existing clients by delivering value in the form of reduced costs, improved |
6
Table of Contents
| customer relationships and enhanced revenue opportunities. Approximately 45% of our revenue in 2011 came from clients purchasing multiple service offerings from us. As we demonstrate the value that our services provide, often starting with a single service, we are frequently able to expand the size and scope of our client relationships. |
| — | Develop New Client Relationships. We will continue to focus on building long-term client relationships across a wide range of industries to further diversify our revenue base. We target clients in industries in which we have expertise or other competitive advantages and an ability to deliver a wide range of solutions that have a meaningful impact on their business. By continuing to add new long-term client relationships in large and growing markets, we believe we enhance the stability and growth potential of our revenue base. |
| — | Capitalize on Select Global Opportunities. In addition to expanding and enhancing our existing relationships domestically, we will selectively pursue new client opportunities globally. Our expertise in conferencing and collaboration services has allowed us to penetrate substantial new international markets. In 2011, 19% of our consolidated revenue was generated outside of the U.S. Given the attractive growth dynamics within Europe, Asia-Pacific and Latin America, we intend to further grow our unified communications business in these regions. Our distribution capabilities, including over 375 dedicated international Unified Communications sales personnel, provide us with the platform to drive incremental revenue opportunities. |
| — | Continue to Enhance Leading Technology Capabilities. We believe our service offerings are enhanced by our superior, patented technology capabilities and track record of innovation, and we will continue to target services that enable our clients to realize significant benefits. In addition to strengthening our client relationships, we believe our focus on technology facilitates our ongoing evolution toward a diversified, predominantly platform-based and technology-driven operating model. |
| — | Continue to Enhance Our Value Proposition Through Selective Acquisitions. Since our founding in 1986, we have completed 29 acquisitions of businesses and technologies with a total value of approximately $2.7 billion. We will continue to expand our suite of communications services across industries, geographies and end-markets. While we expect this will occur primarily through organic growth, we have and expect to continue to acquire assets and businesses that strengthen our value proposition to clients and drive value to us. We have developed an internal capability to source, evaluate and integrate acquisitions that we believe has created value for shareholders. |
Risk Factors
Our business is subject to numerous risks and uncertainties, as more fully described under “Risk Factors,” which you should carefully consider prior to deciding whether to invest in our common stock. For example,
| • | we may not be able to compete successfully in our highly competitive industries, which could adversely affect our business, results of operations and financial condition; |
| • | increases in the cost of voice and data services or significant interruptions in these services could adversely affect our business, results of operations and financial condition; |
| • | we may not be able to generate sufficient cash to service all of our indebtedness and fund our other liquidity needs; |
| • | our business depends on our ability to keep pace with our clients’ needs for rapid technological change and systems availability; |
| • | a large portion of our revenue is generated from a limited number of clients, and the loss of one or more key clients would result in the loss of revenue; |
7
Table of Contents
| • | global economic conditions could adversely affect our business, results of operations and financial condition, primarily through disrupting our clients’ businesses; |
| • | potential future impairments of our substantial goodwill, intangible assets, or other long-lived assets could adversely affect our business, results of operations and financial condition; |
| • | we had a negative net worth as of December 31, 2011, which may make it more difficult and costly for us to obtain financing in the future and may otherwise negatively impact our business; |
| • | we may be affected by existing and future litigation and regulatory restrictions; |
| • | we may be unable to protect the personal data of our clients’ customers or our own proprietary technology; |
| • | our foreign operations subject us to risks inherent in conducting business internationally, including those related to political, economic and other conditions as well as foreign exchange rates; and |
| • | we may not be able to successfully identify or integrate recent and future acquisitions. |
Corporate Information
We are a Delaware corporation that was founded in 1986. On October 24, 2006, we completed a recapitalization (the “Recapitalization”) of the Company in a transaction sponsored by an investor group led by Thomas H. Lee Partners, L.P. and Quadrangle Group LLC (the “Sponsors”) pursuant to the Agreement and Plan of Merger, dated as of May 31, 2006, between us and Omaha Acquisition Corp., a Delaware corporation formed by the Sponsors for the purpose of our recapitalization. Pursuant to the recapitalization, Omaha Acquisition Corp. was merged with and into West Corporation, with West Corporation continuing as the surviving corporation, and our publicly traded securities were cancelled in exchange for cash.
We financed the recapitalization with equity contributions from the Sponsors and the rollover of a portion of our equity interests held by Gary and Mary West, the founders of West, and certain members of management, along with a senior secured term loan facility, a senior secured revolving credit facility and the private placement of senior notes and senior subordinated notes.
Our principal executive offices are located at 11808 Miracle Hills Drive, Omaha, Nebraska 68154 and our telephone number at that address is (402) 963-1200. Our website address is www.west.com where our Annual Report on Form 10-K, Quarterly Reports on Form 10-Q, Current Reports on Form 8-K and all amendments to those reports are available without charge, as soon as reasonably practicable following the time they are filed with or furnished to the SEC. None of the information on our website or any other website identified herein is part of this prospectus. All website addresses in this prospectus are intended to be inactive textual references only.
8
Table of Contents
The Offering
| Common stock offered by us |
shares |
| Common stock offered by selling stockholders |
shares |
| Common stock to be outstanding after this offering |
shares
shares |
| Use of proceeds |
We intend to use the net proceeds from this offering to repay indebtedness, to fund amounts payable to the Sponsors upon the termination of our management agreement and for working capital and other general corporate purposes. See “Use of Proceeds.” |
| We will not receive any proceeds from the shares sold by the selling stockholders. |
| Principal Stockholders |
Upon completion of this offering, investment funds associated with the Sponsors will own a controlling interest in us. As a result, we currently intend to avail ourselves of the controlled company exemption under the Nasdaq Marketplace Rules. For more information, see “Management—Board Structure and Committee Composition.” |
| Risk factors |
You should read carefully the “Risk Factors” section of this prospectus for a discussion of factors that you should consider before deciding to invest in shares of our common stock. |
| Proposed Nasdaq Global Select Market symbol |
“WSTC” |
The number of shares of our common stock to be outstanding following this offering is based on shares of our common stock outstanding as of , 2012, but excludes:
| • | shares of common stock issuable upon exercise of options outstanding as of , 2012 at a weighted average exercise price of $ per share; |
| • | shares of common stock reserved for future issuance under our 2012 Employee Stock Purchase Plan; and |
| • | shares of common stock reserved for future issuance under our stock-based compensation plans, including shares of common stock reserved for issuance under our 2012 Long-Term Incentive Plan, which will become effective on the date of this prospectus, and shares of common stock reserved for issuance under our Nonqualified Deferred Compensation Plan. |
Unless otherwise indicated, this prospectus reflects and assumes the following:
| • | the effectiveness of a for split of our common stock; and |
| • | no exercise by the underwriters of their option to purchase up to additional shares. |
9
Table of Contents
The following table shows the proceeds that each of our Sponsors, directors and executive officers are expected to receive in connection with the offering based on an assumed initial public offering price of $ per share, the mid-point of the range set forth on the cover of this prospectus, and after deducting the underwriting discounts and commissions as well as their respective holdings following the offering:
| Name |
Shares held following Offering |
Cash proceeds from Offering (3) | ||
| Sponsors |
||||
| Thomas H. Lee Funds(1) |
||||
| Quadrangle Group Funds(2) |
||||
| Directors and Executive Officers |
||||
| Thomas B. Barker |
||||
| Anthony J. DiNovi(4) |
||||
| Steven G. Felsher(4) |
||||
| Soren L. Oberg(4) |
||||
| Jeff T. Swenson(4) |
||||
| Nancee R. Berger |
||||
| Mark V. Lavin |
||||
| Paul M. Mendlik |
||||
| David C. Mussman |
||||
| Steven M. Stangl |
||||
| Todd Strubbe |
||||
| David J. Treinen |
||||
| (1) | Includes Thomas H. Lee Equity Fund VI, L.P.; Thomas H. Lee Parallel Fund VI, L.P.; THL Equity Fund VI Investors (West), L.P.; Thomas H. Lee Parallel (DT) Fund VI, L.P.; THL Coinvestment Partners, L.P.; and THL Equity Fund VI Investors (West) HL, L.P. (collectively, the “THL Investors”); Putnam Investment Holdings, LLC; and Putnam Investments Employees’ Securities Company III LLC. |
| (2) | Includes Quadrangle Capital Partners II LP; Quadrangle Select Partners II LP; and Quadrangle Capital Partners II-A LP (collectively, the “Quadrangle Investors”). |
| (3) | Includes a payment of approximately $ million to the THL Investors and $ million to the Quadrangle Investors in connection with the termination of a management agreement. See “Certain Relationships and Related Party Transactions—Transactions Since the Recapitalization—Management Agreement.” |
| (4) | Each of Mr. DiNovi, Mr. Felsher, Mr. Oberg and Mr. Swenson is affiliated with a Sponsor. With respect to each such director, the amounts shown include shares of common stock held or cash proceeds received by the Sponsor with which such director is affiliated. Each such director has a pecuniary interest in shares of common stock held by, and cash proceeds received by, the Sponsor with which such director is affiliated. |
10
Table of Contents
Related Party Payments
The following table sets forth total value of equity awards granted or vested in connection with this offering based on an assumed initial public offering price of $ per share, the mid-point of the range set forth on the cover page of this prospectus:
| Executive Officer |
Value of Equity Awards Granted or Vested | |
| Thomas B. Barker |
||
| Nancee R. Berger |
||
| Mark V. Lavin |
||
| Paul M. Mendlik |
||
| David C. Mussman |
||
| Steven M. Stangl |
||
| Todd Strubbe |
||
| David J. Treinen |
Upon the completion of this offering, approximately $ million will be paid to the THL Investors and approximately $ million will be paid to the Quadrangle Investors pursuant to existing agreements with such parties. See “Use of Proceeds” and “Certain Relationships and Related Party Transactions—Transactions Since the Recapitalization—Management Agreement.”
11
Table of Contents
SUMMARY CONSOLIDATED FINANCIAL DATA
The following tables summarize the consolidated financial data for our business as of the dates and for the periods presented. Our historical results are not necessarily indicative of future operating results. You should read this summary consolidated financial data in conjunction with the sections titled “Selected Consolidated Financial Data” and “Management’s Discussion and Analysis of Financial Condition and Results of Operations” and our consolidated financial statements and related notes, all included elsewhere in this prospectus.
| Year Ended December 31, | ||||||||||||
| 2009 | 2010 | 2011 | ||||||||||
| (in millions, except per share amounts) | ||||||||||||
| Consolidated Statement of Operations Data: |
||||||||||||
| Revenue |
$ | 2,375.7 | $ | 2,388.2 | |
2,491.3 |
| |||||
| Cost of services |
1,067.8 | 1,057.0 | |
1,113.3 |
| |||||||
| Selling, general and administrative expenses |
907.3 | 911.0 | 909.9 | |||||||||
|
|
|
|
|
|
|
|||||||
| Operating income |
400.6 | 420.2 | 468.1 | |||||||||
| Interest expense |
(254.1 | ) | (252.7 | ) | |
(269.9 |
) | |||||
| Refinancing expense |
— | (52.8 | ) | — | ||||||||
| Other income (expense) |
1.4 | 6.1 | |
6.3 |
| |||||||
|
|
|
|
|
|
|
|||||||
| Income before income tax expense |
147.9 | 120.8 | |
204.5 |
| |||||||
| Income tax expense |
56.9 | 60.5 | |
77.0 |
| |||||||
|
|
|
|
|
|
|
|||||||
| Net income |
91.0 | 60.3 | |
127.5 |
| |||||||
| Less net income (loss)—noncontrolling interest |
2.8 | — | |
— |
| |||||||
|
|
|
|
|
|
|
|||||||
| Net income—West Corporation |
$ | 88.2 | $ | 60.3 | |
127.5 |
| |||||
|
|
|
|
|
|
|
|||||||
| Earnings (loss) per common share: |
||||||||||||
| Basic Class L shares |
$ | 17.45 | $ | 17.07 | $ | 17.18 | ||||||
| Diluted Class L shares |
$ | 16.67 | $ | 16.37 | $ | 16.48 | ||||||
| Basic Common |
$ | (0.98 | ) | $ | (1.25 | ) | $ | (0.50 | ) | |||
| Diluted Common |
$ | (0.98 | ) | $ | (1.25 | ) | $ | (0.50 | ) | |||
| Year Ended December 31, | ||||||||||||
| 2009 | 2010 | 2011 | ||||||||||
| (dollars in millions) | ||||||||||||
| Selected Other Data: |
||||||||||||
| Net cash flows from operating activities |
$ | 272.9 | $ | 312.8 | |
348.2 |
| |||||
| Net cash flows used in investing activities |
(112.6 | ) | (137.9 | ) | |
(329.4 |
) | |||||
| Net cash flows used in financing activities |
(271.8 | ) | (133.7 | ) | |
(23.2 |
) | |||||
| Capital expenditures |
122.7 | 122.0 | 120.1 | |||||||||
| Adjusted EBITDA(1) |
647.9 | 654.7 | |
681.4 |
| |||||||
| Adjusted EBITDA margin(2) |
27.3 | % | 27.4 | % | |
27.3 |
% | |||||
| As of December 31, 2011 | ||||||
| Actual | Pro Forma
As Adjusted(3) | |||||
| (in millions) | ||||||
| Consolidated Balance Sheet Data: |
||||||
| Cash and cash equivalents |
$ | 93.8 | ||||
| Working capital |
$ | 203.5 | ||||
| Total assets |
$ | 3,227.5 | ||||
| Long-term debt, net of current portion |
$ | 3,500.9 | ||||
| Total stockholders’ deficit |
$ | (896.4 | ) | |||
12
Table of Contents
| (1) | The term “EBITDA” refers to earnings before interest expense, taxes, depreciation and amortization, and the term “Adjusted EBITDA” refers to earnings before interest expense, share based compensation, taxes, depreciation and amortization, non-recurring litigation settlement costs, impairments and other non-cash reserves, transaction costs and after-acquisition synergies. We present Adjusted EBITDA because our management team uses it as an important supplemental measure in evaluating our operating performance and preparing internal forecasts and budgets, and we believe it is frequently used by securities analysts, investors and other interested parties in the evaluation of companies in our industry. We also use Adjusted EBITDA as a liquidity measure in assessing compliance with our senior credit facilities. For a reconciliation of Adjusted EBITDA to cash flows from operating activities and a description of the material covenants contained in our senior credit facilities, see “Management’s Discussion and Analysis of Financial Condition and Results of Operations—Liquidity and Capital Resources—Debt Covenants.” We believe that the presentation of Adjusted EBITDA is useful because it provides important insight into our profitability trends and allows management and investors to analyze operating results with and without the impact of certain non-cash charges, such as depreciation and amortization, share-based compensation and impairments and other non-cash reserves, as well as certain litigation settlement and transaction costs and after-acquisition synergies. Although we use Adjusted EBITDA as a financial measure to assess the performance of our business and as a measure of our liquidity, Adjusted EBITDA is not a measure of financial performance or liquidity under generally accepted accounting principles (“GAAP”) and the use of Adjusted EBITDA is limited because it does not include certain material costs, such as depreciation, amortization and interest, necessary to operate our business and includes adjustments for synergies that have not been realized. In addition, as disclosed below, certain adjustments included in our calculation of Adjusted EBITDA are based on management’s estimates and do not reflect actual results. For example, post-acquisition synergies included in Adjusted EBITDA are determined in accordance with our senior credit facilities, which provide for an adjustment to EBITDA, subject to certain specified limitations, for reasonably identifiable and factually supportable cost savings projected by us in good faith to be realized as a result of actions taken following an acquisition. While we use net income as a measure of performance, we also believe that Adjusted EBITDA, when presented along with net income, provides balanced disclosure which, for the reasons set forth above, is useful to investors and management in evaluating our operating performance and profitability. Adjusted EBITDA included in this prospectus should be considered in addition to, and not as a substitute for, net income (loss) as calculated in accordance with GAAP as a measure of performance. Adjusted EBITDA, as presented, may not be comparable to similarly titled measures of other companies. Set forth below is a reconciliation of Adjusted EBITDA to net income. |
13
Table of Contents
(continued)
| Year Ended December 31, | ||||||||||||
| 2009 | 2010 | 2011 | ||||||||||
| (in millions) |
||||||||||||
| Net income |
$ | 91.0 | $ | 60.3 | $ | 127.5 | ||||||
| Interest expense and other financing charges |
254.1 | 252.7 | 272.4 | |||||||||
| Depreciation and amortization |
188.3 | 170.3 | 171.9 | |||||||||
| Income tax expense |
56.9 | 60.5 | 77.0 | |||||||||
| Goodwill impairment |
— | 37.7 | — | |||||||||
| Refinancing expense |
— | 52.8 | — | |||||||||
| Provision for share-based compensation |
3.8 | 4.2 | 23.3 | |||||||||
| Acquisition synergies and transaction costs(a) |
18.0 | |
5.1 |
|
|
14.3 |
| |||||
| Non-cash portfolio impairments(b) |
25.5 | — | — | |||||||||
| Site closure and other impairments(c) |
6.9 | 6.4 | 2.2 | |||||||||
| Non-cash foreign currency (gain) loss(d) |
(0.2 | ) | 1.2 | (6.4 | ) | |||||||
| Litigation settlement costs(e) |
3.6 | 3.5 | (0.8 | ) | ||||||||
|
|
|
|
|
|
|
|||||||
| Adjusted EBITDA(f) |
$ | 647.9 | $ | 654.7 | 681.4 | |||||||
|
|
|
|
|
|
|
|||||||
| (a) | Represents, for each period presented, unrealized synergies for acquisitions, consisting primarily of headcount reductions and telephony-related savings, direct acquisition expenses, transaction costs incurred with the recapitalization and the exclusion of the negative EBITDA in one acquired entity, which was an unrestricted subsidiary under the indentures governing our outstanding notes. Amounts shown are permitted to be added to “EBITDA” for purposes of calculating our compliance with certain covenants under our credit facility and the indentures governing our outstanding notes. |
| (b) | Represents non-cash portfolio receivable allowances. |
| (c) | Represents site closures and other asset impairments. |
| (d) | Represents the unrealized loss (gain) on foreign denominated debt and the loss on transactions with affiliates denominated in foreign currencies. |
| (e) | Represents litigation settlements, net of estimated insurance proceeds, and related legal costs. |
| (f) | Adjusted EBITDA does not include pro forma adjustments for acquired entities of $3.9 in 2011, $(0.1) million in 2010 and $2.0 million in 2009 as is permitted in our debt covenants. |
| (2) | Represents Adjusted EBITDA as a percentage of revenue. |
| (3) | The pro forma as adjusted column gives effect to the sale of shares of common stock in this offering, at an assumed initial public offering price of $ per share, the mid-point of the range set forth on the cover of this prospectus, and after deducting estimated underwriting discounts and commissions and offering expenses payable by us and the application of our net proceeds from this offering. |
14
Table of Contents
Investing in our common stock involves substantial risks. In addition to the other information in this prospectus, you should carefully consider the following factors before investing in our common stock. Any of the risk factors we describe below could adversely affect our business, financial condition or results of operations. The market price of our common stock could decline if one or more of these risks and uncertainties actually occurs, causing you to lose all or part of the money you paid to buy our shares. Certain statements in “Risk Factors” are forward-looking statements. See “Special Note Regarding Forward-Looking Statements” elsewhere in this prospectus.
Risks Related to Our Business
We may not be able to compete successfully in our highly competitive industries, which could adversely affect our business, results of operations and financial condition.
We face significant competition in many of the markets in which we do business and expect that this competition will intensify. The principal competitive factors in our business are range of service offerings, global capabilities and price and quality of services. In addition, we believe there has been an industry trend to move agent-based operations toward offshore sites. This movement could result in excess capacity in the United States, where most of our current capacity exists. The trend toward international expansion by foreign and domestic competitors and continuous technological changes may erode profits by bringing new competitors into our markets and reducing prices. Our competitors’ products, services and pricing practices, as well as the timing and circumstances of the entry of additional competitors into our markets, could adversely affect our business, results of operations and financial condition.
Our Unified Communications segment faces technological advances, which have contributed to pricing pressures. Competition in the web and video conferencing services arenas continues to increase as new vendors enter the marketplace and offer a broader range of conferencing solutions through new technologies, including, without limitation, VoIP, on-premise solutions, PBX solutions, unified communications solutions and equipment and handset solutions.
Our Communication Services segment’s agent-based business and growth depend in large part on United States businesses automating and outsourcing call handling activities. Such automation and outsourcing may not continue, or may continue at a slower pace, as organizations may elect to perform these services themselves. In addition, our Communication Services segment faces risks from technological advances that we may not be able to successfully address. We compete with third-party collection agencies, other financial service companies and credit originators. Some of these companies have substantially greater personnel and financial resources than we do. In addition, companies with greater financial resources than we have may elect in the future to enter the consumer debt collection business.
There are services in both of our business segments that are experiencing pricing declines. If we are unable to offset pricing declines through increased transaction volume and greater efficiency, our business, results of operations and financial condition could be adversely affected.
Increases in the cost of voice and data services or significant interruptions in these services could adversely affect our business, results of operations and financial condition.
We depend on voice and data services provided by various telecommunications providers. Because of this dependence, any change to the telecommunications market that would disrupt these services or limit our ability to obtain services at favorable rates could adversely affect our business, results of operations and financial condition. While we have entered into long-term contracts with many of our telecommunications providers, there is no obligation for these vendors to renew their contracts with us or to offer the same or lower rates in the future. In addition, these contracts are subject to termination or modification for various reasons outside of our control.
15
Table of Contents
An adverse change in the pricing of voice and data services that we are unable to recover through price increases of our services, or any significant interruption in voice or data services, could adversely affect our business, results of operations and financial condition.
Our business depends on our ability to keep pace with our clients’ needs for rapid technological change and systems availability.
Technology is a critical component of our business. We have invested in sophisticated and specialized computer and telephone technology and we anticipate that it will be necessary for us to continue to select, invest in and develop new and enhanced technology on a timely basis in the future in order to remain competitive. Our future success depends in part on our ability to continue to develop technology solutions that keep pace with evolving industry standards and changing client demands. Introduction of new methods and technologies brings corresponding risks associated with effecting change to a complex operating environment and, in the case of adding third party services, results in a dependency on an outside technology provider.
Growth in our IP-Based UC Solutions and Emergency Communications businesses depends in large part on continued deployment and adoption of emerging technologies.
Growth in our IP-based UC Solutions business and our next generation 9-1-1 solution offering is largely dependent on customer acceptance of communications services over IP-based networks, which is still in its early stages. Continued growth depends on a number of factors outside of our control. Customers may delay adoption and deployment of IP-based UC Solutions for several reasons, including available capacity on legacy networks, internal commitment to in-house solutions and customer attitudes regarding security, reliability and portability of IP-based solutions. In the Emergency Communications business, adoption may be hindered by, among other factors, continued reliance by customers on legacy systems, the complexity of implementing new systems and budgetary constraints. If customers do not deploy and adopt IP-based network solutions at the rates we expect, for these or other reasons, our business results of operations and financial condition could be adversely affected.
A large portion of our revenue is generated from a limited number of clients, and the loss of one or more key clients would result in the loss of revenue.
Our 100 largest clients by revenue represented approximately 55% of our total revenue for the year ended December 31, 2011 with one client, AT&T, accounting for approximately 10% of our total revenue. Subject to advance notice requirements and a specified wind down of purchases, AT&T may terminate certain of its contracts with us with or without cause at any time. If we fail to retain a significant amount of business from AT&T or any of our other significant clients, our business, results of operations and financial condition could be adversely affected.
We serve clients and industries that have experienced a significant level of consolidation in recent years. Additional consolidation could occur in which our clients could be acquired by companies that do not use our services. The loss of any significant client would result in a decrease in our revenue and could adversely affect our business, results of operations and financial condition.
Global economic conditions could adversely affect our business, results of operations and financial condition, primarily through disrupting our clients’ businesses.
Uncertain and changing global economic conditions, including disruption of financial markets, could adversely affect our business, results of operations and financial condition, primarily through disruptions of our clients’ businesses. Higher rates of unemployment and lower levels of business generally adversely affect the level of demand for certain of our services. In addition, continuation or worsening of general market conditions in the United States, Europe or other markets important to our businesses may adversely affect our clients’ level of spending, ability to obtain financing for purchases and ability to make timely payments to us for our services, which could require us to increase our allowance for doubtful accounts, negatively impact our days sales outstanding and adversely affect our results of operations.
16
Table of Contents
Our contracts generally are not exclusive and typically do not provide for revenue commitments.
Contracts for many of our services generally enable our clients to unilaterally terminate the contract or reduce transaction volumes upon written notice and without penalty, in many cases based on our failure to attain certain service performance levels. The terms of these contracts are often also subject to renegotiation at any time. In addition, most of our contracts are not exclusive and do not ensure that we will generate a minimum level of revenue. Many of our clients also retain multiple service providers with whom we must compete. As a result, the profitability of each client program may fluctuate, sometimes significantly, throughout the various stages of a program.
Security and privacy breaches of the systems we use to protect personal data could adversely affect our business, results of operations and financial condition.
Our databases contain personal data of our clients’ customers, including credit card and healthcare information. Any security or privacy breach of these databases could expose us to liability, increase our expenses relating to the resolution of these breaches and deter our clients from selecting our services. Certain of our client contracts do not contractually limit our liability for the loss of confidential information. Migration of our emergency communications business to IP-based communication increases this risk. Our data security procedures may not effectively counter evolving security risks, address the security and privacy concerns of existing or potential clients or be compliant with federal, state, and local laws and regulations in all respects. For our international operations, we are obligated to implement processes and procedures to comply with local data privacy regulations. Any failures in our security and privacy measures could adversely affect our business, financial condition and results of operations.
Pending and future litigation may divert management’s time and attention and result in substantial costs of defense, damages or settlement, which could adversely affect our business, results of operations and financial condition.
We face uncertainties related to pending and potential litigation. We may not ultimately prevail or otherwise be able to satisfactorily resolve this litigation. In addition, other material suits by individuals or certified classes, claims, or investigations relating to our business may arise in the future. Furthermore, we generally indemnify our clients against third-party claims asserting intellectual property violations, which may result in litigation. Regardless of the outcome of any of these lawsuits or any future actions, claims or investigations relating to the same or any other subject matter, we may incur substantial defense costs and these actions may cause a diversion of management’s time and attention. Also, we may be required to alter our business practices or pay substantial damages or settlement costs as a result of these proceedings, which could adversely affect our business, results of operations and financial condition. Finally, certain of the outcomes of such litigation may directly affect our business model, and thus our profitability.
Our technology and services may infringe upon the intellectual property rights of others. Intellectual property infringement claims would be time-consuming and expensive to defend and may result in limitations on our ability to use the intellectual property subject to these claims.
Third parties have asserted in the past and may assert claims against us in the future alleging that we are violating or infringing upon their intellectual property rights. Any claims and any resulting litigation could subject us to significant liability for damages. An adverse determination in any litigation of this type could require us to design around a third party’s patent, license alternative technology from another party or reduce or modify our product and service offerings. In addition, litigation is time-consuming and expensive to defend and could result in the diversion of our time and resources. Any claims from third parties may also result in limitations on our ability to use the intellectual property subject to these claims.
17
Table of Contents
We are subject to extensive regulation, which could limit or restrict our activities and impose financial requirements or limitations on the conduct of our business.
The United States Congress, the Federal Communications Commission (“FCC”) and the states and foreign jurisdictions where we provide services have promulgated and enacted rules and laws that govern personal privacy, the provision of telecommunication services, telephone solicitations, the collection of consumer debt, the provision of emergency communication services and data privacy. As a result, we may be subject to proceedings alleging violation of these rules and laws in the future. Additional rules and laws may require us to modify our operations or service offerings in order to meet our clients’ service requirements effectively, and these regulations may limit our activities or significantly increase the cost of regulatory compliance.
There are numerous state statutes and regulations governing telemarketing activities that do or may apply to us. For example, some states place restrictions on the methods and timing of telemarketing calls and require that certain mandatory disclosures be made during the course of a telemarketing call. Some states also require that telemarketers register in the state before conducting telemarketing business in the state. Such registration can be time consuming and costly. We specifically train our marketing representatives to handle calls in an approved manner. While we believe we are in compliance in all material respects with all federal and state telemarketing regulations, compliance with all such requirements is costly and time consuming. In addition, notwithstanding our compliance efforts, any failure on our part to comply with the registration and other legal requirements applicable to companies engaged in telemarketing activities could have an adverse impact on our business. We could become subject to litigation by private parties and governmental bodies alleging a violation of applicable laws or regulations, which could result in damages, regulatory fines, penalties and possible other relief under such laws and regulations and the accompanying costs and uncertainties of such litigation and enforcement actions.
We may not be able to adequately protect our proprietary information or technology.
Our success depends in part upon our proprietary information and technology. We rely on a combination of copyright, patent, trademark and trade secret laws, as well as on confidentiality procedures and non-compete agreements, to establish and protect our proprietary rights in each of our businesses. Third parties may infringe or misappropriate our patents, trademarks, trade names, trade secrets or other intellectual property rights, which could adversely affect our business, results of operations and financial condition, and litigation may be necessary to enforce our intellectual property rights, protect our trade secrets or determine the validity and scope of the proprietary rights of others. The steps we have taken to deter misappropriation of our proprietary information and technology or client data may be insufficient to protect us, and we may be unable to prevent infringement of our intellectual property rights or misappropriation of our proprietary information. Any infringement or misappropriation could harm any competitive advantage we currently derive or may derive from our proprietary rights. In addition, because we operate in many foreign jurisdictions, we may not be able to protect our intellectual property in the foreign jurisdictions in which we operate.
Our data and operation centers are exposed to service interruption, which could adversely affect our business, results of operations and financial condition.
Our outsourcing operations depend on our ability to protect our data and operation centers against damage that may be caused by fire, natural disasters, pandemics, power failure, telecommunications failures, computer viruses, Trojan horses, other malware, failures of our software, acts of sabotage or terrorism, riots and other emergencies. In addition, for some of our services, we are dependent on outside vendors and suppliers who may be similarly affected. In the past, natural disasters such as hurricanes have caused significant employee dislocation and turnover in the areas impacted. If we experience temporary or permanent employee dislocation or interruption at one or more of our data or operation centers through casualty, operating malfunction, data loss, system failure or other events, we may be unable to provide the services we are contractually obligated to deliver. As a result, we may experience a reduction in revenue or be required to pay contractual damages to some clients or allow some clients to terminate or renegotiate their contracts. Failure of our infrastructure due to the occurrence of a single event may have a disproportionately large impact on our business results. Any
18
Table of Contents
interruptions of this type could result in a prolonged interruption in our ability to provide our services to our clients, and our business interruption and property insurance may not adequately compensate us for any losses we may incur. These interruptions could adversely affect our business, results of operations and financial condition.
Our future success depends on our ability to retain key personnel. Our inability to continue to attract and retain a sufficient number of qualified employees could adversely affect our business, results of operations and financial condition.
Our future success depends on the experience and continuing efforts and abilities of our management team and on the management teams of our operating subsidiaries. The loss of the services of one or more of these key employees could adversely affect our business, results of operations and financial condition. A large portion of our operations also require specially trained employees. From time to time, we must recruit and train qualified personnel at an accelerated rate in order to keep pace with our clients’ demands and our resulting need for specially trained employees. If we are unable to continue to hire, train and retain a sufficient labor force of qualified employees, our business, results of operations and financial condition could be adversely affected.
Increases in labor costs as a result of state and federal laws and regulations, market conditions or turnover rates could adversely affect our business, results of operations and financial condition.
Portions of our Communication Services segment’s agent-based services are very labor intensive and experience high personnel turnover. Significant increases in the employee turnover rate could increase recruiting and training costs and decrease operating effectiveness and productivity. In addition, increases in our labor costs, costs of employee benefits or employment taxes could adversely affect our business, results of operations and financial condition. In particular, the implementation of the recently enacted Patient Protection and Affordable Care Act and the amendments thereto contain provisions relating to mandatory minimum health insurance coverage for employees which could materially impact our future healthcare costs for our predominantly United States-based workforce. While the legislation’s ultimate impact is not yet known, it is possible that these changes could significantly increase our compensation costs. In addition, many of our employees are hired on a part-time basis, and a significant portion of our costs consists of wages to hourly workers. In July 2009, the federal minimum wage rate increased to $7.25 per hour. Further increases in the minimum wage or labor regulation could increase our labor costs.
Because we have operations in countries outside of the United States, we may be subject to political, economic and other conditions affecting these countries that could result in increased operating expenses and regulation.
We operate or rely upon businesses in numerous countries outside the United States. We may expand further into additional countries and regions. There are risks inherent in conducting business internationally, including the following:
| • | difficulties in staffing and managing international operations; |
| • | accounting (including managing internal control over financial reporting in our non-U.S. subsidiaries), tax and legal complexities arising from international operations; |
| • | burdensome regulatory requirements and unexpected changes in these requirements, including data protection requirements; |
| • | data privacy laws that may apply to the transmission of our clients’ and employees’ data to the U.S.; |
| • | localization of our services, including translation into foreign languages and associated expenses; |
| • | longer accounts receivable payment cycles and collection difficulties; |
| • | political and economic instability; |
| • | fluctuations in currency exchange rates; |
| • | potential difficulties in transferring funds generated overseas to the U.S. in a tax efficient manner; |
19
Table of Contents
| • | seasonal reductions in business activity during the summer months in Europe and other parts of the world; |
| • | differences between the rules and procedures associated with handling emergency communications in the United States and those related to IP emergency communications originated outside of the United States; and |
| • | potentially adverse tax consequences. |
If we cannot manage our international operations successfully, our business, results of operations and financial condition could be adversely affected.
Changes in foreign exchange rates may adversely affect our revenue and net income attributed to foreign subsidiaries.
We conduct business in countries outside of the United States. Revenue and expense from our foreign operations are typically denominated in local currencies, thereby creating exposure to changes in exchange rates. Revenue and profit generated by our international operations will increase or decrease compared to prior periods as a result of changes in foreign currency exchange rates. Adverse changes to foreign exchange rates could decrease the value of revenue we receive from our international operations and have a material adverse impact on our business. Generally, we do not attempt to hedge our foreign currency transactions.
If we are unable to complete future acquisitions, our business strategy and earnings may be negatively affected.
Our ability to identify and take advantage of attractive acquisitions or other business development opportunities is an important component in implementing our overall business strategy. We may be unable to identify, finance or complete acquisitions or to do so at attractive valuations.
If we are unable to integrate or achieve the objectives of our recent and future acquisitions, our overall business may suffer.
Our business strategy depends on successfully integrating the assets, operations and corporate functions of businesses we have acquired and any additional businesses we may acquire in the future. The acquisition of additional businesses involves integration risks, including:
| • | the diversion of management’s time and attention away from operating our business to acquisition and integration challenges; |
| • | the unanticipated loss of key employees of the acquired businesses; |
| • | the potential need to implement or remediate controls, procedures and policies appropriate for a larger company at businesses that prior to the acquisition lacked these controls, procedures and policies; |
| • | the need to integrate accounting, information management, human resources, contract and intellectual property management and other administrative systems at each business to permit effective management; and |
| • | our entry into markets or geographic areas where we may have limited or no experience. |
We may be unable to effectively or efficiently integrate businesses we have acquired or may acquire in the future without encountering the difficulties described above. Failure to integrate these businesses effectively could adversely affect our business, results of operations and financial condition.
20
Table of Contents
In addition to this integration risk, our business, results of operations and financial condition could be adversely affected if we are unable to achieve the planned objectives of an acquisition. The inability to achieve our planned objectives could result from:
| • | the financial underperformance of these acquisitions; |
| • | the loss of key clients of the acquired business, which may drive financial underperformance; and |
| • | the occurrence of unanticipated liabilities or contingencies for which we are unable to receive indemnification from the prior owner of the business. |
Potential future impairments of our substantial goodwill, intangible assets, or other long-lived assets could adversely affect our business, results of operations and financial condition.
As of December 31, 2011, we had goodwill and intangible assets, net of accumulated amortization, of approximately $1.8 billion and $333.1 million, respectively. Management is required to exercise significant judgment in identifying and assessing whether impairment indicators exist, or if events or changes in circumstances have occurred, including market conditions, operating results, competition and general economic conditions. See “Management’s Discussion and Analysis of Financial Condition and Results of Operations—Critical Accounting Policies—Goodwill and Intangible Assets.” Any changes in key assumptions about the business units and their prospects or changes in market conditions or other externalities could result in an impairment charge, and such a charge could have an adverse effect on our business, results of operations and financial condition.
Our ability to recover consumer receivables on behalf of our clients may be limited under federal and state laws, which could limit our ability to recover on consumer receivables regardless of any act or omission on our part.
Federal and state consumer protection, privacy and related laws and regulations extensively regulate the relationship between debt collectors and debtors. Federal and state laws may limit our ability to recover on our clients’ consumer receivables regardless of any act or omission on our part. In addition, in March 2011, we entered into a Stipulated Order as part of a settlement agreement with the Federal Trade Commission (“FTC”) that imposes duties upon us beyond those of current federal and state laws. For example, for a period of five years from the date of entry of the Order, we must include a special disclosure on all written communications sent to consumers in connection with the collection of debts. The disclosure advises the consumer of certain rights they have under the Federal Fair Debt Collection Practices Act (“FDCPA”), provides a phone number and address at West to which the consumer can direct a complaint, and also provides contact information for the FTC if the consumer wishes to file a complaint with the Commission. In addition, for a period of five years, we must provide a special notice to all employees that advises them of certain requirements under the FDCPA including notice that individual collectors can be liable for violations of the FDCPA. Each employee must sign an acknowledgement that he or she has received and read the notice and we must maintain copies of the acknowledgements to verify our compliance. Additional consumer protection and privacy protection laws may be enacted that would impose additional or more stringent requirements on the enforcement of and collection on consumer receivables. In addition, federal and state governments are considering, and may consider in the future, other legislative proposals that would further regulate the collection of consumer receivables. Any failure to comply with any current or future laws applicable to us could limit our ability to collect on our clients’ charged-off consumer receivable portfolios, which could adversely affect our business, results of operations and financial condition.
21
Table of Contents
Risks Related to Our Level of Indebtedness
We may not be able to generate sufficient cash to service all of our indebtedness and fund our other liquidity needs, and we may be forced to take other actions, which may not be successful, to satisfy our obligations under our indebtedness.
At December 31, 2011, our aggregate long-term indebtedness was $3,516.4 million. In 2011, our consolidated interest expense was approximately $269.9 million. Following the completion of this offering, we expect annual interest expense to be reduced by approximately $ , assuming net proceeds to us in this offering of approximately $ , based on an assumed initial public offering price of $ per share, the mid-point of the range on the cover of this prospectus. Our ability to make scheduled payments or to refinance our debt obligations and to fund our other liquidity needs depends on our financial and operating performance, which is subject to prevailing economic and competitive conditions and to certain financial, business and other factors beyond our control. We cannot assure you that we will maintain a level of cash flows from operating activities sufficient to permit us to pay the principal, premium, if any, and interest on our indebtedness and to fund our other liquidity needs. See “Special Note Regarding Forward-Looking Statements” and “Management’s Discussion and Analysis of Financial Condition and Results of Operations—Liquidity and Capital Resources.”
If our cash flows and capital resources are insufficient to fund our debt service obligations and to fund our other liquidity needs, we may be forced to reduce or delay capital expenditures, sell assets or operations, seek additional capital or restructure or refinance our indebtedness. We cannot make assurances that we would be able to take any of these actions, that these actions would be successful and permit us to meet our scheduled debt service obligations or that these actions would be permitted under the terms of our existing or future debt agreements, including our senior secured credit facilities or the indentures that govern our outstanding notes. Our senior secured credit facilities documentation and the indentures that govern the notes restrict our ability to dispose of assets and use the proceeds from the disposition. As a result, we may not be able to consummate those dispositions or use the proceeds to meet our debt service or other obligations, and any proceeds that are available may not be adequate to meet any debt service or other obligations then due.
If we cannot make scheduled payments on our debt, we will be in default and, as a result:
| • | our debt holders could declare all outstanding principal and interest to be due and payable; |
| • | the lenders under our senior secured credit facilities could terminate their commitments to lend us money and foreclose against the assets securing our borrowings; and |
| • | we could be forced into bankruptcy or liquidation. |
Our current or future indebtedness could impair our financial condition and reduce the funds available to us for other purposes, and our failure to comply with the covenants contained in our senior secured credit facilities documentation or the indentures that govern our outstanding notes could result in an event of default that could adversely affect our results of operations.
Our current or future indebtedness could adversely affect our business, results of operations or financial condition, including the following:
| • | our ability to obtain additional financing in the future for working capital, capital expenditures, acquisitions, product development, general corporate purposes or other purposes may be impaired; |
| • | a significant portion of our cash flow from operations may be dedicated to the payment of interest and principal on our indebtedness, which will reduce the funds available to us for our operations, capital expenditures, future business opportunities or other purposes; |
| • | the debt service requirements of our other indebtedness could make it more difficult for us to satisfy our financial obligations; |
22
Table of Contents
| • | because we may be more leveraged than some of our competitors, our debt may place us at a competitive disadvantage; |
| • | our leverage will increase our vulnerability to economic downturns and limit our ability to withstand adverse events in our business by limiting our financial alternatives; and |
| • | our ability to capitalize on significant business opportunities and to plan for, or respond to, competition and changes in our business may be limited. |
Our debt agreements contain, and any agreements to refinance our debt likely will contain, financial and restrictive covenants that limit our ability to incur additional debt, including to finance future operations or other capital needs, and to engage in other activities that we may believe are in our long-term best interests, including to dispose of or acquire assets. Our failure to comply with these covenants may result in an event of default, which, if not cured or waived, could accelerate the maturity of our indebtedness or result in modifications to our credit terms. If our indebtedness is accelerated, we may not have sufficient cash resources to satisfy our debt obligations and we may not be able to continue our operations as planned.
We had a negative net worth as of December 31, 2011, which may make it more difficult and costly for us to obtain financing in the future and may otherwise negatively impact our business.
As of December 31, 2011, we had a negative net worth of $896.4 million. Our negative net worth primarily resulted from the incurrence of indebtedness to finance our recapitalization in 2006. As a result of our negative net worth, we may face greater difficulty and expense in obtaining future financing than we would face if we had a greater net worth, which may limit our ability to meet our needs for liquidity or otherwise compete effectively in the marketplace.
Despite our current indebtedness levels and the restrictive covenants set forth in agreements governing our indebtedness, we and our subsidiaries may still incur significant additional indebtedness, including secured indebtedness. Incurring additional indebtedness could increase the risks associated with our substantial indebtedness.
Subject to the restrictions in our debt agreements, we and certain of our subsidiaries may incur significant additional indebtedness, including additional secured indebtedness. Although the terms of our debt agreements contain restrictions on the incurrence of additional indebtedness, these restrictions are subject to a number of qualifications and exceptions, and additional indebtedness incurred in compliance with these restrictions could be significant. As of December 31, 2011, under the terms of our debt agreements, we would be permitted to incur up to approximately $848.6 million of additional tranches of term loans or increases to the revolving credit facility. Depending on the application of net proceeds received by us in this offering, our ability to incur additional indebtedness under our senior secured credit facilities could increase substantially and we may reborrow a portion of the debt repaid following this offering. If new debt is added to our and our subsidiaries’ current debt levels, the related risks that we face after this offering could increase.
Risks Related to This Offering and Our Common Stock
There has not been a public market for our shares since our recapitalization in 2006 and an active market may not develop or be maintained, which could limit your ability to sell shares of our common stock.
Before this offering, there has not been a public market for our shares of common stock since 2006. Although we have applied to list the common stock on the Nasdaq Global Select Market, an active public market for our shares may not develop or be sustained after this offering. The initial public offering price will be determined by negotiations between the underwriters, the selling stockholders and our board of directors and may not be representative of the market price at which our shares of common stock will trade after this offering. In particular, we cannot assure you that you will be able to resell our shares at or above the initial public offering price.
23
Table of Contents
The price of our common stock could be volatile.
The overall market and the price of our common stock may fluctuate greatly. The trading price of our common stock may be significantly affected by various factors, including:
| • | quarterly fluctuations in our operating results; |
| • | changes in investors’ and analysts’ perception of the business risks and conditions of our business; |
| • | our ability to meet the earnings estimates and other performance expectations of financial analysts or investors; |
| • | unfavorable commentary or downgrades of our stock by equity research analysts; |
| • | termination of lock-up agreements or other restrictions on the ability of our existing stockholders to sell their shares after this offering; |
| • | fluctuations in the stock prices of our peer companies or in stock markets in general; and |
| • | general economic or political conditions. |
Future sales of our common stock may lower our stock price.
If our existing stockholders sell a large number of shares of our common stock following this offering, the market price of our common stock could decline significantly. In addition, the perception in the public market that our existing stockholders might sell shares of common stock could depress the market price of our common stock, regardless of the actual plans of our existing stockholders. Immediately after this offering, approximately shares of our common stock will be outstanding, or if the underwriters' option is exercised in full. Of these shares, shares will be available for immediate resale in the public market, including all of the shares in this offering, and shares will be available for resale 90 days following completion of this offering, except those held by our “affiliates.” Of the remaining shares outstanding, shares are subject to lock-up agreements restricting the sale of those shares for 180 days from the date of this prospectus. However, the underwriters may waive this restriction and allow the stockholders to sell their shares at any time.
In addition, following this offering and the sale by the selling stockholders of the shares offered by them hereby, the holders of shares of common stock will have the right, subject to certain exceptions and conditions, to require us to register their shares of common stock under the Securities Act, and they will have the right to participate in future registrations of securities by us. Registration of any of these outstanding shares of common stock would result in such shares becoming freely tradable without compliance with Rule 144 upon effectiveness of the registration statement. See “Shares Available for Future Sale.”
After this offering, we intend to register approximately shares of common stock that are reserved for issuance upon exercise of options granted under our stock option plans. Once we register these shares, they can be sold in the public market upon issuance, subject to restrictions under the securities laws applicable to resales by affiliates.
Investors in this offering will suffer immediate and substantial dilution.
The initial public offering price per share of common stock will be substantially higher than our pro forma net tangible book value per share immediately after this offering. As a result, you will pay a price per share that substantially exceeds the book value of our assets after subtracting our liabilities. At an offering price of $ per share, the mid-point of the range set forth on the cover of this prospectus, you will incur immediate and substantial dilution in an amount of $ per share of common stock. See “Dilution.”
24
Table of Contents
Moreover, we issued options in the past to acquire common stock at prices significantly below the assumed initial public offering price. As of , 2012, shares of common stock were issuable upon exercise of outstanding stock options with a weighted average exercise price of $ per share. To the extent that these outstanding options are ultimately exercised, you will incur further dilution.
Anti-takeover provisions contained in our certificate of incorporation and bylaws, as well as provisions of Delaware law, could impair a takeover attempt that our stockholders may find beneficial.
Our certificate of incorporation, bylaws and Delaware law contain provisions that could have the effect of rendering more difficult or discouraging an acquisition deemed undesirable by our board of directors. Our corporate governance documents include provisions:
| • | establishing a classified board of directors so that not all members of our board are elected at one time; |
| • | providing that directors may be removed by stockholders only for cause; |
| • | authorizing blank check preferred stock, which could be issued with voting, liquidation, dividend and other rights superior to our common stock; |
| • | limiting the ability of our stockholders to call and bring business before special meetings and to take action by written consent in lieu of a meeting; |
| • | limiting our ability to engage in certain business combinations with any “interested stockholder” (other than the Sponsors, Gary and Mary West, their affiliates and certain transferees) for a three-year period following the time that the stockholder became an interested stockholder; |
| • | requiring advance notice of stockholder proposals for business to be conducted at meetings of our stockholders and for nominations of candidates for election to our board of directors; and |
| • | limiting the determination of the number of directors on our board of directors and the filling of vacancies or newly created seats on the board to our board of directors then in office. |
These provisions, alone or together, could delay hostile takeovers and changes in control of our company or changes in our management.
As a Delaware corporation, we are also subject to provisions of Delaware law. Any provision of our amended and restated certificate of incorporation or bylaws or Delaware law that has the effect of delaying or deterring a change in control could limit the opportunity for our stockholders to receive a premium for their shares of our common stock, and could also affect the price that some investors are willing to pay for our common stock.
Our existing stockholders will exert significant influence over us after the completion of this offering. Their interests may not coincide with yours and they may make decisions with which you may disagree.
After this offering, Gary L. West, Mary E. West, the Gary and Mary West Wireless Health Institute and investment funds associated with the Sponsors will own, in the aggregate, approximately % of our outstanding common stock. As a result, these stockholders, acting individually or together, could control substantially all matters requiring stockholder approval, including the election of most directors and approval of significant corporate transactions. In addition, this concentration of ownership may delay or prevent a change in control of our company and make some transactions more difficult or impossible without the support of these stockholders. The interests of these stockholders may not always coincide with our interests as a company or the interest of other stockholders. Accordingly, these stockholders could cause us to enter into transactions or agreements that you would not approve or make decisions with which you may disagree.
Because investment funds associated with the Sponsors have agreed to act together on certain matters, including with respect to the election of directors, and will own more than % of our voting power after
25
Table of Contents
giving effect to this offering, we will be considered a “controlled company” under the Nasdaq Marketplace Rules. We intend to avail ourselves of the “controlled company” exception under the Nasdaq Marketplace Rules. As such, we will be exempt from certain of the corporate governance requirements under the Nasdaq Marketplace Rules, including the requirements that a majority of our board of directors consist of independent directors, that we have a nominating and corporate governance committee that is composed entirely of independent directors and that we have a compensation committee that is composed entirely of independent directors. As a result, for so long as we are a controlled company, you will not have the same protections afforded to stockholders of companies that are subject to all of the corporate governance requirements under the Nasdaq Marketplace Rules.
Our amended and restated certificate of incorporation contains a provision renouncing our interest and expectancy in certain corporate opportunities, which could adversely affect our business or prospects.
Our amended and restated certificate of incorporation provides that we renounce any interest or expectancy in, or in being offered an opportunity to participate in, any business opportunity that may be from time to time presented to the Sponsors or any of their officers, directors, agents, stockholders, members, partners, affiliates and subsidiaries (other than West and its subsidiaries) and that may be a business opportunity for such Sponsor, even if the opportunity is one that we might reasonably have pursued or had the ability or desire to pursue if granted the opportunity to do so, and no such person shall be liable to us for breach of any fiduciary or other duty, as a director or officer or otherwise, by reason of the fact that such person, acting in good faith, pursues or acquires any such business opportunity, directs any such business opportunity to another person or fails to present any such business opportunity, or information regarding any such business opportunity, to us unless, in the case of any such person who is our director or officer, any such business opportunity is expressly offered to such director or officer solely in his or her capacity as our director or officer. None of the Sponsors shall have any duty to refrain from engaging directly or indirectly in the same or similar business activities or lines of business as us or any of our subsidiaries.
These provisions apply subject only to certain ownership requirements of the Sponsors and other conditions. For example, our Sponsors may become aware, from time to time, of certain business opportunities, such as acquisition opportunities or ideas for product line expansions, and may direct such opportunities to other businesses in which they have invested, in which case we may not become aware of or otherwise have the ability to pursue such opportunity. Further, such businesses may choose to compete with us for these opportunities. As a result, our renouncing our interest and expectancy in any business opportunity that may be from time to time presented to the Sponsors could adversely impact our business or prospects if attractive business opportunities are procured by the Sponsors for their own benefit rather than for ours. See “Description of Capital Stock.”
If securities or industry analysts do not publish research or reports about our business, if they adversely change their recommendations regarding our common stock or if our operating results do not meet their expectations, our common stock price could decline.
The market price of our common stock will be influenced by the research and reports that industry or securities analysts publish about us or our business. If one or more of these analysts cease coverage of our company or fail to publish reports on us regularly, we could lose visibility in the financial markets, which in turn could cause the market price of our common stock or its trading volume to decline. Moreover, if one or more of the analysts who cover our company downgrade our common stock or if our operating results or prospects do not meet their expectations, the market price of our common stock could decline.
Our management will have broad discretion over the use of the proceeds we receive in this offering and might not apply the proceeds in ways that increase the value of your investment.
Our management will have broad discretion to use our net proceeds from this offering, and you will be relying on the judgment of our management regarding the application of these proceeds. Our management might
26
Table of Contents
not apply our net proceeds of this offering in ways that increase the value of your investment. We expect to use the net proceeds to repay outstanding borrowings under our revolving credit facilities, to repurchase certain of our notes, to refund the amounts payable as a result of this offering under the management agreement between us and the Sponsors and for working capital and other general corporate purposes. Our management might not be able to yield a significant return, if any, on any investment of these net proceeds. You will not have the opportunity to influence our decisions on how to use our net proceeds from this offering.
After the completion of this offering, we do not expect to declare any dividends in the foreseeable future.
After the completion of this offering, we do not anticipate declaring any cash dividends to holders of our common stock in the foreseeable future. Consequently, investors may need to rely on sales of their common stock after price appreciation, which may never occur, as the only way to realize any future gains on their investment. Investors seeking cash dividends should not purchase our common stock.
27
Table of Contents
SPECIAL NOTE REGARDING FORWARD-LOOKING STATEMENTS
This prospectus contains “forward-looking statements” within the meaning of the federal securities laws. All statements other than statements of historical facts contained in this prospectus, including statements regarding our future results of operations and financial position, business strategy and plans and objectives of management for future operations, are forward-looking statements. In many cases, you can identify forward-looking statements by terms such as “may,” “will,” “should,” “expect,” “plan,” “anticipate,” “could,” “intend,” “target,” “project,” “contemplate,” “believe,” “estimate,” “predict,” “potential” or “continue” or other similar words.
These forward-looking statements are only predictions. These statements relate to future events or our future financial performance and involve known and unknown risks, uncertainties and other important factors that may cause our actual results, levels of activity, performance or achievements to materially differ from any future results, levels of activity, performance or achievements expressed or implied by these forward-looking statements. We have described in the “Risk Factors” section and elsewhere in this prospectus the principal risks and uncertainties that we believe could cause actual results to differ from these forward-looking statements. Because forward-looking statements are inherently subject to risks and uncertainties, some of which cannot be predicted or quantified, you should not rely on these forward-looking statements as guarantees of future events.
The forward-looking statements in this prospectus represent our views as of the date of this prospectus. We anticipate that subsequent events and developments will cause our views to change. However, while we may elect to update these forward-looking statements at some point in the future, we have no current intention of doing so except to the extent required by applicable law. You should, therefore, not rely on these forward-looking statements as representing our views as of any date subsequent to the date of this prospectus.
28
Table of Contents
Based upon an assumed initial public offering price of $ per share, which is the mid-point of the price range set forth on the cover page of this prospectus, we estimate that we will receive net proceeds from this offering of approximately $ million, after deducting estimated underwriting discounts and commissions in connection with this offering and estimated offering expenses payable by us of $ million. See “Underwriting.”
We will not receive any of the proceeds from the shares of common stock sold by the selling stockholders in this offering.
We expect to use approximately $ million of the net proceeds from this offering received by us to repay or repurchase indebtedness, including amounts outstanding under our senior credit facilities and our senior subordinated notes. We do not currently have a firm expectation as to how we will allocate the reduction of indebtedness among these borrowing arrangements but intend to determine the allocation following the completion of this offering based on a number of factors, including remaining maturity, applicable interest rates, available pricing for repurchases, outstanding balance and ability to reborrow. As of December 31, 2011:
| • | approximately $448.4 million was outstanding under our amended and restated senior secured term loan facility due 2013 at variable interest rates (LIBOR plus 2.375% at December 31, 2011); |
| • | approximately $1,467.9 million was outstanding under our amended and restated senior secured term loan facility due 2016 at variable interest rates (LIBOR plus 4.25% at December 31, 2011); |
| • | $450.0 million of our 11% senior subordinated notes due 2016 were outstanding; |
For additional information regarding our liquidity and outstanding indebtedness, see “Management’s Discussion and Analysis of Financial Condition and Results of Operations—Liquidity and Capital Resources.”
We also expect to use approximately $ million to fund the amounts payable upon the termination of the management agreement between us and the Sponsors entered into in connection with the consummation of our recapitalization in 2006, including $ in the aggregate to the THL Investors and $ in the aggregate to the Quadrangle Investors. We may also use a portion of the net proceeds received by us for working capital and other general corporate purposes.
We will have broad discretion in the way that we use the net proceeds of this offering received by us. The amounts that we actually spend for the purposes described above may vary significantly and will depend, in part, on the timing and amount of our future revenue, our future expenses and any potential acquisitions that we may pursue. Pending the uses of the net proceeds of this offering as described above, we intend to invest the net proceeds of this offering received by us in investment-grade, interest-bearing securities including corporate, financial institution, federal agency and U.S. government obligations. See “Risk Factors—Risks Related to This Offering and Our Common Stock—Our management will have broad discretion over the use of the proceeds we receive in this offering and might not apply the proceeds in ways that increase the value of your investment.”
29
Table of Contents
We currently intend to retain earnings to finance the growth and development of our business and for working capital and general corporate purposes, and do not anticipate paying cash dividends on our common stock in the foreseeable future. Any payment of dividends will be at the discretion of our board of directors and will depend upon earnings, financial condition, capital requirements, level of indebtedness, contractual restrictions with respect to payment of dividends, restrictions imposed by applicable law and other factors. See “Management’s Discussion and Analysis of Financial Condition and Results of Operations—Liquidity and Capital Resources.”
30
Table of Contents
The following table shows our capitalization as of December 31, 2011:
| • | on an actual basis; and |
| • | on a pro forma as adjusted basis to give pro forma effect to the issuance and sale by us of shares of our common stock in this offering at an assumed initial public offering price of $ per share, the mid-point of the range set forth on the cover of this prospectus, and after deducting the underwriting discounts and commissions and estimated offering expenses payable by us and the application of the net proceeds to us from this offering as described in “Use of Proceeds.” |
You should read this table together with the “Management’s Discussion and Analysis of Financial Condition and Results of Operations” and “Use of Proceeds” sections of this prospectus as well as our financial statements and related notes and the other financial information appearing elsewhere in this prospectus.
| As of December 31, 2011 | ||||||||
| Actual | Pro Forma As Adjusted(1) |
|||||||
| (unaudited) (in thousands) |
||||||||
| Cash and cash equivalents |
$ | 93,836 | $ | |||||
|
|
|
|
|
|||||
| Long-term obligations, including current portion: |
||||||||
| Senior Secured Term Loan Facility, due 2013 |
$ | 448,434 | $ | |||||
| Senior Secured Term Loan Facility, due 2016 |
1,467,931 | |||||||
| 11% Senior Subordinated Notes, due 2016 |
450,000 | |||||||
| 8 5/8% Senior Notes, due 2018 |
500,000 | |||||||
| 7 7/8% Senior Notes, due 2019 |
650,000 | |||||||
| Stockholders’ deficit |
||||||||
| Common Stock $0.001 par value, 1,000,000 shares authorized, 490,650 shares issued and 490,271 shares outstanding at December 31, 2011 |
491 | — | ||||||
| Additional paid-in capital |
1,695,477 | — | ||||||
| Retained deficit |
(2,556,525 | ) | ||||||
| Accumulated other comprehensive loss |
(32,036 | ) | ||||||
| Treasury stock at cost (379 shares) |
(3,820 | ) | ||||||
|
|
|
|||||||
| Total stockholders’ deficit |
(896,413 | ) | ||||||
|
|
|
|
|
|||||
| Total capitalization |
$ | 2,619,952 | $ | |||||
|
|
|
|
|
|||||
| (1) | The pro forma as adjusted information discussed above is illustrative only and will change based on the actual initial public offering price and other terms of this offering. A $1.00 increase or decrease in the assumed initial public offering price per share would decrease or increase long-term obligations, including current portion, by $ million, would increase or decrease additional paid-in capital by $ million and would decrease or increase total stockholders’ deficit and would increase or decrease total capitalization each by $ million, after deducting the underwriting discounts and commissions and the estimated offering expenses payable by us. An increase or decrease of 1.0 million shares in the number of shares offered by us would decrease or increase long-term obligations, including current portion, by $ million, would increase or |
31
Table of Contents
| decrease additional paid-in capital by $ million, would decrease or increase total stockholders’ deficit and would increase or decrease total capitalization each by approximately $ million, assuming the assumed initial public offering price of $ per share, the mid-point of the range set forth on the front cover of this prospectus, remains the same and after deducting the underwriting discounts and commissions and estimated offering expenses payable by us. |
The share information as of December 31, 2011 shown in the table above excludes:
| • | shares of common stock issuable upon exercise of options outstanding as of December 31, 2011 at a weighted average exercise price of $ per share; |
| • | shares of common stock reserved for future issuance under our 2012 Employee Stock Purchase Plan; and |
| • | shares of common stock reserved for future issuance under our stock-based compensation plans, including shares of common stock reserved for issuance under our 2012 Long-Term Incentive Plan, which will become effective on the date of this prospectus, and shares of common stock reserved for issuance under our Nonqualified Deferred Compensation Plan. |
32
Table of Contents
If you invest in our common stock, your ownership interest will be immediately diluted to the extent of the difference between the initial public offering price per share of our common stock and the net tangible book value per share of our common stock after this offering. Dilution results from the fact that the per share offering price of the common stock is substantially in excess of the book value per share attributable to the existing stockholders for the presently outstanding stock.
Our net tangible book value at December 31, 2011 was $(3.0) billion, and our pro forma net tangible book value per share was $ . Pro forma net tangible book value per share before the offering has been determined by dividing net tangible book value (total book value of tangible assets less total liabilities) by the number of shares of common stock outstanding at December 31, 2011.
After giving effect to the sale of our common stock in this offering at an assumed initial public offering price of $ per share, the mid-point of the price range set forth on the cover page of this prospectus, and after deducting the underwriting discount and estimated offering expenses payable by us, our pro forma net tangible book value at December 31, 2011 would have been $ million, or $ per share. This represents an immediate increase in net tangible book value per share of $ to the existing stockholders and dilution in net tangible book value per share of $ to new investors who purchase shares in the offering. The following table illustrates this per share dilution to new investors:
| Assumed initial public offering price per share |
$ | |||
| Pro forma net tangible book value per share as of December 31, 2011 |
$ | |||
| Increase per share attributable to new investors in this offering |
||||
| Pro forma net tangible book value per share after this offering |
||||
| Dilution of net tangible book value per share to new investors |
$ | |||
|
|
|
The dilution information discussed above is illustrative only and will change based on the actual initial public offering price and other terms of this offering. For example, a $1.00 increase or decrease in the initial public offering price from that assumed in this prospectus of $ per share, the mid-point of the price range set forth on the front cover of this prospectus, would increase or decrease pro forma net tangible book value by approximately $ million, or approximately $ per share, and the dilution per share to investors in this offering by approximately $ per share, assuming that the number of shares offered by us set forth on the front cover of this prospectus remains the same and after deducting the underwriting discounts and commissions and estimated offering expenses payable by us. We may also increase or decrease the number of shares we are offering. An increase of 1.0 million shares in the number of shares offered by us would result in a pro forma net tangible book value of approximately $ million, or approximately $ per share, and the dilution per share to investors in this offering would be approximately $ per share, assuming the assumed initial public offering price of $ per share, the mid-point of the price range set forth on the front cover of this prospectus, remains the same and after deducting the underwriting discounts and commissions and estimated offering expenses payable by us. Similarly, a decrease of 1.0 million shares in the number of shares offered by us would result in a pro forma net tangible book value of approximately $ million, or approximately $ per share, and the dilution per share to investors in this offering would be approximately $ per share, assuming the assumed initial public offering price of $ per share, the mid-point of the price range set forth on the front cover of this prospectus, remains the same and after deducting the underwriting discounts and commissions and estimated offering expenses payable by us.
33
Table of Contents
The following table summarizes, on the same pro forma basis as of December 31, 2011, the total number of shares of common stock purchased from us, the total consideration paid to us and the average price per share paid by the existing stockholders and by new investors purchasing shares in this offering (amounts in thousands, except percentages and per share data):
| Shares Purchased | Total Consideration | Average Price Per Share |
||||||||||||||||
| Number | Percent | Amount | Percent | |||||||||||||||
| Existing stockholders |
% | $ | % | $ | ||||||||||||||
| New investors |
||||||||||||||||||
|
|
|
|
|
|
|
|
|
|
||||||||||
| Total |
100 | % | $ | 100 | % | $ | ||||||||||||
|
|
|
|
|
|
|
|
|
|
||||||||||
A $1.00 increase or decrease in the assumed initial public offering price of $ per share, the mid-point of the price range set forth on the front cover of this prospectus, would increase or decrease total consideration paid by new investors and total consideration paid by all stockholders by $ million, assuming that the number of shares offered by us set forth on the front cover of this prospectus remains the same, and after deducting the underwriting discounts and commissions and estimated offering expenses payable by us. An increase or decrease of 1.0 million shares in the number of shares offered by us would increase or decrease the total consideration paid to us by new investors and total consideration paid to us by all stockholders by $ million, assuming the assumed initial public offering price of $ per share, the mid-point of the price range set forth on the front cover of this prospectus, remains the same and after deducting the underwriting discounts and commissions and estimated offering expenses payable by us.
34
Table of Contents
SELECTED CONSOLIDATED FINANCIAL DATA
The following table sets forth a summary of our selected consolidated financial data. We derived the selected consolidated financial data as of December 31, 2011 and December 31, 2010 and for the years ended December 31, 2011, December 31, 2010, and December 31, 2009 from our consolidated financial statements included elsewhere in this prospectus. The selected consolidated financial data as of December 31, 2009, December 31, 2008, and December 31, 2007, and for the years ended December 31, 2008 and December 31, 2007 have been derived from our financial statements for such years, which are not included in this prospectus. In January 2009, we adopted Accounting Standards Codification Topic 810, Consolidation (“ASC 810”) (formerly Statement of Financial Accounting Standard No. 160, Noncontrolling Interests in Consolidated Financial Statements—An Amendment of ARB No. 51.), which required retrospective application and accordingly all prior periods have been recast to reflect the retrospective adoption.
The selected consolidated financial data set forth below are not necessarily indicative of the results of future operations and should be read in conjunction with the discussion under the heading “Management’s Discussion and Analysis of Financial Condition and Results of Operations” and the other financial information included elsewhere in this prospectus.
| Year ended December 31, | ||||||||||||||||||||
| 2007 | 2008 | 2009 | 2010 | 2011 | ||||||||||||||||
| (amounts in thousands except per share amounts) |
||||||||||||||||||||
| Statement of Operations Data: |
||||||||||||||||||||
| Revenue |
$ | 2,099,492 | $ | 2,247,434 | $ | 2,375,748 | $ | 2,388,211 | $ | 2,491,325 | ||||||||||
| Cost of services |
912,389 | 1,015,028 | 1,067,777 | 1,057,008 | 1,113,289 | |||||||||||||||
| Selling, general and administrative expenses (“SG&A”) |
840,532 | 881,586 | 907,358 | 911,022 | 909,908 | |||||||||||||||
|
|
|
|
|
|
|
|
|
|
|
|||||||||||
| Operating income |
346,571 | 350,820 | 400,613 | 420,181 | 468,128 | |||||||||||||||
| Interest expense |
(332,372 | ) | (313,019 | ) | (254,103 | ) | (252,724 | ) | (269,863 | ) | ||||||||||
| Refinancing expense |
— | — | — | (52,804 | ) | — | ||||||||||||||
| Other income (expense) |
13,396 | (8,621 | ) | 1,326 | 6,127 | 6,262 | ||||||||||||||
|
|
|
|
|
|
|
|
|
|
|
|||||||||||
| Income before income tax expense |
27,595 | 29,180 | 147,836 | 120,780 | 204,527 | |||||||||||||||
| Income tax expense |
6,814 | 11,731 | 56,862 | 60,476 | 77,034 | |||||||||||||||
|
|
|
|
|
|
|
|
|
|
|
|||||||||||
| Net income |
20,781 | 17,449 | 90,974 | 60,304 | 127,493 | |||||||||||||||
| Less net income (loss)—noncontrolling interest |
15,399 | (2,058 | ) | 2,745 | — | — | ||||||||||||||
|
|
|
|
|
|
|
|
|
|
|
|||||||||||
| Net income—West Corporation |
$ | 5,382 | $ | 19,507 | $ | 88,229 | $ | 60,304 | $ | 127,493 | ||||||||||
|
|
|
|
|
|
|
|
|
|
|
|||||||||||
| Basic Class L shares |
$ | 11.08 | $ | 12.78 | $ | 17.45 | $ | 17.07 | $ | 17.18 | ||||||||||
| Diluted Class L shares |
$ | 10.68 | $ | 12.24 | $ | 16.67 | $ | 16.37 | $ | 16.48 | ||||||||||
| Basic Common |
$ | (1.20 | ) | $ | (1.23 | ) | $ | (0.98 | ) | $ | (1.25 | ) | $ | (0.50 | ) | |||||
| Diluted Common |
$ | (1.20 | ) | $ | (1.23 | ) | $ | (0.98 | ) | $ | (1.25 | ) | $ | (0.50 | ) | |||||
| Year Ended December 31, | ||||||||||||||||||||
| 2007 | 2008 | 2009 | 2010 | 2011 | ||||||||||||||||
| (dollars in thousands) | ||||||||||||||||||||
| Selected Other Data: |
||||||||||||||||||||
| Net cash flows from operating activities |
$ | 263,897 | $ | 287,381 | $ | 272,857 | $ | 312,829 | 348,187 | |||||||||||
| Net cash flows used in investing activities |
$ | (454,946 | ) | $ | (597,539 | ) | $ | (112,615 | ) | $ | (137,896 | ) | (329,441 | ) | ||||||
| Net cash flows from (used in) financing activities |
$ | 118,106 | $ | 341,971 | $ | (271,844 | ) | $ | (133,651 | ) | (23,180 | ) | ||||||||
| Capital expenditures |
$ | 103,647 | $ | 108,765 | $ | 122,668 | $ | 122,049 | 120,122 | |||||||||||
| Adjusted EBITDA(1) |
$ | 584,123 | $ | 633,551 | $ | 647,941 | $ | 654,650 | 681,357 | |||||||||||
| Adjusted EBITDA margin(2) |
27.8 | % | 28.2 | % | 27.3 | % | 27.4 | % | 27.3 | % | ||||||||||
35
Table of Contents
| As of December 31, | ||||||||||||||||||||
| 2007 | 2008 | 2009 | 2010 | 2011 | ||||||||||||||||
| (dollars in thousands) | ||||||||||||||||||||
| Balance Sheet Data: |
||||||||||||||||||||
| Working capital |
$ | 187,795 | $ | 211,410 | $ | 175,007 | $ | 213,465 | 203,486 | |||||||||||
| Property and equipment, net |
$ | 298,645 | $ | 320,152 | $ | 333,267 | $ | 341,366 | 350,855 | |||||||||||
| Total assets |
$ | 2,846,490 | $ | 3,314,789 | $ | 3,045,262 | $ | 3,005,250 | 3,227,578 | |||||||||||
| Total debt |
$ | 3,596,691 | $ | 3,946,127 | $ | 3,633,928 | $ | 3,533,566 | 3,516,365 | |||||||||||
| Class L common stocks(3) |
$ | 1,029,782 | $ | 1,158,159 | $ | 1,332,721 | $ | 1,504,445 | — | |||||||||||
| Total Stockholders’ equity (deficit) |
$ | (2,227,198 | ) | $ | (2,360,747 | ) | $ | (2,425,465 | ) | $ | (2,543,500 | ) | (896,413 | ) | ||||||
| (1) | The term “EBITDA” refers to earnings before interest expense, taxes, depreciation and amortization, and the term “Adjusted EBITDA” refers to earnings before interest expense, share based compensation, taxes, depreciation and amortization, non-recurring litigation settlement costs, impairments and other non-cash reserves, transaction costs and after-acquisition synergies. We present Adjusted EBITDA because our management team uses it as an important supplemental measure in evaluating our operating performance and preparing internal forecasts and budgets and we believe it is frequently used by securities analysts, investors and other interested parties in the evaluation of companies in our industry. We also use Adjusted EBITDA as a liquidity measure in assessing compliance with our senior credit facilities. For a reconciliation of Adjusted EBITDA to cash flows from operating activities and a description of the material covenants contained in our senior credit facilities, see “Management’s Discussion and Analysis of Financial Condition and Results of Operations—Liquidity and Capital Resources—Debt Covenants.” We believe that the presentation of Adjusted EBITDA is useful because it provides important insight into our profitability trends and allows management and investors to analyze operating results with and without the impact of certain non-cash charges, such as depreciation and amortization, share-based compensation and impairments and other non-cash reserves, as well as certain litigation settlement and transaction costs and after-acquisition synergies. Although we use Adjusted EBITDA as a financial measure to assess the performance of our business and as a measure of our liquidity, Adjusted EBITDA is not a measure of financial performance or liquidity under generally accepted accounting principles (“GAAP”) and the use of Adjusted EBITDA is limited because it does not include certain material costs, such as depreciation, amortization and interest, necessary to operate our business and includes adjustments for synergies that have not been realized. In addition, as disclosed below, certain adjustments included in our calculation of Adjusted EBITDA are based on management’s estimates and do not reflect actual results. For example, post-acquisition synergies included in Adjusted EBITDA are determined in accordance with our senior credit facilities, which provide for an adjustment to EBITDA, subject to certain specified limitations, for reasonably identifiable and factually supportable cost savings projected by us in good faith to be realized as a result of actions taken following an acquisition. While we use net income as a measure of performance, we also believe that Adjusted EBITDA, when presented along with net income, provides balanced disclosure which, for the reasons set forth above, is useful to investors and management in evaluating our operating performance and profitability. Adjusted EBITDA included in this prospectus should be considered in addition to, and not as a substitute for, net income (loss) as calculated in accordance with GAAP as a measure of performance. Adjusted EBITDA, as presented, may not be comparable to similarly titled measures of other companies. Set forth below is a reconciliation of Adjusted EBITDA to net income. |
| For the year ended December 31, | ||||||||||||||||||||
| 2007 | 2008 | 2009 | 2010 | 2011 | ||||||||||||||||
| (dollars in thousands) | ||||||||||||||||||||
| Net income |
$ | 20,781 | $ | 17,449 | $ | 90,974 | $ | 60,304 | 127,493 | |||||||||||
| Interest expense and other financing charges |
332,372 | 313,019 | 254,103 | 252,724 | 272,383 | |||||||||||||||
| Depreciation and amortization |
182,820 | 183,487 | 188,347 | 170,331 | 171,908 | |||||||||||||||
| Income tax expense |
6,814 | 11,731 | 56,862 | 60,476 | 77,034 | |||||||||||||||
| Goodwill impairment |
— | — | — | 37,675 | — | |||||||||||||||
| Refinancing expense |
— | — | — | 52,804 | — | |||||||||||||||
| Provision for share-based compensation |
1,276 | 1,404 | 3,840 | 4,233 | 23,341 | |||||||||||||||
| Acquisition synergies and transaction costs(a) |
22,006 | 20,985 | 18,003 | 5,035 | 14,314 | |||||||||||||||
| Non-cash portfolio impairments(b) |
1,004 | 76,405 | 25,464 | — | — | |||||||||||||||
| Site closure and other impairments(c) |
1,309 | 2,644 | 6,976 | 6,365 | 2,233 | |||||||||||||||
| Non-cash foreign currency (gain) loss(d) |
— | 6,427 | (229 | ) | 1,199 | (6,454 | ) | |||||||||||||
| Litigation settlement costs(e) |
15,741 | — | 3,601 | 3,504 | (895 | ) | ||||||||||||||
|
|
|
|
|
|
|
|
|
|
|
|||||||||||
| Adjusted EBITDA(f) |
$ | 584,123 | $ | 633,551 | $ | 647,941 | $ | 654,650 | 681,357 | |||||||||||
|
|
|
|
|
|
|
|
|
|
|
|||||||||||
| (a) | Represents, for each period presented, unrealized synergies for acquisitions, consisting primarily of headcount reductions and telephony-related savings, direct acquisition expenses, transaction costs incurred with the recapitalization and the exclusion of the negative EBITDA in one acquired entity, which was an unrestricted subsidiary under the indentures governing our outstanding senior and senior subordinated notes. Amounts shown are permitted to be added to “EBITDA” for purposes of calculating our compliance with certain covenants under our credit facility and the indentures governing our outstanding notes. |
36
Table of Contents
| (b) | Represents non-cash portfolio receivable allowances. |
| (c) | Represents site closures and other asset impairments. |
| (d) | Represents the unrealized loss (gain) on foreign denominated debt and the loss on transactions with affiliates denominated in foreign currencies. |
| (e) | Represents litigation settlements, net of estimated insurance proceeds, and related legal costs. |
| (f) | Adjusted EBITDA does not include pro forma adjustments for acquired entities of $3.9 million in 2011, $(0.1) million in 2010, $2.0 million in 2009, $49.1 million in 2008 and $9.1 million in 2007 as is permitted in our debt covenants. |
| (2) | Represents Adjusted EBITDA as a percentage of revenue. |
| (3) | On December 30, 2011, each outstanding share of Class L Common Stock was converted into 40.29 shares of Class A Common Stock and our Class A Common Stock was then reclassified as a single class of Common Stock. |
37
Table of Contents
MANAGEMENT’S DISCUSSION AND ANALYSIS OF
FINANCIAL CONDITION AND RESULTS OF OPERATIONS
The following discussion should be read in conjunction with our consolidated financial statements and related notes and other financial information appearing elsewhere in this prospectus. In addition to historical information, the following discussion and other parts of this prospectus contain forward-looking information that involves risks and uncertainties. Our actual results could differ materially from those anticipated by such forward-looking information due to the factors discussed under “Risk Factors,” “Special Note Regarding Forward-Looking Statements” and elsewhere in this prospectus.
Business Overview
We are a leading provider of technology-driven communication services. The scale and processing capacity of our proprietary technology platforms, combined with our expertise in managing voice and data transactions, enable us to offer a broad portfolio of services including conferencing and collaboration, alerts and notifications, emergency communications and business processing outsourcing. Our services provide reliable, high-quality, mission-critical communications designed to maximize return on investment for our clients. Our clients include Fortune 1000 companies, along with small and medium enterprises in a variety of industries, including telecommunications, retail, financial services, public safety, technology and healthcare. We have sales and operations in the United States, Canada, Europe, the Middle East, Asia Pacific and Latin America.
Since our founding in 1986, we have invested significantly to expand our technology platforms and develop our operational processes to meet the complex communication needs of our clients. We have evolved our business mix from labor-intensive communication services to focus more on diversified and platform-based, technology-driven services.
Investing in technology and developing specialized expertise in the industries we serve are critical components to our strategy of enhancing our services and our value proposition. In 2011, we managed approximately 27 billion telephony minutes and approximately 121 million conference calls, facilitated over 260 million 9-1-1 calls, and delivered over 1 billion notification calls and data messages. With approximately 662,000 telephony ports to handle conference calls, alerts and notifications and customer service at December 31, 2011, we believe our platforms provide scale and flexibility to handle greater transaction volume than our competitors, offer superior service and develop new offerings. These ports include approximately 303,000 Internet Protocol (“IP”) ports, which we believe provide us with the only large-scale proprietary IP-based global conferencing platform deployed and in use today. Our technology-driven platforms allow us to provide a broad range of complementary automated and agent-based service offerings to our diverse client base.
Financial Operations Overview
Revenue
In our Unified Communications segment, our conferencing and collaboration services, event services and IP-based unified communication solutions are generally billed on a per participant minute or per seat basis and our alerts and notifications services are generally billed on a per message or per minute basis. Billing rates for these services vary depending on participant geographic location, type of service (such as audio, video or web conferencing) and type of message (such as voice, text, email or fax). We also charge clients for additional features, such as conference call recording, transcription services or professional services. Since we entered the conferencing services business, the average rate per minute that we charge has declined while total minutes sold has increased. This is consistent with industry trends. We expect this trend to continue for the foreseeable future.
In our Communication Services segment, our emergency communications solutions are generally billed per month based on the number of billing telephone numbers or cell towers covered under each client contract. We also bill monthly for our premise-based database solution. In addition, we bill for sales, installation and maintenance of our communication equipment technology solutions. Our platform-based and agent-based
38
Table of Contents
customer service solutions are generally billed on a per minute or per hour basis. We are generally paid on a contingent fee basis for our receivables management and overpayment identification and recovery services as well as for certain other agent-based services.
Cost of Services
The principal component of cost of services for our Unified Communications segment is our variable telephone expense. Significant components of our cost of services in this segment also include labor expense, primarily related to commissions for our sales force. Because the services we provide in this segment are largely platform-based, labor expense is less significant than the labor expense we experience in our Communication Services segment.
The principal component of cost of services for our Communication Services segment is labor expense. Labor expense included in costs of services primarily reflects compensation for the agents providing our agent-based services, but also includes compensation for personnel dedicated to emergency communications database management, manufacturing and development of our premise-based public safety solution as well as collection expenses, such as costs of letters and postage, incurred in connection with our receivables management services. We generally pay commissions to sales professionals on both new sales and incremental revenue generated from existing clients. Significant components of our cost of services in this segment also include variable telephone expense.
Selling, General and Administrative Expenses
The principal component of our selling, general and administrative expenses (“SG&A”) is salary and benefits for our sales force, client support staff, technology and development personnel, senior management and other personnel involved in business support functions. SG&A also includes certain fixed telephone costs as well as other expenses that support the ongoing operation of our business, such as facilities costs, certain service contract costs, equipment depreciation and maintenance, and amortization of finite-lived intangible assets.
Key Drivers Affecting Our Results of Operations
Factors Related to Our Indebtedness. During 2009, 2010 and 2011, in order to improve our debt maturity profile, we extended the maturity for $1.5 billion of our existing term loans from October 24, 2013 to July 15, 2016, repaid $500.0 million of our term loans due October 24, 2013 with the proceeds of a new $500.0 million 8 5/8% senior notes offering with a maturity date of October 1, 2018 and refinanced $650.0 million of senior notes due October 2014 with the proceeds of a new $650.0 million 7 7/8% senior notes offering with a maturity date of January 15, 2019. On September 12, 2011, our revolving trade accounts receivable financing facility was amended and extended. The amended and extended facility provides for $150.0 million in available financing and is extended to September 12, 2014, reduces the unused commitment fee by 25 basis points to 50 basis points and lowers the LIBOR spread on borrowings by 150 basis points to 175 basis points.
Evolution into a Predominately Platform-based Solutions Business. We have evolved into a diversified and platform-based technology-driven service provider. Since 2005, our revenue from platform-based services has grown from 37% of total revenue to 71% for 2011, and our operating income from platform-based services has grown from 53% of total operating income to 91% over the same period. As in the past, we will continue to seek and invest in higher margin businesses, irrespective of whether the associated services are delivered to our customers through an agent-based or a platform-based environment. We expect our platform-based service lines to grow at a faster pace than agent-based services and as a result will continue to increase as a percentage of our total revenue. However, many of our customers require an integrated service offering that incorporates both agent-based and platform-based services—for example, an automated voice response system with the option for the client’s customer to speak to an agent and accordingly we expect agent-based services will continue to represent a meaningful portion of our service offerings for the foreseeable future.
39
Table of Contents
Acquisition Activities. Identifying and successfully integrating acquisitions of value-added service providers has been a key component of our growth strategy. We will continue to seek opportunities to expand our suite of communication services across industries, geographies and end-markets. While we expect this will occur primarily through organic growth, we have and will continue to acquire assets and businesses that strengthen our value proposition to clients and drive value to us. We have developed an internal capability to source, evaluate and integrate acquisitions that we believe has created value for shareholders. Since 2005, we have invested approximately $1.9 billion in strategic acquisitions. We believe there are acquisition candidates that will enable us to expand our capabilities and markets and intend to continue to evaluate acquisitions in a disciplined manner and pursue those that provide attractive opportunities to enhance our growth and profitability.
Valuation for Stock-Based Compensation.
During the year ended December 31, 2011, we granted options to purchase 160,000 shares of our common stock. With respect to those awards, all of which were granted on February 1, 2011, the fair value of the shares of our common stock was approved by our board based on an independent third party appraisal performed as of October 31, 2010 by Corporate Valuation Advisors, Inc. and delivered to us in December 2010. We believe that such appraisal was substantially contemporaneous with our determination of fair value for purposes of such awards and that there were no significant intervening events between the date of the appraisal and the grant date for the awards.
Critical Accounting Policies
The preparation of financial statements in accordance with accounting principles generally accepted in the United States requires the use of estimates and assumptions on the part of management. The estimates and assumptions used by management are based on our historical experiences combined with management’s understanding of current facts and circumstances. Certain of our accounting policies are considered critical as they are both important to the portrayal of our financial condition and results of operations and require significant or complex judgment on the part of management. We believe the following represent our critical accounting policies as contemplated by the Securities and Exchange Commission (“SEC”) Financial Reporting Release No. 60, “Cautionary Advice Regarding Disclosure About Critical Accounting Policies.”
Revenue Recognition. In our Unified Communications segment, our conferencing and collaboration services, event services and IP-based unified communications solutions are generally billed and revenue recognized on a per participant minute basis or per seat basis, and our alerts and notifications services are generally billed, and revenue recognized, on a per message or per minute basis. We also charge clients for additional features, such as conference call recording, transcription services or professional services. Our Communication Services segment recognizes revenue for platform-based and agent-based services in the month that services are performed and services are generally billed based on call duration, hours of input, number of calls or a contingent basis. Emergency communications services revenue within the Communication Services segment is generated primarily from monthly fees based on the number of billing telephone numbers and cell towers covered under contract. In addition, product sales and installations are generally recognized upon completion of the installation and client acceptance of a fully functional system or, for contracts that are completed in stages, recognized upon completion of such stages. As it relates to installation sales, as of January 1, 2010, we early adopted new revenue recognition guidance for multiple element arrangements. For contracts entered into prior to January 1, 2010, revenue associated with advance payments was deferred until the system installations are completed. Costs incurred on uncompleted contracts are accumulated and recorded as deferred costs until the system installations are completed. This guidance was adopted prospectively and specifically for the product sales and installation services for the emergency communications services revenue. Contracts for annual recurring services such as support and maintenance agreements are generally billed in advance and are recognized as revenue ratably (on a monthly basis) over the contractual periods. Nonrefundable up-front fees and related costs are recognized ratably over the term of the contract except in certain instances where the future benefit is linked to the customer relationship, which may necessitate a longer recognition period.
40
Table of Contents
Revenue for contingent collection services and overpayment identification and recovery services is recognized in the month collection payments are received based upon a percentage of cash collected or other agreed upon contractual parameters. In December 2010, we sold the balance of the investment in receivable portfolios and no longer purchase receivables for collection. Prior to the sale, we used either the level-yield method or the cost recovery method to recognize revenue on these purchased receivable portfolios.
Allowance for Doubtful Accounts. Our allowance for doubtful accounts represents reserves for receivables which reduce accounts receivable to amounts expected to be collected. Management uses significant judgment in estimating uncollectible amounts. In estimating uncollectible amounts, management considers factors such as overall economic conditions, industry-specific economic conditions, historical client performance and anticipated client performance. While management believes our processes effectively address our exposure to doubtful accounts, changes in the economy, industry or specific client conditions may require adjustments to the allowance for doubtful accounts.
Goodwill and Intangible Assets. Goodwill and intangible assets, net of accumulated amortization, at December 31, 2011 were $1,762.6 million and $333.1 million, respectively. Management is required to exercise significant judgment in valuing the acquisitions in connection with the initial purchase price allocation and the ongoing evaluation of goodwill and other intangible assets for impairment. The purchase price allocation process requires estimates and judgments as to certain expectations and business strategies. If the actual results differ from the assumptions and judgments made, the amounts recorded in the consolidated financial statements could result in a possible impairment of the intangible assets and goodwill or require acceleration in amortization expense. We test goodwill for impairment at the reporting unit level (operating segment or one level below an operating segment) on an annual basis in the fourth quarter or more frequently if we believe indicators of impairment exist. Goodwill of a reporting unit is tested for impairment between annual tests if an event occurs or circumstances change that would more-likely-than-not reduce the fair value of a reporting unit below its carrying amount. At December 31, 2011, our reporting units were one level below our operating segments. The performance of the impairment test involves a two-step process. The first step of the goodwill impairment test involves comparing the fair values of the applicable reporting units with their aggregate carrying values, including goodwill. We determine the fair value of our reporting units using the discounted cash flow methodology. The discounted cash flow methodology requires us to make key assumptions such as projected future cash flows, growth rates, terminal value and a weighted average cost of capital. If the carrying amount of a reporting unit exceeds the reporting unit’s fair value, we perform the second step of the goodwill impairment test to determine the amount of impairment loss. The second step of the goodwill impairment test involves comparing the implied fair value of the affected reporting unit’s goodwill with the carrying value of that goodwill. We were not required to perform a second step analysis for the year ended December 31, 2011 as the fair value substantially exceeded the carrying value for each of our reporting units in step one. Currently, we do not believe any reporting units are at risk of failing the step one test in the foreseeable future, but if events and circumstances change resulting in significant changes in operations which result in lower actual operating income compared to projected operating income, we will test our reporting unit for impairment prior to our annual impairment test.
Our indefinite-lived intangible assets consist of trade names and their values are assessed separately from goodwill in connection with our annual impairment testing. This assessment is made using the relief-from-royalty method, under which the value of a trade name is determined based on a royalty that could be charged to a third party for using the trade name in question. The royalty, which is based on a reasonable rate applied against forecasted sales, is tax-effected and discounted to present value. The most significant assumptions in this evaluation include estimated future sales, the royalty rate and the after-tax discount rate.
Our finite-lived intangible assets are amortized over their estimated useful lives. Our finite-lived intangible assets are tested for recoverability whenever events or changes in circumstances such as reductions in demand or significant economic slowdowns are present on intangible assets used in operations that may indicate the carrying amount is not recoverable. Reviews are performed to determine whether the carrying value of an asset is recoverable, based on comparisons to undiscounted expected future cash flows. If this comparison indicates that the carrying value is not recoverable, the impaired asset is written down to fair value.
41
Table of Contents
Income Taxes. We recognize current tax liabilities and assets based on an estimate of taxes payable or refundable in the current year for each of the jurisdictions in which we transact business. As part of the determination of our current tax liability, we exercise considerable judgment in evaluating positions we have taken in our tax returns. We have established reserves for probable tax exposures. These reserves, included in long-term tax liabilities, represent our estimate of amounts expected to be paid, which we adjust over time as more information becomes available. We also recognize deferred tax assets and liabilities for the estimated future tax effects attributable to temporary differences (e.g., book depreciation versus tax depreciation). The calculation of current and deferred tax assets and liabilities requires management to apply significant judgment relating to the application of complex tax laws, changes in tax laws or related interpretations, uncertainties related to the outcomes of tax audits and changes in our operations or other facts and circumstances. We must continually monitor changes in these factors. Changes in such factors may result in changes to management estimates and could require us to adjust our tax assets and liabilities and record additional income tax expense or benefits. Our repatriation policy is to look at our foreign earnings on a jurisdictional basis. We have historically determined that the undistributed earnings of our foreign subsidiaries will be repatriated to the United States and accordingly, we have provided a deferred tax liability on such foreign source income. In 2011, we reorganized certain foreign subsidiaries to simplify our business structure, and evaluated our liquidity requirements in the United States and the capital requirements of our foreign subsidiaries. We have determined at December 31, 2011 that a portion of our foreign earnings are indefinitely reinvested, and therefore deferred income taxes have not been provided on such foreign subsidiary earnings.
Results of Operations
The following table shows consolidated results of operations for the periods indicated:
| Year Ended December 31, | ||||||||||||
| 2011 | 2010 | 2009 | ||||||||||
| (in millions) | ||||||||||||
| Consolidated Statement of Operations Data: |
||||||||||||
| Revenue |
$ | 2,491.3 | $ | 2,388.2 | $ | 2,375.7 | ||||||
| Cost of services |
1,113.3 | 1,057.0 | 1,067.8 | |||||||||
| Selling, general and administrative |
909.9 | 911.0 | 907.3 | |||||||||
|
|
|
|
|
|
|
|||||||
| Operating income |
468.1 | 420.2 | 400.6 | |||||||||
| Interest expense |
(269.9 | ) | (252.7 | ) | (254.1 | ) | ||||||
| Refinancing expense |
— | (52.8 | ) | — | ||||||||
| Other income (expense) |
6.3 | 6.1 | 1.4 | |||||||||
|
|
|
|
|
|
|
|||||||
| Income before income tax expense |
204.5 | 120.8 | 147.9 | |||||||||
| Income tax expense |
77.0 | 60.5 | 56.9 | |||||||||
|
|
|
|
|
|
|
|||||||
| Net income |
127.5 | 60.3 | 91.0 | |||||||||
| Less net income (loss)—noncontrolling interest |
— | — | 2.8 | |||||||||
|
|
|
|
|
|
|
|||||||
| Net income—West Corporation |
$ | 127.5 | $ | 60.3 | $ | 88.2 | ||||||
|
|
|
|
|
|
|
|||||||
| Earning (loss) per common share: |
||||||||||||
| Basic Class L shares |
$ | 17.18 | $ | 17.07 | $ | 17.45 | ||||||
| Diluted Class L shares |
$ | 16.48 | $ | 16.37 | $ | 16.67 | ||||||
| Basic Common |
$ | (0.50 | ) | $ | (1.25 | ) | $ | (0.98 | ) | |||
| Diluted Common |
$ | (0.50 | ) | $ | (1.25 | ) | $ | (0.98 | ) | |||
Years Ended December 31, 2011 and 2010
Revenue: Total revenue in 2011 increased $103.1 million, or 4.3%, to $2,491.3 million from $2,388.2 million in 2010. This increase included revenue of $76.5 million from entities acquired since January 1, 2011. Acquisitions made in 2011 were TFCC, Preferred One Stop Technologies Limited (“POSTcti”), Unisfair, Smoothstone, Contact One, Inc. (“Contact One”) and Pivot Point Solutions, LLC (“Pivot Point”). These acquisitions closed on February 1, February 1, March 1, June 3, June 7 and August 10, respectively. Pivot Point’s
42
Table of Contents
and Contact One’s results have been included in the Communication Services segment since their respective acquisition dates. All of the other acquisitions made in 2011 have been included in the Unified Communications segment since their respective acquisition dates.
During the years ended December 31, 2011 and 2010, our largest 100 clients represented approximately 55% and 57% of total revenue, respectively. The aggregate revenue from our largest client, AT&T, as a percentage of our total revenue in 2011 and 2010 was approximately 10% and 11%, respectively. No other client accounted for more than 10% of our total revenue in 2011 or 2010.
Revenue by business segment:
| For the year ended December 31, | ||||||||||||||||||||||||
| 2011 | % of Total Revenue |
2010 | % of Total Revenue |
Change | % Change | |||||||||||||||||||
| Revenue in thousands: |
||||||||||||||||||||||||
| Unified Communications |
$ | 1,364,032 | 54.8 | % | $ | 1,220,216 | 51.1 | % | $ | 143,816 | 11.8 | % | ||||||||||||
| Communication Services |
1,137,900 | 45.7 | % | 1,173,945 | 49.2 | % | (36,045 | ) | -3.1 | % | ||||||||||||||
| Intersegment eliminations |
(10,607 | ) | -0.5 | % | (5,950 | ) | -0.3 | % | (4,657 | ) | 78.3 | % | ||||||||||||
|
|
|
|
|
|
|
|
|
|
|
|
|
|||||||||||||
| Total |
$ | 2,491,325 | 100.0 | % | $ | 2,388,211 | 100.0 | % | $ | 103,114 | 4.3 | % | ||||||||||||
|
|
|
|
|
|
|
|
|
|
|
|
|
|||||||||||||
Unified Communications revenue in 2011 increased $143.8 million, or 11.8%, to $1,364.0 million from $1,220.2 million in 2010. The increase in revenue included $66.1 million from acquisitions. The remaining $77.7 million increase was primarily attributable to the addition of new customers as well as an increase in usage primarily of our web and audio-based services by our existing customers. Revenue attributable to increased usage and new customer usage was partially offset by a decline in the rates charged to existing customers for those services. The volume of minutes used for our reservationless services, which accounts for the majority of our Unified Communications revenue, grew approximately 11.1% in 2011 over 2010, while the average rate per minute for reservationless services declined by approximately 4.2%.
Our Unified Communications revenue is also experiencing organic growth at a faster pace internationally than in North America. During 2011, revenue in the Asia Pacific (“APAC”) and Europe, Middle East and Africa (“EMEA”) regions grew to $441.0 million, an increase of 15.0% over 2010.
Communication Services revenue in 2011 decreased $36.0 million, or 3.1%, to $1,137.9 million from $1,173.9 million in 2010. Revenue from agent-based services for 2011 decreased $26.8 million compared with revenue for 2010. We exited the purchase paper receivables management business in 2010, which represents $14.4 million of this decrease. The direct response agent revenue declined $12.1 million. We expect the decrease in direct response agent service volume to continue for the foreseeable future, but at a lower rate. Partially offsetting the reduction in revenue in 2011 was revenue from acquired entities of $10.3 million.
Cost of Services: Cost of services consists of direct labor, telephone expense and other costs directly related to providing services to clients. Cost of services in 2011 increased $56.3 million, or 5.3%, to $1,113.3 million from $1,057.0 million in 2010. Cost of services from acquired entities was $34.3 million. As a percentage of revenue, cost of services increased to 44.7% in 2011 from 44.3% in 2010.
Cost of Services by business segment:
| For the year ended December 31, | ||||||||||||||||||||||||
| 2011 | % of Revenue | 2010 | % of Revenue | Change | % Change | |||||||||||||||||||
| Cost of services in thousands: |
||||||||||||||||||||||||
| Unified Communications |
$ | 558,267 | 40.9 | % | $ | 492,263 | 40.3 | % | $ | 66,004 | 13.4 | % | ||||||||||||
| Communication Services |
563,831 | 49.6 | % | 569,110 | 48.5 | % | (5,279 | ) | -0.9 | % | ||||||||||||||
| Intersegment eliminations |
(8,809 | ) | NM | (4,365 | ) | NM | (4,444 | ) | 101.8 | % | ||||||||||||||
|
|
|
|
|
|
|
|
|
|
|
|
|
|||||||||||||
| Total |
$ | 1,113,289 | 44.7 | % | $ | 1,057,008 | 44.3 | % | $ | 56,281 | 5.3 | % | ||||||||||||
|
|
|
|
|
|
|
|
|
|
|
|
|
|||||||||||||
43
Table of Contents
NM—Not Meaningful
Unified Communications cost of services in 2011 increased $66.0 million, or 13.4%, to $558.3 million from $492.3 million in 2010. Cost of services from acquired entities increased cost of services by $32.1 million. The remaining increase is primarily driven by increased service volume. As a percentage of this segment’s revenue, Unified Communications cost of services increased to 40.9% in 2011 from 40.3% in 2010. The increase in cost of services as a percentage of revenue for 2011 is due primarily to changes in the product mix, geographic mix and the impact of acquired entities.
Communication Services cost of services in 2011 decreased $5.3 million, or 0.9%, to $563.8 million from $569.1 million in 2010. The decrease in cost of services was the result of lower revenue in the segment, partially offset by $2.2 million of additional costs from acquired entities. As a percentage of revenue, Communication Services cost of services increased to 49.6% in 2011 from 48.5% in 2010. The increase in cost of services as a percentage of revenue in 2011 is due to declines in revenue rates for agent-based services.
Selling, General and Administrative Expenses: SG&A expenses in 2011 decreased $1.1 million, or 0.1%, to $909.9 million from $911.0 million for 2010. The decrease in SG&A expenses in 2011 reflected an improvement in our SG&A expense margin that was partially offset by $47.0 million of additional SG&A expenses from acquired entities and $18.5 million of share based compensation recorded as a result of modifying the vesting of restricted stock awards. During 2010, the Company identified impairment indicators in one of our reporting units, our traditional direct response business (marketed as “West Direct”). As a result of these impairment indicators and the results of impairment tests performed using the discounted cash flows model, goodwill with a carrying value of $37.7 million was written down to its fair value of zero. As a percentage of revenue, SG&A expenses decreased to 36.5% in 2011 from 38.1% in 2010. Without the impairment, SG&A expense was 36.5% of revenue in 2010.
Selling, general and administrative expenses by business segment:
| For the year ended December 31, | ||||||||||||||||||||||||
| 2011 | % of Revenue | 2010 | % of Revenue | Change | % Change | |||||||||||||||||||
| SG&A in thousands: |
||||||||||||||||||||||||
| Unified Communications |
$ | 442,539 | 32.4 | % | $ | 407,543 | 33.4 | % | $ | 34,996 | 8.6 | % | ||||||||||||
| Communication Services |
469,167 | 41.2 | % | 505,064 | 43.0 | % | (35,897 | ) | -7.1 | % | ||||||||||||||
| Intersegment eliminations |
(1,798 | ) | NM | (1,585 | ) | NM | (213 | ) | NM | |||||||||||||||
|
|
|
|
|
|
|
|
|
|
|
|
|
|||||||||||||
| Total |
$ | 909,908 | 36.5 | % | $ | 911,022 | 38.1 | % | $ | (1,114 | ) | -0.1 | % | |||||||||||
|
|
|
|
|
|
|
|
|
|
|
|
|
|||||||||||||
NM—Not meaningful
Unified Communications SG&A expenses in 2011 increased $35.0 million, or 8.6%, to $442.5 million from $407.5 million in 2010. The increase in SG&A expenses in 2011 reflected an improvement in our SG&A expense margin that was offset by $37.5 million of additional SG&A expenses from acquired entities. As a percentage of this segment’s revenue, Unified Communications SG&A expenses in 2011 improved to 32.4% from 33.4% in 2010.
Communication Services SG&A expenses in 2011 decreased $35.9 million, or 7.1%, to $469.2 million from $505.1 million in 2010. The decrease in SG&A expenses in 2011 reflected an improvement in our SG&A expense margin that was partially offset by $9.5 million of additional SG&A expenses from acquired entities. SG&A expenses for this segment in 2010 included the $37.7 million goodwill impairment charge described above. As a percentage of this segment’s revenue, Communication Services SG&A expenses improved to 41.2% in 2011 from 43.0% in 2010. The impact of the impairment charge on Communication Services SG&A as a percentage of revenue was 320 basis points in 2010.
44
Table of Contents
Operating Income: Operating income in 2011 increased by $47.9 million, or 11.4%, to $468.1 million from $420.2 million in 2010. As a percentage of revenue, operating income increased to 18.8% in 2011 from 17.6% in 2010.
Operating income by business segment:
| For the year ended December 31, | ||||||||||||||||||||||||
| 2011 | % of Revenue |
2010 | % of Revenue |
Change | % Change |
|||||||||||||||||||
| Operating income in thousands: |
||||||||||||||||||||||||
| Unified Communications |
$ | 363,226 | 26.6 | % | $ | 320,411 | 26.3 | % | $ | 42,815 | 13.4 | % | ||||||||||||
| Communication Services |
104,902 | 9.2 | % | 99,770 | 8.5 | % | 5,132 | 5.1 | % | |||||||||||||||
|
|
|
|
|
|
|
|
|
|
|
|
|
|||||||||||||
| Total |
$ | 468,128 | 18.8 | % | $ | 420,181 | 17.6 | % | $ | 47,947 | 11.4 | % | ||||||||||||
|
|
|
|
|
|
|
|
|
|
|
|
|
|||||||||||||
Unified Communications operating income in 2011 increased $42.8 million, or 13.4%, to $363.2 million from $320.4 million in 2010. As a percentage of this segment’s revenue, Unified Communications operating income improved to 26.6% in 2011 from 26.3% in 2010 due to the factors discussed above for revenue, cost of services and SG&A expenses.
Communication Services operating income in 2011 increased $5.1 million, or 5.1%, to $104.9 million from $99.8 million in 2010. As a percentage of revenue, Communication Services operating income improved to 9.2% in 2011 from 8.5% in 2010 due to the factors discussed above for revenue, cost of services and SG&A expenses.
The impact of the 2010 impairment charge on Communication Services operating income as a percentage of revenue was 320 basis points.
Other Income (Expense): Other income (expense) includes interest expense from borrowings under credit facilities and outstanding notes, the aggregate foreign exchange gain (loss) on affiliate transactions denominated in currencies other than the functional currency, interest income and, in 2010, refinancing expenses. Other expense in 2011 was $263.6 million compared to $299.4 million in 2010. Interest expense in 2011 was $269.9 million compared to $252.7 million in 2010. In 2010, refinancing expense of $52.8 million included $33.4 million for the redemption call premium and related costs of redeeming the 9.5% Senior Notes due 2014 (the “2014 Senior Notes”) and $19.4 million for accelerated debt amortization costs on the amended and extended Senior Secured Term Loan Facility. Proceeds from the issuance of $500.0 million aggregate principal amount of 8 5/8% Senior Notes due 2018 (the “2018 Senior Notes”) were utilized to partially pay the Senior Secured Term Loan Facility due 2013. Proceeds from the issuance of $650.0 million aggregate principal amount of 7 7/8% Senior Notes due 2019 (the “2019 Senior Notes”) were utilized to finance the repurchase of the Company’s outstanding $650 million aggregate principal amount of 2014 Senior Notes.
Net Income: Our net income in 2011 increased $67.2 million, or 111.4%, to $127.5 million from $60.3 million in 2010. The increase in net income was due to the factors discussed above for revenue, cost of services, SG&A expense and other income (expense). Net income includes a provision for income tax expense at an effective rate of approximately 37.7% for 2011, compared to an effective tax rate of approximately 50.1% in 2010. The effective tax rate was higher in 2010 when compared to 2011 due primarily to the goodwill impairment charge taken in 2010, which was not deductible for income tax purposes.
Earnings (Loss) per common share: Earnings per Common L share—basic for 2011 increased $0.11, to $17.18, from $17.07 in 2010. Earnings per Common L share—diluted for 2011 increased $0.11, to $16.48, from $16.37 in 2010. Loss per Common share—basic and diluted for 2011 decreased $0.75, to ($0.50), from ($1.25) in 2010. The decrease in (loss) per share was primarily the result of an increase in net income attributable to the common shares due to our increased earnings in 2011.
45
Table of Contents
On December 30, 2011, we completed the conversion of our outstanding Class L Common Stock into shares of Class A Common Stock and thereafter the reclassification of all of our Class A Common Stock as a single class of Common Stock. As a result earnings per share calculations in future periods will be presented as a single class of Common Stock and references to Class A common stock have been changed to common stock for all periods.
Years Ended December 31, 2010 and 2009
Revenue: Total revenue in 2010 increased $12.5 million, or 0.5%, to $2,388.2 million from $2,375.7 million in 2009. This increase included net revenue of $19.3 million from entities acquired or sold, $31.7 million for acquired entities, less $12.4 million for an entity sold. Acquisitions made in 2010 were of Stream57 assets, SKT, Holly, TuVox and Specialty Pharmacy Network. These acquisitions closed on December 31, 2009, April 1, 2010, June 1, 2010, July 21, 2010 and November 9, 2010, respectively. Revenue from agent-based services decreased $83.8 million in 2010, including a $5.5 million reduction in purchased paper revenue compared to 2009. During 2009, the Communication Services segment recorded impairment charges of $25.5 million to establish a valuation allowance against the carrying value of portfolio receivables. During 2010, no valuation allowance was required or recorded.
During the years ended December 31, 2010 and 2009, our largest 100 clients represented approximately 57% and 56% of total revenue, respectively. The aggregate revenue from our largest client, AT&T, as a percentage of our total revenue in 2010 and 2009 was approximately 11% and 12%, respectively. No other client accounted for more than 10% of our total revenue in 2010 or 2009.
Revenue by business segment:
| For the year ended December 31, | ||||||||||||||||||||||||
| 2010 | % of
Total Revenue |
2009 | % of
Total Revenue |
Change | % Change | |||||||||||||||||||
| Revenue in thousands: |
||||||||||||||||||||||||
| Unified Communications |
$ | 1,220,216 | 51.1 | % | $ | 1,126,544 | 47.4 | % | $ | 93,672 | 8.3 | % | ||||||||||||
| Communication Services |
1,173,945 | 49.2 | % | 1,254,547 | 52.8 | % | (80,602 | ) | -6.4 | % | ||||||||||||||
| Intersegment eliminations |
(5,950 | ) | -0.3 | % | (5,343 | ) | -0.2 | % | (607 | ) | 11.4 | % | ||||||||||||
|
|
|
|
|
|
|
|
|
|
|
|
|
|||||||||||||
| Total |
$ | 2,388,211 | 100.0 | % | $ | 2,375,748 | 100.0 | % | $ | 12,463 | 0.5 | % | ||||||||||||
|
|
|
|
|
|
|
|
|
|
|
|
|
|||||||||||||
Unified Communications revenue in 2010 increased $93.7 million, or 8.3%, to $1,220.2 million from $1,126.5 million in 2009. The increase in revenue included $23.3 million from the acquisition of Stream57 assets and SKT Business Communication Solutions division. The remaining $70.4 million increase was attributable primarily to the addition of new customers as well as an increase in usage primarily of our web and audio-based services by our existing customers. Revenue attributable to increased usage and new customer usage was partially offset by a decline in the rates charged to existing customers for those services. The volume of minutes used for our Reservationless Services, which accounts for the majority of our Unified Communications revenue, grew approximately 16% in 2010, while the average rate per minute for Reservationless Services declined by approximately 10%. In addition, Alerts and Notifications Services revenue increased $11.9 million, or 16.7%, due primarily to volume growth as a result of an increase in our customer base. Since we entered the conferencing services business, the average rate per minute that we charge has declined while total minutes sold has increased. This is consistent with industry trends which we expect to continue for the foreseeable future. Our Unified Communications revenue is also experiencing organic growth at a faster pace internationally than in North America. During 2010, revenue in the Asia Pacific (“APAC”) and Europe, Middle East and Africa (“EMEA”) regions grew to $383.5 million, an increase of 14.3% over 2009, representing $48.0 million, or 68%, of our organic growth in 2010.
46
Table of Contents
Communication Services revenue in 2010 decreased $80.6 million, or 6.4%, to $1,173.9 million from $1,254.5 million in 2009. The decrease in revenue in 2010 is primarily the result of decreased revenue from our agent-based services, including a $64.5 million reduction in our consumer-based agent services, a $35.2 million reduction in our direct response agent services and a $5.5 million reduction in revenue from purchased paper operations resulting from our decision in 2009 to discontinue portfolio receivable purchases. The decrease in our consumer-based agent services was a result of reduced call volume associated with weak economic conditions and a movement of call volume from domestic to foreign locations, having lower rates, a trend that we expect to continue for the foreseeable future, and the decrease in direct response agent services, consistent with the trend over the past few years, which we expect to continue for the foreseeable future, but at a lower rate. Our Communication Services revenues were further reduced in 2010 by $12.4 million as a result of a sale of our Public Safety CAD business in December of 2009. Partially offsetting these revenue reductions in our consumer based customer service revenue and our traditional direct response business was an $18.9 million net increase in our business-to-business services ($24.4 million net of the $5.5 million reduction in revenue from purchased paper operations described above), which resulted from an increase in our customer base as well as volume growth from existing customers, as well as $12.6 million of other improvements in the Communication Services business.
Cost of Services: Cost of services consists of direct labor, telephone expense and other costs directly related to providing services to clients. Cost of services in 2010 decreased $10.8 million, or 1.0%, to $1,057.0 million from $1,067.8 million in 2009. Cost of services from entities acquired or sold was $0.5 million. As a percentage of revenue, cost of services decreased to 44.2% for 2010 from 44.9% in 2009.
Cost of Services by business segment:
| For the year ended December 31, | ||||||||||||||||||||||||
| 2010 | % of Revenue | 2009 | % of Revenue | Change | % Change | |||||||||||||||||||
| Cost of services in thousands: |
||||||||||||||||||||||||
| Unified Communications |
$ | 492,263 | 40.3 | % | $ | 422,189 | 37.5 | % | $ | 70,074 | 16.6 | % | ||||||||||||
| Communication Services |
569,110 | 48.5 | % | 649,195 | 51.7 | % | (80,085 | ) | -12.3 | % | ||||||||||||||
| Intersegment eliminations |
(4,365 | ) | NM | (3,607 | ) | NM | (758 | ) | 21.0 | % | ||||||||||||||
|
|
|
|
|
|
|
|
|
|
|
|
|
|||||||||||||
| Total |
$ | 1,057,008 | 44.3 | % | $ | 1,067,777 | 44.9 | % | $ | (10,769 | ) | -1.0 | % | |||||||||||
|
|
|
|
|
|
|
|
|
|
|
|
|
|||||||||||||
NM—Not Meaningful
Unified Communications cost of services in 2010 increased $70.1 million, or 16.6%, to $492.3 million from $422.2 million in 2009. Cost of services from acquired entities increased cost of services by $12.1 million. The remaining increase is primarily driven by increased service volume. As a percentage of this segment’s revenue, Unified Communications cost of services increased to 40.3% in 2010 from 37.5% in 2009, primarily due to changes in the product and geographic mix.
Communication Services cost of services in 2010 decreased $80.1 million, or 12.3%, to $569.1 million from $649.2 million in 2009. The decrease is primarily driven by decreased service volume. As a percentage of revenue, Communication Services cost of services decreased to 48.5% in 2010 from 51.7% in 2009. The impact of the valuation allowance on Communication Services cost of services as a percentage of revenue in 2009 was 100 basis points.
Selling, General and Administrative Expenses: SG&A expenses in 2010 increased $3.7 million, or 0.4%, to $911.0 million from $907.4 million for 2009. The increase included $17.8 million of additional expense from acquired entities. During 2010, the Company identified impairment indicators in one of our reporting units, our traditional direct response business (marketed as “West Direct”). As a result of these impairment indicators and the results of impairment tests performed using the discounted cash flows model, goodwill with a carrying value of $37.7 million was written down to their fair value of zero. The impairment primarily resulted from the decline
47
Table of Contents
in revenue in 2010 and continued general decline in the direct response business. These events caused us to revise downward our projected future cash flows for this reporting unit. As a percentage of revenue, SG&A expenses decreased to 38.1% in 2010 from 38.2% in 2009. Without the impairment, SG&A expense was 36.5% of revenue in 2010.
Selling, general and administrative expenses by business segment:
| For the year ended December 31, | ||||||||||||||||||||||||
| 2010 | % of Revenue |
2009 | % of Revenue |
Change | % Change |
|||||||||||||||||||
| SG&A in thousands: |
||||||||||||||||||||||||
| Unified Communications |
$ | 407,543 | 33.4 | % | $ | 408,258 | 36.2 | % | $ | (715 | ) | -0.2 | % | |||||||||||
| Communication Services |
505,064 | 43.0 | % | 500,835 | 39.9 | % | 4,229 | 0.8 | % | |||||||||||||||
| Intersegment eliminations |
(1,585 | ) | NM | (1,735 | ) | NM | 150 | NM | ||||||||||||||||
|
|
|
|
|
|
|
|
|
|
|
|
|
|||||||||||||
| Total |
$ | 911,022 | 38.1 | % | $ | 907,358 | 38.2 | % | $ | 3,664 | 0.4 | % | ||||||||||||
|
|
|
|
|
|
|
|
|
|
|
|
|
|||||||||||||
NM—Not meaningful
Unified Communications SG&A expenses in 2010 decreased $0.7 million, or 0.2%, to $407.5 million from $408.3 million in 2009. SG&A expenses for the segment in 2010 included $11.4 million from acquisitions. As a percentage of this segment’s revenue, Unified Communications SG&A expenses in 2010 decreased to 33.4% from 36.2% in 2009.
Communication Services SG&A expenses in 2010 increased $4.2 million, or 0.8%, to $505.1 million from $500.8 million in 2009. SG&A expenses for the segment in 2010 included a $37.7 million goodwill impairment charge and $6.4 million from acquisitions. As a percentage of this segment’s revenue, Communication Services SG&A expenses increased to 43.0% in 2010 from 39.9% in 2009. The impact of the impairment charge on Communication Services SG&A as a percentage of revenue was 320 basis points for 2010. The impact of the valuation allowance on SG&A expenses as a percentage of revenue in 2009 was 80 basis points.
Operating Income: Operating income in 2010 increased by $19.6 million, or 4.9%, to $420.2 million from $400.6 million in 2009. As a percentage of revenue, operating income increased to 17.6% in 2010 from 16.9% in 2009.
Operating income by business segment:
| For the year ended December 31, | ||||||||||||||||||||||||
| 2010 | % of Revenue |
2009 | % of Revenue |
Change | % Change |
|||||||||||||||||||
| Operating income in thousands: |
||||||||||||||||||||||||
| Unified Communications |
$ | 320,411 | 26.3 | % | $ | 296,096 | 26.3 | % | $ | 24,315 | 8.2 | % | ||||||||||||
| Communication Services |
99,770 | 8.5 | % | 104,517 | 8.3 | % | (4,747 | ) | -4.5 | % | ||||||||||||||
|
|
|
|
|
|
|
|
|
|
|
|
|
|||||||||||||
| Total |
$ | 420,181 | 17.6 | % | $ | 400,613 | 16.9 | % | $ | 19,568 | 4.9 | % | ||||||||||||
|
|
|
|
|
|
|
|
|
|
|
|
|
|||||||||||||
Unified Communications operating income in 2010 increased $24.3 million, or 8.2%, to $320.4 million from $296.1 million in 2009. As a percentage of this segment’s revenue, Unified Communications operating income was 26.3% in both 2010 and 2009.
Communication Services operating income in 2010 decreased $4.7 million, or 4.5%, to $99.8 million from $104.5 million in 2009. As a percentage of revenue, Communication Services operating income increased to 8.5% in 2010 from 8.3% in 2009. The impact of the impairment charge on Communication Services operating income as a percentage of revenue was 320 basis points in 2010. The impact of the valuation allowance on operating income as a percentage of revenue in 2009 was 190 basis points.
48
Table of Contents
Other Income (Expense): Other income (expense) includes interest expense from short-term and long-term borrowings under credit facilities, refinancing expenses, the aggregate gain (loss) on debt transactions denominated in currencies other than the functional currency, sub-lease rental income and interest income. Other expense in 2010 was $299.4 million compared to $252.8 million in 2009. Interest expense in 2010 was $252.7 million compared to $254.1 million in 2009. Refinancing expense of $52.8 million includes $33.4 million for the redemption call premium and related costs of redeeming the 9.5% Senior Notes due 2014 (the “2014 Senior Notes”) and $19.4 million for accelerated debt amortization costs on the amended and extended Senior Secured Term Loan Facility. Proceeds from the issuance of $500.0 million aggregate principal amount of 8 5/8% Senior Notes due 2018 (the “2018 Senior Notes”) were utilized to partially pay the Senior Secured Term Loan Facility due 2013. Proceeds from the issuance of $650.0 million aggregate principal amount of 7 7/8% Senior Notes due 2019 (the “2019 Senior Notes”) were utilized to finance the repurchasing of the Company’s outstanding $650 million aggregate principal amount of 2014 Senior Notes.
During 2010 and 2009, interest expense was reduced by $3.7 million and $6.4 million, respectively, due to an interest rate swap agreement no longer qualifying as a hedging instrument for accounting purposes.
Noncontrolling interest income (loss): We did not incur any non-controlling interest income or loss in 2010 compared to income attributable to non-controlling interest of $2.7 million in 2009. In December 2010, we sold the balance of the investment in receivable portfolios and no longer participate in purchased receivables collection. As a result of this sale, none of our subsidiaries has noncontrolling interest ownership structures. During the fourth quarter of 2009, a settlement was reached in litigation among two of our formerly majority-owned subsidiaries and one of our former portfolio receivable lenders which held non-controlling interests in such subsidiaries. As a result of this 2009 settlement, we purchased the non-controlling interest of one of the former majority-owned subsidiaries and we abandoned our interest in the other majority-owned subsidiary.
Net Income—West Corporation: Our net income in 2010 decreased $27.9 million, or 31.7%, to $60.3 million from $88.2 million in 2009. The decrease in net income was due to the factors discussed above for revenue, cost of services, SG&A expense and other income (expense). Net income includes a provision for income tax expense at an effective rate (income tax expense divided by income before income tax and noncontrolling interest) of approximately 50.1% for 2010, compared to an effective tax rate of approximately 38.4% in 2009. The effective tax rate was higher in 2010 when compared to 2009 due primarily to the goodwill impairment charge taken in 2010, which was not deductible for income tax purposes.
Earnings (Loss) per common share: Earnings per Common L share—basic for 2010 decreased $0.38, to $17.07, from $17.45 in 2009. Earnings per Common L share—diluted for 2010 decreased $0.30, to $16.37, from $16.67 in 2009. The decrease in earnings per share was primarily the result of decreased net income attributable to Class L Common shares. Loss per Common share—basic and diluted for 2010 increased $0.27, to ($1.25), from ($0.98) for 2009. The increase in (loss) per share was primarily the result of a decrease in net income attributable to the Common shares due to our decreased earnings in 2010.
49
Table of Contents
Quarterly Results of Operations
Revenue in our segments is not significantly seasonal.
The following table presents a summary of our unaudited quarterly results of operations for our last ten completed fiscal quarters (in thousands):
| Three Months Ended | Three Months Ended | Three Months Ended | ||||||||||||||||||||||||||||||||||||||
| September
30, 2009(1) |
December 31, 2009 |
March 31, 2010 |
June 30, 2010 |
September
30, 2010(2) |
December
31, 2010(3) |
March 31, 2011 |
June 30, 2011 |
September 30, 2011 |
December 31, 2011 |
|||||||||||||||||||||||||||||||
| Revenue |
$ | 559,012 | $ | 602,870 | $ | 599,821 | $ | 596,549 | $ | 592,410 | $ | 599,431 | $ | 610,818 | $ | 622,820 | $ | 632,803 | $ | 624,884 | ||||||||||||||||||||
| Cost of services |
260,570 | 268,889 | 260,823 | 263,433 | 259,723 | 273,029 | 271,603 | 276,220 | 284,406 | 281,060 | ||||||||||||||||||||||||||||||
| SG&A |
221,428 | 226,583 | 221,753 | 214,639 | 258,818 | 215,812 | 220,408 | 223,849 | 216,450 | 249,201 | ||||||||||||||||||||||||||||||
|
|
|
|
|
|
|
|
|
|
|
|
|
|
|
|
|
|
|
|
|
|||||||||||||||||||||
| Operating income |
77,014 | 107,398 | 117,245 | 118,477 | 73,869 | 110,590 | 118,807 | 122,751 | 131,947 | 94,623 | ||||||||||||||||||||||||||||||
|
|
|
|
|
|
|
|
|
|
|
|
|
|
|
|
|
|
|
|
|
|||||||||||||||||||||
| Net income (loss)—West Corporation |
$ | 3,896 | $ | 27,274 | $ | 36,003 | $ | 36,293 | $ | (8,429 | ) | $ | (3,563 | ) | $ |
34,580 |
|
$ | 34,378 | $ | 37,347 | $ | 21,188 | |||||||||||||||||
|
|
|
|
|
|
|
|
|
|
|
|
|
|
|
|
|
|
|
|
|
|||||||||||||||||||||
| Earnings (loss) per common share |
||||||||||||||||||||||||||||||||||||||||
| Basic Class L |
$ | 3.63 | $ | 6.44 | $ | 3.97 | $ | 4.13 | $ | 4.31 | $ | 4.66 | $ | 4.39 | $ | 4.58 | $ | 4.81 | $ | 3.40 | ||||||||||||||||||||
| Diluted Class L |
$ | 3.47 | $ | 6.12 | $ | 3.81 | $ | 3.96 | $ | 4.13 | $ | 4.47 | $ | 4.21 | $ | 4.39 | $ | 4.62 | $ | 3.26 | ||||||||||||||||||||
| Basic Class A |
$ | (0.37 | ) | $ | (0.42 | ) | $ | (0.04 | ) | $ | (0.06 | ) | $ | (0.58 | ) | $ | (0.57 | ) | $ | (0.11 | ) | $ |
(0.13 |
) |
$ | (0.12 | ) | $ | 0.14 | |||||||||||
| Diluted Class A |
$ | (0.37 | ) | $ | (0.42 | ) | $ | (0.04 | ) | $ | (0.06 | ) | $ | (0.58 | ) | $ | (0.57 | ) | $ | (0.11 | ) | $ | (0.13 | ) | $ | (0.12 | ) | $ | 0.14 | |||||||||||
| (1) | Results of operations in the third quarter 2009 were affected by the Communication Services segment recording an impairment charge in the amount of $25.5 million to establish a valuation allowance against the carrying value of portfolio receivables. |
| (2) | Results in the third quarter of 2010 were affected by the Communication Services segment recording a $37.7 million goodwill impairment charge which was not deductible for tax purposes. |
| (3) | Net loss in the fourth quarter of 2010 was affected by $52.8 million of pre-tax refinancing expense. |
| (4) | Results of operations in the fourth quarter of 2011 were affected by a pre-tax $18.5 million share based compensation expense for the modification of vesting criteria of restricted stock grants. $12.1 million was not deductible for tax purposes. |
Liquidity and Capital Resources
We have historically financed our operations and capital expenditures primarily through cash flows from operations supplemented by borrowings under our senior secured credit and asset securitization facilities.
On October 5, 2010, we issued $500.0 million aggregate principal amount of senior unsecured notes due 2018. Proceeds of the notes were used to pay off a portion of our senior secured term loan facility.
On October 5, 2010, we amended and restated our credit agreement, which modified our senior secured credit facilities in several respects, including providing for the following:
| • | Extending the maturity of approximately $158 million of our $250 million senior secured revolving credit facility (and securing approximately $43 million of additional senior secured revolving credit facility commitments for the extended term) from October 2012 to January 2016 with the interest rate margins of such extended maturity revolving credit loans increasing by 1.00 percent; |
| • | Extending the maturity of $500 million of our senior secured term loan facility from October 2013 to July 2016 with the interest rate margins of such extended senior secured term loan facility increasing by 1.875 percent; |
| • | Increasing the interest rate margins of approximately $985 million of our senior secured term loans due July 2016 by 0.375 percent to match interest rate margins for the newly extended senior secured term loans; and |
| • | Modifying the step-down schedule in the current financial covenants and certain covenant baskets. |
On November 24, 2010, we issued $650.0 million aggregate principal amount of 7 7/8% senior notes due 2019, and used the gross proceeds to repurchase our $650 million aggregate principal amount of 9 1/2% senior notes due 2014.
50
Table of Contents
On September 12, 2011, our revolving trade accounts receivable financing facility was amended and extended. The amended and extended facility provides an additional $25.0 million of available financing for a total of $150.0 million and is extended to September 12, 2014, reduces the unused commitment fee by 25 basis points to 50 basis points and lowers the LIBOR spread on borrowings by 150 basis points to 175 basis points.
Our current and anticipated uses of our cash, cash equivalents and marketable securities are to fund operating expenses, acquisitions, capital expenditures, interest payments, tax payments and the repayment of principal on debt.
Year Ended December 31, 2011 compared to 2010
The following table summarizes our cash flows by category for the periods presented (in thousands):
| For the Years Ended December 31, | ||||||||||||||||
| 2011 | 2010 | Change | % Change |
|||||||||||||
| Cash flows from operating activities |
$ | 348,187 | $ | 312,829 | $ | 35,358 | 11.3 | % | ||||||||
| Cash flows used in investing activities |
$ | (329,441 | ) | $ | (137,896 | ) | $ | (191,545 | ) | 138.9 | % | |||||
| Cash flows used in financing activities |
$ | (23,180 | ) | $ | (133,651 | ) | $ | 110,471 | -82.7 | % | ||||||
Net cash flows from operating activities in 2011 increased $35.4 million, or 11.3%, to $348.2 million compared to net cash flows from operating activities of $312.8 million in 2010. The increase in net cash flows from operating activities is primarily due to improvement in operating income.
Days sales outstanding (“DSO”), a key performance indicator that we utilize to monitor the accounts receivable average collection period and assess overall collection risk, was 61 days at December 31, 2011. Throughout 2011, DSO ranged from 58 to 62 days. At December 31, 2010, DSO was 56 days and ranged from 56 to 62 days during 2010.
Net cash flows used in investing activities in 2011 increased $191.5 million, or 138.9%, to $329.4 million compared to net cash flows used in investing activities of $137.9 million in 2010. In 2011, business acquisition investing was $178.1 million greater than in 2010, due primarily to the acquisitions of TFCC and Smoothstone. We invested $117.9 million in capital expenditures during 2011 compared to $118.2 million invested in 2010.
Net cash flows used in financing activities in 2011 decreased $110.5 million or 82.7%, to $23.2 million compared to net cash flows used in financing activities of $133.7 million for 2010. During 2010, net cash flows used in financing activities primarily included payments on our revolving credit facility of $72.9 million, which paid off the outstanding balance on our revolving credit facilities. At December 31, 2011, there was no outstanding balance on the senior secured revolving credit facility. Also, in 2010 we incurred $31.1 million in debt issuance costs relating to our refinancing activities.
On November 24, 2011, we entered into a Securities Purchase Agreement pursuant to which we agreed to purchase all of the outstanding equity of HyperCube LLC for approximately $76.6 million. The purchase price will be funded with proceeds from our revolving credit facilities and cash on hand. The acquisition is expected to close prior to the end of the first quarter of 2012 after satisfaction of certain closing conditions, including customary regulatory approvals. We expect this transaction to be accretive to our leverage ratio.
As of December 31, 2011, the amount of cash and cash equivalents held by our foreign subsidiaries was $83.6 million. We have also accrued U.S. taxes on $145.4 million of unremitted foreign earnings and profits. Our intent is to permanently reinvest a portion of these funds outside the U.S. for acquisitions and capital expansion, and to repatriate a portion of these funds. Based on our current projected capital needs and the current amount of cash and cash equivalents held by our foreign subsidiaries, we do not anticipate incurring any material tax costs beyond our accrued tax position in connection with such repatriation, but we may be required to accrue for unanticipated additional tax costs in the future if our expectations or the amount of cash held by our foreign subsidiaries change.
51
Table of Contents
Given our current levels of cash on hand, anticipated cash flow from operations and available borrowing capacity, we believe we have sufficient liquidity to conduct our normal operations and pursue our business strategy in the ordinary course.
Year Ended December 31, 2010 compared to 2009
The following table summarizes our cash flows by category for the periods presented (in thousands):
| For the Years Ended December 31, | % Change | |||||||||||||||
| 2010 | 2009 | Change | ||||||||||||||
| Cash flows from operating activities |
$ | 312,829 | $ | 272,857 | $ | 39,972 | 14.6 | % | ||||||||
| Cash flows used in investing activities |
$ | (137,896 | ) | $ | (112,615 | ) | $ | (25,281 | ) | 22.4 | % | |||||
| Cash flows used in financing activities |
$ | (133,651 | ) | $ | (271,844 | ) | $ | 138,193 | -50.8 | % | ||||||
Net cash flows from operating activities in 2010 increased $40.0 million, or 14.6%, to $312.8 million compared to net cash flows from operating activities of $272.9 million in 2009. The increase in net cash flows from operating activities is primarily due to improvements in operating income and working capital utilization.
DSO, a key performance indicator that we utilize to monitor the accounts receivable average collection period and assess overall collection risk, was 56 days at December 31, 2010. Throughout 2010, DSO ranged from 56 to 62 days. At December 31, 2009, DSO was 54 days and ranged from 54 to 59 days during 2009.
Net cash flows used in investing activities in 2010 increased $25.3 million, or 22.4%, to $137.9 million compared to net cash flows used in investing activities of $112.6 million in 2009. The increase in net cash flows used in investing activities was due to a reduction in collections applied to principal of portfolio receivables of $23.6 million in 2010 compared to 2009. In 2010, $33.5 million was invested for acquisitions compared to $31.7 million in 2009. We invested $118.2 million in capital expenditures during 2010 compared to $118.5 million invested in 2009.
Net cash flows used in financing activities in 2010 decreased $138.2 million or 50.8%, to $133.7 million compared to net cash flows used in financing activities of $271.8 million for 2009. Repayments on portfolio notes payable in 2010 were $34.0 million less than in 2009. In 2010, we paid off the remaining balances of the portfolio notes payable. Net payments on long-term obligations in 2010 were $127.4 million less than in 2009. During 2010, net payments under the senior secured revolving credit facility were $72.9 million compared to $201.7 million in 2009. At December 31, 2010, there was no outstanding balance on the senior secured revolving credit facility.
Senior Secured Term Loan Facility and Senior Secured Revolving Credit Facility
Our senior secured term loan facility and senior secured revolving credit facility bear interest at variable rates. During 2010, we and certain of our domestic subsidiaries, as borrowers and/or guarantors, Wells Fargo Bank, National Association (“Wells Fargo”), as administrative agent, and the various lenders party thereto modified our senior secured credit facilities by entering into a Restatement Agreement (the “Restatement Agreement”), amending and restating the Credit Agreement, dated as of October 24, 2006, by and among us, Wells Fargo, as successor administrative agent and the various lenders party thereto, as lenders, (as so amended and restated, the “Restated Credit Agreement”).
After giving effect to the prepayment of amortization payments payable in respect of the term loans due 2013, the amended and restated senior secured term loan facility requires annual principal payments of approximately $15.4 million, paid quarterly, with balloon payments at maturity dates of October 24, 2013 and July 15, 2016 of approximately $450.2 million and $1,398.5 million, respectively. Pricing of the amended and restated senior secured term loan facility, due 2013, is based on our corporate debt rating and the grid ranges
52
Table of Contents
from 2.125% to 2.75% for LIBOR rate loans (LIBOR plus 2.375% at December 31, 2011), and from 1.125% to 1.75% for Base Rate loans (Base Rate plus 1.375% at December 31, 2011). The interest rate margins for the amended and restated senior secured term loans due 2016 are based on our corporate debt rating based on a grid, which ranges from 4.00% to 4.625% for LIBOR rate loans (LIBOR plus 4.25% at December 31, 2011), and from 3.00% to 3.625% for Base Rate loans (Base Rate plus 3.25% at December 31, 2011). The effective annual interest rates, inclusive of debt amortization costs, on the senior secured term loan facility for 2011 and 2010 were 6.22% and 5.21%, respectively.
Our senior secured revolving credit facilities provide senior secured financing of up to $250 million, of which approximately $92 million matures October 2012 (original maturity) and approximately $158 million matures January 2016 (extended maturity). We have also received commitments for approximately $43 million of additional extended maturity senior secured revolving credit facility commitments, which commitments would replace a portion of the original maturity senior secured revolving credit facility.
The original maturity senior secured revolving credit facility pricing is based on our total leverage ratio and the grid ranges from 1.75% to 2.50% for LIBOR rate loans (LIBOR plus 2.0% at December 31, 2011), and the margin ranges from 0.75% to 1.50% for base rate loans (Base Rate plus 1.0% at December 31, 2011). We are required to pay each non-defaulting lender a commitment fee of 0.50% in respect of any unused commitments under the original maturity senior secured revolving credit facility. The commitment fee in respect of unused commitments under the original maturity senior secured revolving credit facility is subject to adjustment based upon our total leverage ratio. The average daily outstanding balance of the original maturity senior secured revolving credit facility during 2011 and 2010 was $1.3 million and $13.1 million, respectively. The highest balance outstanding on the original maturity senior secured revolving credit facility during 2011 and 2010 was $14.7 million and $80.9 million, respectively.
The extended maturity senior secured revolving credit facility pricing is based on our total leverage ratio and the grid ranges from 2.75% to 3.50% for LIBOR rate loans (LIBOR plus 3.0% at December 31, 2011), and the margin ranges from 1.75% to 2.50% for base rate loans (Base Rate plus 2.0% at December 31, 2011). We are required to pay each non-defaulting lender a commitment fee of 0.50% in respect of any unused commitments under the extended maturity senior secured revolving credit facility. The commitment fee in respect of unused commitments under the extended maturity senior secured revolving credit facility is subject to adjustment based upon our total leverage ratio.
The average daily outstanding balance of the extended maturity senior secured revolving credit facility during 2011 was $3.5 million. The highest balance outstanding on the extended maturity senior secured revolving credit facility during 2011 was $35.8 million. Prior to 2011, there had been no borrowings on the extended maturity senior secured revolving credit facility since its inception on October 5, 2010.
Subsequent to December 31, 2011, the Company may request additional tranches of term loans or increases to the revolving credit facility in an aggregate amount not to exceed $848.6 million, including the aggregate amount of $617.6 million of principal payments previously made in respect of the term loan facility. Availability of such additional tranches of term loans or increases to the revolving credit facility is subject to the absence of any default and pro forma compliance with financial covenants and, among other things, the receipt of commitments by existing or additional financial institutions.
2016 Senior Subordinated Notes
Our $450.0 million aggregate principal amount of 11% senior subordinated notes due 2016 (the “2016 Senior Subordinated Notes”) bear interest that is payable semiannually.
53
Table of Contents
We may redeem the 2016 Senior Subordinated Notes in whole or in part at the redemption prices (expressed as percentages of principal amount of the senior subordinated notes to be redeemed) set forth below plus accrued and unpaid interest thereon to the applicable date of redemption, subject to the right of holders of 2016 Senior Subordinated Notes of record on the relevant record date to receive interest due on the relevant interest payment date, if redeemed during the twelve-month period beginning on October 15 of each of the years indicated below:
| Year |
Percentage | |||
| 2011 |
105.500 | |||
| 2012 |
103.667 | |||
| 2013 |
101.833 | |||
| 2014 and thereafter |
100.000 | |||
2018 Senior Notes
On October 5, 2010, we issued $500 million aggregate principal amount of 8 5/8% senior notes that mature on October 1, 2018 (the “2018 Senior Notes”).
At any time prior to October 1, 2014, we may redeem all or a part of the 2018 Senior Notes at a redemption price equal to 100% of the principal amount of 2018 Senior Notes redeemed plus the applicable premium (as defined in the indenture governing the 2018 Senior Notes) as of, and accrued and unpaid interest to the date of redemption, subject to the rights of holders of 2018 Senior Notes on the relevant record date to receive interest due on the relevant interest payment date.
On and after October 1, 2014, we may redeem the 2018 Senior Notes in whole or in part at the redemption prices (expressed as percentages of principal amount of the 2018 Senior Notes to be redeemed) set forth below plus accrued and unpaid interest thereon to the applicable date of redemption, subject to the right of holders of 2018 Senior Notes of record on the relevant record date to receive interest due on the relevant interest payment date, if redeemed during the twelve-month period beginning on October 1 of each of the years indicated below:
| Year |
Percentage | |||
| 2014 |
104.313 | |||
| 2015 |
102.156 | |||
| 2016 and thereafter |
100.000 |
At any time (which may be more than once) before October 1, 2013, we can choose to redeem up to 35% of the outstanding notes with money that we raise in one or more equity offerings, as long as: we pay 108.625% of the face amount of the notes, plus accrued and unpaid interest; we redeem the notes within 90 days after completing the equity offering; and at least 65% of the aggregate principal amount of the applicable series of notes issued remains outstanding afterwards.
2019 Senior Notes
On November 24, 2010, we issued $650.0 million aggregate principal amount of 7 7/8% senior notes that mature January 15, 2019 (the “2019 Senior Notes”).
At any time prior to November 15, 2014, we may redeem all or a part of the 2019 Senior Notes at a redemption price equal to 100% of the principal amount of 2019 Senior Notes redeemed plus the applicable premium (as defined in the indenture governing the 2019 Senior Notes) as of, and accrued and unpaid interest to the date of redemption, subject to the rights of holders of 2019 Senior Notes on the relevant record date to receive interest due on the relevant interest payment date.
54
Table of Contents
On and after November 15, 2014, we may redeem the 2019 Senior Notes in whole or in part at the redemption prices (expressed as percentages of principal amount of the 2019 Senior Notes to be redeemed) set forth below plus accrued and unpaid interest thereon to the applicable date of redemption, subject to the right of holders of 2019 Senior Notes of record on the relevant record date to receive interest due on the relevant interest payment date, if redeemed during the twelve-month period beginning on November 15 of each of the years indicated below:
| Year |
Percentage | |||
| 2014 |
103.938 | |||
| 2015 |
101.969 | |||
| 2016 and thereafter |
100.000 |
At any time (which may be more than once) before November 15, 2013, we can choose to redeem up to 35% of the outstanding notes with money that we raise in one or more equity offerings, as long as: we pay 107.875% of the face amount of the notes, plus accrued and unpaid interest; we redeem the notes within 90 days after completing the equity offering; and at least 65% of the aggregate principal amount of the applicable series of notes issued remains outstanding afterwards.
We and our subsidiaries, affiliates or significant shareholders may from time to time, in our sole discretion, purchase, repay, redeem or retire any of our outstanding debt or equity securities (including any publicly issued debt or equity securities), in privately negotiated or open market transactions, by tender offer or otherwise.
Amended and Extended Asset Securitization
On September 12, 2011, the revolving trade accounts receivable financing facility between West Receivables LLC, a wholly-owned, bankruptcy-remote direct subsidiary of West Receivables Holdings LLC and Wells Fargo Bank, National Association, was amended and extended. The amended and extended facility provides for $150.0 million in available financing and is extended to September 12, 2014, reduces the unused commitment fee by 25 basis points and lowers the LIBOR spread on borrowings by 150 basis points. Under the amended and extended facility, West Receivables Holdings LLC sells or contributes trade accounts receivables to West Receivables LLC, which sells undivided interests in the purchased or contributed accounts receivables for cash to one or more financial institutions. The availability of the funding is subject to the level of eligible receivables after deducting certain concentration limits and reserves. The proceeds of the facility are available for general corporate purposes. West Receivables LLC and West Receivables Holdings LLC are consolidated in our condensed consolidated financial statements included elsewhere in this prospectus. At December 31, 2011 and December 31, 2010, the facility was undrawn. The highest balance outstanding during 2011 and 2010 was $84.5 million and $20.0 million, respectively.
The amended and extended asset securitization facility contains various customary affirmative and negative covenants and also contains customary default and termination provisions, which provide for acceleration of amounts owed under the program upon the occurrence of certain specified events, including, but not limited to, failure to pay yield and other amounts due, defaults on certain indebtedness, certain judgments, changes in control, certain events negatively affecting the overall credit quality of collateralized accounts receivable, bankruptcy and insolvency events and failure to meet financial tests requiring maintenance of certain leverage and coverage ratios, similar to those under our senior secured credit facility.
Debt Covenants
Senior Secured Term Loan Facility and Senior Secured Revolving Credit Facility—We are required to comply on a quarterly basis with a maximum total leverage ratio covenant and a minimum interest coverage ratio covenant. The total leverage ratio of consolidated total debt to Consolidated EBITDA (as defined by our Restated Credit
55
Table of Contents
Agreement) may not exceed 5.50 to 1.0 at December 31, 2011, and the interest coverage ratio of Consolidated EBITDA (as defined in the Restated Credit Agreement) to the sum of consolidated interest expense must exceed 2.0 to 1.0 at December 31, 2011. Both ratios are measured on a rolling four-quarter basis. We were in compliance with these financial covenants at December 31, 2011. The total leverage ratio will become more restrictive over time (adjusted periodically until the maximum leverage ratio reaches 5.00 to 1.0 in the fourth quarter of 2012). We believe that for the foreseeable future we will continue to be in compliance with our financial covenants. The senior secured credit facilities also contain various negative covenants, including limitations on indebtedness, liens, mergers and consolidations, asset sales, dividends and distributions or repurchases of our capital stock, investments, loans and advances, capital expenditures, payment of other debt, including the senior subordinated notes, transactions with affiliates, amendments to material agreements governing our subordinated indebtedness, including the senior subordinated notes and changes in our lines of business.
The senior secured credit facilities include certain customary representations and warranties, affirmative covenants, and events of default, including payment defaults, breaches of representations and warranties, covenant defaults, cross-defaults to certain indebtedness, certain events of bankruptcy, certain events under ERISA, material judgments, the invalidity of material provisions of the documentation with respect to the senior secured credit facilities, the failure of collateral under the security documents for the senior secured credit facilities, the failure of the senior secured credit facilities to be senior debt under the subordination provisions of certain of the Company’s subordinated debt and a change of control of the Company. If an event of default occurs, the lenders under the senior secured credit facilities will be entitled to take certain actions, including the acceleration of all amounts due under the senior secured credit facilities and all actions permitted to be taken by a secured creditor.
2016 Senior Subordinated Notes, 2018 Senior Notes and 2019 Senior Notes—The 2016 Senior Subordinated Notes, the 2018 Senior Notes and the 2019 Senior Notes indentures contain covenants limiting, among other things, our ability and the ability of our restricted subsidiaries to: incur additional debt or issue certain preferred shares, pay dividends on or make distributions in respect of our capital stock or make other restricted payments, make certain investments, sell certain assets, create liens on certain assets to secure debt, consolidate, merge, sell, or otherwise dispose of all or substantially all of our assets, enter into certain transactions with our affiliates and designate our subsidiaries as unrestricted subsidiaries.
Our failure to comply with these debt covenants may result in an event of default which, if not cured or waived, could accelerate the maturity of our indebtedness. If our indebtedness is accelerated, we may not have sufficient cash resources to satisfy our debt obligations and we may not be able to continue our operations as planned. If our cash flows and capital resources are insufficient to fund our debt service obligations and keep us in compliance with the covenants under our senior secured credit facilities or to fund our other liquidity needs, we may be forced to reduce or delay capital expenditures, sell assets or operations, seek additional capital or restructure or refinance our indebtedness including the notes. We cannot ensure that we would be able to take any of these actions, that these actions would be successful and would permit us to meet our scheduled debt service obligations or that these actions would be permitted under the terms of our existing or future debt agreements, including our senior secured credit facilities and the indentures that govern the notes. Our senior secured credit facilities documentation and the indentures that govern the notes restrict our ability to dispose of assets and use the proceeds from the disposition. As a result, we may not be able to consummate those dispositions or use the proceeds to meet our debt service or other obligations, and any proceeds that are available may not be adequate to meet any debt service or other obligations then due.
If we cannot make scheduled payments on our debt, we will be in default, and as a result:
| • | our debt holders could declare all outstanding principal and interest to be due and payable; |
| • | the lenders under our new senior secured credit facilities could terminate their commitments to lend us money and foreclose against the assets securing our borrowings; and |
| • | we could be forced into bankruptcy or liquidation. |
56
Table of Contents
Adjusted EBITDA—The common definition of EBITDA is “Earnings Before Interest Expense, Taxes, Depreciation and Amortization.” In evaluating liquidity, we use “Adjusted EBITDA”, which we define as earnings before interest expense, share-based compensation, taxes, depreciation and amortization, noncontrolling interest, non-recurring litigation settlement costs, impairments and other non-cash reserves, transaction costs and after acquisition synergies and excluding unrestricted subsidiaries. EBITDA and Adjusted EBITDA are not measures of financial performance or liquidity under GAAP. Although we use Adjusted EBITDA as a measure of our liquidity, the use of Adjusted EBITDA is limited because it does not include certain material costs, such as depreciation, amortization and interest, necessary to operate our business and includes adjustments for synergies that have not been realized. In addition, as disclosed below, certain adjustments included in our calculation of Adjusted EBITDA are based on management’s estimates and do not reflect actual results. For example, post-acquisition synergies included in Adjusted EBITDA are determined in accordance with our senior credit facilities and indentures governing our outstanding notes which provide for an adjustment to EBITDA, subject to certain specified limitations, for reasonably identifiable and factually supportable cost savings projected by us in good faith to be realized as a result of actions taken following an acquisition. EBITDA and Adjusted EBITDA should not be considered in isolation or as a substitute for net income, cash flow from operations or other income or cash flow data prepared in accordance with GAAP. Adjusted EBITDA, as presented, may not be comparable to similarly titled measures of other companies. Adjusted EBITDA is presented here as we understand investors use it as one measure of our historical ability to service debt and compliance with covenants in our senior credit facilities. Set forth below is a reconciliation of Adjusted EBITDA to cash flow from operations.
| For the year ended December 31, | ||||||||||||||||||||
| (amounts in thousands) | 2011 | 2010 | 2009 | 2008 | 2007 | |||||||||||||||
| Cash flows from operating activities |
$ | 348,187 | $ | 312,829 | $ | 272,857 | $ | 287,381 | $ | 263,897 | ||||||||||
| Income tax expense |
77,034 | 60,476 | 56,862 | 11,731 | 6,814 | |||||||||||||||
| Deferred income tax (expense) benefit |
(23,716 | ) | (20,837 | ) | (28,274 | ) | 26,446 | 8,917 | ||||||||||||
| Interest expense |
269,863 | 252,724 | 254,103 | 313,019 | 332,372 | |||||||||||||||
| Refinancing expenses |
— | 52,804 | — | — | — | |||||||||||||||
| Allowance for impairment of purchased accounts receivable |
— | — | (25,464 | ) | (76,405 | ) | — | |||||||||||||
| Provision for share based compensation |
(23,341 | ) | (4,233 | ) | (3,840 | ) | (1,404 | ) | (1,276 | ) | ||||||||||
| Amortization of debt acquisition costs |
(13,449 | ) | (35,263 | ) | (16,416 | ) | (15,802 | ) | (14,671 | ) | ||||||||||
| Other |
2,288 | (652 | ) | (375 | ) | (107 | ) | 195 | ||||||||||||
| Excess tax benefit from stock options exercised |
1,417 | 897 | 1,709 | — | — | |||||||||||||||
| Changes in operating assets and liabilities, net of business acquisitions |
10,535 | 15,569 | 79,124 | (19,173 | ) | (53,461 | ) | |||||||||||||
| Provision for share based compensation(a) |
23,341 | 4,233 | 3,840 | 1,404 | 1,276 | |||||||||||||||
| Acquisition synergies and transaction costs(b) |
14,314 | 5,035 | 18,003 | 20,985 | 22,006 | |||||||||||||||
| Non-cash portfolio impairments(c) |
— | — | 25,464 | 76,405 | 1,004 | |||||||||||||||
| Site closures and other impairments(d) |
2,233 | 6,365 | 6,976 | 2,644 | 1,309 | |||||||||||||||
| Non-cash foreign currency loss (gain)(e) |
(6,454 | ) | 1,199 | (229 | ) | 6,427 | — | |||||||||||||
| Litigation settlement costs(f) |
(895 | ) | 3,504 | 3,601 | — | 15,741 | ||||||||||||||
|
|
|
|
|
|
|
|
|
|
|
|||||||||||
| Adjusted EBITDA(g) |
$ | 681,357 | $ | 654,650 | $ | 647,941 | $ | 633,551 | $ | 584,123 | ||||||||||
|
|
|
|
|
|
|
|
|
|
|
|||||||||||
| Adjusted EBITDA Margin(h) |
27.3 | % | 27.4 | % | 27.3 | % | 28.2 | % | 27.8 | % | ||||||||||
| Leverage Ratio Covenant and Interest Coverage Ratio Covenant: |
||||||||||||||||||||
| Total debt(i) |
$ | 3,422,583 | $ | 3,436,761 | $ | 3,577,291 | $ | 3,706,982 | $ | 3,345,615 | ||||||||||
| Ratio of total debt to Adjusted EBITDA(j) |
5.0x | 5.3x | 5.5x | 5.4x | 5.6x | |||||||||||||||
| Cash interest expense(k) |
$ | 258,064 | $ | 237,965 | $ | 243,401 | $ | 280,702 | $ | 285,450 | ||||||||||
| Ratio of Adjusted EBITDA to cash interest expense(l) |
2.7x | 2.8x | 2.7x | 2.4x | 2.1x | |||||||||||||||
| (a) | Represents total share based compensation expense determined at fair value, excluding share based compensation expense related to deferred compensation-notional shares of $1.0 and $0.5 million in 2008 and 2007, respectively, as amounts were determined to be not significant. |
57
Table of Contents
| (b) | Represents, for each period presented, unrealized synergies for acquisitions, consisting primarily of headcount reductions and telephony-related savings, direct acquisition expenses, transaction costs incurred with the recapitalization and the exclusion of the negative EBITDA in one acquired entity, which was an unrestricted subsidiary under the indentures governing our outstanding senior and senior subordinated notes. Amounts shown are permitted to be added to “EBITDA” for purposes of calculating our compliance with certain covenants under our credit facility and the indentures governing our outstanding notes. |
| (c) | Represents non-cash portfolio receivable allowances. |
| (d) | Represents site closures and other asset impairments. |
| (e) | Represents the unrealized loss (gain) on foreign denominated debt and the loss on transactions with affiliates denominated in foreign currencies. |
| (f) | Represents litigation settlements, net of estimated insurance proceeds, and related legal costs. |
| (g) | Adjusted EBITDA does not include pro forma adjustments for acquired entities of $3.9 in 2011, $(0.1) million in 2010, $2.0 million in 2009, $49.1 million in 2008 and $9.1 million in 2007 as is permitted in our debt covenants. |
| (h) | Adjusted EBITDA margin represents Adjusted EBITDA as a percentage of revenue. |
| (i) | Total debt excludes portfolio notes payable, but includes other indebtedness of capital lease obligations, performance bonds and letters of credit and is reduced by cash and cash equivalents. |
| (j) | Total debt excludes portfolio notes payable, but includes other indebtedness of capital lease obligations, performance bonds and letters of credit and is reduced by cash and cash equivalents. For purposes of calculating our Ratio of Total Debt to Adjusted EBITDA, Adjusted EBITDA includes pro forma adjustments for acquired entities of $3.9 million in 2011, $(0.1) million in 2010, $2.0 million in 2009, $49.1 million in 2008 and $9.1 million in 2007 as is permitted in the debt covenants. |
| (k) | Cash interest expense, as defined in our credit facility covenants, represents interest expense paid less amortization of capitalized financing costs and non-cash loss on hedge agreements expensed as interest under the senior secured term loan facility, senior secured revolving credit facility, senior notes and senior subordinated notes. |
| (l) | The ratio of Adjusted EBITDA to cash interest expense is calculated using trailing twelve month cash interest expense. |
NM—Not meaningful as our current debt covenants became effective October 24, 2006.
Set forth below are our cash flow from operations, cash flow used in investing activities and cash flow from financing activities for the periods indicated.
| For the year ended December 31, | ||||||||||||||||||||
| (dollars in thousands) | 2011 | 2010 | 2009 | 2008 | 2007 | |||||||||||||||
| Cash flows from operating activities |
$ | 348,187 | $ | 312,829 | $ | 272,857 | $ | 287,381 | $ | 263,897 | ||||||||||
| Cash flows used in investing activities |
$ | (329,441 | ) | $ | (137,896 | ) | $ | (112,615 | ) | $ | (597,539 | ) | $ | (454,946 | ) | |||||
| Cash flows from (used in) financing activities |
$ | (23,180 | ) | $ | (133,651 | ) | $ | (271,844 | ) | $ | 341,971 | $ | 118,106 | |||||||
58
Table of Contents
Contractual Obligations
As described in the notes to our consolidated financial statements included elsewhere in this prospectus, we have contractual obligations that may affect our financial condition. However, based on management’s assessment of the underlying provisions and circumstances of our material contractual obligations, there is no known trend, demand, commitment, event or uncertainty that is reasonably likely to occur which would have a material effect on our financial condition or results of operations.
The following table summarizes our contractual obligations at December 31, 2011 (amounts in thousands):
| Payment due by period | ||||||||||||||||||||
| Contractual Obligations |
Total | Less than 1 year |
1 - 3 years | 4 - 5 years | After 5 years | |||||||||||||||
| Senior Secured Term Loan Facility, due 2013 |
$ | 448,434 | $ | — | $ | 448,434 | $ | — | $ | — | ||||||||||
| Senior Secured Term Loan Facility, due 2016 |
1,467,931 | 15,425 | 30,858 | 1,421,648 | — | |||||||||||||||
| 11% Senior Subordinated Notes, due 2016 |
450,000 | — | — | 450,000 | — | |||||||||||||||
| 8 5/8% Senior Notes, due 2018 |
500,000 | — | — | — | 500,000 | |||||||||||||||
| 7 7/8% Senior Notes, due 2019 |
650,000 | — | — | — | 650,000 | |||||||||||||||
| Interest payments on fixed rate debt |
916,222 | 143,813 | 287,626 | 287,626 | 197,157 | |||||||||||||||
| Estimated interest payments on variable rate debt(1) |
372,122 | 101,083 | 154,275 | 116,764 | — | |||||||||||||||
| Contractual minimums under telephony agreements(2) |
204,100 | 119,200 | 84,900 | — | — | |||||||||||||||
| Operating leases |
121,720 | 33,114 | 40,730 | 19,283 | 28,593 | |||||||||||||||
| Purchase obligations(3) |
82,033 | 64,745 | 17,159 | 129 | — | |||||||||||||||
| Interest rate swaps |
7,105 | 5,194 | 1,911 | — | — | |||||||||||||||
| Capital lease obligations |
44 | 44 | — | — | — | |||||||||||||||
|
|
|
|
|
|
|
|
|
|
|
|||||||||||
| Total contractual cash obligations |
$ | 5,219,711 | $ | 482,618 | $ | 1,065,893 | $ | 2,295,450 | $ | 1,375,750 | ||||||||||
|
|
|
|
|
|
|
|
|
|
|
|||||||||||
| (1) | Interest rate assumptions based on January 11, 2012 LIBOR U.S. dollar swap rate curves for the next five years. |
| (2) | Based on projected telephony minutes through 2014. The contractual minimum is usage based and could vary based on actual usage. |
| (3) | Represents future obligations for capital and expense projects that are in progress or are committed. |
The table above excludes amounts to be paid for taxes and long-term obligations under our Nonqualified Executive Retirement Savings Plan and Nonqualified Executive Deferred Compensation Plan. The table also excludes amounts to be paid for income tax contingencies because the timing thereof is highly uncertain. At December 31, 2011, we have accrued $23.1 million, including interest and penalties, for uncertain tax positions.
On November 24, 2011, we entered into a Securities Purchase Agreement pursuant to which we agreed to purchase all of the outstanding equity of HyperCube LLC for approximately $76.6 million. The purchase price will be funded with proceeds from our revolving credit facilities and cash on hand. The acquisition is expected to close prior to the end of the first quarter of 2012 after satisfaction of certain closing conditions, including customary regulatory approvals.
Upon completion of this offering, the contract for management services with the affiliates of Thomas H. Lee Partners, L.P. and Quadrangle Group LLC will be terminated. The early termination of this agreement will require a payment of an amount equal to the net present value (using a discount rate equal to the then prevailing yield on the U.S. Treasury Securities of like maturity) of the $4.0 million annual management fee that would have been payable under the management services agreement from the date of completion of the offering until the seventh anniversary of such offering, such fee to be due and payable at the closing of the offering.
59
Table of Contents
Capital Expenditures
Our operations continue to require significant capital expenditures for technology, capacity expansion and upgrades. Capital expenditures were $120.1 million for the year ended December 31, 2011, and were funded through cash from operations and the use of our various credit facilities. Capital expenditures were $122.0 million for the year ended December 31, 2010. Capital expenditures for the year ended December 31, 2011 consisted primarily of computer and telephone equipment and software purchases. We currently estimate our capital expenditures for 2012 to be approximately $125.0 million to $135.0 million, primarily for capacity expansion and upgrades at existing facilities.
Our senior secured term loan facility discussed above includes covenants which allow us the flexibility to issue additional indebtedness that is pari passu with or subordinated to our debt under our existing credit facilities in an aggregate principal amount not to exceed $848.6 million including the aggregate amount of principal payments made in respect of the senior secured term loan, incur capital lease indebtedness, finance acquisitions, construction, repair, replacement or improvement of fixed or capital assets, incur accounts receivable securitization indebtedness and non-recourse indebtedness; provided we are in pro forma compliance with our total leverage ratio and interest coverage ratio financial covenants. We or any of our affiliates may be required to guarantee any existing or additional credit facilities.
Off-Balance Sheet Arrangements
We utilize standby letters of credit to support primarily workers’ compensation policy requirements and certain operating leases. Performance obligations of certain of our subsidiaries are supported by performance bonds and letters of credit. These obligations will expire at various dates through February 2013 and are renewed as required. The outstanding commitment on these obligations at December 31, 2011 was $20.0 million.
Inflation
We do not believe that inflation has had a material effect on our results of operations. However, there can be no assurance that our business will not be affected by inflation in the future.
Quantitative and Qualitative Disclosures about Market Risk
Market Risk Management
Market risk is the potential loss arising from adverse changes in market rates and prices, such as interest rates, foreign currency exchange rates and changes in the market value of investments. The effects of inflation on our variable interest rate debt is discussed below in “Interest Rate Risk.”
Interest Rate Risk
As of December 31, 2011, we had $1,916.4 million outstanding under our senior secured term loan facility, $450.0 million outstanding under our 2016 Senior Subordinated Notes, $500.0 million outstanding under our 2018 Senior Notes and $650.0 million outstanding under our 2019 Senior Notes.
Long-term obligations at variable interest rates subject to interest rate risk and the impact of a 50 basis point change in the variable interest rate, in thousands, at December 31, 2011 consist of the following:
| Outstanding at variable interest rates |
Annual Impact of a 0.5% change in the variable interest rate |
|||||||
| Variable rate debt(1) |
$ | 916,365 | $ | 4,581.8 | ||||
|
|
|
|
|
|||||
| (1) | Net of $1,000.0 million interest rate swaps |
60
Table of Contents
Foreign Currency Risk
Our Unified Communications segment conducts business in countries outside of the United States. Revenue and expenses from these foreign operations are typically denominated in local currency, thereby creating exposure to changes in exchange rates. Generally, we do not hedge the foreign currency transactions. Changes in exchange rates may positively or negatively affect our revenue and net income attributed to these subsidiaries. Based on our level of operating activities in foreign operations during 2011, a five percent change in the value of the U.S. dollar relative to the Euro and British Pound Sterling would have positively or negatively affected our net operating income by approximately one percent.
During 2011 and 2010, the Communication Services segment had no material revenue outside the United States. Our facilities in Canada, Jamaica, Mexico and the Philippines operate under revenue contracts denominated in U.S. dollars. These contact centers receive calls only from customers in North America under contracts denominated in U.S. dollars and therefore our foreign currency exposure is primarily for expenses incurred in the respective country.
For the years ended December 31, 2011, 2010 and 2009, revenue from non-U.S. countries was approximately 19%, 16% and 14%, respectively, of consolidated revenue. During these periods, no individual foreign country accounted for greater than 10% of revenue. At December 31, 2011 and 2010, long-lived assets from non-U.S. countries were approximately 9% and 10%, respectively, of consolidated long-lived assets in each year. We have generally not entered into forward exchange or option contracts for transactions denominated in foreign currency to hedge against foreign currency risk. We are exposed to translation risk because our foreign operations are in local currency and must be translated into U.S. dollars. As currency exchange rates fluctuate, translation of our Statements of Operations of non-U.S. businesses into U.S. dollars affects the comparability of revenue, expenses, and operating income between periods.
Investment Risk
In 2010, we entered into three three-year interest rate swap agreements (cash flow hedges) to convert variable long-term debt to fixed rate debt. These swaps were for an additional aggregate notional value of $500.0 million with interest rates ranging from 1.685% to 1.6975% and expire in June 2013. During 2009, we entered into three eighteen month forward starting interest rate swaps for a total notional value of $500.0 million. These forward starting interest rate swaps commenced during the third quarter of 2010. The fixed interest rate on these interest rate swaps ranged from 2.56% to 2.60% and expired in January 2012. At December 31, 2011, the notional amount of debt outstanding under interest rate swap agreements was $1,000.0 million of the outstanding $1,916.4 million senior secured term loan facility hedged at rates from 1.685% to 2.60%.
Recently Issued Accounting Pronouncements
In June 2011, the FASB issued ASU No. 2011- 05, Comprehensive Income (Topic 220), requiring entities to present net income and other comprehensive income in either a single continuous statement or in two separate, but consecutive, statements of net income and other comprehensive income. ASU no. 2011-05 became effective for statements issued by the Company after January 1, 2012. In December 2011, the FASB issued ASU 2011-12 Comprehensive Income which defers certain portions of ASU 2011-05 and indefinitely deferred the requirement to present reclassification adjustments out of accumulated other comprehensive income by component. The Company early adopted the provisions of ASU No. 2011-05 and ASU No. 2011-12 and accordingly all previous periods have been retrospectively presented.
In September 2011 the FASB issued ASU No. 2011-08, Intangibles-Goodwill and Other (Topic 350), permitting entities the option to first assess qualitative factors to determine whether it is more likely than not that the fair value of a reporting unit is less than its carrying amount as a basis for determining whether it is necessary to perform the two-step goodwill impairment test. ASU No. 2011-08 became effective for the Company January 1, 2012, and the adoption is not expected to have an effect on our financial position, results of operations or cash flows.
61
Table of Contents
Overview
Our Company
We are a leading provider of technology-driven communication services. The scale and processing capacity of our proprietary technology platforms, combined with our expertise in managing voice and data transactions, enable us to offer a broad portfolio of services, including conferencing and collaboration, alerts and notifications, emergency communications and business processing outsourcing. Our services provide reliable, high-quality, mission-critical communications designed to maximize return on investment for our clients. Our clients include Fortune 1000 companies, along with small and medium enterprises in a variety of industries, including telecommunications, retail, financial services, public safety, technology and healthcare. We have sales and operations in the United States, Canada, Europe, the Middle East, Asia Pacific and Latin America.
Our focus on large addressable markets with attractive growth characteristics has allowed us to deliver steady, profitable growth. Over the past ten years, we have grown our revenue at a compound annual growth rate (“CAGR”), of 12%, and improved our Adjusted EBITDA margin from 20.7% to 27.3%. For the fiscal year ended December 31, 2011, we grew revenue by 4.3% over 2010 to $2,491.3 million and generated $681.4 million in Adjusted EBITDA, or 27.3% Adjusted EBITDA margin, and $127.5 million in net income and $348.2 million in net cash flows from operating activities.
Evolution into a Predominately Platform-Based Solutions Business
Since our founding in 1986, we have invested significantly to expand our technology platforms and develop our operational processes to meet the complex communications needs of our clients. We have evolved our business mix from labor-intensive communications services to predominantly diversified and platform-based, technology-driven services. As a result, our revenue from platform-based services grew from 37% of total revenue in 2005 to 71% in 2011, and our operating income from platform-based services grew from 53% of total operating income to 91% over the same period.
Since 2005, we have invested approximately $1.9 billion in strategic acquisitions. We have increased our penetration into higher growth international conferencing markets, strengthened our alerts and notifications services business and established a leadership position in emergency communication services. As technology has advanced, consumers are now able to choose how they prefer to communicate with enterprises. As a result, we have reoriented our business to address the emergence of fast-growing trends such as unified communications (“UC”) products and mobility.
Today, our platform-based service lines include conferencing and event services, alerts and notifications, UC solutions, emergency communications services and our automated customer service platforms such as interactive voice response (“IVR”), natural language speech recognition and network-based call routing services. As we continue to increase the variety of platform-based services we provide, we intend to pursue opportunities in markets where we have strong client relationships and where clients place a premium on the quality of service provided.
The following summaries further highlight the steps we have taken to improve our business:
| — | Developed and Enhanced Large Scale Technology Platforms. Investing in technology and developing specialized expertise in the industries we serve are critical components to our strategy of enhancing our services and delivering operational excellence. Our approximately 662,000 telephony ports, including approximately 303,000 Internet Protocol (“IP”) ports, provide us with what we believe is the only large-scale proprietary IP-based global conferencing platform deployed and in use today. |
62
Table of Contents
| Our acquisitions of TuVox Incorporated (“TuVox”) and Holly Australia Pty Ltd (“Holly”) significantly advanced the development capabilities of our existing platform. The resulting open standards-based platform allows for the flexibility to add new capabilities as our clients demand. In addition, we have integrated mobile, social media and cloud computing capabilities into our platforms and are able to offer those services to our clients. |
| — | Expanded Emergency Communications Services Platform. We have invested significant resources into our emergency communications services. Since 2006, we have made several strategic acquisitions, including Intrado, Inc. (“Intrado”) and Positron Public Safety Systems, which provided us with the leading platform in communication services for public safety. Today, we believe we are one of the largest providers of emergency communications services to telecommunications service providers, government agencies and public safety organizations, based on the number of 9-1-1 calls that we and other participants in the industry facilitate. We have steadily increased our presence in this market through substantial investments in proprietary systems to develop programs designed to upgrade the capabilities of 9-1-1 centers by delivering a broader set of features. |
| — | Expanded Our Unified Communications Business Segment. Through both organic growth and acquisitions, we have been successful in strengthening our unified communications service offering. We have grown our sales force to expand the reach of our conferencing services both domestically and internationally. We have developed and integrated proprietary global and large enterprise-based services into our platform which allow for streamlined, cost-effective conferencing capabilities. With the acquisitions of Stream57 LLC (“Stream57”) and Unisfair, Inc. (“Unisfair”), we have enhanced our event services offerings. We have increased our capabilities in IP-based UC solutions through the acquisitions of SKT Business Communications Solutions division of the Southern Kansas Telephone Company, Inc. (“SKT”) and Smoothstone IP Communications Corporation (“Smoothstone”). We are able to offer system design, project management and implementation to clients with our sales engineering and integration services. |
We have also increased our presence in the high growth alerts and notifications market. We now provide platform-based communication services across several industries, including financial services, communications, transportation, government and public safety. Additionally, through our acquisitions of TeleVox Software, Inc. and Twenty First Century Communications, Inc. (“TFCC”) we have a strong presence in the medical and dental markets and the electric utilities industry.
Market Opportunity
We are focused on voice and data markets. Consistent with our investment strategy, we have and will continue to target new and complementary markets that leverage our depth of expertise in voice and data services. We believe these markets, including unified communications, emergency communications and alerts and notifications services, are large, have relatively predictable and steady growth, and are characterized by recurring, valuable transactions and strong margin profiles.
Unified Communications
We entered the conferencing and collaboration services market with our acquisition of InterCall® in 2003. Through organic growth and multiple strategic acquisitions, we have become the leading global provider of conferencing services since 2008 based on revenue, according to Wainhouse Research. The market for unified communications services, which includes hosted and managed unified communications services, audio, web, video and operator-assisted conferencing was $7.3 billion in 2011 and is expected to grow at a CAGR of 9% through 2015 according to Wainhouse Research.
According to Tern Systems, the market for automated message delivery in the U.S. was over $635 million in 2011, and is expected to grow at an annual growth rate of 21% through 2015. We believe this growth is being driven by a number of factors, including increased globalization of business activity, focus on lower costs,
63
Table of Contents
increased adoption of unified communications services, and increasing awareness of the need for rapid communication during emergencies. By leveraging our global sales team and diversified client base, we intend to continue targeting higher growth markets.
Communication Services
The market for emergency communications services represents a highly attractive opportunity, allowing us to diversify into an end-market that we believe is less volatile with respect to downturns in the economy. According to Compass Intelligence, approximately $3.9 billion of government-sponsored funds were estimated to be available for 9-1-1 and Enhanced 9-1-1 (“E9-1-1”) applications, hardware and systems expenditures in 2011 and such funds are expected to grow at a 6.4% CAGR through 2016. Given the critical nature of these systems and services, government agencies and other public safety organizations prioritize funding for such services to ensure dependable delivery. Further, as communities across the U.S. upgrade outdated 9-1-1 systems to next generation 9-1-1 platforms, we believe our suite of services is best suited to capture the demand.
We deliver critical agent-based and automated services for our enterprise clients. Today, the market for these services remains attractive given its size and steady growth characteristics. We target select opportunities within the global customer care business process outsourcing market which was estimated to be approximately $54 billion in 2011 with a projected CAGR through 2015 of approximately 5% according to IDC. We focus on high-value transactions that utilize our specialized knowledge and scale to drive enhanced profitability. We have built on our leading position in this market by investing in emerging service delivery models that provide a higher quality of service to our clients.
64
Table of Contents
Our Services
We believe we have built our reputation as a best-in-class service provider by delivering differentiated, high-quality services for our clients. Our portfolio of technology-driven communication services includes:
Unified Communications
Conferencing and Collaboration Services. Operating under the InterCall® brand, we are the largest conferencing services provider in the world based on conferencing revenue, according to Wainhouse Research. We managed approximately 121 million conference calls in 2011, a 13% increase over 2010. We provide our clients with an integrated global suite of meeting services. These include on-demand automated conferencing services, video managed services and web collaboration tools that allow clients to make presentations and share applications and documents over the Internet. Conferencing and collaboration services include the following:
| • | On-Demand Audio Conferencing is an automated conferencing service that allows clients to initiate an audio conference at any time, without the need to make a reservation or rely on an operator. |
| • | Web Collaboration Tools allow clients to connect remote employees and bolster collaboration as well as host virtual events such as e-learning, online training and promotional programs. These tools provide clients with the capability to make presentations and share applications and documents over the |
65
Table of Contents
| Internet. These services are offered through our proprietary product, InterCall Unified Meeting®, as well as through the resale of Cisco, Microsoft, Adobe and IBM products. Web conferencing services can be customized to each client’s individual needs. |
| • | Video Managed Services and Video Bridging allow clients to experience real-time face-to-face conferences. These services are offered through our products, InterCall Video Conferencing and InterCall Video Managed Services in conjunction with third-party equipment, and can be used for a wide variety of events, including training seminars, sales presentations, product launches and financial reporting calls. |
Event Services. InterCall offers an event services team to help clients who would like extra assistance planning, conducting and gathering report information for large scale or high-value meetings or conferences. Event services include the following:
| • | Audio and Video Webcasting Services allow users to broadcast small or large multimedia presentations over the Internet. We offer our clients the flexibility of broadcasting any combination of audio, video (desktop or high-end) or PowerPoint slides using any operating system. We enhanced our presence in this market with the acquisition of assets of Stream57 in December 2009. |
| • | Virtual Event Design and Hosting offers clients consulting, project management and implementation of hosted and managed virtual event and virtual environment solutions. Clients are able to provide large audiences easy and instant access to content, experts and peers. Clients can post video and audio content, conduct polls, publish blogs, integrate social media and host forums in a highly compelling virtual environment. Examples of virtual events include trade shows, user groups, job fairs, virtual learning environments and town hall meetings. We enhanced our presence in this market with the acquisition of Unisfair in March 2011. |
| • | Operator-Assisted Audio Conferencing Services are pre-scheduled conferences for large-scale, complex or important events. Operator-assisted services are customized to a client’s needs and provide a wide range of scalable features and enhancements, including the ability to record, broadcast, schedule and administer meetings. |
| • | Web Event Services offer clients consulting, event coordination and execution, and post-event reporting and support for any web-based event. Our specialized team of professionals help clients plan and implement every detail of their events. |
Alerts and Notifications. Our technology platforms allow clients to manage and deliver automated, proactive and personalized communications. We use multiple delivery channels (voice, text messaging, email, social media and fax) based on the preference of the recipient. For example, we deliver patient notifications, send and confirm appointments and prescription reminders on behalf of our healthcare clients, provide travelers with flight arrival and departure updates on behalf of our transportation clients, send and receive automated outage notifications on behalf of our utility clients and transmit emergency evacuation notices on behalf of municipalities. Our scalable platform enables a high volume of messages to be sent in a short amount of time. Our platform also enables two-way communication which allows the recipients of a message to respond with relevant information to our clients. We offer the following alerts and notifications services:
| • | Automated Voice Notifications are customized voice messages delivered with personalized information sent on behalf of our clients. Our system allows for accurate detection of voicemail versus live answer and provides customized caller ID and retry logic. |
| • | SMS/Email Alerts and Notifications are customized electronic notifications sent on behalf of our clients directly to their customers’ handheld devices, wireless phones, two-way pagers or email inboxes. |
| • | Multi-channel Preference Management and Campaign Management Solutions allow our clients to create and manage customer information in a real-time environment. Our web-based user interface tool allows clients to upload customer contact information, create reusable notification templates, customize campaigns and manage business rule definitions. Our technology enables us to deliver automated outbound messages over multiple channels based on predefined user preferences. |
66
Table of Contents
| • | Website and Customer Portal Management is a web design service whereby we create custom-built, interactive websites for clients. We also provide a variety of additional features and services, including hosting, search engine optimization and maintenance. |
IP-Based Unified Communications Solutions. We provide our clients with enterprise class IP-based communications solutions enabled by our technology. We expanded our capabilities in this area with the acquisition of Smoothstone in June 2011. We offer the following services:
| • | Hosted IP-PBX and Enterprise Call Management allows an enterprise to upgrade its use of communications technology with a suite of cloud-based, on–demand services including full private branch exchange (“PBX”) functionality, advanced enterprise and personal call management tools and leading edge unified communications features. These services can be fully integrated with a client’s existing IP or legacy time-division multiplexing (“TDM”) infrastructure where required, preserving investments already made in telephony infrastructure and providing a seamless enterprise-wide solution. |
| • | Hosted and Managed MPLS Network is a suite of IP trunking solutions designed to provide enterprise clients with the carrier–grade service along with the benefits of next–generation IP–based service that allows their business to run more efficiently. These solutions deliver a consistent set of voice services across an enterprise’s infrastructure, with flexible IP and TDM trunking options for clients’ on–site PBX. |
| • | Unified Communications Partner Solution Portfolio enables us to engineer flexible and scalable solutions suitable to an enterprise’s needs, leveraging a portfolio of Microsoft and Cisco offerings integrated with our products, applications and services. |
| • | Cloud-Based Security Services aggregates a set of technologies into one simple and scalable cloud–based solution that provides clients with network protection. By putting security in the cloud, this service can protect the client’s network from spam and viruses, unauthorized intrusions and inappropriate web content, while providing simplicity and consistency of security policy management and eliminating single points of failure and bottlenecks that can occur with premise-based security solutions. |
| • | Integrated Conferencing/Desktop Messaging and Presence Tools integrates key collaboration capabilities such as presence, instant messaging, and audio and video conferencing on a single platform. For example, users can instantly see which associates are available online and connect and collaborate on documents with them from a single console. |
| • | Professional Services and System Integration Expertise provides our clients with advice and solutions to integrate their unified communications systems. We offer expert consulting, design, integration, and implementation of voice, video, messaging, and collaboration systems and services. Specific capabilities and expertise include business value/process assessments, messaging and collaboration applications, training and adoption services, LAN/WAN virtualization, and IP telephony and legacy voice integration, including Session Initiation Protocol based technologies. We greatly enhanced our professional services capabilities in April 2010 with the acquisition of SKT. |
Communication Services
Emergency Communications Services. We believe we are one of the largest providers of emergency communications services, based on the number of 9-1-1 calls that we and other participants in the industry facilitate. Our services are critical in facilitating public safety agencies’ ability to receive emergency calls from citizens. Our clients generally enter into long-term contracts and fund their obligations through monthly charges on users’ telephone bills. We offer the following emergency communication services:
| • | 9-1-1 Network Services are the systems that control the routing of emergency calls to the appropriate 9-1-1 centers. In 2011, we facilitated over 260 million 9-1-1 calls. Our next generation 9-1-1 call handling solution is an IP-based system designed to significantly improve the information available to first responders by integrating capabilities such as the ability to text, send photos or video to 9-1-1 centers as well as providing stored data such as building blueprints or personal medical data to first |
67
Table of Contents
| responders. Our carrier-grade Location Based Services process over 100,000 daily requests in support of our clients’ E9-1-1 and commercial applications. |
| • | 9-1-1 Telephony Systems and Services include our fully-integrated desktop communications technology solutions which public safety agencies use to enable E9-1-1 call handling. Our next generation 9-1-1 solution can be deployed in a variety of local, host and remote configurations, allowing public safety agencies to grow with minimal incremental investment. It currently operates in approximately 5,000 call-taking positions in more than 1,000 Public Safety Answering Points (“PSAPs”) in North America. |
Automated Call Processing. We believe we have developed a best-in-class automated customer service platform. Our services allow our clients to effectively communicate with their customers through inbound and outbound IVR applications using natural language speech recognition, automated voice prompts and network-based call routing services. In addition to these front-end customer service applications, we also provide analyses that help our clients improve their automated communications strategy. Our open standards-based platform allows the flexibility to integrate new capabilities such as mobility, social media and cloud-based services.
| • | Automated Customer Service solutions range from speech/IVR applications and mobile solutions to social media monitoring and engagement, short messaging service (“SMS”), chat and email. We help our clients engage their customers via the channels they prefer. Examples of self service applications used by our clients are: access account balances, activation of credit cards, placing orders, FAQ’s and stop/start utility service. |
| • | Voice and Data Network Management Services assist our clients as they manage or update their own contact center communications networks. We offer hosted or managed services for the operation, administration and management of voice and data networks such as Voice over Internet Protocol (“VoIP”) network management, network automated call distribution (“ACD”)/multi-channel contact routing, workforce management, quality monitoring and predictive dialing. |
Agent-Based Services. We provide our clients with large-scale, agent-based services, including inbound customer care, customer retention, business-to-business, account management, receivables management overpayment identification and recovery solutions, as well as direct response and language services. We target opportunities to provide our agent-based services as part of larger strategic client engagements and with clients for whom these services can add value. We believe that we are known in the industry as a premium provider of these services. We have a flexible model that offers on-shore, off-shore and virtual home-based capabilities to fit our clients’ needs.
| • | Commercial — For our clients’ commercial customer needs, we provide the following services: |
| — | Business-to-Business and Account Management Services: We provide dedicated sales and account management services for some of the nation’s leading companies. We utilize our experience, sales methodologies and technology to deliver an integrated suite of revenue generation solutions that allow our clients to overcome a variety of common sales challenges. Examples of these services include lead management, team sell sales, account management and sole territory coverage. |
| — | Receivables Management Services: We are a fully licensed collection agency that has integrated partnerships across the telecommunications, financial services, government, healthcare and utilities industries. We provide both first and third party services. |
| — | Overpayment Identification and Recovery Services: Our two decades of healthcare experience has made us a leader in providing cost containment programs to health organizations including: health insurance payers, third party administrators, managed care organizations, hospitals/physicians and self-insured companies. We analyze data from multiple healthcare sources, identify incorrectly paid claims, provide targeted communications and collect funds on behalf of our clients. |
| — | Direct Response: We process phone calls, sell products and services, and capture lead information about consumers responding to mass media advertisements on television, radio, Internet and print for direct response marketers. |
68
Table of Contents
| — | Language Services: We provide over-the-phone interpretation (“OPI”) and document translation services that enable businesses, as well as their employees and customers, to communicate more effectively. |
| • | Consumer — We help our clients with their consumer-based communications needs, including customer acquisition and retention, customer care, sales and service. We provide clients with customized services that are handled by specially trained agents. |
Our Competitive Strengths
We have developed expertise to serve the needs of clients who place a premium on the services we provide. We believe the following strengths have helped us to establish a leading competitive position in the markets we serve and enable us to deliver operational excellence to clients.
| — | Broad Portfolio of Product Offerings with Attractive Value Proposition. Our technology platforms combined with our operational expertise and processes allow us to provide a broad range of service offerings for our clients. Our ability to efficiently and cost-effectively process high volume, complex voice and data transactions for our clients facilitates their critical communications and helps improve their cost structure. |
| — | Robust Technology Capabilities Enable Scalable Operating Model. Our strengths across technology and multiple channels allow us to process data and communications transactions for our clients. We cross-utilize our assets and shared service platforms across our businesses, providing scale and flexibility to handle greater transaction volume, offer superior service and develop new offerings more effectively and efficiently. We foster a culture of innovation and have been issued approximately 172 patents and have approximately 349 pending patent applications for technology and processes that we have developed. We continue to invest in new platform technologies, including IP-based cloud computing environments, as well as to enhance our portfolio with patented technologies, which allow us to deliver premium services to our clients. |
| — | Strong Client Relationships. We have built long-lasting relationships with our clients who operate in a broad range of industries, including telecommunications, retail, financial services, public safety, technology and healthcare. Our top ten clients by revenue in 2011 had an average tenure with us of over eleven years. In 2011, our 100 largest clients by revenue represented approximately 55% of our revenue and approximately 45% of our revenue came from clients purchasing multiple service offerings. |
| — | Operational Excellence. We increase productivity and performance for our clients by leveraging our expertise to efficiently deliver communications services. Our ability to improve these processes for our clients is an important aspect of our value proposition. We leverage our proprietary technology infrastructure and shared services platforms to manage higher value transactions and achieve cost savings for our clients and ourselves. |
| — | Experienced Management Team with Track Record of Growth. Our senior leadership has an average tenure of approximately 13 years with us and has delivered strong results through various market cycles, both as a public and a private company. As a group, this team has created a culture of superior client service and, through acquisitions and organic growth, has been able to achieve a 12% revenue CAGR over the past ten years. Our team has established a long track record of successfully acquiring and integrating companies to drive growth. |
As demand for outsourced services grows with greater adoption of our technologies and services and the global trend toward business process outsourcing, we believe our long history of delivering results for our clients combined with our scale and the investments we have made in our businesses provide us with a significant competitive advantage.
69
Table of Contents
Our Growth Strategy
Our strategy is to identify growing markets where we can deploy our existing assets and expertise to strengthen our competitive position. Our strategy is supported by our commitment to superior client service, operational excellence and market leadership. Key aspects of our strategy include the following:
| — | Expand Relationships with Existing Clients. We are focused on deepening and expanding relationships with our existing clients by delivering value in the form of reduced costs, improved customer relationships and enhanced revenue opportunities. Approximately 45% of our revenue in 2011 came from clients purchasing multiple service offerings from us. As we demonstrate the value that our services provide, often starting with a single service, we are frequently able to expand the size and scope of our client relationships. |
| — | Develop New Client Relationships. We will continue to focus on building long-term client relationships across a wide range of industries to further diversify our revenue base. We target clients in industries in which we have expertise or other competitive advantages and an ability to deliver a wide range of solutions that have a meaningful impact on their business. By continuing to add new long-term client relationships in large and growing markets, we believe we enhance the stability and growth potential of our revenue base. |
| — | Capitalize on Select Global Opportunities. In addition to expanding and enhancing our existing relationships domestically, we will selectively pursue new client opportunities globally. Our expertise in conferencing and collaboration services has allowed us to penetrate substantial new international markets. In 2011, 19% of our consolidated revenue was generated outside of the U.S. Given the attractive growth dynamics within Europe, Asia-Pacific and Latin America, we intend to further grow our unified communications business in these regions. Our distribution capabilities, including over 375 dedicated international Unified Communications sales personnel, provide us with the platform to drive incremental revenue opportunities. |
| — | Continue to Enhance Leading Technology Capabilities. We believe our service offerings are enhanced by our superior, patented technology capabilities and track record of innovation, and we will continue to target services that enable our clients to realize significant benefits. In addition to strengthening our client relationships, we believe our focus on technology facilitates our ongoing evolution toward a diversified, predominantly platform-based and technology-driven operating model. |
| — | Continue to Enhance Our Value Proposition Through Selective Acquisitions. Since our founding in 1986, we have completed 29 acquisitions of businesses and technologies with a total value of approximately $2.7 billion. We will continue to expand our suite of communications services across industries, geographies and end-markets. While we expect this will occur primarily through organic growth, we have and expect to continue to acquire assets and businesses that strengthen our value proposition to clients and drive value to us. We have developed an internal capability to source, evaluate and integrate acquisitions that we believe has created value for shareholders. |
Sales and Marketing
Generally, our sales personnel target growth-oriented clients and selectively pursue those with whom we have the greatest opportunity for long-term success. Their goals are both to maximize our current client relationships and expand our existing client base. To accomplish these goals, we attempt to sell additional services to existing clients and to develop new relationships. We generally pay commissions to sales professionals on both new sales and incremental revenue generated from existing clients.
Unified Communications
For conferencing and collaboration services, event services, IP-based unified communications solutions and alerts and notifications, we maintain a sales force of approximately 930 personnel that are trained to understand and respond to our clients’ needs. We generally pay commissions to sales professionals on both new sales and incremental revenue generated from existing clients.
70
Table of Contents
Communication Services
We maintain approximately 65 sales and marketing personnel dedicated to our Emergency Communications Services, approximately 20 sales and marketing personnel dedicated to our Automated Call Processing Services and approximately 30 sales and marketing personnel dedicated to our Agent-Based Services.
Competition
Unified Communications
The conferencing and collaboration services, event services and IP-based unified communications solutions market is highly competitive. The principal competitive factors include, among others, range of service offerings, global capabilities, price and quality of service. Our principal competitors include AT&T, Verizon, Premiere Global Services, BT Conferencing, NTT, Cisco Systems, Microsoft, IBM and other premise-based solution providers.
The event services market has advanced from traditional audio-centric, operator-assisted conferencing solutions to more dynamic, web-centric solutions such as webcasting platforms with video, and interactive, persistent virtual environments. As a result, the market remains highly competitive and fragmented with new entrants joining as technology evolves. The principal competitive factors of operator-assisted conferencing are reliability, ease of use, price and global support. Competitors in this market include BT Conferencing, Premiere Global Services and France Telecom. The principal competitive factors of the webcasting market are reliability, functionality, price, mobility, customization, ease of use and options like self service and multicasting. Competitors in this market include ON24, Thomson Reuters, Sonic Foundry, TalkPoint and cross over into the webinar market with Adobe and WebEx. The principal competitive factors of the virtual events market are ease of use, self-service, branding, integration with other solutions and global support. Competitors in this market include INXPO, ON24 and 6Connex.
The alerts and notifications services market is highly competitive and fragmented, characterized by a large number of vertically focused competitors addressing specific industries, including healthcare, travel, education, credit collection and government. The principal competitive factors in alerts and notifications include, among others, industry-specific knowledge and service focus, reliability, scalability, ease of use and price. Competitors in this industry include Varolii, SoundBite Communications, PhoneTree and, in the medical and dental markets, Silverlink Communications, Patient Prompt and Sesame Communications. We also face competition from clients who implement in-house solutions.
The IP-based unified communications solutions market is a highly competitive and growing market characterized by a large number of traditional carrier service providers entering the mid-market to enterprise market with proprietary versions of hosted or “cloud-based” unified communications service offerings, as well as smaller business-size competitors who compete more aggressively on price. The principal competitive factors include, among others, experience in implementing and designing enterprise level networks, on-demand and integrated hosted communications and collaboration platforms, expertise in integration of a broad variety of unified communications applications both in implementation and professional services consultation. Our principal competitors in this industry at the enterprise level include Cisco, Microsoft, AT&T, Verizon, BT, ShoreTel and Google for hosted services solutions and IBM, HP, Verizon Business and regional integrated service vendors for professional services. We also face competition from clients who implement in-house solutions. The SMB market has hundreds of regional competitors with a few like XO Communications, 8x8 and M5 that compete on a national scale.
Communication Services
| — | Emergency Communication Services. The market for wireline and wireless emergency communications services is competitive. The principal competitive factors in wireline and wireless emergency communications are the effectiveness of existing infrastructure, scalability, reliability, ease of use, price, technical features, scope of product offerings, customer service and support, ease of technical |
71
Table of Contents
| migration, useful life of new technology and wireless support. Competitors in the incumbent local exchange carrier and competitive local exchange carrier markets generally include internally developed solutions, and competitors in the wireless market include TeleCommunications Systems. Competition in the public safety desktop market is driven by features functionality, ease of use, price, reliability, upgradability, capital replacement and upgrade policies and customer service and support. Competitors in this market include Cassidian Communications, EmergiTech and 911-Inc. |
| — | Automated Call Processing Service. The principal competitive factors in the automated call processing market are scalability, flexibility, reliability, speed of implementing client applications and price of services. Competitors in this market are primarily premise-based services. |
| — | Agent-Based Services. The principal competitive factors in the agent-based customer service market include, among others, quality of service, range of service offerings, flexibility and speed of implementing customized solutions to meet clients’ needs, capacity, industry-specific experience, technological expertise and price. In the agent-based customer services market, many clients retain multiple communication services providers, which exposes us to continuous competition in order to remain a preferred vendor. Competitors in the agent-based customer services industry include Convergys, TeleTech, Sykes, NCO, GC Services, Infosys Limited and Aegis Global. We also compete with the in-house operations of many of our existing and potential clients. |
Our Clients
Our clients vary by business unit. We have a large and diverse client base for our conferencing and collaboration services, ranging from small businesses to Fortune 100 clients, and operating in a wide range of industries, including telecommunications, retail, financial services, technology and healthcare. Our alerts and notifications business serves a large number of clients, who generally operate in specific industries such as medical and dental or transportation. Traditionally, our emergency communications clients have been incumbent local exchange carriers and competitive local exchange carriers. Our automated customer service and agent-based service businesses serve larger enterprise clients operating in a wide range of industries.
Although we serve many clients, we derive a significant portion of our revenue from relatively few clients. In 2011, our 100 largest clients represented approximately 55% of our revenue, with one client, AT&T, representing approximately 10% of our revenue.
Our Personnel
As of December 31, 2011, we had approximately 36,500 total employees, of which approximately 31,500 were employed in the Communication Services segment (including approximately 8,950 home-based, generally part-time employees), 4,300 were employed in the Unified Communications segment and approximately 700 were employed in corporate support functions. Of the total employees, approximately 9,500 were employed in management, staff and administrative positions, and approximately 6,500 were international employees.
Employees of our subsidiaries in France and Germany are represented by local works councils. Employees in France and certain other countries are also covered by the terms of industry-specific national or other collective agreements. Our employees are not represented by any labor organization in the United States. We believe that our relations with our employees and the labor organizations identified above are good.
Our Technology and Systems Development
Technology is critical to our business and we believe the scale and flexibility of our platform is a competitive strength. Our software and hardware systems, as well as our network infrastructure, are designed to offer high-quality, integrated solutions. We have made significant investments in reliable hardware systems and integrated commercially available software when appropriate. We currently have approximately 662,000
72
Table of Contents
telephony ports to handle conference calls, alerts and notifications and customer service. These ports include approximately 303,000 IP ports, which we believe provide us with the only large-scale proprietary IP-based global conferencing platform deployed and in use today. Our technological platforms are designed to handle greater transaction volume than our competitors. Because our technology is client focused, we often rely on proprietary software systems developed internally to customize our services. As of December 31, 2011, we employed a staff of approximately 2,300 professionals in our information technology departments.
We recognize the importance of providing uninterrupted service for our clients. We have invested significant resources to develop, install and maintain facilities and systems that are designed to be highly reliable. Our facilities and systems are designed to maximize system availability and minimize the possibility of a service disruption.
We have network operations centers that operate 24 hours a day, seven days a week and use both internal and external systems to effectively operate our equipment, people and sites. We interface directly with telecommunications providers and have the ability to manage capacity in real time. Our network operations centers monitor the status of elements of our network on a real-time basis. All functions of our network operations centers have the ability to be managed at backup centers.
We rely on a combination of copyright, patent, trademark and trade secret laws, as well as on confidentiality procedures and non-compete agreements, to establish and protect our proprietary rights in each of our segments. We currently own approximately 172 registered patents and approximately 221 registered trademarks including several patents and trademarks that we obtained as part of our past acquisitions. Certain of our patents will expire in 2012. We do not expect these patent expirations to have a material adverse effect on the business. Trademarks continue as long as we actively use the mark. We have approximately 349 pending patent applications pertaining to technology relating to intelligent upselling, transaction processing, call center and agent management, data collection, reporting and verification, conferencing and credit card processing. New patents that are issued have a life of 20 years from the date the patent application is initially filed. We believe the existence of these patents and trademarks, along with our ongoing processes to add additional patents and trademarks to our portfolio, may be a barrier to entry for specific products and services we provide and may also be used for defensive purposes in certain litigation.
Our International Operations
In 2011, revenue attributed to foreign countries was approximately 19% of our consolidated revenue and long-lived assets attributed to foreign countries were approximately 9% of our total consolidated long-lived assets.
In 2011, our Unified Communications segment operated out of facilities in the U.S. and approximately 24 foreign jurisdictions in North America, Europe and Asia.
In 2011, our Communication Services segment operated facilities in the U.S., Canada, the Philippines, Mexico, Australia and Jamaica.
For additional information regarding our domestic and international revenues, see “Management’s Discussion and Analysis of Financial Condition and Results of Operations” and the consolidated financial statements included elsewhere in this prospectus.
73
Table of Contents
Properties
We own our corporate headquarters facility in Omaha, Nebraska. We also own two other facilities in Omaha, Nebraska used for administrative activities. Our principal operating locations are noted below.
| Operating Segment |
Owned / Leased | Principal Activities | Number of States in Which Properties are Located |
Number of Foreign Countries in Which Properties are Located |
||||||||||
| Unified Communications |
Owned | Administration | 3 | — | ||||||||||
| Unified Communications |
Owned | Production | 1 | — | ||||||||||
| Unified Communications |
Leased | Administration/Sales | 18 | 21 | ||||||||||
| Unified Communications |
Leased | Production | 2 | 2 | ||||||||||
| Communication Services |
Owned | Administration | 1 | — | ||||||||||
| Communication Services |
Owned | Production | 3 | — | ||||||||||
| Communication Services |
Leased | Administration | 9 | 1 | ||||||||||
| Communication Services |
Leased | Production | 20 | 4 | ||||||||||
Unified Communications has locations in Australia, Belgium, Canada, China, Denmark, Finland, France, Germany, Hong Kong, India, Israel, Italy, Japan, Korea, Malaysia, Mexico, Netherlands, New Zealand, Singapore, Spain, Sweden and the United Kingdom. Communication Services locations in foreign countries include Australia, Canada, Jamaica, Mexico and the Philippines.
We believe that our facilities are adequate for our current requirements and that additional space will be available as required. See note 4 of the notes to our consolidated financial statements included elsewhere in this prospectus for information regarding our lease obligations.
Government Regulation
Privacy
The Unified Communications and Communication Services segments provide services to healthcare clients that, as providers of healthcare services, are considered “covered entities” under the Health Insurance Portability and Accountability Act of 1996 (“HIPAA”). As covered entities, our clients must comply with standards for privacy, transaction and code sets, and data security. Under HIPAA, we are sometimes considered a “business associate,” which requires that we protect the security and privacy of “protected health information” provided to us by our clients. We have implemented HIPAA and Health Information Technology for Economic and Clinical Health Act (“HITECH”) compliance training and awareness programs for our healthcare services employees. We also have undertaken an ongoing process to test data security at all relevant levels. In addition, we have reviewed physical security at all healthcare operation centers and have implemented systems to control access to all work areas.
In addition to healthcare information, our databases contain personal data of our customers and clients’ customers, including credit card and other personal information. Federal law requires protection of Customer Proprietary Network Information (“CPNI”) applicable to our clients. Federal and state laws in the U.S. as well as those in the European Union require notification to consumers in the event of a security breach in or at our systems if the consumers’ personal information may have been compromised as a result of the breach. We have implemented processes and procedures to reduce the risk of security breaches, and have prepared plans to comply with these notification rules should a breach occur.
Telecommunications
Our wholly-owned subsidiary, Intrado Inc. and certain of its affiliates (collectively, “Intrado”), are subject to various regulations as a result of their status as a regulated competitive local exchange carrier, and/or an emergency services provider, and/or an inter-exchange carrier, including state utility commissions regulations and Federal Communications Commission (the “FCC”) regulations adopted under the Telecommunications Act
74
Table of Contents
of 1996, as amended. Also, under the New and Emerging Technologies 911 Improvement Act of 2008 (NET911 Act, P.L. 11-283, 47 U.S.C. 609) and its attendant FCC regulations (WC Docket No. 08-171, Report and Order dated Oct 21, 2008), Intrado is required to provide access to VoIP telephony providers certain 9-1-1 and Enhanced, or E9-1-1, elements.
The market in which Intrado operates may also be influenced by legislation, regulation, and judicial or administrative determinations which seek to promote a national broadband plan, a nationwide public safety network, next generation services, and/or competition in local telephone markets, including 9-1-1 service as a part of local exchange service, or seek to modify the Universal Service Fund (“USF”) program.
Through our wholly owned subsidiary West IP Communications, Inc. (formerly known as Smoothstone IP Communications Corporation (“WIPC”)), we provide interconnected VoIP services, which are subject to certain requirements imposed by the FCC, including without limitation, obligations to provide access to 9-1-1, pay federal universal service fees and protect customer proprietary network information CPNI, even though the FCC has not classified interconnected VoIP services as telecommunications services. The regulatory requirements applicable to WIPC’s VoIP services could change if the FCC determines the services to be telecommunications services regulated under Part II of the Communications Act.
Federal laws regulating the provision of traditional telecommunications services may adversely impact our conferencing business. Historically, we have treated our conferencing business as a provider of unregulated information services, and we have not submitted to FCC regulation or other regulations applicable to providers of traditional telecommunications services. On June 30, 2008, the FCC ordered that stand-alone providers of audio bridging services have a direct USF contribution obligation. The FCC ordered that conferencing providers begin to submit the appropriate forms to the Universal Service Administrative Company (“USAC”) beginning August 1, 2008. The FCC order specifically stated the order would not apply retroactively.
Any changes to these legal requirements, including those caused by the adoption of new laws and regulations or by legal challenges, could have a material adverse effect upon the market for our services and products. Any delays in implementation of the regulatory requirements could have a material adverse effect on our business, financial condition and results of operations.
Debt Collection and Credit Reporting
The receivable management business is regulated both at the federal and state level. The Federal Trade Commission (“FTC”) has the authority to investigate consumer complaints against debt collectors and to recommend enforcement actions and seek monetary penalties. In addition, a new Consumer Financial Protection Bureau (“CFPB”) was formed as part of the recently enacted Dodd-Frank Financial Reform Act. The CFPB has authority to regulate and bring enforcement actions against various types of financial service businesses including collection agencies. Despite the creation of this new agency, none of the enforcement authority was taken from the FTC, meaning that these two government agencies will have dual enforcement authority over the debt collection industry. We expect the CFPB will initiate rulemaking with respect to new regulations that may impact the collection business. The Federal Fair Debt Collection Practices Act (“FDCPA”) establishes specific guidelines and procedures that debt collectors must follow in communicating with consumer debtors, including:
| • | time, place and manner of communications; |
| • | prohibition of harassment or abuse by debt collectors; |
| • | restrictions on communications with third parties and specific procedures to be followed when communicating with third parties to obtain a consumer debtor’s location information; |
| • | notice and disclosure requirements; and |
| • | prohibition of unfair or misleading representations by debt collectors. |
Our collection business is also subject to the Fair Credit Reporting Act (“FCRA”), which regulates consumer credit reporting. Under the FCRA, liability may be imposed on furnishers of data to credit reporting
75
Table of Contents
agencies to the extent that adverse credit information reported is false or inaccurate. In addition, the Telephone Consumer Protection Act (“TCPA”), which was originally intended to regulate the telemarketing industry, contains certain provisions that also impact the collection industry. Most significantly, the TCPA prohibits the use of automated dialers to call cellular telephones without consent of the consumer and the potential liability for violations of this provision is substantial.
At the state level, most states require that debt collectors be licensed or registered, hold a certificate of authority and/or be bonded. To qualify for such a license or registration, the debt collector may be required to satisfy minimum capital requirements. Due in part to the 2006 recapitalization, we and our debt collection subsidiary have been required to make special arrangements with state regulators to obtain licensure. Failure to comply with license requirements may subject the debt collector to penalties and/or fines. In addition, state licensing authorities, as well as state consumer protection agencies in many cases, have the authority to investigate debtor complaints against debt collectors and to recommend enforcement actions and seek monetary penalties against debt collectors for violations of state or federal laws.
In addition to complying with the foregoing federal and state laws, in March 2011, West’s debt collection operations entered into a Stipulated Order (“Order”) as part of a settlement agreement that was negotiated with the FTC staff after a lengthy investigation. That Order requires us to comply with the FDCPA and the Federal Trade Commission Act, which will not require any procedural changes; however, violations of either law would subject the Company to a contempt action brought by the FTC in addition to the civil penalties available to private litigants. Further, the Order requires that all current employees and any new employee hired over the next five years be provided with a copy of the Order and a short statement regarding their compliance obligations. The Company is also required to maintain certain types of information and data that is subject to audit and inspection by the FTC over periods ranging from three to six years. Finally, the Company is required to include a new disclosure on all written communications to consumers that directs them to call a toll free number if they have a complaint regarding the manner in which their account was handled.
Teleservices
Teleservices sales practices are regulated at both the federal and state level. The TCPA, enacted in 1991, authorized and directed the FCC to regulate the telemarketing industry. The FCC set forth rules to implement the TCPA. These rules, which have been amended over time, currently place restrictions on the methods and timing of telemarketing sales calls as well as certain calling practices utilized in the accounts receivable management business, including:
| • | restrictions on calls placed by automatic dialing and announcing devices; |
| • | limitations on the use of predictive dialers for outbound calls; |
| • | institution of a National “Do-Not-Call” Registry in conjunction with the FTC; |
| • | guidelines on maintaining an internal “Do-Not-Call” list and honoring “Do-Not-Call” requests; |
| • | requirements for transmitting caller identification information; and |
| • | restrictions on facsimile advertising. |
The Federal Telemarketing Consumer Fraud and Abuse Act of 1994 authorized the FTC to issue regulations designed to prevent deceptive and abusive telemarketing acts and practices. The FTC’s Telemarketing Sales Rule (“TSR”) became effective in January 1996 and has been amended over time. The TSR applies to most outbound telemarketing calls to consumers and portions of some inbound telemarketing calls. The TSR generally:
| • | prohibits a variety of deceptive, unfair or abusive practices in telemarketing sales; |
| • | subjects a portion of inbound calls to additional disclosure requirements; |
| • | prohibits the disclosure or receipt, for consideration, of unencrypted consumer account numbers for use in telemarketing; |
76
Table of Contents
| • | mandates additional disclosure statements relating to certain products or services, and certain types of offers, especially those involving negative option features; |
| • | establishes additional authorization requirements for payment methods that do not have consumer protections comparable to those available under the Electronic Funds Transfer Act or the Truth in Lending Act, or for telemarketing transactions involving pre-acquired account information and free-to-pay conversion offers; |
| • | institutes a National “Do-Not-Call” Registry; |
| • | provides guidelines on maintaining an internal “Do-Not-Call” list and honoring “Do-Not-Call” requests; |
| • | limits the use of predictive dialers for outbound calls; and |
| • | restricts the use of pre-recorded message telemarketing calls. |
In addition to the federal regulations, there are numerous state statutes and regulations governing telemarketing activities. These include restrictions on the methods and timing of telemarketing calls as well as disclosures required to be made during telemarketing calls and individual state “Do-Not-Call” registries. Some states also require that telemarketers register in the state before conducting telemarketing business in the state. Such registration can be time consuming and costly. Many states have an exemption for companies which have securities that are listed on a national securities exchange. As a result of the recapitalization in 2006, our securities are no longer listed on a national securities exchange, and we are therefore unable to avail ourselves of the exemption from state telemarketer registration requirements. In addition, employees who are involved in certain industry-specific sales activity, such as activity regarding insurance or mortgage loans, are required to be licensed by various state commissions or regulatory bodies and to comply with regulations enacted by those bodies.
The industries that we serve are also subject to varying degrees of government regulation, including laws and regulations, relating to contracting with the government and data security. We are subject to some of the laws and regulations associated with government contracting as a result of our contracts with our clients and also as a result of contracting directly with the United States government and its agencies.
With respect to marketing scripts, we rely on our clients and their advisors to develop the scripts to be used by us in making consumer solicitation, on behalf of our clients. We generally require our clients to indemnify us against claims and expenses arising with respect to the scripts and products which they provide to us.
We specifically train our marketing representatives to handle calls in an approved manner. While we believe we are in compliance in all material respects with all federal and state telemarketing regulations, compliance with all such requirements is costly and time consuming. In addition, notwithstanding our compliance efforts, any failure on our part to comply with the registration and other legal requirements applicable to companies engaged in telemarketing activities could have an adverse impact on our business. We could become subject to litigation by private parties and governmental bodies, alleging a violation of applicable laws or regulations, which could result in damages, regulatory fines, penalties and possible other relief under such laws and regulations and the accompanying costs and uncertainties of such litigation and enforcement actions.
77
Table of Contents
Prior to the consummation of this offering, we anticipate electing to our Board one or more independent directors.
Board of Directors
Our board of directors is composed of four outside directors and our Chief Executive Officer. Each director is elected to a term of three years. The following table sets forth information regarding the directors as of December 31, 2011:
| Name |
Age | Position | ||||
| Thomas B. Barker |
57 | Chairman of the Board, Chief Executive Officer and Director | ||||
| Anthony J. DiNovi |
49 | Director | ||||
| Steven G. Felsher |
62 | Director | ||||
| Soren L. Oberg |
41 | Director | ||||
| Jeff T. Swenson |
36 | Director | ||||
The following biographies describe the business experience of each director:
Thomas B. Barker is the Chairman of the Board and Chief Executive Officer of West Corporation. Mr. Barker joined West Corporation in 1991 as Executive Vice President of West Interactive Corporation. He was promoted to President and Chief Operating Officer of West Corporation in March 1995. He was promoted to President and Chief Executive Officer of the Company in September of 1998 and served as our President until January 2004. Mr. Barker has been a director of the Company since 1997 and Chairman of the Board since March 2008. Mr. Barker is the only director who is also a manager of the Company. Mr. Barker provides insight from his 20 year tenure at West, including 13 years as Chief Executive Officer. His many years of experience running the Company provide an in-depth understanding of the Company’s history and complexity and add a valuable perspective for Board decision making.
Anthony J. DiNovi is Co-President of Thomas H. Lee Partners, L.P. (“THL”). Mr. DiNovi joined THL in 1988. Mr. DiNovi is currently a director of Dunkin’ Brands Group Inc. Within the last five years, Mr. DiNovi formerly served on the boards of Michael Foods, Inc., American Media Operations, Inc., Vertis, Inc. and Nortek, Inc. Mr. DiNovi has been director of the Company since 2006 and was Chairman of the Board from October 2006 until March 2008. Mr. DiNovi was selected as a director because of his experience addressing financial, strategic and operating issues as a senior executive of a financial services firm and as a director of several companies in various industries.
Steven G. Felsher is a Senior Advisor at Quadrangle Group LLC. Prior to joining Quadrangle Group LLC in January of 2011, Mr. Felsher was until 2007 the Vice Chairman and Chief Financial Officer-Worldwide of Grey Global Group Inc., a publicly traded, global marketing services company, and was responsible for its integration into WPP Group plc following WPP Group’s acquisition of Grey in March 2005. Mr. Felsher joined Grey in 1979 as a Vice President, became Senior Vice President in 1986, and Chief Financial Officer in 1989. He headed Grey’s Legal Affairs department from 1979 to 1989. Mr. Felsher is a director of NTELOS Holding Corp. and Lumos Networks Corp., as well as a number of private corporations. Within the last five years, Mr. Felsher formerly served on the board of directors of Kit Digital, Inc. Mr. Felsher brings to the Board his experience as a senior executive with particular skills in finance, administration, governance, and other aspects of public and private company management. Mr. Felsher joined the Board in 2011.
Soren L. Oberg is a Managing Director of THL. Mr. Oberg worked at THL from 1993 to 1996 and rejoined in 1998. Mr. Oberg is currently a director of Ceridian Corporation, Grupo Corporativo Ono, S.A and Systems Maintenance Services, Inc. Within the last five years, Mr. Oberg formerly served on the boards of American Media Operations, Inc., Vertis, Inc. and various private companies. Mr. Oberg has been a director of the Company since 2006. Mr. Oberg was selected as a director because of his experience addressing financial, strategic and operating issues as a senior executive of a financial services firm and as a director of several companies in various industries.
78
Table of Contents
Jeff T. Swenson is a Managing Director of THL. Mr. Swenson joined THL in 2004 after attending graduate business school. From 2000 to 2002, Mr. Swenson worked in the private equity group at Bain Capital, LLC. From 1998 to 2000, Mr. Swenson worked at Bain & Company. Mr. Swenson is currently a director of Acosta, Inc. Mr. Swenson has been a director of the Company since 2006. Mr. Swenson was selected as a director because of his experience addressing financial, strategic and operating issues as a senior executive of a financial services firm.
In addition to the individual attributes of each of the directors described above, the Company highly values the collective experience and qualifications of the directors. We believe that the collective experiences, viewpoints and perspectives of our directors results in a Board with the commitment and energy to advance the interests of our stockholders.
The members of the board of directors are not separately compensated for their services as directors, other than reimbursement for out-of-pocket expenses incurred in connection with rendering such services.
Executive Officers of the Registrant
Our executive officers at December 31, 2011 were as follows:
| Name |
Age | Position | ||||
| Thomas B. Barker |
57 | Chairman of the Board and Chief Executive Officer | ||||
| Nancee R. Berger |
51 | President and Chief Operating Officer | ||||
| Mark V. Lavin |
53 | Chief Administrative Officer | ||||
| Paul M. Mendlik |
58 | Chief Financial Officer and Treasurer | ||||
| David C. Mussman |
51 | Executive Vice President, Secretary and General Counsel | ||||
| Steven M. Stangl |
53 | President—Communication Services | ||||
| Todd B. Strubbe |
48 | President—Unified Communications | ||||
| David J. Treinen |
54 | Executive Vice President—Corporate Development and Planning | ||||
Thomas B. Barker is the Chairman of the Board and Chief Executive Officer of West Corporation. Mr. Barker joined West Corporation in 1991 as Executive Vice President of West Interactive Corporation. He was promoted to President and Chief Operating Officer of West Corporation in March 1995. He was promoted to President and Chief Executive Officer of the Company in September of 1998 and served as our President until January 2004. Mr. Barker has been a director of the Company since 1997 and Chairman of the Board since March 2008.
Nancee R. Berger joined West Interactive Corporation in 1989 as Manager of Client Services. Ms. Berger was promoted to Vice President of West Interactive Corporation in May 1994. She was promoted to Executive Vice President of West Interactive Corporation in March 1995 and to President of West Interactive Corporation in October 1996. She was promoted to Chief Operating Officer in September 1998 and to President and Chief Operating Officer in January 2004.
Mark V. Lavin joined us in 1996 as Executive Vice President—West Telemarketing Corporation, and in September 1998, Mr. Lavin was promoted to President—West Telemarketing Corporation. In January 2008, Mr. Lavin was named Chief Administrative Officer.
Paul M. Mendlik joined us in 2002 as Chief Financial Officer and Treasurer. Prior to joining us, he was a partner in the accounting firm of Deloitte & Touche LLP from 1984 to 2002.
David C. Mussman joined West Corporation in January 1999 as Vice President and General Counsel and was promoted to Executive Vice President in 2001. Prior to joining us, he was a partner at the law firm of Erickson & Sederstrom. In 2006, Mr. Mussman became Secretary of the Company.
79
Table of Contents
Steven M. Stangl joined West Interactive Corporation in 1993 as Controller. In 1998, Mr. Stangl was promoted to President of West Interactive Corporation. In January 2004, Mr. Stangl was promoted to President—Communication Services.
Todd B. Strubbe rejoined us in September 2009 as President—Unified Communications. He had previously held the positions of President of West Direct, Inc. and President of West Interactive Corporation between July 2001 and August 2006. Mr. Strubbe served as President, First Data Debit Services in 2006 and 2007. He founded and was Managing Partner of Arbor Capital, LLC during 2008 and 2009. Prior to joining us in 2001, he was President and Chief Operating Officer of CompuBank, N.A. He was with First Data Corporation from 1995 to 2000 as Managing Director, Systems Architecture and Product Development and Vice President of Corporate Planning and Development. Prior to joining First Data, Mr. Strubbe was with McKinsey & Company, Inc.
David J. Treinen joined us in 2007 as Executive Vice President—Corporate Development and Planning. Prior to joining West Corporation, he served as Executive Vice President, Corporate Development and Strategy for First Data Corporation from September 2006 until September 2007. Prior to that assignment, Mr. Treinen held a number of responsibilities with First Data Corporation including Senior Vice President from February 2006 to August 2006, President of First Data Government Solutions from April 2004 to January 2006 and Managing Director of eONE Global, a First Data Corporation subsidiary, from November 2000 through March 2004.
Composition of our Board of Directors
Upon the consummation of this offering, the terms of office of members of our board of directors will be divided into three classes:
| • | Class I directors, whose terms will expire at the annual meeting of stockholders to be held in 2013; |
| • | Class II directors, whose terms will expire at the annual meeting of stockholders to be held in 2014; and |
| • | Class III directors, whose terms will expire at the annual meeting of stockholders to be held in 2015. |
Our Class I directors will be , our Class II directors will be , and our Class III directors will be . At each annual meeting of stockholders, the successors to the directors whose terms will then expire will be elected to serve from the time of election and qualification until the third annual meeting following such election. Any vacancies in our classified board of directors will be filled by the remaining directors and the elected person will serve the remainder of the term of the class to which he or she is appointed. Any additional directorships resulting from an increase in the number of directors will be distributed among the three classes so that, as nearly as possible, each class will consist of one-third of the directors.
Prior to the completion of this offering, our board of directors will make a final determination with respect to the independence of the existing and new members of the Board by reference to the standards of the Nasdaq Global Select Market. A company of which more than 50% of the voting power for the election of directors is held by an individual, a group or another company is considered a “controlled company” under the Nasdaq Marketplace Rules. We intend to avail ourselves of the “controlled company” exception under the Nasdaq Marketplace Rules. Accordingly, we will not have a majority of independent directors on our board of directors. Immediately following the completion of this offering, we expect that at least one member of our board of directors will be independent, as permitted by the applicable Nasdaq Marketplace Rules. Within one year following the completion of this offering, the board of directors will include independent directors under the applicable Nasdaq Marketplace Rules.
80
Table of Contents
Board Structure and Committee Composition
Our board of directors has established an audit committee, a compensation committee and a nominating and corporate governance committee. Each committee will operate under a charter that will be approved by our board of directors. The composition of each committee will be effective upon the closing of this offering.
Since we intend to avail ourselves of the “controlled company” exception under the Nasdaq Marketplace Rules, neither our compensation committee nor our nominating and corporate governance committee will be composed entirely of independent directors as defined under the Nasdaq Marketplace Rules. The controlled company exception does not modify the independence requirements for the audit committee, and we intend to comply with the requirements of the Sarbanes-Oxley Act and the Nasdaq Marketplace Rules, which require that our audit committee be composed of at least three members, a majority of whom will be independent within 90 days of the date of this prospectus, and all of whom will be independent within one year of the date of this prospectus.
Audit Committee
The purpose of the audit committee is set forth in the audit committee charter. The committee’s primary duties and responsibilities are to:
| • | Appoint, compensate, retain and oversee the work of any registered public accounting firm engaged for the purpose of preparing or issuing an audit report or performing other audit, review or attest services and review and appraise the audit efforts of the Company’s independent accountants; |
| • | Establish procedures for (i) the receipt, retention and treatment of complaints regarding accounting, internal accounting controls or auditing matters and (ii) confidential, anonymous submissions by our employees of concerns regarding questionable accounting or auditing matters; |
| • | Engage independent counsel and other advisers, as necessary; |
| • | Determine funding of various services provided by accountants or advisers retained by the committee; |
| • | Review our financial reporting processes and internal controls; |
| • | Review and approve related-party transactions or recommend related-party transactions for review by independent members of our board of directors; and |
| • | Provide an open avenue of communication among the independent accountants, financial and senior management and the board. |
Upon completion of this offering, the audit committee will consist of and will have at least independent director(s) and at least one audit committee financial expert. Prior to the consummation of this offering, our board of directors will adopt a written charter under which the audit committee will operate. A copy of the charter, which will satisfy the applicable standards of the SEC and the Nasdaq Global Select Market, will be available on our web site.
Compensation Committee
The purpose of the compensation committee is to discharge the responsibilities of our board of directors relating to compensation of our directors and executive officers. The compensation committee reviews and recommends to our board of directors compensation plans, policies and programs and approves specific compensation levels for all executive officers. Upon completion of this offering, the compensation committee will consist of and will have at least independent director(s). Prior to the consummation of this offering, our board of directors will adopt a written charter under which the compensation committee will operate. A copy of the charter, which will satisfy the applicable standards of the SEC and the Nasdaq Global Select Market, will be available on our website.
81
Table of Contents
Nominating and Governance Committee
Upon completion of this offering, the nominating and governance committee of our board of directors will consist of and will have at least independent director(s). The nominating and governance committee will be responsible for recruiting and retention of qualified persons to serve on our board of directors, including proposing such individuals to the board of directors for nomination for election as directors, for evaluating the performance, size and composition of the board of directors and for oversight of our compliance activities. Prior to the consummation of this offering, our board of directors will adopt a written charter under which the nominating and governance committee will operate. A copy of the charter, which will satisfy the applicable standards of the SEC and the Nasdaq Global Select Market, will be available on our website.
Code of Ethics
We have adopted a code of ethical conduct for directors and all employees of the Company. Our Code of Ethical Business Conduct is located in the “Financial Information” section of our website at www.west.com. To the extent permitted, we intend to post on our web site any amendments to, or waivers from, our Code of Ethical Business Conduct that are required to be disclosed pursuant to SEC rules within four business days of the amendment or waiver, as the case may be.
82
Table of Contents
Compensation Discussion and Analysis
Objectives
The objectives of our executive compensation plans are to recruit, retain and motivate the most talented individuals available to meet or exceed our business objectives.
Our compensation plans are designed to reward executives for achievement of objective financial goals related to the executives’ scope of responsibility that, in the aggregate, comprise our business objectives. The objective financial goals vary between reporting segments and among departments within those segments as well as among different corporate functions. The purpose of our compensation plans is to tailor executive compensation to the particular objective financial goals that the individual can most control as well as those goals that, if achieved, will have the greatest positive impact on our business objectives.
The compensation committee, which in 2011 consisted of Mr. Barker and Mr. DiNovi, determines the annual cash salary and bonuses of executives based upon recommendations from Mr. Barker. During several meetings of the compensation committee, Mr. Barker, the CEO, presented his evaluation of each executive and recommended the 2011 annual cash salary and bonuses for each executive, excluding himself. In making his recommendations, Mr. Barker solicited information and recommendations on each executive’s duties, responsibilities, business goals, objectives and upcoming challenges of the business from Mr. Mendlik, the CFO, and Ms. Berger, the President and COO. As part of the discussions during the compensation committee meetings, the compensation committee considered, among other factors, our ability to replace the executive in the event of the executive’s departure, the executive’s responsibilities, the size of the organization (including number of employees, revenue and profitability under the executive’s control), the amount received by others in relatively similar positions within the company, title and the period of time since the executive’s targeted annual compensation was last changed. Mr. DiNovi also discussed the compensation committee’s recommendations with Mr. Steiner, while he served as a member of our board in 2011. Following the discussion with Mr. Steiner, the compensation committee approved final annual base salary and bonus recommendations at the compensation committee’s January 24, 2011 meeting. These recommendations were consistent with Mr. Barker’s recommendations, with changes based on the discussions between Mr. DiNovi and Mr. Barker. Mr. Barker is not involved in the setting of his compensation levels, but rather Mr. DiNovi considers Mr. Barker’s compensation independently.
Compensation Elements
Base Salary and Bonuses
We primarily rely upon cash compensation to achieve quarterly and annual objective financial goals. We believe that a market-competitive annual salary, supplemented with performance-based cash bonuses, provides the basis for recruiting and retaining talented individuals who have the ability and motivation to achieve our objective financial goals. Each executive receives a portion of his or her projected annual cash bonus quarterly if we meet or exceed objective financial goals for the quarter. The methodology for determining bonuses is set forth below.
Executive performance is not considered in determining annual salary. Rather, annual salary is designed to provide adequate compensation to recruit and retain talented individuals that have the ability and desire to achieve the objective financial goals that ultimately determine annual bonuses and long-term compensation awarded to the named executive officers.
Recommendations for each named executive officer’s base salary and target bonus are provided to the compensation committee by our CEO annually, as described above under “—Objectives.” Factors considered by Mr. Barker in making such recommendations include:
83
Table of Contents
| • | A review of the scope of responsibilities of the executive compared to what was required of him or her in the previous year; |
| • | Assignment of financial and operational targets related to specific business objectives; |
| • | The qualitative analysis and recommendations of the CFO and COO; and |
| • | Time since targeted annual compensation was last changed. |
After Mr. Barker reviews the goals and objectives for the executives for the upcoming year, the expected duties, expected contribution of the relevant business unit to our profitability, the recommendations of the CFO and COO and the time since the last change in targeted annual compensation, he recommends a targeted compensation amount to Mr. DiNovi. These recommendations are discussed with Mr. DiNovi and are approved by the compensation committee. Mr. DiNovi considers Mr. Barker’s compensation independently. Mr. DiNovi did not undertake a formal benchmarking process to evaluate Mr. Barker’s 2011 compensation. Generally, no more than half of an executive’s targeted annual compensation consists of base salary. The percentage of compensation derived from base salary generally declines as the executive’s position or responsibilities within our company grow.
Our goal is to reward the achievement of objective financial goals and assumption of additional responsibilities. The compensation committee makes a qualitative analysis of these items as well as the potential impact the success or failure of the executive with respect to these items will have on us. We also recognize that many of our executives have opportunities for alternative employment and aim to establish salary and bonus packages that are competitive with such alternatives. In determining the differences among the executives’ compensation in 2011, the committee relied on Mr. Barker’s qualitative analysis of the factors described above.
Mr. Stangl’s 2011 base salary was increased from $450,000 to $500,000 as the compensation committee recognized the challenges Mr. Stangl would face managing the Communication Services segment and that Mr. Stangl’s base salary had not increased since 2008.
2011 Annual Cash Bonuses
We primarily rely upon cash bonuses, paid quarterly and annually based upon annual objective financial goals, to compensate employees for annual performance. We have designed our cash bonuses to represent a significant portion of the targeted total annual cash compensation of our named executive officers. We pay performance-based bonuses only upon the achievement of pre-determined objective financial goals. Historically, the more senior the executive position in West, the greater percent of that executive’s target annual compensation consists of targeted bonuses versus salary.
To timely reward executives, we pay a portion of the projected annual cash bonuses on a quarterly basis provided the pre-determined objective financial goals were met for that quarter and the annual objectives are projected to be met. We retain 25% of the quarterly bonuses, and pay such holdback in February of the following year provided the annual objective financial goals are met. In the event the annual objective financial goals are not met, we retain the option to require repayment or to offset any pro-rata quarterly portion of the bonus that was paid in anticipation of meeting the annual objective financial goals against future earned bonuses.
The compensation committee approves our objective financial goals and then approves compensation packages with performance-based financial measurements that the compensation committee believes will adequately motivate the executives to meet those goals. For 2011, the objective financial measurements approved by the compensation committee for the named executive officers were EBITDA, revenues and net operating income. For purposes of bonus calculations in 2011, EBITDA was defined as earnings before interest, taxes, depreciation and amortization (“EBITDA”) less the EBITDA of entities acquired after the 2011 budget was approved, plus acquisition related costs incurred on pending or unsuccessful acquisitions, plus the aggregate Senior Management Retention Plan bonuses, plus the amortization charge incurred with the 2011 modification of the vesting criteria of the restricted stock awards and plus or minus the EBITDA variance on unbudgeted acquisitions between the Board approved acquisition plan and actual EBITDA results of the acquired entities.
84
Table of Contents
Barker
In 2011, Mr. Barker earned a performance bonus based on EBITDA. Mr. Barker’s 2011 bonus was earned in three tranches. Tranche 1 was earned at a rate of $1,577 for each million dollars of EBITDA up to the amount of 2010 EBITDA. The maximum bonus under Tranche 1 was $1,000,000. Tranche 2 was earned at a rate of $28,022 for each million dollars of EBITDA in excess of our 2010 EBITDA up to $670 million of EBITDA. The maximum bonus under Tranche 2 was $1,000,000. Tranche 3 was earned at a rate of $47,170 for each million dollars of EBITDA in excess of $670 million dollars of EBITDA. There was no maximum amount earned under Tranche 3. Mr. Barker’s 2011 performance bonus calculation is presented in the table below:
| 2011 EBITDA |
$ | 648,817,679 | ||||||
| Less unbudgeted acquisitions |
(2,177,256 | ) | ||||||
| Plus acquisition related costs |
1,054,903 | |||||||
| Plus Senior Management Retention Plan |
4,050,000 | |||||||
| Plus Modified amortization on Restricted Stock |
18,503,332 | |||||||
| Plus EBITDA variance on unbudgeted acquisitions |
57,906 | |||||||
|
|
|
|||||||
| Total approved adjustments |
21,488,885 | |||||||
|
|
|
|||||||
| EBITDA for bonus purposes |
670,306,564 | |||||||
| Less 2010 EBITDA |
634,314,094 | |||||||
|
|
|
|||||||
| 2011 EBITDA growth for bonus calculation |
$ | 35,992,470 | ||||||
| Tranche 1 |
1,000,000 | |||||||
| Tranche 2 |
1,000,000 | |||||||
| Tranche 3 |
14,461 | |||||||
|
|
|
|||||||
| 2011 performance bonus |
$ | 2,014,461 | ||||||
|
|
|
Berger
In 2011, Ms. Berger earned a performance bonus based on EBITDA. Ms. Berger’s 2011 bonus was earned in three tranches. Tranche 1 was earned at a rate of $1,104 for each million dollars of EBITDA up to the amount of 2010 EBITDA. The maximum bonus under Tranche 1 was $700,000. Tranche 2 was earned at a rate of $19,616 for each million dollars of EBITDA in excess of our 2010 EBITDA up to $670 million dollars of EBITDA. The maximum bonus under Tranche 2 was $700,000. Tranche 3 was earned at a rate of $33,019 for each million dollars of EBITDA in excess of $670 million dollars of EBITDA. There was no maximum amount earned under Tranche 3. Ms. Berger’s 2011 performance bonus calculation is presented in the table below:
| 2011 EBITDA |
$ | 648,817,679 | ||||||
| Less unbudgeted acquisitions |
(2,177,256 | ) | ||||||
| Plus acquisition related costs |
1,054,903 | |||||||
| Plus Senior Management Retention Plan |
4,050,000 | |||||||
| Plus Modified amortization on Restricted Stock |
18,503,332 | |||||||
| Plus EBITDA variance on unbudgeted acquisitions |
57,906 | |||||||
|
|
|
|||||||
| Total approved adjustments |
21,488,885 | |||||||
|
|
|
|||||||
| EBITDA for bonus purposes |
670,306,564 | |||||||
| Less 2010 EBITDA |
634,314,094 | |||||||
|
|
|
|||||||
| 2011 EBITDA growth for bonus calculation |
$ | 35,992,470 | ||||||
| Tranche 1 |
700,000 | |||||||
| Tranche 2 |
700,000 | |||||||
| Tranche 3 |
10,122 | |||||||
|
|
|
|||||||
| 2011 performance bonus |
$ | 1,410,122 | ||||||
|
|
|
85
Table of Contents
Mendlik
In 2011, Mr. Mendlik earned a performance bonus based on EBITDA. Mr. Mendlik’s 2011 bonus was earned in three tranches. Tranche 1 was earned at a rate of $355 for each million dollars of EBITDA up to the amount of 2010 EBITDA. The maximum bonus under Tranche 1 was $225,000. Tranche 2 was earned at a rate of $6,305 for each million dollars of EBITDA in excess of our 2010 EBITDA up to $670 million dollars of EBITDA. The maximum bonus under Tranche 2 was $225,000. Tranche 3 was earned at a rate of $10,613 for each million dollars of EBITDA in excess of $670 million dollars of EBITDA. There was no maximum amount earned under Tranche 3. Mr. Mendlik’s 2011 performance bonus calculation is presented in the table below:
| 2011 EBITDA |
$ | 648,817,679 | ||||||
| Less unbudgeted acquisitions |
(2,177,256 | ) | ||||||
| Plus acquisition related costs |
1,054,903 | |||||||
| Plus Senior Management Retention Plan |
4,050,000 | |||||||
| Plus Modified amortization on Restricted Stock |
18,503,332 | |||||||
| Plus EBITDA variance on unbudgeted acquisitions |
57,906 | |||||||
|
|
|
|||||||
| Total approved adjustments |
21,488,885 | |||||||
|
|
|
|||||||
| EBITDA for bonus purposes |
670,306,564 | |||||||
| Less 2010 EBITDA |
634,314,094 | |||||||
|
|
|
|||||||
| 2011 EBITDA growth for bonus calculation |
$ | 35,992,470 | ||||||
| Tranche 1 |
225,000 | |||||||
| Tranche 2 |
225,000 | |||||||
| Tranche 3 |
3,254 | |||||||
|
|
|
|||||||
| 2011 performance bonus |
$ | 453,254 | ||||||
|
|
|
Stangl
In 2011, Mr. Stangl’s bonus calculation was composed of three components. Under the first component Mr. Stangl was eligible to receive a bonus equal to 0.156% of the net operating income before corporate allocations and before amortization for the Communication Services segment (“CS NOI”) up to $191,987,000. If CS NOI exceeded $191,987,000, a bonus rate of 2.0% would be applied to the excess. The 2011 CS NOI, after adjusting for unbudgeted net operating income of acquired Communication Services entities, unbudgeted acquisition related costs and the net operating income variance on unbudgeted acquisitions was $159,378,913. This resulted in a $248,631 performance bonus ($159,378,913 x 0.156%) for meeting the first component objective. The second component was based on the achievement of the Communication Services segment revenue budget, which was considered achievable when the objective was established. Mr. Stangl would receive 100% of the revenue bonus potential of $300,000 if 98% or more of the revenue budget was achieved, 80% of the revenue bonus for achieving 95% to 97.99% of the revenue budget, 50% of the revenue bonus for achieving 90% to 94.99% of the revenue budget and zero if less than 90% of the revenue budget was achieved. Revenue results for the Communication Services segment were 92% of the revenue budget resulting in a $150,000 performance bonus for the second component objective. The third component consisted of a $100,000 bonus payable based on West Corporation’s achievement of a minimum 2011 Adjusted EBITDA objective originally established when the Company provided its guidance in February 2011. That guidance indicated that 2011 Adjusted EBITDA would range from $660 million to $690 million. 2011 Adjusted EBITDA was $681.4 million, therefore, the third component of Mr. Stangl’s performance bonus resulted in a $100,000 payout. Mr. Stangl’s total 2011 performance bonus was $498,631 ($248,631 + $150,000 + $100,000).
Strubbe
In 2011, Mr. Strubbe’s bonus calculation was composed of two components. Under the first component Mr. Strubbe was eligible to receive a bonus equal to 0.0972% of the net operating income before corporate
86
Table of Contents
allocations and before amortization for the Unified Communications segment (“UC NOI”) up to $411,622,000. If UC NOI exceeded $411,622,000 a bonus rate of 1.0% would be applied to the excess. The 2011 UC NOI, after adjusting for unbudgeted net operating income of acquired Unified Communications entities, unbudgeted acquisition related costs and the net operating income variance on unbudgeted acquisitions was $426,812,737. This resulted in a $542,976 bonus ($412,622,000 x 0.0972%) + (($426,812,737 – 412,622,000) x 1%) for meeting the first component objective. The second component consisted of a $100,000 bonus payable based on West Corporation’s achievement of a minimum 2011 Adjusted EBITDA objective originally established when the Company provided its guidance in February 2011. That guidance indicated that 2011 Adjusted EBITDA would range from $660 million to $690 million. 2011 Adjusted EBITDA was $681.4 million, therefore, the second component of Mr. Strubbe’s performance bonus resulted in a $100,000 payout. Mr. Strubbe’s total 2011 performance bonus was $642,976 ($542,976 + $100,000).
Discretionary Bonuses
Periodically, executives earn discretionary bonuses to recognize results or significant efforts that may not be reflected in the financial measurements set forth above. We believe that these discretionary bonuses are necessary when important company events require significant time and effort by the executive in addition to the time and effort needed for meeting our target financial objectives.
Senior Management Retention Bonuses
On September 16, 2011, the board of directors adopted the West Corporation Senior Management Retention Plan (“Retention Plan”) for the benefit of certain executive officers and other key employees of the Company. Under the terms of the Retention Plan, participants that remained employed through October 24, 2011 received a retention bonus in an amount designated by the board. If a participant ceases to be employed by the Company prior to October 24, 2012 other than on account of such participant’s death, then such participant shall be obligated to repay all or a portion of the retention bonus as follows. If, prior to October 24, 2012, a participant’s employment is terminated by the Company for cause or voluntarily by the participant, then such participant shall be obligated to pay to the Company 100% of such participant’s retention bonus. If prior to October 24, 2012, a participant’s employment with the Company is terminated for any reason other than by the Company for cause or voluntary termination by the participant, then such participant shall be obligated to pay to the Company a pro rata portion of the participant’s retention bonus (based on days employed during the twelve month period beginning October 25, 2011). Subject to the terms of the Retention Plan, Mr. Barker, Ms. Berger, Mr. Stangl and Mr. Mendlik received retention bonuses of $2.1 million, $1.0 million, $250,000 and $250,000, respectively.
Long-Term Incentive Compensation
We primarily rely upon equity-based plans to recruit talented individuals and to motivate them to meet or exceed our long-term business objectives.
2011 Adjustments to Outstanding Awards
Following our recapitalization on October 24, 2006, the board of directors adopted the West Corporation 2006 Executive Incentive Plan. At the time of our recapitalization in 2006, we allocated approximately 8% of the outstanding common stock for restricted stock grants and 3% of the outstanding common stock for option grants. On December 30, 2011, we completed the conversion of each share of outstanding Class L Common Stock into 40.29 shares of Class A Common Stock and the reclassification of all of our Class A Common Stock as a single class of Common Stock. On December 30, 2011, our Board of Directors also approved an amendment to the 2006 EIP to increase the maximum number of shares of Common Stock that may be issued pursuant to or subject to outstanding awards under the 2006 EIP from 11,276,291 to 38,435,427. In accordance with the terms of the 2006 EIP, the Board of Directors adjusted the securities subject to outstanding awards under the 2006 EIP to give effect to the conversion and the reclassification as well as the plan amendment.
87
Table of Contents
On December 30, 2011, the Board of Directors approved amendments to restricted stock agreements with each of the current holders of outstanding restricted stock. The amendments provide for immediate vesting of all shares awarded pursuant to the agreements and that were outstanding for more than five years, as of the date of the amendment. For shares outstanding for less than five years, the board of directors approved an amendment to provide for vesting of all such awards upon the earlier of the five year anniversary of grant or a change of control of the Company. Previously, a portion of the shares subject to these awards vested only upon meeting certain performance criteria. The amendments to the restricted stock agreements resulted in the vesting of an aggregate of 4,371,864 shares of common stock and the recognition of $18.5 million of share based compensation expense in selling general and administrative expense to reflect the fair value of the modified vesting of the shares.
Annual Grants
The Company continues to believe that the long-term business objectives of the Company and its shareholders are best achieved through the use of equity-based grants. Because there is no current public market for the Company’s equity, and thus no public price, the grants, if any, will generally be made on an annual basis with a grant or exercise price based on fair market valuation of our equity determined by an independent appraisal. The compensation committee determines the size of restricted stock grants under the 2006 Plan based upon the CEO’s determination of the overall value of the executive to the Company, including the following factors: 1) the executive’s expected impact on the Company’s financial objectives; 2) recommendations of other members of senior management; 3) the Company’s ability to replace the executive in the event of the executive’s departure; 4) the size of the organization including number of employees, revenue and income under the executive’s control; 5) the amount received by others in relatively similar positions within the Company; and 6) title. There were no grants to the named executive officers in 2011.
Other Long-Term Benefit Plans
We also provide a Nonqualified Deferred Compensation Plan, which we refer to as our Deferred Compensation Plan, to certain of our senior level executives. Eligible executives are allowed to defer annually their bonus and up to 50% of salary not to exceed $500,000, in each case, attributable to services performed in the following plan year. The plan provides that the deferrals are credited with notional earnings based on notional shares of various mutual funds or notional equity interests in our company, at the election of the executive. If the executive chooses notional equity interests in our company as the investment alternative we match a portion of the executive’s deferrals. For 2011, the matching contribution was 50%. Matching contributions to the plan vest ratably over a five-year period beginning on January 1, 2007 or, if later, the date the executive first participates in the plan. The vested portion of the participant’s account under the plan will be paid on the date specified by the participant which can be no earlier than five years following the plan year of deferral or, if earlier, the date the participant separates from service with us. Deferrals credited with earnings based on notional equity interests are paid through the issuance of our shares. Recipients of the shares have no equity or contractual put right with respect to the shares until distributed to them in accordance with the plan. We believe this plan further aligns the interests of executive management and the long term goals of equity holders by providing an ongoing plan that allows executives to increase their equity interest in us.
We also provide a 401(k) plan and a deferred compensation “top hat” plan, Executive Retirement Savings Plan, pursuant to sections 201(2) and 301(a)(3) of ERISA, which we refer to as our Executive Retirement Savings Plan. We match contributions up to 14% of income or the statutory limit, whichever is less. We believe that such plans provide a mechanism for the long-term financial planning of our employees. We have chosen not to include our equity in either plan or to base our matching contributions on individual performance.
Other
We provide discretionary perquisites from time to time for purpose of motivating employees, creating goodwill with employees and rewarding employees for achievements that may not be measurable financial objectives. We do not believe perquisites should be a significant element of our compensation program.
We provide health and benefits plans and reimburse employees for approved business related expenses.
88
Table of Contents
Summary Compensation
The following table shows compensation information for 2011, 2010 and 2009 for the named executive officers, as applicable.
2011 Summary Compensation Table
| Name and Principal Position (a) |
Year (b) |
Salary ($) (c) |
Bonus (1) ($) (d) |
Stock Awards (2) ($) (e) |
Non-Equity Incentive Plan Compensation (3) ($) (f) |
All
Other Compensation (4) ($) (g) |
Total ($) (h) | |||||||||||||||||||||
| Thomas B. Barker |
2011 | 900,000 | 2,100,000 | 2,688,570 | 2,014,461 | 841,210 | 8,544,241 | |||||||||||||||||||||
| Chief Executive Officer and Director |
2010 | 900,000 | — | — | 915,310 | 781,313 | 2,596,623 | |||||||||||||||||||||
| 2009 | 900,000 | — | — | 1,373,281 | 297,110 | 2,570,391 | ||||||||||||||||||||||
| Nancee R. Berger |
2011 | 600,000 | 1,000,000 | 2,095,105 | 1,410,122 | 265,590 | 5,370,817 | |||||||||||||||||||||
| President and Chief Operating Officer |
2010 | 600,000 | — | — | 610,207 | 181,355 | 1,391,562 | |||||||||||||||||||||
| 2009 | 600,000 | — | — | 915,682 | 419,180 | 1,934,862 | ||||||||||||||||||||||
| Paul M. Mendlik |
2011 | 450,000 | 250,000 | 1,396,737 | 453,254 | 260,572 | 2,810,563 | |||||||||||||||||||||
| Chief Financial Officer and Treasurer |
2010 | 450,000 | — | — | 239,736 | 93,573 | 783,309 | |||||||||||||||||||||
| 2009 | 450,000 | 93,951 | — | 359,715 | 282,384 | 1,186,050 | ||||||||||||||||||||||
| Steven M. Stangl |
2011 | 500,000 | 250,000 | 1,396,737 | 498,631 | 9,492 | 2,654,860 | |||||||||||||||||||||
| President—Communication Services |
2010 | 450,000 | — | — | 387,936 | 61,242 | 899,178 | |||||||||||||||||||||
| 2009 | 450,000 | — | — | 467,367 | 124,564 | 1,041,931 | ||||||||||||||||||||||
| Todd B. Strubbe |
2011 | 500,000 | — | 1,117,389 | 642,976 | 59,060 | 2,319,425 | |||||||||||||||||||||
| President—Unified Communications |
2010 | 500,000 | — | — | 356,001 | 59,060 | 915,061 | |||||||||||||||||||||
| 2009 | 125,000 | 100,000 | 1,205,213 | — | 2,142,591 | 3,572,804 | ||||||||||||||||||||||
| (1) | On September 16, 2011 the board of directors adopted the West Corporation Senior Management Retention Plan for the benefit of certain executive officers and other key employees of the Company. Subject to the terms of the Senior Management Retention Plan, Mr. Barker, Ms. Berger. Mr. Stangl and Mr. Mendlik received retention bonuses of $2.1 million, $1.0 million, $250,000 and $250,000, respectively, in 2011. |
| (2) | The amounts reported for 2011 represent the incremental fair value associated with the 2011 modification of the vesting terms of the outstanding restricted stock awards, computed in accordance with Financial Accounting Standards Board Accounting Standards Codification Topic 718, Compensation—Stock Compensation (“ASC Topic 718”). See note 12 of the notes to the consolidated financial statements included in this report for a discussion of the relevant assumptions used in calculating this amount pursuant to ASC Topic 718. |
| (3) | The amounts in this column constitute performance-based bonuses earned under employment agreements approved by the compensation committee at the beginning of each fiscal year. Please see the “Compensation Discussion and Analysis” for further information regarding these performance-based bonuses. |
| (4) | Amounts included in this column are set forth by category below in the 2011 “All Other Compensation Table”. |
89
Table of Contents
2011 All Other Compensation Table
| Name (a) |
Tax Reimbursements(1) (b) |
Insurance Premiums ($)(2) (c) |
Company Contributions to Retirement Plans ($)(3) (d) |
Total ($) (f) |
||||||||||||
| Thomas B. Barker |
575,705 | 7,255 | 258,250 | 841,210 | ||||||||||||
| Nancee R. Berger |
— | 7,340 | 258,250 | 265,590 | ||||||||||||
| Paul M. Mendlik |
— | 2,322 | 258,250 | 260,572 | ||||||||||||
| Steven M. Stangl |
— | 1,242 | 8,250 | 9,492 | ||||||||||||
| Todd B. Strubbe |
— | 810 | 58,250 | 59,060 | ||||||||||||
| (1) | Mr. Barker was paid a special bonus in the amount necessary to pay federal and state income taxes associated with a distribution from the Deferred Compensation Plan. |
| (2) | Includes premiums paid by us for group term life insurance for each of our named executive officers. In addition, this column includes Company paid medical and dental premiums for Mr. Barker and Ms. Berger. |
| (3) | Includes the employer match on the Executive Deferred Compensation Plan, Qualified Retirement Savings Plan and Non-qualified Deferred Compensation Plan. |
2011 Grants of Plan-Based Awards
The following table shows awards made or modified to our named executive officers in 2011.
| Estimated Possible Payouts Under Non-Equity Incentive Plan Awards (1) |
All
Other Stock Awards: Number of shares of stock or units (#) (d) (2) |
Grant Date Fair Value of Stock Awards (#) (e) (3) |
||||||||||||||
| Name (a) |
Target ($) (b) |
Maximum ($) (c) |
||||||||||||||
| Thomas B. Barker |
2,100,000 | N/A | 641,663.5 | 2,688,570 | ||||||||||||
| Nancee R. Berger |
1,400,000 | N/A | 500,025 | 2,095,105 | ||||||||||||
| Paul M. Mendlik |
550,000 | N/A | 333,350 | 1,396,737 | ||||||||||||
| Steven M. Stangl |
700,000 | N/A | 333,350 | 1,396,737 | ||||||||||||
| Todd B. Strubbe |
500,000 | N/A | 266,680 | 1,117,389 | ||||||||||||
| (1) | The employment agreements for each named executive officer provide for performance-based bonuses if certain performance objectives are achieved. The performance-based bonus opportunities for the named executive officers did not provide for a maximum bonus opportunity. Amounts actually earned under the employment agreements are reflected in column (f) to the 2011 Summary Compensation Table. Please see the “Compensation Discussion and Analysis” section for further information regarding the 2011 annual performance-based bonus. |
| (2) | Amounts in this column represent the number of restricted stock awards modified by the 2011 modification to the vesting criteria. |
| (3) | The amounts reported in this column represent the incremental fair value associated with the 2011 modification of the vesting terms of the outstanding restricted stock awards, as computed in accordance with FASB ASC 718. See note 12 of the notes to the consolidated financial statements included in this report for a discussion of the relevant assumptions used in calculating this amount pursuant to ASC Topic 718. |
Employment Agreements
During 2011, all of the named executive officers were employed pursuant to agreements with us. Each employment agreement sets forth, among other things, the named executive officer’s minimum base salary,
90
Table of Contents
non-equity incentive compensation opportunities and entitlement to participate in our benefit plans. The employment agreements are updated annually to reflect salary and bonus objectives for the applicable year.
Salary and Bonus
The 2011 base salaries for the named executive officers established by the compensation committee on January 24, 2011 were: Mr. Barker, Chief Executive Officer, $900,000; Ms. Berger, President and Chief Operating Officer, $600,000; Mr. Mendlik, Chief Financial Officer and Treasurer, $450,000; Mr. Stangl, President—Communication Services, $500,000 and Mr. Strubbe, President—Unified Communications, $500,000.
We have designed our non-equity incentive compensation to represent a significant portion of targeted total annual cash compensation of named executive officers. We pay performance-based bonuses only upon the achievement of pre-determined objective financial goals. The objective financial goals are tailored to the business objectives of the business unit or units managed by the named executive officer. The 2011 objective financial measurement was EBITDA for Mr. Barker, Ms. Berger and Mr. Mendlik. Mr. Stangl’s 2011 objective financial measurements were Communication Services net operating income before corporate allocations and amortization Communication Services revenue and the achievement of a minimum Adjusted EBITDA by West Corporation. Mr. Strubbe’s 2011 objective financial measurements were Unified Communications net operating income before corporate allocations and amortization and the achievement of a minimum Adjusted EBITDA by West Corporation. Please see “Compensation Discussion and Analysis” for a discussion of the specific incentive-based targets for each of the named executive officers.
Term and Termination
The term of each Employment Agreement commenced on January 1, 2009 except Mr. Strubbe’s which commenced on September 28, 2009, and continues indefinitely until terminated pursuant to its terms. Each Employment Agreement terminates immediately upon the death of the executive and may otherwise be terminated voluntarily by either party at any time.
In the event that an employment agreement is terminated, the executive is entitled to severance payments determined by the nature of the termination. If we terminate an employment agreement for Cause (as described below), the executive is entitled only to the obligations already accrued under his or her employment agreement (any such obligations are referred to as “accrued obligations”). An executive who dies is entitled to the accrued obligations and the earned bonus for the year in which his or her death occurs. If an executive terminates his or her employment agreement without Good Reason (as described below), the executive is entitled to receive any accrued obligations and, if the executive is providing consulting services, a multiple of his or her base salary payable in equal installments for the consulting period beginning on the date of the termination. If we terminate an employment agreement without Cause or if an executive terminates his or her employment agreement for Good Reason, the executive is entitled to receive any accrued obligations and a multiple of that executive’s base compensation payable in equal installments for the one or two-year period beginning on the date of the termination and, if the executive is providing consulting services to us, an amount equal to the projected annual bonus payable to that executive as of the date of the termination, payable in equal installments for the one or two-year period beginning on the date of the termination. For purposes of determining the severance benefits under the employment agreement, the severance multiple is equal to one for Mr. Strubbe and two for all of the other named executive officers. In any case where our obligation to make severance payments to an executive is conditioned on that executive’s provision of consulting services to us, that obligation terminates immediately in the event that the executive ceases to provide such consulting services within the two-year period beginning on the date of the termination.
Under the employment agreements, “cause” shall be deemed to exist if there is a determination that the executive has engaged in significant objective acts or omissions constituting dishonesty, willful misconduct, or
91
Table of Contents
gross negligence relating to our business. The employment agreements define “good reason” as the occurrence of one of the following events without the consent of the executive:
| • | both (i) a reduction in any material respect in the executive’s position(s), duties or responsibilities with the company, and (ii) an adverse material change in the executive’s reporting responsibilities, titles or offices with the company, other than, for purposes of clauses (i) and (ii), a reduction or adverse change attributable to the fact that the company is no longer a privately-held company; |
| • | a reduction of 20 percent (20%) or more in the executive’s rate of annual base salary other than a reduction made after the company determines such reduction is a reasonably necessary step or component to address potential breaches or violations of any debt covenants; or |
| • | any requirement of the company that the executive be based more than 50 miles from the facility where the executive is based as of the date of the employment agreement. |
Consulting Services
If we terminate an employment agreement without Cause or if an executive terminates his or her employment agreement with or without Good Reason, we have agreed to retain the executive as a consultant for a period of one or two years (as described above) from the date of the termination. During the consulting period, the executive will receive compensation from us as described above and will remain covered under all medical, dental, vision, flexible spending account and executive assistance plans or programs available to our actively employed executives. The executive may terminate his or her consulting obligations to us at any time during the consulting period. In the event that an executive chooses to engage in other employment, the consulting period and the parties’ respective obligations are immediately terminated.
Restrictive Covenants
Pursuant to each employment agreement, each executive is subject to restrictive covenants related to the protection of confidential information, non-competition, inventions and discoveries, and the diversion of our employees. An executive’s breach of any of the restrictive covenants contained in an employment agreement entitles us to injunctive relief and the return of any severance payments (excluding accrued obligations) in addition to any other remedies to which we may be entitled.
Restricted Stock and Stock Option Awards
Restricted Stock and Stock Option Awards
In 2011, no named executive officers received grants of restricted stock or stock options. As noted in the “Compensation Discussion and Analysis,” on December 30, 2011, the Board of Directors approved amendments to outstanding restricted stock agreements with each of the current holders of outstanding restricted stock. The amendments provide for immediate vesting of all shares awarded pursuant to the agreements and that were outstanding for more than five years as of the date of the amendment. For shares outstanding for less than five years, the board of directors approved an amendment to provide for vesting of all such awards upon the earlier of the five year anniversary of grant or a change of control of the Company. Previously, a portion of the shares subject to these awards vested only upon meeting certain performance criteria. The amendments to the restricted stock agreements resulted in the vesting of all of the outstanding shares held by Mr. Barker, Ms. Berger, Mr. Mendlik and Mr. Stangl.
92
Table of Contents
Outstanding Equity Awards
The following table shows all outstanding equity awards held by the named executive officers as of December 31, 2011. On December 30, 2011, we completed the conversion of our outstanding Class L Common Stock into 40.29 shares of Class A Common Stock and the reclassification of all of our Class A Common Stock as a single class of Common Stock. The amounts reported in the table represent the number of shares of Common Stock subject to the equity awards.
2011 Outstanding Equity Awards At Fiscal Year-End Table
| Option Awards | Stock Awards | |||||||||||||||||||
| Name (a) |
Number of Securities Underlying Unexercised Options (#) Exercisable(1) (b) |
Option Exercise Price ($) (c) |
Option Expiration Date (d) |
Number of Shares or Units of Stock That Have Not Vested (#)(2) (e) |
Market Value of Shares or Units of Stock That Have Not Vested(3) ($) (f) |
|||||||||||||||
| Thomas B. Barker |
379,656.0 | $ | 0.7900 | 4/1/2013 | — | — | ||||||||||||||
| 2,179,979.6 | $ | 0.6834 | 4/1/2013 | |||||||||||||||||
| 212,500.1 | $ | 0.6834 | 7/1/2013 | |||||||||||||||||
| 234,930.9 | $ | 0.6834 | 10/1/2013 | |||||||||||||||||
| 163,316.8 | $ | 0.6834 | 1/2/2014 | |||||||||||||||||
| 154,165.8 | $ | 0.6834 | 4/1/2014 | |||||||||||||||||
| 143,107.4 | $ | 0.6834 | 7/1/2014 | |||||||||||||||||
| 124,008.7 | $ | 0.6834 | 10/1/2014 | |||||||||||||||||
| 49,110.9 | $ | 0.6834 | 1/3/2015 | |||||||||||||||||
|
|
|
|||||||||||||||||||
| 3,640,776.2 | ||||||||||||||||||||
| Nancee R. Berger |
379,656.0 | $ | 0.7900 | 4/1/2013 | — | — | ||||||||||||||
| 340,009.9 | $ | 0.6834 | 7/1/2013 | |||||||||||||||||
| 375,889.4 | $ | 0.6834 | 10/1/2013 | |||||||||||||||||
| 261,297.2 | $ | 0.6834 | 1/2/2014 | |||||||||||||||||
| 246,665.3 | $ | 0.6834 | 4/1/2014 | |||||||||||||||||
| 228,942.9 | $ | 0.6834 | 7/1/2014 | |||||||||||||||||
| 198,375.3 | $ | 0.6834 | 10/1/2014 | |||||||||||||||||
| 78,567.8 | $ | 0.6834 | 1/3/2015 | |||||||||||||||||
|
|
|
|||||||||||||||||||
| 2,109,403.8 | ||||||||||||||||||||
| Paul M. Mendlik |
— | — | — | — | ||||||||||||||||
| Steven M. Stangl |
61,666.3 | $ | 0.6834 | 4/1/2014 | — | — | ||||||||||||||
| 107,928.2 | $ | 0.6834 | 4/1/2014 | |||||||||||||||||
| 57,223.7 | $ | 0.6834 | 7/1/2014 | |||||||||||||||||
| 100,153.5 | $ | 0.6834 | 7/1/2014 | |||||||||||||||||
| 49,593.8 | $ | 0.6834 | 10/1/2014 | |||||||||||||||||
| 86,777.1 | $ | 0.6834 | 10/1/2014 | |||||||||||||||||
|
|
|
|||||||||||||||||||
| 463,342.6 | ||||||||||||||||||||
| Todd B. Strubbe |
— | — | 346,672 | 1,452,556 | ||||||||||||||||
| (1) | These options represent retained, or “rollover”, options. In connection with our 2006 recapitalization, certain executive officers elected to convert certain vested options in the Company into fully-vested options in the surviving corporation. No share-based compensation was recorded for these retained options, as these options were fully vested prior to the consummation of the recapitalization (which triggered the “rollover event”). |
| (2) | These amounts represent restricted stock awards granted on December 30, 2009 for Mr. Strubbe. On December 30, 2011, the Board of Directors approved the amendment of the Restricted Stock Agreements with each of the current employees party to a Restricted Stock Agreement with the Company in accordance with the terms of the 2006 EIP to provide for immediate vesting of all shares awarded thereunder outstanding for more than five years, such vesting to become effective as of the Conversion. Previously, Tranches 2 and 3 of these awards vested only upon meeting certain performance criteria under the amendment of the Restricted Stock Agreement, Tranches 2 and 3 cliff vest on the fifth anniversary of the grant, December 30, 2014. |
| (3) | Subsequent to the recapitalization, our common stock is no longer publicly traded and therefore the market value of $4.19 per share was based on the results of an independent appraisal performed as of November 30, 2011, by Corporate Valuation Advisors, Inc. |
93
Table of Contents
Option Exercises and Stock Vested
The following table shows for each named executive officer all option awards transferred and all stock awards transferred or that vested during 2011.
| Option Awards | Stock Awards | |||||||||||||||
| Name (a) |
Number of Shares Acquired on Exercise(1) (#) (b) |
Value Realized on Exercise(1) ($) (c) |
Number of Shares Acquired on Transfer or on Vesting (#) (d) |
Value Realized on Transfer or Vesting ($)(1) (e) |
||||||||||||
| Thomas B. Barker(2) |
451,752.95 | 1,892,845 | 971,693 | 4,071,394 | ||||||||||||
| Nancee R. Berger |
— | — | 550,020 | 2,304,584 | ||||||||||||
| Paul M. Mendlik |
— | — | 366,680 | 1,536,389 | ||||||||||||
| Steven M. Stangl(3) |
236,186.39 | 989,621 | 366,680 | 1,536,389 | ||||||||||||
| Todd B. Strubbe |
— | — | 26,664 | 111,722 | ||||||||||||
| (1) | Subsequent to the recapitalization, our common stock is no longer publicly traded and therefore the market value of $4.19 per share was based on the results of an independent appraisal performed as of November 30, 2011, by Corporate Valuation Advisors and such value was used to value the Common Stock acquired upon the exercise of these options and the vesting of restricted shares of Common Stock. The number of shares acquired on the exercise of option awards and the value realized on exercise was calculated following the Conversion of the Class L Common Stock into Class A Common Stock. |
| (2) | Mr. Barker exchanged 158,079.14 options to pay the payroll taxes associated with the exercise of these options. Mr. Barker’s net incremental shares obtained upon exercise was 293,673.81 shares. |
| (3) | Mr. Stangl exchanged 39,128 options and 4,101 shares of stock to pay the exercise price and related payroll taxes associated with the exercise of these options. Mr. Stangl’s net incremental shares obtained upon exercise was 192,957.39 shares. |
Nonqualified Deferred Compensation Table
The following table shows certain information regarding our Deferred Compensation Plan and Executive Retirement Savings Plan.
2011 Nonqualified Deferred Compensation Table
| Name (a) |
Executive Contributions in Last Fiscal Year(1) ($) (b) |
Registrant Contributions in Last Fiscal Year(2) ($) (c) |
Aggregate Earnings in Last Fiscal Year(3) ($) (d) |
Aggregate withdrawals/ distributions(4) ($) (e) |
Aggregate Balance at Last Fiscal Year End(5) ($) (f) |
|||||||||||||||
| Thomas B. Barker |
||||||||||||||||||||
| Deferred Compensation Plan |
500,000 | 250,000 | 205,874 | 1,439,264 | 7,622,094 | |||||||||||||||
| Executive Retirement Savings Plan |
9,151 | 4,576 | (3,718 | ) | 88,513 | 96,215 | ||||||||||||||
| Nancee R. Berger |
||||||||||||||||||||
| Deferred Compensation Plan |
625,416 | 312,708 | 152,015 | — | 5,628,049 | |||||||||||||||
| Executive Retirement Savings Plan |
9,151 | 4,576 | (5,931 | ) | — | 207,692 | ||||||||||||||
| Paul M. Mendlik |
||||||||||||||||||||
| Deferred Compensation Plan |
587,181 | 293,591 | 158,775 | — | 6,412,125 | |||||||||||||||
| Executive Retirement Savings Plan |
12,260 | 4,662 | (3,905 | ) | — | 73,776 | ||||||||||||||
| Steven M. Stangl |
||||||||||||||||||||
| Deferred Compensation Plan |
— | — | 57,806 | — | 2,140,147 | |||||||||||||||
| Executive Retirement Savings Plan |
9,151 | 4,575 | (9,906 | ) | — | 197,752 | ||||||||||||||
| Todd B. Strubbe |
||||||||||||||||||||
| Deferred Compensation Plan |
100,000 | 50,000 | 9,175 | — | 339,690 | |||||||||||||||
| Executive Retirement Savings Plan |
9,151 | 4,576 | (177 | ) | — | 29,024 | ||||||||||||||
| (1) | Amounts in this column are also included in columns (c) and (f) of the 2011 Summary Compensation Table included in this prospectus. |
94
Table of Contents
| (2) | Amounts in this column are also included in column (g) of the 2011 Summary Compensation Table included in this prospectus. |
| (3) | The aggregate earnings represent the market value change of these plans during 2011. None of the earnings are included in the 2011 Summary Compensation Table included in this prospectus. |
| (4) | Mr. Barker’s withdrawal was made pursuant to Mr. Barker’s deferral election under the plan. |
| (5) | Amounts in this column include both vested and unvested balances. Amounts reported in this column which were previously reported as compensation to the named executive officer in the Summary Compensation Table for previous years were: Mr. Barker $5,084,488; Ms. Berger $4,639,228; Mr. Strubbe $200,000; Mr. Stangl $1,494,169 and Mr. Mendlik $5,458,444. These aggregate amounts do not include withdrawals taken from the Deferred Compensation Plan in 2011 and 2010 of $2,726,759 for Mr. Barker and in 2007 of $2,009,826 and $3,415,041 for Ms. Berger and Mr. Mendlik, respectively. |
Non-Qualified Retirement Plans
Pursuant to the terms of the Deferred Compensation Plan, eligible management, non-employee directors and highly compensated employees who are approved for participation by the board may elect to defer a portion of their compensation and have such deferred compensation notionally invested in the same mutual fund investments made available to participants in the 401(k) plan or in notional equity interests in our company. Open enrollment for eligible participants to participate in the Deferred Compensation Plan is held annually. Upon enrollment, the participant’s participation and deferral percentage is fixed for the upcoming calendar year. Participants may select from selected mutual funds or equity interests for notional investment of their deferred compensation. Administration of the Deferred Compensation Plan is performed by an outside provider, Wells Fargo Institutional Trust Services. Executives are allowed to defer their bonus and up to 50% of salary not to exceed $500,000, in each case, attributable to services performed in the following plan year. We match a percentage of any amounts notionally invested in equity interests which was 50% in 2011. Such matched amounts are subject to 20% vesting each year. All matching contributions are 100% vested five years after the later of January 1, 2007 or, if later, the date the executive first participates in the Deferred Compensation Plan. All matching contributions become 100% vested if: (i) the participant dies or becomes disabled or is terminated without cause; (ii) a change of control occurs; or (iii) the Deferred Compensation Plan terminates. For purposes of the Deferred Compensation Plan, a change of control occurs if during any period of two consecutive years or less: (i) individuals who at the beginning of such period constitute the entire board shall cease for any reason, subject to certain exceptions, to constitute a majority thereof; (ii) our stockholders approve any merger or consolidation as a result of which our common stock shall be changed, converted or exchanged (other than a merger with a wholly-owned subsidiary of ours) or our liquidation or any sale or disposition of 50% or more of our assets or earning power; or (iii) our stockholders approve any merger or consolidation to which we are a party as a result of which the persons who were our stockholders immediately prior to the effective date of the merger or consolidation shall have beneficial ownership of less than 50% of the combined voting power of the surviving corporation. The Deferred Compensation Plan and any earnings thereon are held separate and apart from our other funds, but remain subject to claims by our general creditors. Earnings in the Deferred Compensation Plan are based on the change in market value of the plan investments during a given period. The vested portion of the participant’s account under the plan will be paid on the date specified by the participant which can be no earlier than five years following the year of deferral or, if earlier, the date the participant separates from service with us. Deferrals invested in notional equity interests are paid through the issuance of our shares. Recipients of the equity interests upon such distribution have no equity or contractual put right with respect to the issued equity interests.
Participation in the Executive Retirement Savings Plan is voluntary and is restricted to highly compensated individuals as defined by the Internal Revenue Service. Open enrollment to participate in the Executive Retirement Savings Plan is held annually. Upon enrollment, the participant’s participation and deferral percentage is fixed for the upcoming calendar year. Participants may select from selected mutual funds for investment of their deferred compensation. Participants may change their investment selection as often as they
95
Table of Contents
choose. Administration of the Executive Retirement Savings Plan is performed by an outside provider, Wells Fargo Institutional Trust Services. We will match 50% of employee contributions, limited to the same maximums and vesting terms as those of the 401(k) plan. Earnings in the Executive Retirement Savings Plan are based on the change in market value of the plan investments (mutual funds) during a given period. We maintain a grantor trust under the Executive Retirement Savings Plan. The principal of the trust and any earnings thereon are held separate and apart from our other funds and are used exclusively for the uses and purposes of plan participants, but remain subject to claims from our general creditors.
2011 returns for the investment funds in the Executive Savings Plan were:
| Fund |
2011 return |
Fund |
2011 return |
|||||||
| Wells Fargo Advantage Ultra Short Term |
0.54 | % | Wells Fargo Advantage Capital Growth | (5.23 | %) | |||||
| PIMCO Total Return A |
3.74 | % | Goldman Sachs Mid Cap Value A | (6.26 | %) | |||||
| MFS Total Return I |
2.15 | % | Scout Mid Cap | 0.32 | % | |||||
| MFS Value I |
0.01 | % | Invesco Mid Cap Core Equity A | (6.24 | %) | |||||
| Wells Fargo Advantage Index |
1.90 | % | Baron Small Cap | (1.58 | %) | |||||
| Davis New York Venture A |
(4.78 | %) | American New Perspective | (7.64 | %) | |||||
| Fidelity Growth Opportunity |
2.27 | % | American Funds Euro Pacific Growth | (13.33 | %) | |||||
| Mainstay Large Cap Growth I |
(0.19 | %) | ||||||||
2011 Potential Payments Upon Termination or Change of Control
As described under “—Employment Agreements,” each of the named executive officers is subject to an employment agreement that provides severance payments upon certain terminations. Please see “—Employment Agreements” above for a description of terms of the employment agreements.
The following table sets forth the payments and benefits that each named executive officer would have been entitled to upon certain termination events or a change of control as of December 31, 2011.
2011 Potential Payments and Benefits Upon Termination or Change in Control Table
| Name (a) |
Benefits(1) ($) (b) |
Potential Cash Severance Payment(2) ($) (c) |
Accelerated Vesting Upon Change in Control or Initial Public Offering(3) ($) (d) |
|||||||||
| Thomas B. Barker |
26,127 | 2,656,799 | — | |||||||||
| Nancee R. Berger |
37,549 | 1,799,988 | — | |||||||||
| Paul M. Mendlik |
19,406 | 1,092,805 | — | |||||||||
| Steven M. Stangl |
25,179 | 1,278,690 | — | |||||||||
| Todd B. Strubbe |
12,590 | 903,814 | 1,543,140 | |||||||||
| (1) | Benefits include payments of medical, accident, disability and life insurance premiums for a specified period of time. These benefits are payable only in the case of a qualifying termination as set forth in (2) below. |
| (2) | In accordance with the executive’s employment agreement, (i) in the event of the executive’s voluntary termination of employment without Good Reason, the executive would be entitled to receive his or her base salary as payment for services as a consultant during the consulting period following termination of employment; and (ii) in the event of the executive’s termination of employment without Cause or |
96
Table of Contents
| voluntary termination of employment for Good Reason, the executive would be entitled to receive his or her base salary for the severance period following termination of employment and a further payment for those executives providing consulting services, equal to such executive’s projected annual bonus. The severance period is one year for Mr. Strubbe and two years for all of the other named executive officers. |
| (3) | Subsequent to the recapitalization, our common stock is no longer traded and, therefore, the market value of $4.19 per share was based on the results of an independent appraisal performed as of November 30, 2011 by Corporate Valuation Advisors, Inc. The amount in column (d) is the result of multiplying the restricted shares that would vest, upon a qualifying event and the unvested value in Mr. Strubbe’s Deferred Compensation plan. Mr. Strubbe is the only named executive that held unvested restricted stock as of December 31, 2011. |
Change in Control Agreements
Prior to completion of this offering, we expect to enter into Change in Control Agreements with each of our executive officers. We believe that these agreements are necessary to attract and retain qualified executive officers. Any severance benefits payable under a Change in Control Agreement will be paid in lieu of the severance or consulting benefits under the Employment Agreements.
2012 Long-Term Incentive Plan
Prior to the completion of this offering, we expect to adopt a 2012 Long-Term Incentive Plan (“LTIP”) which is intended to provide our officers, employees, non-employee directors and consultants with added incentive to remain employed by or perform services for us and align such individuals’ interests with those of our stockholders. The material terms of the LTIP are expected to be as follows:
Plan Term. The LTIP term begins upon the date of approval by the board and terminates on the tenth anniversary of its effective date, unless terminated earlier by the board.
Eligible Participants. All officers, employees, consultants and non-employee directors and persons expected to become officers, employees, consultants or non-employee directors of the company or any of its subsidiaries are eligible to receive awards under the LTIP. The compensation committee shall determine the participants under the LTIP.
Shares Authorized. shares of the our common stock will be available for awards granted under the LTIP, subject to adjustment for stock splits and other similar changes in capitalization. The number of available shares will be reduced by the aggregate number of shares that become subject to outstanding awards granted under the LTIP. To the extent that shares subject to an outstanding award granted under the LTIP are not issued or delivered by reason of the expiration, termination, cancellation or forfeiture of such award or by reason of the settlement of such award in cash, then such shares will again be available under the LTIP.
Award Types. Awards include non-qualified and incentive stock options, stock appreciation rights, restricted stock, restricted stock units and performance units any or all of which may be made contingent upon the achievement of performance criteria. The compensation committee has the discretionary authority to determine the size of an award.
Administration. The compensation committee shall interpret, construe and administer the LTIP. The compensation committee’s interpretation, construction and administration of the LTIP and all of its determinations thereunder shall be final, conclusive and binding on all persons.
The compensation committee shall have the authority to determine the participants in the LTIP, the form, amount and timing of any awards, the performance goals, if any, and all other terms and conditions pertaining to
97
Table of Contents
any award. The compensation committee may take any action such that (i) any outstanding options and stock appreciation rights become exercisable in part or in full, (ii) all or any portion of a restriction period on any restricted stock or restricted stock units shall lapse, (iii) all or a portion of any performance period applicable to any performance-based award shall lapse and (iv) any performance measures applicable to any outstanding award be deemed satisfied at the target level or any other level. The compensation committee may delegate some or all of its powers and authority to the Chief Executive Officer or other executive officer as the compensation committee deems appropriate, except for awards granted to any officer who is a “covered employee” within the meaning of Section 162(m) of the Internal Revenue Code or any officer who is subject to Section 16 of the Exchange Act. Only the compensation committee may make decisions concerning the timing, pricing or amounts of an award to such officers.
Stock Options and Stock Appreciation Rights. The LTIP provides for the grant of stock options and stock appreciation rights. Stock options may be either tax-qualified incentive stock options or non-qualified options. The compensation committee will determine the terms and conditions to the exercisability of each option and stock appreciation right.
The period for the exercise of a non-qualified stock option or stock appreciation right will be determined by the compensation committee provided that no option may be exercised later than ten years after its date of grant. The exercise price of a non-qualified stock option and the base price of a stock appreciation right will not be less than 100% of the fair market value of a share of our common stock on the date of grant, provided that the base price of a stock appreciation right granted in tandem with an option will be the exercise price of the related option. A stock appreciation right entitles the holder to receive upon exercise (subject to tax withholding in respect of an employee) shares of our common stock (which may be restricted stock) with a value equal to the difference between the fair market value of our common stock on the exercise date and the base price of the stock appreciation right.
Each incentive stock option will be exercisable for not more than ten years after its date of grant, unless the optionee owns greater than ten percent of the voting power of all shares of our capital stock (a “ten percent holder”), in which case the option will be exercisable for not more than five years after its date of grant. The exercise price of an incentive stock option will not be less than the fair market value of a share of our common stock on its date of grant, unless the optionee is a ten percent holder, in which case the option exercise price will be the price required by the Internal Revenue Code, currently 110% of fair market value.
Upon exercise, the option exercise price may be paid in cash, by the delivery of previously owned shares of our common stock or through a cashless exercise arrangement. All of the terms relating to the exercise, cancellation or other disposition of an option or stock appreciation right upon a termination of employment, whether by reason of disability, retirement, death or any other reason, shall be determined by the compensation committee.
Non-Employee Director Options. The LTIP provides automatic grants of stock options to our non-employee directors. On the date that an individual first becomes a non-employee director, such individual will be automatically granted a nonqualified stock option to purchase shares of common stock. Thereafter, for the remainder of the term of the LTIP and provided such individual remains a non-employee director, on the date of each of the annual meetings of our stockholders, each non-employee director will automatically be granted a nonqualified stock option to purchase shares of common stock. Options granted to non-employee directors have an exercise price equal to the fair market value of our common stock on the date of grant, and are generally subject to a three-year vesting schedule. Non-employee director options expire on the earliest of (i) ten years from the date of grant, (ii) three months following the date upon which the non-employee director ceases to be a member of the board for any reason other than his death or disability, or (iii) one year following the date upon which the non-employee director ceases to be a member of the board by reason of his death or disability.
98
Table of Contents
Stock Awards. The LTIP provides for the grant of stock awards. The compensation committee may grant a stock award either as a restricted stock award or a restricted stock unit award and, in either case, the compensation committee may determine that such award shall be subject to the attainment of performance measures over an established performance period. All of the terms relating to the satisfaction of performance measures and the termination of a restriction period, or the forfeiture and cancellation of a stock award upon a termination of employment, whether by reason of disability, retirement, death or any other reason, will be determined by the compensation committee.
The agreement awarding restricted stock units will specify whether such award may be settled in shares of our common stock, cash or a combination thereof and whether the holder will be entitled to receive dividend equivalents, on a current or deferred basis, with respect to such award. Prior to settlement of a restricted stock unit, the holder of a restricted stock unit will have no rights as our stockholder.
Unless otherwise set forth in a restricted stock award agreement, the holder of shares of restricted stock will have rights as our stockholder, including the right to vote and receive dividends with respect to the shares of restricted stock, except that distributions other than regular cash dividends and regular cash dividends with respect to shares of restricted stock subject to performance-based vesting conditions will be held by us and will be subject to the same restrictions as the restricted stock.
Performance Unit Awards. The LTIP also provides for the grant of performance unit awards. Each performance unit is a right, contingent upon the attainment of performance measures within a specified performance period, to receive a specified cash amount or shares of our common stock, which may be restricted stock, having a fair market value equal to such cash amount. Prior to the settlement of a performance unit award in shares of our common stock, the holder of such award will have no rights as our stockholder with respect to such shares. Performance units will be non-transferable and subject to forfeiture if the specified performance measures are not attained during the specified performance period. All of the terms relating to the satisfaction of performance measures and the termination of a performance period, or the forfeiture and cancellation of a performance unit award upon a termination of employment, whether by reason of disability, retirement, death or any other reason, will be determined by the compensation committee.
Performance Goals. Under the LTIP, the vesting or payment of performance-based awards will be subject to the satisfaction of certain performance goals. The performance goals applicable to a particular award will be determined by the compensation committee at the time of grant. The performance goals may be one or more of the following corporate-wide or subsidiary, division, operating unit or individual measures, stated in either absolute terms or relative terms, such as rates of growth or improvement: the attainment by a share of our common stock of a specified fair market value for a specified period of time, earnings per share, return to stockholders (including dividends), return on assets, return on equity, our earnings before or after taxes and/or interest, revenues, expenses, market share, cash flow or cost reduction goals, interest expense after taxes, return on investment, return on investment capital, return on operating costs, economic value created, operating margin, gross margin, achievement of annual operating profit plans, net income before or after taxes, pretax earnings before interest, depreciation and/or amortization, pretax operating earnings after interest expense and before incentives, and/or extraordinary or special items, operating earnings, net cash provided by operations, and strategic business criteria, consisting of one or more objectives based on meeting specified market penetration, geographic business expansion goals, cost targets, days sales outstanding goals, customer satisfaction, reductions in errors and omissions, reductions in lost business, management of employment practices and employee benefits, supervision of litigation and information technology, quality and quality audit scores, productivity, efficiency, and goals relating to acquisitions or divestitures, or any combination of the foregoing.
Amendment or Termination of the LTIP. The board may amend or terminate the LTIP as it deems advisable, subject to any requirement of stockholder approval required by law, rule or regulation.
99
Table of Contents
Change of Control. In the event of a change of control, the board may, in its discretion, (1) provide that (A) some or all outstanding options and stock appreciation rights shall immediately become exercisable in full or in part, (B) the restriction period applicable to some or all outstanding stock awards shall lapse in full or in part, (C) the performance period applicable to some or all outstanding awards shall lapse in full or in part, and (D) the performance measures applicable to some or all outstanding awards shall be deemed to be satisfied at the target or any other level, (2) require that shares of stock of the corporation resulting from such change of control, or a parent corporation thereof, be substituted for some or all of our shares subject to an outstanding award, and/or (3) require outstanding awards, in whole or in part, to be surrendered by the holder, and to be immediately cancelled, and to provide for the holder to receive (A) a cash payment in an amount equal to (i) in the case of an option or stock appreciation right, the number of our shares then subject to the portion of such option or stock appreciation right surrendered, whether vested or unvested, multiplied by the excess, if any, of the fair market value of a share of our common stock as of the date of the change of control, over the purchase price or base price per share of our common stock subject to such option or stock appreciation right, (ii) in the case of a stock award, the number of shares of our common stock then subject to the portion of such award surrendered, whether vested or unvested, multiplied by the fair market value of a share of our common stock as of the date of the change of control, and (iii) in the case of a performance unit award, the value of the performance units then subject to the portion of such award surrendered, whether vested or unvested; (B) shares of capital stock of the corporation resulting from such change of control, or a parent corporation thereof, having a fair market value not less than the amount determined under clause (A) above; or (C) a combination of the payment of cash pursuant to clause (A) above and the issuance of shares pursuant to clause (B) above.
Under the LTIP, a change of control shall occur upon: (i) a sale, lease or other disposition of all or substantially all of our assets; (ii) any consolidation or merger with or into any other entity, or any other corporate transaction in which our stockholders either: (A) own less than fifty percent (50%) of the economic interests in or voting power of the surviving entity or (B) do not have the power to elect a majority of the board of directors of the surviving entity; or (iii) any stock sale or other transaction or series of related transactions, after giving effect to which in excess of fifty percent (50%) of our voting power is owned by any entity and its “affiliates” or “associates” (as such terms are defined in the rules adopted by the SEC under the Exchange Act), other than the Sponsors; but excluding, in any case referred to in clause (ii) or (iii) of this definition the initial public offering or any bona fide primary or secondary public offering following the occurrence of the initial public offering.
New Plan Benefits. The benefits that might be received by officers, employees and non-employee directors cannot be determined at this time. All officers, employees and non-employee directors are eligible for consideration to participate in the LTIP.
Executive Incentive Compensation Plan
We expect to adopt prior to the completion of this offering an Executive Incentive Compensation Plan (“Incentive Plan”) to assist us in attracting, motivating and retaining officers who have significant responsibility for our growth and long-term success by providing incentive awards that ensure a strong pay-for-performance linkage for such officers. The material terms of the Incentive Plan are expected to be as follows:
Plan Term. The Incentive Plan will continue in effect until terminated by the board.
Eligible Participants. All of our officers will be eligible to participate in the Incentive Plan. The compensation committee, in its discretion, will select the officers to whom awards may from time to time be granted under the Incentive Plan.
Award Types. The Incentive Plan will provide cash award opportunities for eligible participants on an annual basis.
100
Table of Contents
Administration. The Incentive Plan will be administered by our compensation committee. The compensation committee will have the authority to select the persons who are granted awards under the Incentive Plan, to determine the time when awards will be granted, to determine whether objectives and conditions for earning awards have been met, to determine whether awards will be paid at the end of the award period or deferred, and to determine whether an award or payment of an award should be reduced or eliminated.
The compensation committee will have full power and authority to administer and interpret the Incentive Plan and to adopt such rules, regulations, agreements, guidelines and instruments for the administration of the Incentive Plan and for the conduct of its business as the compensation committee deems necessary or advisable. The compensation committee’s interpretations of the Incentive Plan, and all actions taken and determinations made by the compensation committee pursuant to the powers vested in it, are conclusive and binding on all parties concerned, including us, our stockholders and any person receiving an award under the Incentive Plan.
Performance Targets. Under the Incentive Plan, the performance goals applicable to a particular award will be determined by the compensation committee at the time of grant. The performance goals may be one or more of the following corporate-wide or subsidiary, division, operating unit or individual measures, stated in either absolute terms or relative terms, such as rates of growth or improvement: the attainment by a share of our common stock of a specified fair market value for a specified period of time, earnings per share, return to stockholders (including dividends), return on assets, return on equity, our earnings before or after taxes and/or interest, revenues, expenses, market share, cash flow or cost reduction goals, interest expense after taxes, return on investment, return on investment capital, return on operating costs, economic value created, operating margin, gross margin, achievement of annual operating profit plans, net income before or after taxes, pretax earnings before interest, depreciation and/or amortization, pretax operating earnings after interest expense and before incentives, and/or extraordinary or special items, operating earnings, net cash provided by operations, and strategic business criteria, consisting of one or more objectives based on meeting specified market penetration, geographic business expansion goals, cost targets, days sales outstanding goals, customer satisfaction, reductions in errors and omissions, reductions in lost business, management of employment practices and employee benefits, supervision of litigation and information technology, quality and quality audit scores, productivity, efficiency, and goals relating to acquisitions or divestitures, or any combination of the foregoing.
Adjustments. The compensation committee may provide that the performance targets or the manner in which performance will be measured against the performance targets will be adjusted in such a manner as it deems appropriate, including, without limitation, any adjustments to reflect the impact of specified corporate transactions (such as a stock split or stock dividend), special charges, accounting or tax law changes and other extraordinary or nonrecurring events. All objectives are based upon our operations and will not include objectives derived from mergers, acquisitions joint ventures, stock buy backs or other non-operating income unless approved by the compensation committee.
Payment of Awards. Awards will be payable upon certification by the compensation committee that the specified performance targets for the preceding fiscal year were achieved. We may pay seventy-five percent of such awards on a quarterly basis upon the certification by the compensation committee that the specified performance quarterly targets have been achieved. A participant may elect to defer all or a portion of any award otherwise payable if permitted pursuant to a deferred compensation plan adopted by, or an agreement entered into with, us, provided that such deferral does not adversely affect the treatment of the award as performance- based compensation and provided that such deferral opportunity complies with Section 409A of the Internal Revenue Code.
Delegation of Administrative Authority. The compensation committee, as it deems necessary, may delegate its responsibilities for administering the Plan to our executives.
101
Table of Contents
2012 Employee Stock Purchase Plan
Prior to completion of this offering, we intend to adopt a 2012 Employee Stock Purchase Plan (the “Purchase Plan”). The following summary describes the proposed Purchase Plan.
Generally, all of our employees (including those of our consolidated subsidiaries), other than subsidiaries excluded from participation by the board and employees who have completed less than 20 hours of service per week for a one-year period, are eligible to participate in the Purchase Plan, although no employee may be granted an option if such employee, immediately after the option is granted, owns 5% or more of the total combined voting power or value of our stock or the stock of any of our subsidiaries. shares of our common stock, subject to adjustment for stock splits, stock dividends or other changes in our capital stock, have been reserved for issuance under the Purchase Plan. The proceeds of the sale of our common stock and of administrative fees received under the Purchase Plan will constitute general funds and may be used by us for any purpose.
The Purchase Plan permits employees to purchase our common stock through payroll deductions during annual offerings. Participants may authorize payroll deductions of a specific percentage of compensation between 1% and 10%, with such deductions being accumulated for annual periods beginning on the first business day of each offering period (each, an “Enrollment Date”) and ending on the last business day of each offering period (each, an “Exercise Date”). On each Enrollment Date, we will grant to each participant an option to purchase the number of full shares of our common stock which such participant’s accumulated payroll deductions on the Exercise Date will purchase at a purchase price of 100% of the fair market value of the common stock on the Enrollment Date. The maximum number of shares of our common stock which may be purchased by a participant during any annual offering period is the lesser of (i) 1,000 shares of our common stock, or (ii) the number obtained by dividing $25,000 by 100% of the fair market value of our common stock on the Enrollment Date.
The Purchase Plan will be administered by the compensation committee or a committee composed of our senior management. The Purchase Plan may be amended by our board but may not be amended without prior stockholder approval to the extent required by Section 423 of the Internal Revenue Code of 1986, as amended.
Risk Management and Compensation
The compensation committee has designed the Company’s compensation structure with the intent to attract and retain executives who have the ability and desire to grow the Company’s profitably. The compensation committee believes that incentive compensation should encourage risk within parameters that are appropriate for the long-term profitable growth of our businesses.
Each year the compensation committee reviews each compensation element, including the factors for determining executive bonuses for the upcoming year as well as the bonus targets and payout ranges. The compensation committee has structured its compensation program so that executive performance is not considered in determining annual salary. Rather, annual salary is designed to provide adequate compensation to recruit and retain talented individuals who have the ability and desire to achieve the objective financial goals that ultimately determine compensation.
The compensation committee believes that certain factors mitigate the potential risks posed by the Company’s annual and long-term compensation elements. For example, bonuses are generally earned upon the profitable growth (EBITDA or Adjusted EBITDA) over the prior year. This performance metric focuses the executives on the profitable growth of the Company. In addition, the Company has designed its internal control system to provide reasonable assurance regarding the reliability of the Company’s accounting records and financial reporting system. The Company’s performance metrics for the annual cash bonus program are subject to the scrutiny of our internal control system. The Company also engages in a comprehensive budgeting process which requires multi-level approvals with respect to various expenditures, including capital expenditures and the addition of new personnel. The compensation committee believes that the Company’s budgeting process as well
102
Table of Contents
as the various internal controls implemented by the Company limit the actions that employees can take without proper review and evaluation of the potential risks to the Company of such actions. With respect to the Company’s annual cash bonus program, the Company retains 25% of quarterly bonuses, and pays such holdback in February of the following year provided that the annual objective financial goals are met.
With regard to equity-based compensation, the compensation committee believes that the illiquidity of the Company’s equity mitigates the potential risk of the performance-based portion of the Company’s equity-based compensation. The compensation committee believes that each of these factors mitigates any risks posed by the Company’s compensation program.
Non-employee Director Compensation
None of our non-employee directors receive director fees or equity grants but each is reimbursed for all reasonable expenses incurred in connection with their attendance at board meetings.
Compensation Committee Interlocks and Insider Participation
Mr. Anthony J. DiNovi, a member of our compensation committee, is Co-President of Thomas H. Lee Partners, L.P. Affiliates of Thomas H. Lee Partners, L.P. provide management and advisory services pursuant to a management agreement entered into in connection with the consummation of our recapitalization. The aggregate fees for services are approximately $3.3 million annually. Thomas H. Lee Partners, L.P. also received reimbursement for travel and other out-of pocket expenses in the aggregate amount of approximately $43,000 in 2011.
103
Table of Contents
PRINCIPAL AND SELLING STOCKHOLDERS
The following table summarizes the beneficial ownership of our common stock as of February 10, 2012 for:
| • | each person who we know beneficially owns more than 5% of our common stock; |
| • | each director; |
| • | each executive officer whose name appears in the Summary Compensation Table; |
| • | all directors and executive officers as a group; and |
| • | each selling stockholder. |
| Shares Beneficially Owned Before Offering |
Common Shares Being Offered |
Shares Beneficially Owned After Offering | ||||||||||||
| Common Shares | ||||||||||||||
| Name and Address of Beneficial Owners(1) |
Number | Percentage | Number | Percentage | ||||||||||
| 5% Stockholders |
||||||||||||||
| Gary L. West(2) |
60,742,359 | 12.0 | % | |||||||||||
| Mary E. West(2) |
59,992,359 | 11.9 | % | |||||||||||
| Quadrangle Group Funds(3) |
60,362,500 | 12.0 | % | |||||||||||
| Thomas H. Lee Funds(4) |
290,102,175 | 57.6 | % | |||||||||||
| Directors and Named Executive Officers |
||||||||||||||
| Thomas B. Barker(5) |
6,261,086 | 1.2 | % | |||||||||||
| Anthony J. DiNovi |
* | * | ||||||||||||
| Steven G. Felsher |
* | * | ||||||||||||
| Soren L. Oberg |
* | * | ||||||||||||
| Jeff T. Swenson |
* | * | ||||||||||||
| Nancee R. Berger(6) |
2,859,404 | * | ||||||||||||
| Paul M. Mendlik(7) |
1,831,287 | * | ||||||||||||
| Todd B. Strubbe |
400,000 | * | ||||||||||||
| Steven M. Stangl(8) |
1,156,300 | * | ||||||||||||
| All directors and executive officers as a group |
15,727,915 | 3.1 | % | |||||||||||
| * | Less than 1% |
| (1) | The address of each of our executive officers and directors is c/o West Corporation, 11808 Miracle Hills Drive, Omaha, Nebraska 68154. |
| (2) | The address for these stockholders is 9746 Ascot Drive, Omaha, Nebraska 68114. Includes, with respect to Mr. West, 750,000 shares of common stock owned by the Gary and Mary West Wireless Health Institute (the “Institute”), a non profit organization, which has appointed Mr. West as the sole representative and proxy with respect to its shares. Mr. West disclaims any beneficial ownership of any shares held by the Institute. |
| (3) | Includes 52,828,086 shares of common stock owned by Quadrangle Capital Partners II LP; 1,417,262 shares of common stock owned by Quadrangle Select Partners II LP; and 6,117,153 shares of common stock owned by Quadrangle Capital Partners II-A LP (collectively, the “Quadrangle Funds”). The Quadrangle Funds’ general partner is Quadrangle GP Investors II LP, whose general partner is QCP GP Investors II LLC (collectively, the “QF Advisors”). Shares held by the Quadrangle Funds may be deemed to be beneficially owned by the QF Advisors. The QF Advisors disclaim any beneficial ownership of any shares held by the Quadrangle Funds. Each of the Quadrangle Funds has an address c/o Quadrangle Group LLC, 375 Park Avenue, 14th Floor, New York, New York 10152. Voting and investment determinations over securities that the Quadrangle Funds own are made by QCP GP Investors II LLC as general partner of Quadrangle GP Investors II LP, the general partner of the Quadrangle Funds. The current members of the investment committee of QCP GP Investors II LLC are Puneet Gulati, Michael A. Huber, Peter R. Ezersky and Steven G. Felsher. |
104
Table of Contents
| (4) | Includes 120,225,999 shares of common stock owned by Thomas H. Lee Equity Fund VI, L.P.; 81,410,650 shares of common stock owned by Thomas H. Lee Parallel Fund VI, L.P.; 63,139,175 shares of common stock owned by THL Equity Fund VI Investors (West), L.P.; 14,220,806 shares of common stock owned by Thomas H. Lee Parallel (DT) Fund VI, L.P.; 220,565 shares of common stock owned by THL Coinvestment Partners, L.P.; and 9,658,000 shares of common stock owned by THL Equity Fund VI Investors (West) HL, L.P. (collectively, the “THL Funds”); 613,609 shares of common stock owned by Putnam Investment Holdings, LLC; and 613,370 shares of common stock owned by Putnam Investments Employees’ Securities Company III LLC (collectively, the “Putnam Funds”). The THL Funds’ general partner is THL Equity Advisors VI, LLC, whose sole member is Thomas H. Lee Partners, L.P., whose general partner is Thomas H. Lee Advisors, LLC (collectively, “Advisors”). Shares held by the THL Funds may be deemed to be beneficially owned by Advisors. Advisors disclaim any beneficial ownership of any shares held by the THL Funds. The Putnam Funds are co-investment entities of the THL Funds. Putnam Investment Holdings, LLC (“Holdings”) is the managing member of Putnam Investments Employees’ Securities Company III LLC (“ESC III”). Holdings disclaims any beneficial ownership of any shares held by ESC III. Putnam Investments LLC, the managing member of Holdings, disclaims beneficial ownership of any shares held by the Putnam Funds. Each of the THL Funds has an address c/o Thomas H. Lee Partners, L.P., 100 Federal Street, 35th Floor, Boston, Massachusetts 02110. The Putnam Funds have an address c/o Putnam Investment, Inc., 1 Post Office Square, Boston, Massachusetts 02109. Voting and investment determinations over securities that the THL Funds own are made by majority vote of the members of a nine-member committee, the members of which are Todd M. Abbrecht, Charles A. Brizius, Anthony J. DiNovi, Thomas M. Hagerty, Scott L. Jaeckel, Seth W. Lawry, Soren L. Oberg, Scott M. Sperling and Kent R. Weldon. |
| (5) | Includes 3,640,776 shares of common stock subject to options. |
| (6) | Includes 2,109,404 shares of common stock subject to options and 750,000 shares of common stock held by family trusts. |
| (7) | Includes 1,076,626 shares of common stock owned by family trusts. |
| (8) | Includes 463,343 shares of common stock subject to options. |
| (9) | Includes 7,347,517 shares of common stock subject to options. |
The table above does not include 10,007,193 shares notionally granted under our Nonqualified Deferred Compensation Plan at February 10, 2012. These shares have not been granted, do not carry voting rights and cannot be sold until the end of the deferral periods, which begin in 2012 unless there is a change of control of us.
Except as otherwise noted, each person named in the table above has sole voting and investment power with respect to the shares. Beneficial ownership and percentages are calculated in accordance with SEC rules. Beneficial ownership includes shares subject to options that are currently exercisable or exercisable within 60 days.
105
Table of Contents
CERTAIN RELATIONSHIPS AND RELATED PARTY TRANSACTIONS
Related Party Transaction Policy
In connection with this offering, we will adopt a Related Party Transaction Policy that is designed to confirm our position that all conflicts of interest should be avoided. All “related party transactions” must be approved or ratified by our audit committee or, upon determination by the audit committee, by a majority vote of all disinterested members of our board. Our policy will apply to any transaction, arrangement or relationship, or any series of similar transactions, arrangements or relationships that meet the following criteria:
| • | the amount involved exceeds $120,000; |
| • | we or any of our subsidiaries is or will be a participant; and |
| • | our executive officers, directors or 5% stockholders, or any immediate family member of any of our executive officers, directors or 5% stockholders, has or will have a direct or indirect material interest in the transaction, arrangement or relationship (including any indebtedness or guarantee of indebtedness). |
Certain types of transactions, such as transactions involving rates determined by competitive bids, certain transactions in the ordinary course, and transactions in which the related party’s interest arises solely from ownership of a class of our securities or a less than ten percent equity or limited partnership interest in other entities, are deemed to be pre-approved even if such transactions would be deemed to be “related party transactions” pursuant to the criteria described above.
Under the terms of our policy, when considering whether to approve a proposed related party transaction, factors to be considered include, among other things, the size of the transaction, the amount payable to a related person, the nature of the related party’s interest in the transaction and whether such transaction is on terms at least as favorable to us as the terms generally available to an unaffiliated third-party under the same or similar circumstances.
Corporate Opportunities
Our amended and restated certificate of incorporation provides that we renounce any interest or expectancy in, or in being offered an opportunity to participate in, any business opportunity that may be from time to time presented to the Sponsors or any of their officers, directors, agents, stockholders, members, partners, affiliates and subsidiaries (other than the company and its subsidiaries) and that may be a business opportunity for such Sponsor, even if the opportunity is one that we might reasonably have pursued or had the ability or desire to pursue if granted the opportunity to do so. No such person will be liable to us for breach of any fiduciary or other duty, as a director or officer or otherwise, by reason of the fact that such person, acting in good faith, pursues or acquires any such business opportunity, directs any such business opportunity to another person or fails to present any such business opportunity, or information regarding any such business opportunity, to us unless, in the case of any such person who is our director or officer, any such business opportunity is expressly offered to such director or officer solely in his or her capacity as our director or officer. None of the Sponsors has any duty to refrain from engaging directly or indirectly in the same or similar business activities or lines of business as us or any of our subsidiaries. These provisions apply subject only to certain ownership requirements of the Sponsors and other conditions. See “Description of Capital Stock.”
Transactions Since the Recapitalization
Since January 1, 2009, we have engaged in the following transactions with our directors, executive officers and holders of more than 5% of our voting securities, and affiliates or immediately family members of our directors, executive officers and holders of more than 5% of our voting securities:
Management Agreement
Affiliates of the Sponsors provide management and advisory services pursuant to a management agreement entered into in connection with the consummation of the recapitalization. The fees for services and expenses in
106
Table of Contents
2011, 2010 and 2009 aggregated $4.1 million, $4.2 million and $4.2 million, respectively. Three members of our board are affiliated with Thomas H. Lee Partners, L.P.: Mr. Anthony J. DiNovi, Co-President, Mr. Soren L. Oberg, Managing Director, and Mr. Jeff T. Swenson, Director. One member of our board is affiliated with Quadrangle Group LLC: Mr. Steven G. Felsher, Senior Advisor. The management agreement will be terminated and a fee will be paid to the Sponsors from certain of the proceeds received in this offering. The amount of the payment will be the net present value (using a discount rate equal to the prevailing yield on U.S. Treasury Securities of like maturity at the closing of the offering) of the periodic fees that would have been payable to the Sponsors from the date of the offering until the seventh anniversary of the offering. The periodic fees payable to the Sponsors involve quarterly payments of $1 million per quarter, payable in advance. Based on the discount rate in effect as of , the aggregate payment to the Sponsors at the closing of the offering is estimated to be $ million. Such payment will be divided between the Sponsors pro rata in proportion to the relative ownership interest in the company held at the time of offering by the investment funds affiliated with each Sponsor. See “Use of Proceeds.”
Stockholder Agreement
In connection with the recapitalization, we entered into a stockholder agreement (“Stockholder Agreement”) with certain stockholders including the THL Investors; the Quadrangle Investors; our founders, Gary L. West and Mary E. West; and certain of our executive officers, including Thomas B. Barker, Nancee R. Berger, Paul M. Mendlik, David C. Mussman and Steven M. Stangl. The Stockholder Agreement will be amended and restated effective upon the closing of this offering (“Amended Stockholder Agreement”). The Amended Stockholder Agreement will provide that our board of directors shall be comprised of members at the closing of this offering or such other number as may be specified from time to time by the Board in accordance with our amended and restated certificate of incorporation then in effect, and that certain of our stockholders have the right to designate director nominees to our board of directors, subject to their election by our stockholders at the annual meeting, as follows:
| • | the THL Investors will be entitled to designate up to four directors for so long as they own at least the equivalent of 5% of the shares of our company they initially acquired as part of our recapitalization; |
| • | the Quadrangle Investors will be entitled to designate one director for so long as they own at least the equivalent of 25% of the shares of our company they initially acquired as part of our recapitalization; and |
| • | our chief executive officer will be designated as a director by the holders of a majority of the shares of our common stock that were issued to certain stockholders in connection with the recapitalization. |
Subject to applicable limitations in our amended and restated certificate of incorporation, each of the THL Investors and the Quadrangle Investors has the right to cause the resignation and replacement of its director designees at any time and for any reason and to fill any vacancies otherwise resulting in such director positions.
Registration Rights Agreement
In connection with the recapitalization, we also entered into a registration rights and coordination agreement with certain stockholders including the THL Investors; the Quadrangle Investors; our founders, Gary L. West and Mary E. West; certain of our executive officers, including Thomas B. Barker, Nancee R. Berger, Paul M. Mendlik, David C. Mussman and Steven M. Stangl; and each of their respective permitted assignees. Pursuant to this agreement, subject to certain exceptions and conditions, we are required to register their shares of common stock under the Securities Act, and they will have the right to participate in future registrations of securities by us. See “Shares Available For Future Sale—Registration Rights.” Additionally, our stockholders who are party to the registration rights and coordination agreement have agreed to coordinate certain sales by them of our common stock after the effective date of this prospectus made pursuant Rule 144 of the Securities Act or made in block sales to financial institutions.
107
Table of Contents
Office Lease
We lease certain office space owned by a partnership whose partners are Mary and Gary West who collectively own approximately 24% of our common stock at December 31, 2010. Related party lease expense was approximately $0.7 million each year for the years ended December 31, 2011, 2010 and 2009. The lease expires in 2014.
TOGM
On April 30, 2009, we entered into a series of amended and restated agreements with TOGM pursuant to which TOGM would finance up to 70% of the purchase price of selected receivables portfolios. Interest generally accrues on the outstanding debt at a fixed rate of 8.5%. The amended and restated agreements continued the facility executed as of May 21, 2008 and which expired December 31, 2008 pursuant to which TOGM had financed up to 80% of the purchase price of selected receivables portfolios at a variable rate equal to 3.5% over prime. The debt is non-recourse to us and collateralized by all of the assets of West Receivables Purchasing, LLC (“West Receivables”). The sole assets of West Receivables were the receivables portfolios which were partially financed by TOGM. At December 31, 2009, we had $0.7 million of non-recourse portfolio notes payable outstanding under this facility, which were sold to an unrelated third party.
In connection with the formation of West Receivables, we and TOGM entered into an operating agreement pursuant to which the members share in the profits of the portfolio after collection expenses and the repayment of principal and interest in proportion to their respective membership interests. We provided, directly or through a third party, all necessary services to West Receivables, including collection of the receivables pursuant to a servicing agreement. TOGM’s shareholders are Mary and Gary West, who collectively own approximately 22% of our common stock.
In December 2010, TOGM agreed that it had no further economic interest in West Receivables and authorized the liquidation of its assets, which was completed in December 2010.
108
Table of Contents
Upon the closing of this offering, our authorized capital stock will consist of shares of common stock, par value $0.001 per share. The following description of our capital stock is intended as a summary only and is qualified in its entirety by reference to our amended and restated certificate of incorporation and by-laws, which will become effective upon the closing of this offering and which are filed as exhibits to the registration statement, of which this prospectus forms a part, and to the applicable provisions of the Delaware General Corporation Law. The descriptions of our common stock and preferred stock reflect changes to our capital structure that will occur upon the closing of this offering.
Common Stock
Holders of common stock are entitled:
| • | to cast one vote for each share held of record on all matters submitted to a vote of the stockholders; |
| • | to receive, on a pro rata basis, dividends and distributions, if any, that the board of directors may declare out of legally available funds; and |
| • | upon our liquidation, dissolution or winding up, to share equally and ratably in any assets remaining after the payment of all debt and other liabilities, subject to the prior rights, if any, of holders of any outstanding shares of preferred stock. |
The holders of our common stock are entitled to receive dividends as they may be lawfully declared from time to time by our board of directors, subject to any preferential rights of holders of any outstanding shares of preferred stock. Any dividends declared on the common stock will not be cumulative.
The holders of our common stock do not have any preemptive, cumulative voting, subscription, conversion, redemption or sinking fund rights. The common stock is not subject to future calls or assessments by us. Except as otherwise required by law, holders of our common stock are not entitled to vote on any amendment or certificate of designation relating to the terms of any series of preferred stock if the holders of the affected series are entitled to vote on such amendment or certificate of designation under the certificate of incorporation.
Before the date of this prospectus, there has been no public market for our common stock since our recapitalization in 2006.
Preferred Stock
Under our amended and restated certificate of incorporation, our board of directors has the authority, without further action by our stockholders, except as described below, to issue up to shares of preferred stock in one or more series and to fix the voting powers, designations, preferences and the relative participating, optional or other special rights and qualifications, limitations and restrictions of each series, including dividend rights, conversion rights, voting rights, terms of redemption, liquidation preferences and the number of shares constituting any series. Upon completion of the offering, no shares of our authorized preferred stock will be outstanding. Because the board of directors has the power to establish the preferences and rights of the shares of any additional series of preferred stock, it may afford holders of any preferred stock preferences, powers and rights, including voting and dividend rights, senior to the rights of holders of the common stock, which could adversely affect the holders of the common stock and could discourage a takeover of us even if a change of control of our company would be beneficial to the interests of our stockholders.
Certain Certificate of Incorporation, By-Law and Statutory Provisions
The provisions of our amended and restated certificate of incorporation and by-laws and of the Delaware General Corporation Law summarized below may have an anti-takeover effect and may delay, defer or prevent a
109
Table of Contents
tender offer or takeover attempt that you might consider in your best interest, including an attempt that might result in your receipt of a premium over the market price for your shares.
Classified Board of Directors. In accordance with the terms of our amended and restated certificate of incorporation and amended and restated by-laws, our board of directors is divided into three classes, class I, class II and class III, with members of each class serving staggered three-year terms. Our amended and restated certificate of incorporation provides that the authorized number of directors may be changed only by resolution of the board of directors. Any additional directorships resulting from an increase in the number of directors will be distributed among the three classes so that, as nearly as possible, each class will consist of one-third of the directors. Our amended and restated certificate of incorporation and our amended and restated by-laws also provide that our directors may be removed only for cause by the affirmative vote of the holders of at least 66 2/3% of our voting stock, and that any vacancy on our board of directors, including a vacancy resulting from an enlargement of our board of directors, may be filled only by vote of a majority of our directors then in office. Our classified board of directors could have the effect of delaying or discouraging an acquisition of us or a change in our management.
Special Meetings of Stockholders. Our amended and restated certificate of incorporation provides that a special meeting of stockholders may be called only by the chairman of our board of directors or by a resolution adopted by a majority of our board of directors. Stockholders are not permitted to call a special meeting of stockholders, to require that the chairman call such a special meeting, or to require that our board request the calling of a special meeting of stockholders.
No Stockholder Action by Written Consent. Our amended and restated certificate of incorporation provides that stockholder action may be taken only at an annual meeting or special meeting of stockholders and may not be taken by written consent instead of a meeting. Failure to satisfy any of the requirements for a stockholder meeting could delay, prevent or invalidate stockholder action.
Stockholder Advance Notice Procedure. Our by-laws establish an advance notice procedure for stockholders to make nominations of candidates for election as directors or to bring other business before an annual meeting of our stockholders. The by-laws provide that any stockholder wishing to nominate persons for election as directors at, or bring other business before, an annual meeting must deliver to our secretary advanced written notice of the stockholder’s intention to do so.
Corporate Opportunity. Our amended and restated certificate of incorporation provides that we renounce any interest or expectancy in, or in being offered an opportunity to participate in, any business opportunity that may be from time to time presented to the Sponsors or any of their officers, directors, agents, stockholders, members, partners, affiliates and subsidiaries (other than us and our subsidiaries) and that may be a business opportunity for such Sponsor, even if the opportunity is one that we might reasonably have pursued or had the ability or desire to pursue if granted the opportunity to do so. No such person will be liable to us for breach of any fiduciary or other duty, as a director or officer or otherwise, by reason of the fact that such person, acting in good faith, pursues or acquires any such business opportunity, directs any such business opportunity to another person or fails to present any such business opportunity, or information regarding any such business opportunity, to us unless, in the case of any such person who is our director or officer, any such business opportunity is expressly offered to such director or officer solely in his or her capacity as our director or officer. None of the Sponsors have any duty to refrain from engaging directly or indirectly in the same or similar business activities or lines of business as us or any of our subsidiaries.
These provisions will continue to apply with respect to each Sponsor until (a) such Sponsor (together with its affiliates) shall cease to own, in the aggregate, capital stock representing percent ( %) or more of the total voting power of our outstanding shares of capital stock entitled to vote generally in the election of directors, voting together as a single class and (b) no person who is our director or officer is also a director, officer or general partner of any corporation, partnership, limited liability company or other entity that is a Sponsor.
110
Table of Contents
Business Combinations. We have opted out of Section 203 of the Delaware General Corporation Law; however, our amended and restated certificate of incorporation contains provisions similar to Section 203, which provide, subject to certain limitations, that we may not engage in certain “business combinations” with any “interested stockholder” for a three-year period following the time that the stockholder became an interested stockholder, unless:
| • | prior to such time, our board of directors approved either the business combination or the transaction which resulted in the stockholder becoming an interested stockholder; |
| • | upon consummation of the transaction which resulted in the stockholder becoming an interested stockholder, the interested stockholder owned at least 85% of our voting stock outstanding at the time the transaction commenced, excluding certain shares; or |
| • | at or subsequent to that time, the business combination is approved by our board of directors and by the affirmative vote of holders of at least 66 2/3% of the outstanding voting stock that is not owned by the interested stockholder. |
Generally, a “business combination” includes a merger, consolidation, asset or stock sale or other transaction resulting in a financial benefit to the interested stockholder. Subject to certain exceptions, an “interested stockholder” is a person who, together with that person’s affiliates and associates, owns, or within the previous three years owned, 15% or more of our voting stock.
Under certain circumstances, this provision will make it more difficult for a person who would be an interested stockholder to effect various business combinations with us for a three-year period. This provision may encourage companies interested in acquiring us to negotiate in advance with the Sponsors or our board of directors because the stockholder approval requirement described above would be inapplicable if our Sponsors or their affiliates sell 15% or more of our voting stock directly to such company or our board of directors approves either the business combination or the transaction which results in such company becoming an interested stockholder. These provisions also may have the effect of preventing changes in our board of directors and may make it more difficult to accomplish transactions which stockholders may otherwise deem to be in their best interests.
These provisions of our certificate of incorporation differ from Section 203 of the Delaware General Corporation Law in that they provide that the Sponsors, Gary and Mary West, and their respective affiliates, and any of their respective direct or indirect transferees of 15% or more of our voting stock and affiliates of such direct or indirect transferees, and any group as to which such persons are a party, will not constitute “interested stockholders” for purposes of this provision, while Section 203 of the Delaware General Corporation Law includes no such exceptions. In addition, Section 203 of the Delaware General Corporation Law exempts certain types of business combinations which are not exempted in our certificate of incorporation.
111
Table of Contents
SHARES AVAILABLE FOR FUTURE SALE
Prior to this offering, there has been no market for our common stock and we cannot assure you that a significant market for our common stock will develop or be sustained after this offering. Future sales of substantial amounts of our common stock in the public market, or the possibility of these sales, could adversely affect the trading price of our common stock. Furthermore, since only a limited number of shares will be available for sale shortly after this offering because of the contractual and legal restrictions on resale described below, sales of substantial amounts of our common stock in the public market after those restrictions lapse could also adversely affect the trading price of our common stock.
Sales of Restricted Securities
Upon the closing of this offering, we will have outstanding shares of common stock, based on the number of shares outstanding at December 31, 2011, giving effect to the issuance of shares of common stock in this offering.
Of the shares to be outstanding after the closing of this offering, the shares sold by us and the selling stockholders in this offering will be freely tradable without restriction under the Securities Act, except that any shares purchased in this offering by our “affiliates,” as that term is defined in Rule 144 under the Securities Act, generally may be sold in the public market only in compliance with Rule 144. The remaining shares of common stock are “restricted” shares under Rule 144 and therefore generally may be sold in the public market only in compliance with Rule 144. In addition, substantially all of these restricted securities will be subject to the lock-up agreements described below.
Lock-up Agreements
Our officers, directors and other stockholders, including the selling stockholders, representing shares of our common stock, will be subject to lock-up agreements with the underwriters that will restrict the sale of the shares of our common stock held by them for 180 days, subject to certain exceptions. See “Underwriting” for a description of these lock-up agreements.
Rule 144
In general, under Rule 144, beginning 90 days after the date of this prospectus, a person who is not our affiliate and has not been our affiliate at any time during the preceding three months will be entitled to sell any shares of our common stock that such person has beneficially owned for at least six months, including the holding period of any prior owner other than one of our affiliates, without regard to volume limitations. Sales of our common stock by any such person would be subject to the availability of current public information about us if the shares to be sold were beneficially owned by such person for less than one year.
Approximately shares of our common stock that are not subject to the lock-up agreements described above will be eligible for sale under Rule 144 immediately upon the closing of this offering.
Beginning 90 days after the date of this prospectus, our affiliates who have beneficially owned shares of our common stock for at least six months, including the holding period of any prior owner other than one of our affiliates, would be entitled to sell within any three-month period a number of shares that does not exceed the greater of:
| • | 1% of the number of shares of our common stock then outstanding, which will equal approximately shares immediately after this offering, assuming an initial public offering price of $ per share, which is the mid-point of the range set forth on the cover page of this prospectus; and |
112
Table of Contents
| • | the average weekly trading volume in our common stock on the Nasdaq Global Select Market during the four calendar weeks preceding the date of filing of a Notice of Proposed Sale of Securities Pursuant to Rule 144 with respect to the sale. |
Sales under Rule 144 by our affiliates are also subject to manner of sale provisions and notice requirements and to the availability of current public information about us.
Rule 701
In general, subject to the lock-up agreements discussed above, under Rule 701 of the Securities Act, any of our employees, consultants or advisors who purchased shares from us in connection with a qualified compensatory stock plan or other written agreement is eligible to resell these shares 90 days after the date of this prospectus in compliance with the manner of sale provisions of Rule 144, but without compliance with the other restrictions, including the availability of public information about us, holding period and volume limitations, in Rule 144.
Stock Options
As of December 31, 2011, we had outstanding options to purchase 15,483,170 shares of common stock, of which options to purchase 14,972,170 shares of common stock were vested. Following this offering, we intend to file a registration statement on Form S-8 under the Securities Act to register all of the shares of common stock subject to outstanding options as well as all shares of our common stock that may be covered by additional options and other awards granted under the Purchase Plan and the LTIP. Please see “Executive Compensation—2011 Employee Stock Purchase Plan” and “Executive Compensation—2011 Long-Term Incentive Plan” for additional information regarding these plans. Shares of our common stock issued under the S-8 registration statement will be available for sale in the public market, subject to the Rule 144 provisions applicable to affiliates, and subject to any vesting restrictions and lock-up agreements applicable to these shares.
Registration Rights
Following this offering and the sale by the selling stockholders of the shares offered by them hereby, the holders of shares of common stock will have the right, subject to certain exceptions and conditions, to require us to register their shares of common stock under the Securities Act, and they will have the right to participate in future registrations of securities by us. Registration of any of these outstanding shares of common stock would result in such shares becoming freely tradable without compliance with Rule 144 upon effectiveness of the registration statement.
113
Table of Contents
MATERIAL U.S. FEDERAL TAX CONSIDERATIONS FOR NON-U.S. STOCKHOLDERS
The following is a general discussion of the material U.S. federal income and estate tax consequences of the purchase, ownership and disposition of shares of our common stock by a Non-U.S. Stockholder. For purposes of this discussion, a Non-U.S. Stockholder is a beneficial owner of our common stock that is treated for U.S. federal tax purposes as:
| • | a non-resident alien individual; |
| • | a corporation, or other entity treated as a corporation for U.S. federal income tax purposes, created or organized under the laws of a jurisdiction other than the United States or any state or political subdivision thereof; |
| • | an estate, other than an estate the income of which is subject to U.S. federal income taxation regardless of its source; or |
| • | a trust, other than a trust (i) the administration of which is subject to the primary supervision of a court within the United States and which has one or more U.S. persons who have the authority to control all substantial decisions of the trust, or (ii) that has a valid election in effect under applicable U.S. Treasury regulations to be treated as a U.S. person. |
This discussion does not address the tax consequences to partnerships or other pass-through entities or persons investing through such partnerships or entities. If a partnership (or any other entity treated as a partnership for U.S. federal income tax purposes) holds our common stock, the tax treatment of a partner in such partnership will generally depend on the status of the partner and the activities of the partnership. Such a partner should consult its own tax advisors as to the U.S. federal income and estate tax consequences of being a partner in a partnership that purchases, owns or disposes of our common stock.
This summary assumes that our common stock is held as a capital asset (generally, property held for investment). This discussion is of a general nature and thus does not address all of the U.S. federal income and estate tax considerations that might be relevant to a Non-U.S. Stockholder in light of its particular circumstances or to a Non-U.S. Stockholder subject to special treatment under U.S. federal tax laws. Furthermore, this summary does not discuss any aspects of U.S. federal gift, state, local or non-U.S. taxation. This summary is based on current provisions of the U.S. Internal Revenue Code of 1986, as amended (the “Code”), U.S. Treasury regulations, judicial opinions, published positions of the U.S. Internal Revenue Service (“IRS”) and other applicable authorities, all of which are subject to change, possibly with retroactive effect. Each prospective purchaser of our common stock is advised to consult its tax advisor with respect to the U.S. federal, state, local and non-U.S. tax consequences of purchasing, owning and disposing of our common stock. No assurance exists that the IRS will not challenge any of the tax consequences described herein, and we have not obtained, nor do we intend to obtain, an opinion of counsel with respect to the U.S. federal income or estate tax consequences to a Non-U.S. Stockholder of purchasing, owning and disposing of our common stock.
PROSPECTIVE INVESTORS CONSIDERING THE PURCHASE OF OUR COMMON STOCK SHOULD CONSULT THEIR TAX ADVISORS CONCERNING THE APPLICATION OF UNITED STATES FEDERAL TAX LAWS TO THEIR PARTICULAR SITUATIONS AS WELL AS ANY CONSEQUENCES ARISING UNDER THE LAWS OF ANY OTHER TAXING JURISDICTION AND ANY APPLICABLE TAX TREATY.
Distributions
If we make distributions on our common stock, the distributions will be dividends for U.S. federal income tax purposes to the extent paid from current or accumulated earnings and profits. To the extent distributions exceed our current and accumulated earnings and profits, they will constitute a return of capital that will first reduce your basis, but not below zero, and then will be treated as gain on sale of stock (as discussed further below).
114
Table of Contents
Any dividend paid to a Non-U.S. Stockholder with respect to our common stock generally will be subject to withholding tax at a 30% rate (or such lower rate specified by an applicable income tax treaty). Generally, a Non-U.S. Stockholder must certify as to its eligibility for reduced withholding under an applicable income tax treaty on a properly completed IRS Form W-8BEN in order to obtain the benefits of such treaty. A Non-U.S. Stockholder that does not timely provide us with the required certification, but which qualifies for a reduced treaty rate, may obtain a refund of any excess amounts withheld by timely filing an appropriate claim for refund with the IRS. Non-U.S. Stockholders should consult their tax advisors regarding possible entitlement to benefits under a tax treaty.
If, however, the Non-U.S. Stockholder provides a valid IRS Form W-8ECI, certifying that the dividend is effectively connected with the Non-U.S. Stockholder’s conduct of a trade or business within the United States, and otherwise complies with applicable certification requirements, the dividend will not be subject to withholding. Instead, such dividend will be subject to U.S. federal income tax in the manner described below under “Effectively Connected Income.”
Sale, Exchange or Other Taxable Disposition of Our Common Stock
Except as otherwise discussed below, a Non-U.S. Stockholder generally will not be subject to U.S. federal income tax on any gain realized upon the sale, exchange or other taxable disposition of our common stock unless (i) such gain is effectively connected with the Non-U.S. Stockholder’s conduct of a U.S. trade or business (and, if an income tax treaty applies, the gain is attributable to a U.S. permanent establishment or fixed base maintained by such Non-U.S. Stockholder in the United States), (ii) the Non-U.S. Stockholder is an individual who is present in the United States for a period or periods aggregating 183 days or more during the calendar year in which such sale, exchange or other taxable disposition occurs and certain other conditions are met, (iii) the Non-U.S. Stockholder is subject to provisions applicable to certain U.S. expatriates, or (iv) we are or become a “United States real property holding corporation” (“USRPHC”) for U.S. federal income tax purposes and certain other conditions are met. We do not believe that we are or will become a USRPHC, however, there can be no assurance in that regard.
Gain described in clause (i) immediately above will be subject to U.S. federal income tax in the manner described below under “Effectively Connected Income.” During each taxable year, a Non-U.S. Stockholder described in clause (ii) immediately above will be subject to tax at a 30% rate (or such lower rate specified by an applicable income tax treaty) on the net gain derived from the sale, exchange or other taxable disposition, which may be offset by U.S.-source capital losses of the Non-U.S. Stockholder during the taxable year.
Effectively Connected Income
Any dividend with respect to, or gain recognized upon the sale, exchange or other taxable disposition of, our common stock that is effectively connected with a trade or business carried on by a Non-U.S. Stockholder within the United States (and, if an income tax treaty applies, that is attributable to a permanent establishment or fixed base maintained by such Non-U.S. Stockholder in the United States) will be subject to U.S. federal income tax, based on the Non-U.S. Stockholder’s net income, in the same manner as if the Non-U.S. Stockholder were a U.S. person for U.S. federal income tax purposes. If a dividend or gain is effectively connected with a U.S. trade or business of a Non-U.S. Stockholder that is a corporation for U.S. federal income tax purposes, such corporate Non-U.S. Stockholder may also be subject to a “branch profits tax” at a 30% rate (or such lower rate as may be specified by an applicable income tax treaty), subject to certain adjustments. Non-U.S. Stockholders should consult their tax advisors regarding any applicable tax treaties that may provide for different rules.
Information Reporting and Backup Withholding
Annual reporting to the IRS and to each Non-U.S. Stockholder will be required as to the amount of dividends paid to such Non-U.S. Stockholder and the amount, if any, of tax withheld with respect to such
115
Table of Contents
dividends, unless the Non-U.S. Stockholder is an exempt recipient or otherwise establishes an exemption from such requirements. This information may also be made available to the tax authorities in the Non-U.S. Stockholder’s country of residence. Dividends generally are not subject to “backup withholding” if the Non-U.S. Stockholder properly certifies as to its non-U.S. status (usually by completing an IRS Form W-8BEN.
The payment of the proceeds of the sale, exchange or other disposition of our common stock to or through the U.S. office of a broker will be subject to both backup withholding and information reporting unless the Non-U.S. Stockholder, or beneficial owner thereof, as applicable, certifies its non-U.S. status on IRS Form W-8BEN, or otherwise establishes an exemption. Information reporting requirements, but not backup withholding, will also generally apply to payments of the proceeds of a sale, exchange or other disposition of our common stock by Non-U.S. offices of U.S. brokers or Non-U.S. brokers with certain types of relationships to the United States unless the Non-U.S. Stockholder establishes an exemption.
Backup withholding is not an additional tax. Any amounts withheld under the backup withholding rules from payments made to a Non-U.S. Stockholder may be refunded or credited against such Non-U.S. Stockholder’s U.S. federal income tax liability, if any, provided that the required information is furnished to the IRS.
Estate Tax
A non-resident alien individual should note that shares of our common stock held by (i) such individual or (ii) an entity created by such individual and included in such individual’s gross estate for U.S. federal estate tax purposes (for example, a trust funded by such individual and with respect to which the individual has retained certain interests or powers), will be, absent an applicable treaty, treated as U.S. situs property subject to U.S. federal estate tax. Accordingly, stockholders who are non-resident alien individuals may be subject to U.S. federal estate tax on all or a portion of the value of our common stock owned at the time of their death. Prospective individual stockholders who are non-U.S. persons are urged to consult their tax advisors concerning the potential U.S. federal estate tax consequences with respect to owning our common stock.
Recently Enacted Legislation
Beginning with payments made after December 31, 2012, recently enacted legislation will generally impose a 30% withholding tax on dividends paid with respect to our common stock and the gross proceeds from a disposition of shares of our common stock paid to (i) a foreign financial institution (as defined in Section 1471(d)(4) of the Code) unless the foreign financial institution enters into an agreement with the U.S. Treasury Department to collect and disclose information regarding its U.S. account holders (including certain account holders that are foreign entities that have U.S. owners) and satisfies certain other requirements, and (ii) certain other non-U.S. entities unless the entity provides the payor with certain information regarding certain direct and indirect U.S. owners of the entity, or certifies that it has no such U.S. owners, and complies with certain other requirements. Under certain circumstances, a Non-U.S. Stockholder might be eligible for refunds or credits of the tax. You are encouraged to consult with your own tax advisor regarding the possible implications of this recently enacted legislation on your investment in shares of our common stock.
116
Table of Contents
Under the terms and subject to the conditions contained in an underwriting agreement dated the date of this prospectus, the underwriters named below, for whom Goldman, Sachs & Co., Morgan Stanley & Co. LLC, Merrill Lynch, Pierce, Fenner & Smith Incorporated and Citigroup Global Markets Inc. are acting as representatives, have severally agreed to purchase, and we and the selling stockholders have agreed to sell to them, the number of shares indicated below:
| Name |
Number of Shares | |
| Goldman, Sachs & Co. |
||
| Morgan Stanley & Co. LLC |
||
| Merrill Lynch, Pierce, Fenner & Smith Incorporated |
||
| Citigroup Global Markets Inc. |
||
| Deutsche Bank Securities Inc. |
||
| Wells Fargo Securities, LLC |
||
| Barclays Capital Inc. |
||
| Robert W. Baird & Co. Incorporated |
||
| Sanford C. Bernstein & Co., LLC |
||
| William Blair & Company, L.L.C. |
||
| Credit Suisse Securities (USA) LLC | ||
| Raymond James & Associates, Inc. |
||
| Signal Hill Capital Group LLC |
||
| TOTAL |
The underwriters and the representatives are collectively referred to as the “underwriters” and the “representatives,” respectively. The underwriters are offering the shares of common stock subject to their acceptance of the shares from us and the selling stockholders and subject to prior sale. The underwriting agreement provides that the obligations of the several underwriters to pay for and accept delivery of the shares of common stock offered by this prospectus are subject to the approval of certain legal matters by their counsel and to certain other conditions. The underwriters are obligated to take and pay for all of the shares of common stock offered by this prospectus if any such shares are taken. However, the underwriters are not required to take or pay for the shares covered by the underwriters’ option described below.
The underwriters initially propose to offer part of the shares of common stock directly to the public at the public offering price listed on the cover page of this prospectus and part to certain dealers at a price that represents a concession not in excess of $ per share under the public offering price. No underwriter may allow, and no dealer may re-allow, any concession to other underwriters or to certain dealers. After the initial offering of the shares of common stock, the offering price and other selling terms may from time to time be varied by the representatives. The offering of the shares by the underwriters is subject to receipt and acceptance and subject to the underwriters’ right to reject any order in whole or in part.
We have granted to the underwriters an option, exercisable for 30 days from the date of this prospectus, to purchase up to an aggregate of additional shares of common stock at the public offering price listed on the cover page of this prospectus, less underwriting discounts and commissions. The underwriters may exercise this option if they sell more shares than the total number of shares set forth in the table above. To the extent the option is exercised, each underwriter will become obligated, subject to certain conditions, to purchase approximately the same percentage of the additional shares of common stock as the number listed next to the underwriter’s name in the preceding table bears to the number listed next to “Total” in the preceding table. If the underwriters’ option to purchase additional shares is exercised in full, the total price to the public of all the shares of common stock sold would be $ , the total underwriters’ discounts and commissions paid by us would be $ , and the total proceeds would be $ .
117
Table of Contents
The following table shows the per share and total underwriting discounts and commissions that we and the selling stockholders are to pay to the underwriters in connection with this offering. These amounts are shown assuming both no exercise and full exercise of the underwriters’ option to purchase additional shares of our common stock.
| Paid by Us | Paid by Selling Stockholders |
Total | ||||||||||||||||||||||
| No Exercise | Full Exercise | No Exercise | Full Exercise | No Exercise | Full Exercise | |||||||||||||||||||
| Per Share |
$ | $ | $ | $ | $ | $ | ||||||||||||||||||
| Total |
$ | $ | $ | $ | $ | $ | ||||||||||||||||||
In addition, we estimate that the expenses of this offering payable by us, other than underwriting discounts and commissions, will be approximately $ million, which includes legal, accounting and printing costs and various other fees associated with registration and listing of our common stock.
The underwriters have informed us that they do not intend to confirm sales to accounts over which they exercise discretionary authority without the prior written approval of the customer in excess of 5% of the total number of shares offered by them.
We, all of our directors and executive officers and holders of substantially all of our outstanding stock have agreed that, without the prior written consent of Goldman, Sachs & Co. and Morgan Stanley & Co. LLC on behalf of the underwriters, we and they will not, during the period ending 180 days after the date of this prospectus offer, sell, contract to sell, pledge, grant any option to purchase, make any short sale or otherwise dispose of any shares of our common stock, any options or warrants to purchase shares any shares of our common stock or any securities convertible into, exchangeable for or that represent the right to receive shares of our common stock. The restrictions described in this paragraph do not apply to:
| • | transactions by any person other than us relating to common stock or other securities acquired in open market transactions, block purchases or another public offering, each after the completion of this offering, provided that no filing under Section 16(a) of the Exchange Act shall be required or shall be voluntarily made in connection with subsequent sales of securities purchased in such transaction; |
| • | transfers of common stock or any security convertible into common stock as a bona fide gift or transfers to any trust or limited partnership for the direct or indirect benefit of the transferor or the immediate family of the transferor for estate planning purposes, provided that no filing under Section 16(a) of the Exchange Act shall be required or shall be voluntarily made in connection with such transaction other than a filing on Form 5 after the expiration of such 180 day period, provided further that such transaction shall be a disposition for no value, and provided further that the transferee agrees with the underwriters to be bound by such restrictions for the remainder of such 180 day period; |
| • | transfers or distributions by a stockholder who is subject to a lock-up of common stock to limited or general partners, limited liability company members, stockholders or affiliates of such stockholder, provided that no filing under Section 16(a) of the Exchange Act shall be required or shall be voluntarily made in connection with such transaction, provided further that such transaction shall be a disposition for no value, and provided further that the transferee agrees with the underwriters to be bound by such restrictions for the remainder of such 180 day period; |
| • | transfers by will or intestacy, provided that the transferee agrees with the underwriters to be bound by such restrictions for the remainder of such 180 day period; |
| • | the issuance by us of shares of common stock upon the exercise of an option or a warrant or the conversion of a security outstanding on the date of this prospectus of which the underwriters have been advised in writing; |
| • | the issuance by us of options to purchase our common stock under stock option or similar plans as in effect on the date of the underwriting agreement and as described in this prospectus; |
118
Table of Contents
| • | the registration and issuance of securities by us in connection with an acquisition or strategic investment, provided that the recipient of such securities agrees with the underwriters to be bound by such restrictions for the remainder of such 180 day period, and provided further that the total number of securities so registered and issued shall not exceed 10% of the total number of shares of common stock outstanding after this offering; |
| • | the filing by us of any registration statement on Form S-8 relating to the offering of securities pursuant to the terms of a stock option or similar plan in effect on the date of the underwriting agreement and described in this prospectus; |
| • | the establishment of a trading plan pursuant to Rule 10b5-1 under the Exchange Act for the transfer of shares of common stock, provided that such plan does not provide for the transfer of common stock during the restricted periods; or |
| • | the sale of shares to the underwriters. |
In addition, we and each such person agree that, without the prior written consent of Goldman, Sachs & Co. and Morgan Stanley & Co. LLC on behalf of the underwriters, we will not, during the period ending 180 days after the date of this prospectus, make any demand for, or exercise any right with respect to, the registration of any shares of common stock or any security convertible into or exercisable or exchangeable for common stock.
The 180-day restricted period described in the preceding paragraph will be extended if: (i) during the last 17 days of the 180-day restricted period we issue an earnings release or announce material news or a material event relating to our company occurs or (ii) prior to the expiration of the 180-day restricted period, we announce that we will release earnings results during the 15-day period following the last day of the 180-day period. In such case, the restrictions described in the preceding paragraph will continue to apply until the expiration of the 18-day period beginning on the issuance of the earnings release or the occurrence of the material news or material event unless Goldman, Sachs & Co. and Morgan Stanley & Co. LLC waive such extension.
In order to facilitate this offering of the common stock, the underwriters may engage in transactions that stabilize, maintain or otherwise affect the price of the common stock. Specifically, the underwriters may sell more shares than they are obligated to purchase under the underwriting agreement, creating a short position. A short sale is covered if the short position is no greater than the number of shares available for purchase by the underwriters under their option to purchase additional shares. The underwriters can close out a covered short sale by exercising the option to purchase additional shares or by purchasing shares in the open market. In determining the source of shares to close out a covered short sale, the underwriters will consider, among other things, the open market price of shares compared to the price available under the option to purchase additional shares. The underwriters may also sell shares in excess of the option to purchase additional shares, creating a naked short position. The underwriters must close out any naked short position by purchasing shares in the open market. A naked short position is more likely to be created if the underwriters are concerned that there may be downward pressure on the price of the common stock in the open market after pricing that could adversely affect investors who purchase in this offering. As an additional means of facilitating this offering, the underwriters may bid for, and purchase, shares of common stock in the open market to stabilize the price of the common stock. The underwriters may also impose a penalty bid. This occurs when a particular underwriter repays to the underwriters a portion of the underwriting discount received by it because the representatives have repurchased shares sold by or for the account of such underwriter in stabilizing or short covering transactions. Finally, the underwriting syndicate may reclaim selling concessions allowed to an underwriter or a dealer for distributing the common stock in the offering, if the syndicate repurchases previously distributed common stock in transactions to cover syndicate short positions or to stabilize the price of the common stock. Any of these activities, as well as other purchases by the underwriters for their own accounts, may raise or maintain the market price of the common stock above independent market levels or prevent or retard a decline in the market price of the common stock. The underwriters are not required to engage in these activities, and may end any of these activities at any time.
We have applied to list our common stock on the Nasdaq Global Select Market under the symbol “WSTC.”
119
Table of Contents
Pricing of the Offering
Prior to this offering, there has been no public market for our common stock. The initial public offering price will be determined by negotiations between us and the representatives of the underwriters. Among the factors to be considered in determining the initial public offering price will be our future prospects and those of our industry in general, our sales, earnings and other financial operating information in recent periods, as well as the price-earnings ratios, price-sales ratios and market prices of securities and certain financial and operating information of companies engaged in activities similar to ours. The estimated initial public offering price range set forth on the cover page of this preliminary prospectus is subject to change as a result of market conditions and other factors.
A prospectus in electronic format may be made available on the websites maintained by one or more of the underwriters, and one or more of the underwriters may distribute prospectuses electronically. The underwriters may agree to allocate a number of shares to underwriters for sale to their online brokerage account holders. Internet distributions will be allocated by the underwriters that make Internet distributions on the same basis as other allocations.
The underwriters and their respective affiliates are full service financial institutions engaged in various activities, which may include securities trading, commercial and investment banking, financial advisory, investment management, investment research, principal investment, hedging, financing and brokerage activities. Certain of the underwriters and their respective affiliates have, from time to time, performed, and may in the future perform, various financial advisory and investment banking services for us and the selling stockholders and their respective affiliates, for which they received or will receive customary fees and expenses. In particular, affiliates of Goldman, Sachs & Co. and Merrill Lynch, Pierce, Fenner & Smith Incorporated, underwriters in this offering, are parties to our senior secured term loan facility. Each of our senior secured term loan facility and our senior secured revolving credit facility was negotiated on an arms’ length basis and contains customary terms pursuant to which the lenders receive customary fees. We may use a portion of the proceeds from this offering to repay amounts outstanding under either or both of these loan facilities. See “Use of Proceeds.” In the ordinary course of their various business activities, the underwriters and their respective affiliates may make or hold a broad array of investments and actively trade debt and equity securities (or related derivative securities) and financial instruments (including bank loans) for their own account and for the accounts of their customers, and such investment and securities activities may involve securities and/or instruments of the issuer. The underwriters and their respective affiliates may also make investment recommendations and/or publish or express independent research views in respect of such securities or instruments and may at any time hold, or recommend to clients that they acquire, long and/or short positions in such securities and instruments. In particular, an investment fund affiliated with Goldman, Sachs & Co. holds an approximately 25% interest in a Thomas H. Lee Partners, L.P. investment vehicle that owns 1,226,980 shares of our common stock.
We, the selling stockholders and the several underwriters have agreed to indemnify each other against certain liabilities, including liabilities under the Securities Act.
Stamp Taxes
If you purchase shares of common stock offered in this prospectus, you may be required to pay stamp taxes and other charges under the laws and practices of the country of purchase, in addition to the offering price listed on the cover page of this prospectus.
120
Table of Contents
Selling Restrictions
European Economic Area
In relation to each Member State of the European Economic Area which has implemented the Prospectus Directive, from and including the date on which the Prospectus Directive is implemented in that Member State, each representative and underwriter has not made and will not make an offer of the common stock to the public in that Member State, except that it may, with effect from and including such date, make an offer of the common stock to the public in that Member State:
(a) at any time to legal entities which are authorized or regulated to operate in the financial markets or, if not so authorized or regulated, whose corporate purpose is solely to invest in securities; or
(b) at any time to any legal entity which has two or more of (1) an average of at least 250 employees during the last financial year; (2) a total balance sheet of more than EUR43,000,000 and (3) an annual net turnover of more than EUR50,000,000, as shown in its last annual or consolidated accounts;
(c) to fewer than 100 natural or legal persons (other than qualified investors as defined in the Prospectus Directive) subject to obtaining the prior consent of the representatives for any such offer;
(d) in any other circumstances which do not require the publication by the Issuer of a prospectus pursuant to Article 3 of the Prospectus Directive;
and in any case in circumstances where such offer does not result in a requirement for the publication of a prospectus pursuant to Article 3 of the Prospectus Directive.
For the purposes of the above, the expression an “offer of the common stock to the public” in relation to any shares of common stock in any Member State means the communication in any form and by any means of sufficient information on the terms of the offer and the common stock to be offered so as to enable an investor to decide to purchase or subscribe shares of the common stock, as the same may be varied in that Member State by any measure implementing the Prospectus Directive in that Member State and the expression Prospectus Directive means Directive 2003/71/EC and includes any relevant implementing measure in that Member State.
United Kingdom
Each representative and underwriter has only communicated or caused to be communicated and will only communicate or cause to be communicated an invitation or inducement to engage in investment activity (within the meaning of Section 21 of the Financial Services and Markets Act 2000) in connection with the issue or sale of shares of the common stock in circumstances in which Section 21(1) of such Act does not apply to us and it has complied and will comply with all applicable provisions of such Act with respect to anything done by it in relation to any shares of the common stock in, from or otherwise involving the United Kingdom.
Each underwriter has represented and agreed that:
(a) it has only communicated or caused to be communicated and will only communicate or cause to be communicated an invitation or inducement to engage in investment activity (within the meaning of Section 21 of the FSMA) received by it in connection with the issue or sale of the shares in circumstances in which Section 21(1) of the FSMA would not, if the Issuer was not an authorised person, apply to the Issuer; and
(b) it has complied and will comply with all applicable provisions of the FSMA with respect to anything done by it in relation to the shares in, from or otherwise involving the United Kingdom.
121
Table of Contents
Switzerland
This document, as well as any other material relating to the shares which are the subject of the offering contemplated by this prospectus (the “Shares”), do not constitute an issue prospectus pursuant to Article 652a and/or 1156 of the Swiss Code of Obligations. The Shares will not be listed on the SIX Swiss Exchange and, therefore, the documents relating to the Shares, including, but not limited to, this document, do not claim to comply with the disclosure standards of the listing rules of SIX Swiss Exchange and corresponding prospectus schemes annexed to the listing rules of the SIX Swiss Exchange.
The Shares are being offered in Switzerland by way of a private placement, i.e. to a small number of selected investors only, without any public offer and only to investors who do not purchase the Shares with the intention to distribute them to the public. The investors will be individually approached by the Issuer from time to time.
This document, as well as any other material relating to the Shares, is personal and confidential and do not constitute an offer to any other person. This document may only be used by those investors to whom it has been handed out in connection with the offering described herein and may neither directly nor indirectly be distributed or made available to other persons without express consent of the Issuer. It may not be used in connection with any other offer and shall in particular not be copied and/or distributed to the public in (or from) Switzerland.
Italy
The offering of the shares of our common stock has not been registered pursuant to the Italian securities legislation and, accordingly, our common stock may not be offered or sold in the Republic of Italy in a solicitation to the public.
The shares of our common stock may only be offered, sold and delivered in the Republic of Italy to “Professional investors,” as defined in Article 31.2 of Commissione Nazionale per le Società e la Borsa (“CONSOB”) Regulation No. 11522 of 1st July 1998 (“Regulation No. 11522”), as amended, pursuant to Articles 30.2 and 100 of Legislative Decree No. 58 of 24th February 1998 (“Decree No. 58”), or in circumstances where an express exemption from compliance with the solicitation restrictions provided by Decree No. 58 or CONSOB Regulation No. 11971 of 14th May 1999 applies, provided, however, that any such offer, sale, or delivery of shares or distribution of copies of this prospectus or any other document relating to the shares in the Republic of Italy must be:
| • | made by investment firms, banks, or financial intermediaries permitted to conduct such activities in the Republic of Italy in accordance with Legislative Decree No. 385 of 1st September 1993 (“Decree No. 385”), Decree No. 58, Regulation No. 11522, and any other applicable laws and regulations; and |
| • | in compliance with any other applicable notification requirement or limitation which may be imposed by CONSOB or the Bank of Italy. |
Germany
Shares of our common stock may not be offered or sold or publicly promoted or advertised by any underwriter in the Federal Republic of Germany other than in compliance with the provisions of the German Securities Prospectus Act (Wertpapierprospektgestz—WpPG) of June 22, 2005, as amended, or of any other laws applicable in the Federal Republic of Germany governing the issue, offering and sale of securities.
Hong Kong
The shares may not be offered or sold by means of any document other than (i) in circumstances which do not constitute an offer to the public within the meaning of the Companies Ordinance (Cap.32, Laws of Hong
122
Table of Contents
Kong), or (ii) to “professional investors” within the meaning of the Securities and Futures Ordinance (Cap.571, Laws of Hong Kong) and any rules made thereunder, or (iii) in other circumstances which do not result in the document being a “prospectus” within the meaning of the Companies Ordinance (Cap.32, Laws of Hong Kong), and no advertisement, invitation or document relating to the shares may be issued or may be in the possession of any person for the purpose of issue (in each case whether in Hong Kong or elsewhere), which is directed at, or the contents of which are likely to be accessed or read by, the public in Hong Kong (except if permitted to do so under the laws of Hong Kong) other than with respect to shares which are or are intended to be disposed of only to persons outside Hong Kong or only to “professional investors” within the meaning of the Securities and Futures Ordinance (Cap. 571, Laws of Hong Kong) and any rules made thereunder.
Singapore
This prospectus has not been registered as a prospectus with the Monetary Authority of Singapore. Accordingly, this prospectus and any other document or material in connection with the offer or sale, or invitation for subscription or purchase, of the shares may not be circulated or distributed, nor may the shares be offered or sold, or be made the subject of an invitation for subscription or purchase, whether directly or indirectly, to persons in Singapore other than (i) to an institutional investor under Section 274 of the Securities and Futures Act, Chapter 289 of Singapore (the “SFA”), (ii) to a relevant person, or any person pursuant to Section 275(1A), and in accordance with the conditions, specified in Section 275 of the SFA or (iii) otherwise pursuant to, and in accordance with the conditions of, any other applicable provision of the SFA.
Where the shares are subscribed or purchased under Section 275 by a relevant person which is: (a) a corporation (which is not an accredited investor) the sole business of which is to hold investments and the entire share capital of which is owned by one or more individuals, each of whom is an accredited investor; or (b) a trust (where the trustee is not an accredited investor) whose sole purpose is to hold investments and each beneficiary is an accredited investor, shares, debentures and units of shares and debentures of that corporation or the beneficiaries’ rights and interest in that trust shall not be transferable for 6 months after that corporation or that trust has acquired the shares under Section 275 except: (1) to an institutional investor under Section 274 of the SFA or to a relevant person, or any person pursuant to Section 275(1A), and in accordance with the conditions, specified in Section 275 of the SFA; (2) where no consideration is given for the transfer; or (3) by operation of law.
Japan
The securities have not been and will not be registered under the Financial Instruments and Exchange Law of Japan (the Financial Instruments and Exchange Law) and each underwriter has agreed that it will not offer or sell any securities, directly or indirectly, in Japan or to, or for the benefit of, any resident of Japan (which term as used herein means any person resident in Japan, including any corporation or other entity organized under the laws of Japan), or to others for re-offering or resale, directly or indirectly, in Japan or to a resident of Japan, except pursuant to an exemption from the registration requirements of, and otherwise in compliance with, the Financial Instruments and Exchange Law and any other applicable laws, regulations and ministerial guidelines of Japan.
Dubai International Financial Centre
This document relates to an exempt offer in accordance with the Offered Securities Rules of the Dubai Financial Services Authority. This document is intended for distribution only to persons of a type specified in those rules. It must not be delivered to, or relied on by, any other person. The Dubai Financial Services Authority has no responsibility for reviewing or verifying any documents in connection with exempt offers. The Dubai Financial Services Authority has not approved this document nor taken steps to verify the information set out in it, and has no responsibility for it. The shares which are the subject of the offering contemplated by this prospectus (the “Shares”) may be illiquid and/or subject to restrictions on their resale. Prospective purchasers of the Shares offered should conduct their own due diligence on the Shares. If you do not understand the contents of this document you should consult an authorised financial adviser.
123
Table of Contents
Certain legal matters in connection with this offering, including the validity of the shares of common stock offered hereby, will be passed upon for us by Sidley Austin LLP. Ropes & Gray LLP has acted as counsel for the underwriters in connection with certain legal matters related to this offering.
The financial statements included in this prospectus and the related financial statement schedule have been audited by Deloitte & Touche LLP, an independent registered public accounting firm, as stated in their report appearing herein and elsewhere in the registration statement. Such financial statements and financial statement schedule have been so included in reliance upon the report of such firm given upon their authority as experts in accounting and auditing.
WHERE YOU CAN FIND MORE INFORMATION
We have filed with the SEC a registration statement on Form S-1 with respect to the common stock being sold in this offering. This prospectus constitutes a part of that registration statement. This prospectus does not contain all the information set forth in the registration statement and the exhibits and schedules to the registration statement, because some parts have been omitted in accordance with the rules and regulations of the SEC. For further information with respect to us and our common stock being sold in this offering, you should refer to the registration statement and the exhibits and schedules filed as part of the registration statement. Statements contained in this prospectus regarding the contents of any agreement, contract or other document referred to are not necessarily complete; reference is made in each instance to the copy of the contract or document filed as an exhibit to the registration statement. Each statement is qualified by reference to the exhibit. You may inspect a copy of the registration statement without charge at the SEC’s principal office in Washington, D.C. Copies of all or any part of the registration statement may be obtained after payment of fees prescribed by the SEC from the SEC’s Public Reference Room at the SEC’s principal office, at 100 F Street, N.E., Washington, D.C. 20549.
You may obtain information regarding the operation of the Public Reference Room by calling the SEC at 1-800-SEC-0330. The SEC maintains an Internet site that contains reports, proxy and information statements and other information regarding registrants that file electronically with the SEC. The SEC’s website address is www.sec.gov.
As a result of the offering, we will become subject to the full informational requirements of the Exchange Act. We will fulfill our obligations with respect to such requirements by filing periodic reports and other information with the SEC.
124
Table of Contents
INDEX TO CONSOLIDATED FINANCIAL STATEMENTS
OF WEST CORPORATION AND SUBSIDIARIES
| Page | ||||
| Financial Statements for the Three Years Ended December 31, 2011: |
||||
| F-2 | ||||
| Consolidated Statements of Operations for the Years Ended December 31, 2011, 2010 and 2009 |
F-3 | |||
| Consolidated Statements of Comprehensive Income for the Years Ended December 31, 2011, 2010 and 2009 |
F-4 | |||
| Consolidated Balance Sheets as of December 31, 2011 and 2010 |
F-5 | |||
| Consolidated Statements of Cash Flows for the Years Ended December 31, 2011, 2010 and 2009 |
F-6 | |||
| F-7 | ||||
| F-8 | ||||
| Financial Statement Schedule: |
||||
| F-53 | ||||
F-1
Table of Contents
REPORT OF INDEPENDENT REGISTERED PUBLIC ACCOUNTING FIRM
To the Board of Directors of
West Corporation
Omaha, Nebraska
We have audited the accompanying consolidated balance sheets of West Corporation and subsidiaries (the “Company”) as of December 31, 2011 and 2010, and the related consolidated statements of operations, comprehensive income, stockholders’ deficit, and cash flows for each of the three years in the period ended December 31, 2011. Our audits also included the financial statement schedule listed in the Index at Item 15. These financial statements and financial statement schedule are the responsibility of the Company’s management. Our responsibility is to express an opinion on the financial statements and financial statement schedule based on our audits.
We conducted our audits in accordance with the standards of the Public Company Accounting Oversight Board (United States). Those standards require that we plan and perform the audit to obtain reasonable assurance about whether the financial statements are free of material misstatement. An audit includes examining, on a test basis, evidence supporting the amounts and disclosures in the financial statements. An audit also includes assessing the accounting principles used and significant estimates made by management, as well as evaluating the overall financial statement presentation. We believe that our audits provide a reasonable basis for our opinion.
In our opinion, such consolidated financial statements present fairly, in all material respects, the financial position of West Corporation and subsidiaries at December 31, 2011 and 2010, and the results of their operations and their cash flows for each of the three years in the period ended December 31, 2011, in conformity with accounting principles generally accepted in the United States of America. Also, in our opinion, such financial statement schedule, when considered in relation to the basic consolidated financial statements taken as a whole, presents fairly, in all material respects, the information set forth therein.
We have also audited, in accordance with the standards of the Public Company Accounting Oversight Board (United States), the Company’s internal control over financial reporting as of December 31, 2011, based on the criteria established in Internal Control—Integrated Framework issued by the Committee of Sponsoring Organizations of the Treadway Commission and our report dated February 13, 2012 expressed an unqualified opinion on the Company’s internal control over financial reporting.
/s/ Deloitte & Touche LLP
Omaha, Nebraska
February 13, 2012
F-2
Table of Contents
CONSOLIDATED STATEMENTS OF OPERATIONS
(AMOUNTS IN THOUSANDS EXCEPT PER SHARE AMOUNTS)
| Years Ended December 31, | ||||||||||||
| 2011 | 2010 | 2009 | ||||||||||
| REVENUE |
$ | 2,491,325 | $ | 2,388,211 | $ | 2,375,748 | ||||||
| COST OF SERVICES |
1,113,289 | 1,057,008 | 1,067,777 | |||||||||
| SELLING, GENERAL AND ADMINISTRATIVE EXPENSES |
909,908 | 911,022 | 907,358 | |||||||||
|
|
|
|
|
|
|
|||||||
| OPERATING INCOME |
468,128 | 420,181 | 400,613 | |||||||||
| OTHER INCOME (EXPENSE): |
||||||||||||
| Interest income |
447 | 255 | 311 | |||||||||
| Interest expense |
(269,863 | ) | (252,724 | ) | (254,103 | ) | ||||||
| Refinancing expense |
— | (52,804 | ) | — | ||||||||
| Other, net |
5,815 | 5,872 | 1,015 | |||||||||
|
|
|
|
|
|
|
|||||||
| Other expense |
(263,601 | ) | (299,401 | ) | (252,777 | ) | ||||||
|
|
|
|
|
|
|
|||||||
| INCOME BEFORE INCOME TAX EXPENSE |
204,527 | 120,780 | 147,836 | |||||||||
|
|
|
|
|
|
|
|||||||
| INCOME TAX EXPENSE |
77,034 | 60,476 | 56,862 | |||||||||
|
|
|
|
|
|
|
|||||||
| NET INCOME |
127,493 | 60,304 | 90,974 | |||||||||
| LESS NET INCOME—NONCONTROLLING INTEREST |
— | — | 2,745 | |||||||||
|
|
|
|
|
|
|
|||||||
| NET INCOME—WEST CORPORATION |
$ | 127,493 | $ | 60,304 | $ | 88,229 | ||||||
|
|
|
|
|
|
|
|||||||
| EARNINGS (LOSS) PER COMMON SHARE: |
||||||||||||
| Basic Class L |
$ | 17.18 | $ | 17.07 | $ | 17.45 | ||||||
|
|
|
|
|
|
|
|||||||
| Diluted Class L |
$ | 16.48 | $ | 16.37 | $ | 16.67 | ||||||
|
|
|
|
|
|
|
|||||||
| Basic Common |
$ | (0.50 | ) | $ | (1.25 | ) | $ | (0.98 | ) | |||
|
|
|
|
|
|
|
|||||||
| Diluted Common |
$ | (0.50 | ) | $ | (1.25 | ) | $ | (0.98 | ) | |||
|
|
|
|
|
|
|
|||||||
| WEIGHTED AVERAGE NUMBER OF SHARES OUTSTANDING: |
||||||||||||
| Basic Class L |
9,984 | 9,975 | 9,954 | |||||||||
| Diluted Class L |
10,408 | 10,399 | 10,409 | |||||||||
| Basic Common |
87,912 | 87,955 | 87,588 | |||||||||
| Diluted Common |
87,912 | 87,955 | 87,588 | |||||||||
The accompanying notes are an integral part of these financial statements.
F-3
Table of Contents
CONSOLIDATED STATEMENTS OF COMPREHENSIVE INCOME
(AMOUNTS IN THOUSANDS)
| Years Ended December 31, | ||||||||||||
| 2011 | 2010 | 2009 | ||||||||||
| Net income |
$ | 127,493 | $ | 60,304 | $ | 90,974 | ||||||
| Foreign currency translation adjustments, net of tax of $11,176, $3,014 and $705 |
(18,234 | ) | (4,918 | ) | 1,855 | |||||||
| Reclassification of a cash flow hedge into earnings |
5,188 | — | 2,057 | |||||||||
| Unrealized gain (loss) on cash flow hedges, net of tax of $4,450, $2,821 and $3,905 |
7,260 | (4,602 | ) | 9,373 | ||||||||
|
|
|
|
|
|
|
|||||||
| Comprehensive income |
121,707 | 50,784 | 104,259 | |||||||||
| Less: comprehensive income attributable to noncontrolling interest |
— | — | 2,745 | |||||||||
|
|
|
|
|
|
|
|||||||
| Comprehensive income—West Corporation |
$ | 121,707 | $ | 50,784 | $ | 101,514 | ||||||
|
|
|
|
|
|
|
|||||||
The accompanying notes are an integral part of these financial statements.
F-4
Table of Contents
CONSOLIDATED BALANCE SHEETS
(AMOUNTS IN THOUSANDS)
| December 31, | ||||||||
| 2011 | 2010 | |||||||
| ASSETS |
||||||||
| CURRENT ASSETS: |
||||||||
| Cash and cash equivalents |
$ | 93,836 | $ | 97,793 | ||||
| Trust and restricted cash |
16,446 | 15,122 | ||||||
| Accounts receivable, net of allowance of $11,627 and $10,481 |
413,813 | 366,419 | ||||||
| Deferred income taxes receivable |
10,068 | 29,968 | ||||||
| Prepaid assets |
37,042 | 33,667 | ||||||
| Other current assets |
50,581 | 34,058 | ||||||
|
|
|
|
|
|||||
| Total current assets |
621,786 | 577,027 | ||||||
| PROPERTY AND EQUIPMENT: |
||||||||
| Property and equipment |
1,133,070 | 1,032,205 | ||||||
| Accumulated depreciation and amortization |
(782,215 | ) | (690,839 | ) | ||||
|
|
|
|
|
|||||
| Total property and equipment, net |
350,855 | 341,366 | ||||||
| GOODWILL |
1,762,635 | 1,629,396 | ||||||
| INTANGIBLE ASSETS, net of accumulated amortization of $424,705 and $357,500 |
333,147 | 299,685 | ||||||
| OTHER ASSETS |
159,095 | 157,776 | ||||||
|
|
|
|
|
|||||
| TOTAL ASSETS |
$ | 3,227,518 | $ | 3,005,250 | ||||
|
|
|
|
|
|||||
| LIABILITIES AND STOCKHOLDERS’ DEFICIT |
||||||||
| CURRENT LIABILITIES: |
||||||||
| Accounts payable |
$ | 79,439 | $ | 64,149 | ||||
| Accrued expenses |
323,436 | 283,988 | ||||||
| Current maturities of long-term debt |
15,425 | 15,425 | ||||||
|
|
|
|
|
|||||
| Total current liabilities |
418,300 | 363,562 | ||||||
| LONG-TERM OBLIGATIONS, less current maturities |
3,500,940 | 3,518,141 | ||||||
| DEFERRED INCOME TAXES |
121,521 | 93,881 | ||||||
| OTHER LONG-TERM LIABILITIES |
83,170 | 68,721 | ||||||
|
|
|
|
|
|||||
| Total liabilities |
4,123,931 | 4,044,305 | ||||||
| COMMITMENTS AND CONTINGENCIES (Note 14) |
||||||||
| CLASS L COMMON STOCK $0.001 PAR VALUE, NO SHARES ISSUED OR OUTSTANDING AT DECEMBER 31, 2011 AND 9,988 SHARES ISSUED AND OUTSTANDING AND 100,000 SHARES AUTHORIZED AT DECEMBER 31, 2010 |
— | 1,504,445 | ||||||
| STOCKHOLDERS’ DEFICIT |
||||||||
| Common Stock $0.001 par value, 1,000,000 shares authorized, 490,650 shares issued and 490,271 shares outstanding at December 31, 2011 and 400,000 shares authorized, 88,071 shares issued and 87,956 shares outstanding at December 31, 2010 |
491 | 88 | ||||||
| Additional paid-in capital |
1,695,477 | — | ||||||
| Retained deficit |
(2,556,525 | ) | (2,516,315 | ) | ||||
| Accumulated other comprehensive loss |
(32,036 | ) | (26,250 | ) | ||||
| Treasury stock at cost (379 and 115 shares) |
(3,820 | ) | (1,023 | ) | ||||
|
|
|
|
|
|||||
| Total stockholders’ deficit |
(896,413 | ) | (2,543,500 | ) | ||||
|
|
|
|
|
|||||
| TOTAL LIABILITIES AND STOCKHOLDERS’ DEFICIT |
$ | 3,227,518 | $ | 3,005,250 | ||||
|
|
|
|
|
|||||
The accompanying notes are an integral part of these condensed consolidated financial statements.
F-5
Table of Contents
CONSOLIDATED STATEMENTS OF CASH FLOWS
(AMOUNTS IN THOUSANDS)
| Years Ended December 31, | ||||||||||||
| 2011 | 2010 | 2009 | ||||||||||
| CASH FLOWS FROM OPERATING ACTIVITIES: |
||||||||||||
| Net income |
$ | 127,493 | $ | 60,304 | $ | 90,974 | ||||||
| Adjustments to reconcile net income to net cash flows from operating activities: |
||||||||||||
| Depreciation |
103,207 | 103,330 | 104,837 | |||||||||
| Amortization |
68,701 | 67,000 | 83,510 | |||||||||
| Goodwill impairment |
— | 37,675 | — | |||||||||
| Provision for share based compensation |
23,341 | 4,233 | 3,840 | |||||||||
| Deferred income tax expense |
23,716 | 20,837 | 28,274 | |||||||||
| Debt amortization |
13,449 | 15,868 | 16,416 | |||||||||
| Accelerated debt amortization |
— | 19,395 | — | |||||||||
| Allowance for impairment of purchased accounts receivable |
— | — | 25,464 | |||||||||
| Unrealized gain on foreign denominated debt |
— | — | (3,508 | ) | ||||||||
| Non cash gain on hedge agreements |
(4,665 | ) | (3,978 | ) | (9,570 | ) | ||||||
| Other |
232 | 652 | 375 | |||||||||
| Changes in operating assets and liabilities, net of business acquisitions: |
||||||||||||
| Accounts receivable |
(32,372 | ) | (11,023 | ) | (506 | ) | ||||||
| Other assets |
(34,852 | ) | (9,521 | ) | (17,669 | ) | ||||||
| Accounts payable |
6,163 | (1,519 | ) | (4,721 | ) | |||||||
| Accrued expenses and other liabilities |
53,774 | 9,576 | (44,859 | ) | ||||||||
|
|
|
|
|
|
|
|||||||
| Net cash flows from operating activities |
348,187 | 312,829 | 272,857 | |||||||||
|
|
|
|
|
|
|
|||||||
| CASH FLOWS FROM INVESTING ACTIVITIES: |
||||||||||||
| Business acquisitions, net of cash acquired of $4,780, $2,138 and $8,631 |
(211,639 | ) | (33,496 | ) | (31,711 | ) | ||||||
| Collections applied to principal of portfolio receivables, net of purchases of $0, $0 and $1,722 |
— | 13,739 | 37,341 | |||||||||
| Purchase of property and equipment |
(117,913 | ) | (118,191 | ) | (118,520 | ) | ||||||
| Other |
111 | 52 | 275 | |||||||||
|
|
|
|
|
|
|
|||||||
| Net cash flows from investing activities |
(329,441 | ) | (137,896 | ) | (112,615 | ) | ||||||
|
|
|
|
|
|
|
|||||||
| CASH FLOWS FROM FINANCING ACTIVITIES: |
||||||||||||
| Payments of long-term revolving credit obligations |
(786,300 | ) | (1,374,781 | ) | (201,674 | ) | ||||||
| Proceeds from issuance of long-term revolving credit obligations |
786,300 | 1,301,850 | — | |||||||||
| Debt issuance costs |
(1,029 | ) | (31,083 | ) | (7,968 | ) | ||||||
| Principal repayments of long-term obligations |
(17,201 | ) | (26,747 | ) | (25,284 | ) | ||||||
| Payments of capital lease obligations |
(945 | ) | (2,115 | ) | (1,293 | ) | ||||||
| Repurchase of common stock |
(5,845 | ) | (970 | ) | — | |||||||
| Proceeds from stock options exercised including excess tax benefits |
1,840 | 897 | 3,200 | |||||||||
| Repayments of portfolio notes payable |
— | (686 | ) | (34,694 | ) | |||||||
| Noncontrolling interest distributions |
— | — | (4,131 | ) | ||||||||
| Other |
— | (16 | ) | — | ||||||||
|
|
|
|
|
|
|
|||||||
| Net cash flows from financing activities |
(23,180 | ) | (133,651 | ) | (271,844 | ) | ||||||
|
|
|
|
|
|
|
|||||||
| EFFECT OF EXCHANGE RATES ON CASH AND CASH EQUIVALENTS |
477 | (2,557 | ) | 2,330 | ||||||||
| NET CHANGE IN CASH AND CASH EQUIVALENTS |
(3,957 | ) | 38,725 | (109,272 | ) | |||||||
| CASH AND CASH EQUIVALENTS, Beginning of period |
97,793 | 59,068 | 168,340 | |||||||||
|
|
|
|
|
|
|
|||||||
| CASH AND CASH EQUIVALENTS, End of period |
$ | 93,836 | $ | 97,793 | $ | 59,068 | ||||||
|
|
|
|
|
|
|
|||||||
The accompanying notes are an integral part of these financial statements.
F-6
Table of Contents
CONSOLIDATED STATEMENTS OF STOCKHOLDERS’ DEFICIT
(AMOUNTS IN THOUSANDS, EXCEPT SHARES)
| Common Stock |
Additional Paid-in Capital |
Retained Deficit |
Noncontrolling Interest |
Treasury Stock |
Accumulated Other Comprehensive Income (Loss) |
Total Stockholders’ Accumulated Deficit |
||||||||||||||||||||||
| BALANCE, January 1, 2009 |
$ | 87 | $ | — | $ | (2,334,398 | ) | $ | 3,632 | $ | (53 | ) | $ | (30,015 | ) | $ | (2,360,747 | ) | ||||||||||
| Net income |
88,229 | 2,745 | 90,974 | |||||||||||||||||||||||||
| Foreign currency translation adjustment, net of tax of ($705) |
1,855 | 1,855 | ||||||||||||||||||||||||||
| Reclassification of a cash flow hedge into earnings |
2,057 | 2,057 | ||||||||||||||||||||||||||
| Unrealized gain on cash flow hedges, net of tax of ($3,905) |
9,373 | 9,373 | ||||||||||||||||||||||||||
| Noncontrolling interest distributions |
(4,131 | ) | (4,131 | ) | ||||||||||||||||||||||||
| Noncash settlement with a noncontrolling interest |
(2,246 | ) | (2,246 | ) | ||||||||||||||||||||||||
| Executive Deferred Compensation Plan contributions |
1,728 | 1,728 | ||||||||||||||||||||||||||
| Executive Deferred Compensation Plan valuation change |
4,095 | 4,095 | ||||||||||||||||||||||||||
| Stock options exercised including related tax benefits (572,660 shares) |
1 | 3,532 | 3,533 | |||||||||||||||||||||||||
| Share based compensation |
1,701 | 1,701 | ||||||||||||||||||||||||||
| Accretion of class L common stock priority return preference |
(11,056 | ) | (162,601 | ) | (173,657 | ) | ||||||||||||||||||||||
|
|
|
|
|
|
|
|
|
|
|
|
|
|
|
|||||||||||||||
| BALANCE, December 31, 2009 |
88 | — | (2,408,770 | ) | — | (53 | ) | (16,730 | ) | (2,425,465 | ) | |||||||||||||||||
| Net income |
60,304 | 60,304 | ||||||||||||||||||||||||||
| Foreign currency translation adjustment, net of tax of ($3,014) |
(4,918 | ) | (4,918 | ) | ||||||||||||||||||||||||
| Unrealized loss on cash flow hedges, net of tax of ($2,821) |
(4,602 | ) | (4,602 | ) | ||||||||||||||||||||||||
| Executive Deferred Compensation Plan distributions, net |
(305 | ) | (305 | ) | ||||||||||||||||||||||||
| Executive Deferred Compensation Plan valuation change |
(275 | ) | (275 | ) | ||||||||||||||||||||||||
| Stock options exercised including related tax benefits (78,400 shares) |
897 | 897 | ||||||||||||||||||||||||||
| Purchase of stock at cost (106,277 shares) |
(970 | ) | (970 | ) | ||||||||||||||||||||||||
| Share based compensation |
2,099 | 2,099 | ||||||||||||||||||||||||||
| Accretion of class L common stock priority return preference |
(2,416 | ) | (167,849 | ) | (170,265 | ) | ||||||||||||||||||||||
|
|
|
|
|
|
|
|
|
|
|
|
|
|
|
|||||||||||||||
| BALANCE, December 31, 2010 |
88 | — | (2,516,315 | ) | — | (1,023 | ) | (26,250 | ) | (2,543,500 | ) | |||||||||||||||||
| Net income |
127,493 | 127,493 | ||||||||||||||||||||||||||
| Conversion of Class L common stock to common stock |
403 | 1,675,031 | 1,675,434 | |||||||||||||||||||||||||
| Foreign currency translation adjustment, net of tax of ($11,176) |
(18,234 | ) | (18,234 | ) | ||||||||||||||||||||||||
| Reclassification of a cash flow hedge into earnings |
5,188 | 5,188 | ||||||||||||||||||||||||||
| Unrealized gain on cash flow hedges, net of tax of $4,450 |
7,260 | 7,260 | ||||||||||||||||||||||||||
| Executive Deferred Compensation Plan contributions, net |
3,101 | 3,101 | ||||||||||||||||||||||||||
| Stock options exercised including related tax benefits (994,303 shares) |
659 | 659 | ||||||||||||||||||||||||||
| Purchase of stock at cost (264,784 shares) |
(2,797 | ) | (2,797 | ) | ||||||||||||||||||||||||
| Share based compensation |
20,550 | 20,550 | ||||||||||||||||||||||||||
| Accretion of class L common stock priority return preference |
(3,864 | ) | (167,703 | ) | (171,567 | ) | ||||||||||||||||||||||
|
|
|
|
|
|
|
|
|
|
|
|
|
|
|
|||||||||||||||
| BALANCE, December 31, 2011 |
$ | 491 | $ | 1,695,477 | $ | (2,556,525 | ) | $ | — | $ | (3,820 | ) | $ | (32,036 | ) | $ | (896,413 | ) | ||||||||||
|
|
|
|
|
|
|
|
|
|
|
|
|
|
|
|||||||||||||||
The accompanying notes are an integral part of these financial statements.
F-7
Table of Contents
NOTES TO CONSOLIDATED FINANCIAL STATEMENTS
YEARS ENDED DECEMBER 31, 2011, 2010 AND 2009
| 1. | ORGANIZATION, CONSOLIDATION AND PRESENTATION OF FINANCIAL STATEMENTS |
Business Description: West Corporation (the “Company” or “West”) is a leading provider of technology-driven communication services. “We,” “us” and “our” also refer to West and its consolidated subsidiaries, as applicable. The scale and processing capacity of our proprietary technology platforms, combined with our expertise in managing voice and data transactions, enable us to offer a broad portfolio of services, including conferencing and collaboration, alerts and notifications, emergency communications and business processing outsourcing. Our services provide reliable, high-quality, mission-critical communications designed to maximize return on investment for our clients. Our clients include Fortune 1000 companies, along with small and medium enterprises in a variety of industries, including telecommunications, retail, financial services, public safety, technology and healthcare. We have sales and operations in the United States, Canada, Europe, the Middle East, Asia Pacific and Latin America.
We operate in two business segments:
| • | Unified Communications, including conferencing and collaboration services, event services, alerts and notification services and IP-based unified communication solutions; and |
| • | Communication Services, including emergency communication services, automated call processing and agent-based services. |
Unified Communications
— Conferencing & Collaboration Services. Operating under the InterCall® brand, we are the largest conferencing services provider in the world based on conferencing revenue, according to Wainhouse Research. We managed approximately 121 million conference calls in 2011, a 13 percent increase over 2010. We provide our clients with an integrated global suite of meeting services. These include on-demand audio conferencing services, video managed services and web collaboration tools that allow clients to make presentations and share applications and documents over the Internet.
— Event Services. InterCall offers an event services team to help clients who would like extra assistance planning, conducting and gathering report information for large scale or high-value meetings or conferences. Event services include audio and video webcasting services, virtual event design and hosting, operator-assisted audio conferencing services and web event services.
— Alerts & Notifications Services. Our technology platforms allow clients to manage and deliver automated, proactive and personalized communications. We use multiple delivery channels (voice, text messaging, email, social media and fax) based on the preference of the recipient. For example, we deliver patient notifications, send and confirm appointments and prescription reminders on behalf of our healthcare clients, provide travelers with flight arrival and departure updates on behalf of our transportation clients, send and receive automated outage notifications on behalf of our utility clients and transmit emergency evacuation notices on behalf of municipalities. Our scalable platform enables a high volume of messages to be sent in a short amount of time. Our platform also enables two-way communication which allows the recipients of a message to respond with relevant information to our clients.
— IP-Based Unified Communications Solutions. We provide our clients with enterprise class IP-based communications solutions enabled by our technology. We offer hosted IP-private branch exchange (“PBX”) and enterprise call management, hosted and managed multi-protocol label switching (“MPLS”) network solutions, unified communications partner solution portfolio services, cloud-based security services, integrated conferencing/desktop messaging and presence tools, and professional services and systems integration expertise.
F-8
Table of Contents
WEST CORPORATION
NOTES TO CONSOLIDATED FINANCIAL STATEMENTS—(Continued)
YEARS ENDED DECEMBER 31, 2011, 2010 AND 2009
Communication Services
— Emergency Communications Services. We believe we are one of the largest providers of emergency communications services, based on the number of 9-1-1 calls that we and other participants in the industry facilitate. Our services are critical in facilitating public safety agencies’ ability to receive emergency calls from citizens. Our clients generally enter into long-term contracts and fund their obligations through monthly charges on users’ telephone bills.
— Automated Call Processing. We believe we have developed a best-in-class automated customer service platform. Our services allow our clients to effectively communicate with their customers through inbound and outbound interactive voice response (“IVR”) applications using natural language speech recognition, automated voice prompts and network-based call routing services. In addition to these front-end customer service applications, we also provide analyses that help our clients improve their automated communications strategy. Our open standards-based platform allows the flexibility to integrate new capabilities, such as mobility, social media and cloud-based services.
— Agent-Based Services. We provide our clients with large-scale, agent-based services, including inbound customer care, customer retention, business-to-business, account management, receivables management, overpayment identification and recovery solutions, as well as direct response and language services. We target opportunities to provide our agent-based services as part of larger strategic client engagements and with clients for whom these services can add value. We believe that we are known in the industry as a premium provider of these services. We have a flexible model that offers on-shore, off-shore and virtual home-based capabilities to fit our clients’ needs.
Basis of Consolidation: The consolidated financial statements include our accounts and the accounts of our wholly owned and majority owned subsidiaries. All intercompany transactions and balances have been eliminated in the consolidated financial statements.
Use of Estimates: The preparation of financial statements in conformity with accounting principles generally accepted in the United States of America requires management to make estimates and assumptions that affect the reported amounts of assets and liabilities and disclosure of contingent assets and liabilities at the date of the financial statements and the reported amounts of revenues and expenses during the reporting period. Actual results could differ from those estimates.
Revenue Recognition: In our Unified Communications segment, our conferencing and collaboration services, event services and IP-based unified communications solutions are generally billed and revenue recognized on a per participant minute basis or per seat basis and our alerts and notifications services are generally billed, and revenue recognized, on a per message or per minute basis. We also charge clients for additional features, such as conference call recording, transcription services or professional services. Our Communication Services segment recognizes revenue for platform-based and agent-based services in the month that services are performed and services are generally billed based on call duration, hours of input, number of calls or a contingent basis. Emergency communications services revenue within the Communication Services segment is generated primarily from monthly fees based on the number of billing telephone numbers and cell towers covered under contract. In addition, product sales and installations are generally recognized upon completion of the installation and client acceptance of a fully functional system or, for contracts that are completed in stages, recognized upon completion of such stages. As it relates to installation sales, as of January 1, 2010, we early adopted new revenue recognition guidance for multiple element arrangements. For contracts entered into prior to January 1, 2010, revenue associated with advance payments was deferred until the system installations are completed. Costs incurred on uncompleted contracts are accumulated and recorded as
F-9
Table of Contents
WEST CORPORATION
NOTES TO CONSOLIDATED FINANCIAL STATEMENTS—(Continued)
YEARS ENDED DECEMBER 31, 2011, 2010 AND 2009
deferred costs until the system installations are completed. This guidance was adopted prospectively and specifically for the product sales and installation services for the emergency communications services revenue. Contracts for annual recurring services such as support and maintenance agreements are generally billed in advance and are recognized as revenue ratably (on a monthly basis) over the contractual periods. Nonrefundable up-front fees and related costs are recognized ratably over the term of the contract except in certain instances where the future benefit is linked to the customer relationship, which may necessitate a longer recognition period.
Revenue for contingent collection services and overpayment identification and recovery services is recognized in the month collection payments are received based upon a percentage of cash collected or other agreed upon contractual parameters. In December 2010, we sold the balance of the investment in receivable portfolios and no longer purchase receivables for collection. Prior to the sale, we used either the level-yield method or the cost recovery method to recognize revenue on these purchased receivable portfolios.
Cost of Services: Cost of services includes labor, sales commissions, telephone and other expenses directly related to service activities.
Selling, General and Administrative Expenses: Selling, general and administrative expenses consist of expenses that support the ongoing operation of our business. These expenses include costs related to division management, facilities costs, depreciation, maintenance, amortization of finite-lived intangible assets, sales and marketing activities, client support services, bad debt expense and corporate management costs.
Other Income (Expense): Other income (expense) includes interest expense from borrowings under credit facilities, interest income from short-term investments, investment gains or losses in the assets held in our deferred compensation plans and foreign currency transaction gains (losses) on affiliate transactions denominated in currencies other that the functional currency.
Cash and Cash Equivalents: We consider short-term investments with original maturities of three months or less at acquisition to be cash equivalents.
Trust and Restricted Cash: Trust cash represents cash collected on behalf of our clients that has not yet been remitted to them. A related liability is recorded in accounts payable until settlement with the respective clients. Restricted cash primarily represents cash held as collateral for certain letters of credit.
Financial Instruments: Cash and cash equivalents, accounts receivable and accounts payable are short-term in nature and the net values at which they are recorded are considered to be reasonable estimates of their fair values.
Accounts Receivable: Accounts receivable from customers is presented net of an allowance for doubtful accounts of approximately $11.6 million and $10.5 million at December 31, 2011 and 2010, respectively.
Property and Equipment: Property and equipment are recorded at cost. Depreciation expense is based on the estimated useful lives of the assets or remaining lease terms, whichever is shorter, and is calculated on the straight-line method. Our owned buildings have estimated useful lives ranging from 20 to 39 years and the majority of the other assets have estimated useful lives of three to five years. We review property, plant and equipment for impairment whenever events or changes in business circumstances indicate that the carrying amount of the assets may not be fully recoverable. Recoverability of an asset “held-for-use” is determined by comparing the carrying amount of the asset to the undiscounted net cash flows expected to be generated from the
F-10
Table of Contents
WEST CORPORATION
NOTES TO CONSOLIDATED FINANCIAL STATEMENTS—(Continued)
YEARS ENDED DECEMBER 31, 2011, 2010 AND 2009
use of the asset. If the carrying amount is greater than the undiscounted net cash flows expected to be generated by the asset, the asset’s carrying amount is reduced to its fair value. An asset “held-for-sale” is reported at the lower of the carrying amount or fair value less cost to sell.
Goodwill and Intangible Assets: Goodwill at December 31, 2011 and 2010 was $1,762.6 million and $1,629.4 million, respectively. Intangible assets at December 31, 2011 and 2010, net of accumulated amortization, were $333.1 million and $299.7 million, respectively. Goodwill and intangible assets with indefinite lives are not amortized, but are tested for impairment on an annual basis. We test goodwill for impairment at the reporting unit level (operating segment or one level below an operating segment) on an annual basis in the fourth quarter or more frequently if we believe indicators of impairment exist. Goodwill of a reporting unit is tested for impairment between annual tests if an event occurs or circumstances change that would more-likely-than-not reduce the fair value of a reporting unit below its carrying amount. At December 31, 2011, our reporting units were one level below our operating segments. The performance of the impairment test involves a two-step process. The first step of the goodwill impairment test involves comparing the fair values of the applicable reporting units with their aggregate carrying values, including goodwill. We determine the fair value of our reporting units using the discounted cash flow methodology. The discounted cash flow methodology requires us to make key assumptions such as projected future cash flows, growth rates, terminal value and a weighted average cost of capital. If the carrying amount of a reporting unit exceeds the reporting unit’s fair value, we perform the second step of the goodwill impairment test to determine the amount of impairment loss. The second step of the goodwill impairment test involves comparing the implied fair value of the affected reporting unit’s goodwill with the carrying value of that goodwill.
Our indefinite-lived intangible assets consist of trade names and their values are assessed separately from goodwill in connection with our annual impairment testing. This assessment is made using the relief-from royalty method, under which the value of a trade name is determined based on a royalty that could be charged to a third party for using the trade name in question. The royalty, which is based on a reasonable rate applied against forecasted sales, is tax-effected and discounted to present value. The most significant assumptions in this evaluation include estimated future sales, the royalty rate and the after-tax discount rate.
Our finite-lived intangible assets are amortized over their estimated useful lives. Our finite-lived intangible assets are tested for recoverability whenever events or changes in circumstances such as reductions in demand or significant economic slowdowns are present on intangible assets used in operations that may indicate the carrying amount is not recoverable. Reviews are performed to determine whether the carrying value of an asset is recoverable, based on comparisons to undiscounted expected future cash flows. If this comparison indicates that the carrying value is not recoverable, the impaired asset is written down to fair value.
Other Assets: Other assets primarily include the unamortized balance of debt acquisition costs, assets held in non-qualified deferred compensation plans, and the unamortized balance of internally developed capitalized software and licensing agreements. The assets held in the non-qualified deferred compensation plans represent mutual funds invested in debt and equity securities and are classified as trading securities as employees have the ability to change the investment allocation of their deferred compensation at any time. These investments are reported at fair value with unrealized gains (losses) of $(1.3) million, $2.9 million and $3.9 million for the years ended December 31, 2011, 2010, and 2009, respectively, recognized currently within other income. The underlying obligation, recorded in other liabilities, is likewise reported at the investments’ fair value with adjustments recognized currently within compensation expense. Both the investments and the obligations are classified as non-current.
F-11
Table of Contents
WEST CORPORATION
NOTES TO CONSOLIDATED FINANCIAL STATEMENTS—(Continued)
YEARS ENDED DECEMBER 31, 2011, 2010 AND 2009
Income Taxes: We file a consolidated United States income tax return. We use an asset and liability approach for the financial reporting of income taxes in accordance with Accounting Standards Codification Topic 740 Income Taxes (“ASC 740”). Deferred income taxes arise from temporary differences between financial and tax reporting. Income tax expense has been provided on the portion of foreign source income that we have determined will be repatriated to the United States. We record uncertain tax positions based on a two-step process, whereby (1) we determine whether it is more likely than not that the tax positions will be sustained based on the technical merits of the position and (2) for those tax positions that meet the more likely than not recognition threshold, we would recognize the largest amount of tax benefit that is greater than fifty percent likely to be realized upon ultimate settlement with the related tax authority.
Other Long-Term Liabilities: Other long-term liabilities primarily include liabilities held in non-qualified deferred compensation plans, uncertain tax positions, the non-current portion of hedge liabilities and non-current deferred revenue.
Other Comprehensive Income (Loss): Other comprehensive income (loss) is composed of unrealized gains or losses on foreign currency translation adjustments arising from changes in exchange rates of our foreign subsidiaries. Assets and liabilities are translated at the exchange rates in effect on the balance sheet dates. The translation adjustment is included in comprehensive income, net of related tax expense. Also, the gain or loss on the effective portion of cash flow hedges (i.e., change in fair value) is initially reported as a component of other comprehensive income (loss). The remaining gain or loss is recognized in interest expense in the same period in which the cash flow hedge affects earnings. These are our only components of other comprehensive income (loss).
Stock Based Compensation: We are required to recognize expense related to the fair value of employee stock option awards and to measure the cost of employee services received in exchange for an award of equity instruments based on the grant date fair value of the award.
Noncontrolling Interest: In December 2010, we sold the balance of the investment in receivable portfolios and no longer participate in purchased receivables collection. As a result of this sale, none of our subsidiaries have noncontrolling interest ownership structures.
Recapitalization: On October 24, 2006, we completed a recapitalization (the “recapitalization”) of the Company. Pursuant to such recapitalization, our publicly traded securities were cancelled in exchange for cash. The recapitalization was accounted for as a leveraged recapitalization, whereby the historical bases of our assets and liabilities were maintained.
Conversion: On December 30, 2011, we completed the conversion of our outstanding Class L Common Stock into shares of Class A Common Stock (the “Conversion”) by filing amendments to our amended and restated certificate of incorporation (the “Charter Amendments”) with the Delaware Secretary of State. Upon the effectiveness of the filing of the Charter Amendments, each share of our outstanding Class L Common Stock was converted into 40.29 shares of Class A Common Stock.
Prior to the Conversion, our equity investors (i.e., the Sponsors, the Founders and certain members of management) owned a combination of Class L and Class A shares (in strips of eight Class A shares and one Class L share per strip). Supplemental management incentive equity awards (restricted stock and option programs) were implemented with Class A shares/options only. General terms of those securities were:
| • | Class L shares: Each Class L share was entitled to a priority return preference equal to the sum of (x) $90 per share base amount plus (y) an amount sufficient to generate a 12% internal rate of return |
F-12
Table of Contents
WEST CORPORATION
NOTES TO CONSOLIDATED FINANCIAL STATEMENTS—(Continued)
YEARS ENDED DECEMBER 31, 2011, 2010 AND 2009
| (“IRR”) on that base amount, compounded quarterly, from the date of the recapitalization in which the Class L shares were originally issued, October 24, 2006, until the priority return preference was paid in full or converted. Each Class L share also participated in any equity appreciation beyond the priority return on the same per share basis as the Class A shares. |
| • | Class A shares: Class A shares participated in the equity appreciation after the Class L priority return was satisfied. |
| • | Voting: Each share (whether Class A or Class L) was entitled to one vote per share on all matters on which stockholders vote, subject to Delaware law regarding class voting rights. |
| • | Distributions: Dividends and other distributions to stockholders in respect of shares, whether as part of an ordinary distribution of earnings, as a leveraged recapitalization or in the event of an ultimate liquidation and distribution of available corporate assets, were to be paid as follows. First, holders of Class L shares were entitled to receive an amount equal to the Class L base amount of $90 per share plus an amount sufficient to generate a 12% IRR on that base amount, compounded quarterly, from the closing date of the recapitalization to the date of payment. Second, after payment of this priority return to Class L holders, the holders of Class A shares and Class L shares were to participate together, as a single class, in any and all distributions by the Company. |
| • | Automatic Conversion of Class L shares: Class L shares were to automatically convert into Class A shares prior to an initial public offering (“IPO”). Also, the board of directors could elect to cause all Class L shares to be converted into Class A shares in connection with a transfer (by stock sale, merger or otherwise) of a majority of all common stock to a third party (other than to Thomas H. Lee Partners, LP and its affiliates). In the case of any such conversion (whether at an IPO or sale), if any unpaid Class L priority return (base $90/share plus accrued 12% IRR) remained unpaid at the time of conversion it would have been “paid” in additional Class A shares valued at the deal price (in case of IPO, at the IPO price net of underwriter’s discount); that is, each Class L share would convert into a number of Class A shares equal to (i) one plus (ii) a fraction, the numerator of which is the unpaid priority return on such Class L share and the denominator of which is the value of a Class A share at the time of conversion. |
As the Class L stockholders controlled a majority of the votes of the board of directors through direct representation on the board of directors and the conversion and redemption features are considered to be outside the control of the Company, all shares of Class L common stock, prior to the Conversion, were presented outside of permanent equity in accordance with ASC 480-10-599, Classification and Measurement of Redeemable Securities. Subsequent to the Conversion, the Class L accreted value was reclassified to Common Stock and Additional Paid-In Capital.
F-13
Table of Contents
WEST CORPORATION
NOTES TO CONSOLIDATED FINANCIAL STATEMENTS—(Continued)
YEARS ENDED DECEMBER 31, 2011, 2010 AND 2009
A reconciliation of the Class L common shares for the years ended December 31, 2011 and 2010 is presented below, in thousands:
| 2011 | 2010 | |||||||
| Beginning of period balance |
$ | 1,504,445 | $ | 1,332,721 | ||||
| Accretion of Class L common stock priority return preference |
171,567 | 170,265 | ||||||
| Executive Deferred Compensation Plan activity |
2,826 | 1,459 | ||||||
| Purchase of Class L shares |
(3,404 | ) | — | |||||
| Conversion of Class L common stock to Class A common stock |
(1,675,434 | ) | — | |||||
|
|
|
|
|
|||||
| End of period balance |
$ | — | $ | 1,504,445 | ||||
|
|
|
|
|
|||||
Reclassification of Common Stock: — On December 30, 2011, following the Conversion, all of the then outstanding shares of Class A Common Stock were reclassified as shares of Common Stock pursuant to the filing of the Charter Amendments (the “Reclassification”). Following the Reclassification, all shares of Common Stock share proportionately in dividends. The Charter Amendments also increased our number of authorized shares to nine hundred million (900,000,000) shares of Class A Common Stock and one hundred million (100,000,000) shares of Class L Common Stock. Following consummation of the Conversion and the Reclassification, we had one billion authorized shares of Common Stock.
As a result of the reclassification of Class A common stock to common stock, references to “Class A common stock” have been changed to “common stock” for all periods presented.
Foreign Currency and Translation of Foreign Subsidiaries: The functional currencies of the Company’s foreign operations are the respective local currencies. All assets and liabilities of the Company’s foreign operations are translated into U.S. dollars at fiscal period-end exchange rates. Income and expense items are translated at average exchange rates prevailing during the fiscal period. The resulting translation adjustments are recorded as a component of stockholders’ equity and other comprehensive income. Foreign currency transaction gains or losses are recorded in the statement of operations.
Subsequent Events: In accordance with the provisions of ASC 855, we have evaluated subsequent events. No subsequent events requiring recognition were identified and therefore none were incorporated into the condensed consolidated financial statements presented herein.
Recent Accounting Pronouncements: In December 2010, the Financial Accounting Standards Board (“FASB”) issued guidance requiring an entity, such as the Company, with reporting units that have carrying amounts that are zero or negative to assess whether it is more likely than not that the reporting units’ goodwill is impaired. The Company is required to perform step two of the goodwill impairment test if there are any adverse qualitative factors indicating that an impairment may exist for their reporting units with a zero or negative carrying value. This guidance became effective for the Company January 1, 2011 and the adoption had no effect on our financial position, results of operations or cash flows.
In June 2011, the FASB issued ASU No. 2011- 05, Comprehensive Income (Topic 220), requiring entities to present net income and other comprehensive income in either a single continuous statement or in two separate, but consecutive, statements of net income and other comprehensive income. ASU No. 2011-05 is effective for statements issued by the Company after January 1, 2012. In December 2011, the FASB issued ASU 2011-12 Comprehensive Income which defers certain portions of ASU 2011-5 and indefinitely deferred the requirement to present reclassification adjustments out of accumulated other comprehensive income by component. The
F-14
Table of Contents
WEST CORPORATION
NOTES TO CONSOLIDATED FINANCIAL STATEMENTS—(Continued)
YEARS ENDED DECEMBER 31, 2011, 2010 AND 2009
Company early adopted the provisions of ASU No. 2011-05 and ASU No. 2011-12 and accordingly all previous periods have been retrospectively presented.
In September 2011 the FASB issued ASU No. 2011- 08, Intangibles-Goodwill and Other (Topic 350), permitting entities the option to first assess qualitative factors to determine whether it is more likely than not that the fair value of a reporting unit is less than its carrying amount as a basis for determining whether it is necessary to perform the two-step goodwill impairment test. ASU No. 2011- 08 is effective for the Company January 1, 2012 and the adoption is not expected to have an effect on our financial position, results of operations or cash flows.
| 2. | MERGERS AND ACQUISITIONS |
PivotPoint
On August 10, 2011, we completed the acquisition of substantially all of the telecommunication business assets of PivotPoint Solutions, LLC (“PivotPoint”), a provider of wireless location accuracy compliance reporting, analysis and optimization. PivotPoint’s technology allows wireless carriers to monitor and optimize their location finding networks. The purchase price was $22.9 million and was funded by cash on hand and partial use of our revolving credit facilities. The results of the acquired PivotPoint assets have been included in the Communication Services segment since August 10, 2011.
Factors that contributed to a purchase price resulting in the recognition of goodwill, non-deductible for tax purposes, for the purchase of the PivotPoint assets included PivotPoints’ expertise in location accuracy compliance reporting mandated by the Federal Communications Commission, expansion of 9-1-1 products and services, market expansion and operational efficiencies.
Contact One
On June 7, 2011, we completed the acquisition of substantially all of the assets of Contact One, Inc. (“Contact One”), a provider of 9-1-1 database, mapping/GIS (Geographic Information System) and 9-1-1 products and services. The purchase price was $7.6 million and was funded by cash on hand and partial use of our revolving credit facilities. The results of the acquired Contact One assets have been included in the Communication Services segment since June 7, 2011.
Factors that contributed to a purchase price resulting in the recognition of goodwill, non-deductible for tax purposes, for the purchase of the Contact One assets included Contact One’s expertise in 9-1-1 database, mapping/GIS and expansion of 9-1-1 products and services.
Smoothstone
On June 3, 2011, we completed the acquisition of Smoothstone IP Communications Corporation (“Smoothstone”), a provider of cloud-based communications for the enterprise. The acquisition of Smoothstone added cloud-based IP telephony and network management to our Unified Communications solutions portfolio. The purchase price was $120.0 million and was funded by cash on hand and partial use of our revolving credit facilities. The results of Smoothstone have been included in the Unified Communications segment since June 3, 2011.
Factors that contributed to a purchase price resulting in the recognition of goodwill, non-deductible for tax purposes, for the purchase of Smoothstone included a complete product portfolio of cloud-based, network-centric Unified Communications solutions, a flexible deployment model which enables a menu of solutions to be implemented to replace or complement customers’ existing on-premise equipment, expansion of the target market of potential clients and capital expenditure and operating cost avoidance.
F-15
Table of Contents
WEST CORPORATION
NOTES TO CONSOLIDATED FINANCIAL STATEMENTS—(Continued)
YEARS ENDED DECEMBER 31, 2011, 2010 AND 2009
Unisfair
On March 1, 2011, we completed the acquisition of Unisfair, Inc. (“Unisfair”), a provider of hosted virtual events and business environments. These virtual events and environments offer a highly interactive experience through speaking sessions, exhibition floors and networking areas that support many business purposes, including sales and lead generation, training, product marketing and corporate and employee communications. The addition of Unisfair enhances our virtual event offering by permitting us to offer a complete end-to-end solution on a proprietary platform within our Unified Communications segment. The purchase price was $19.5 million and was funded by cash on hand. The results of Unisfair have been included in the Unified Communications segment since March 1, 2011.
A factor that contributed to a purchase price resulting in the recognition of goodwill, non-deductible for tax purposes, for the purchase of Unisfair included enhancement of our virtual events and business environment services offering.
TFCC
On February 1, 2011, we completed the acquisition of Twenty First Century Communications, Inc. (“TFCC”), a provider of automated alerts and notification solutions to the electric utilities industry, government, public safety and corporate markets. The addition of TFCC enhances our alerts and notifications platform and our position as a service provider to the U.S. utility industry. The purchase price was $40.5 million and was funded by cash on hand and partial use of our revolving credit facilities. The results of TFCC have been included in the Unified Communications segment since February 2, 2011.
Factors that contributed to a purchase price resulting in the recognition of goodwill, deductible for tax purposes, for the purchase of TFCC included expansion of our presence in emergency alerts and notification services particularly in the utilities industry and the potential to drive additional services into this market.
POSTcti
On February 1, 2011, we completed the acquisition of Preferred One Stop Technologies Limited (“POSTcti”), a provider of unified communications solutions and services in Europe. POSTcti enables and provides single source communication convergence from best-of-breed industry-leading providers, combined with customized professional services implementation and dedicated ongoing product support. The purchase price included $4.3 million of non-contingent consideration paid in Sterling at closing and was funded with cash on hand. The purchase agreement for POSTcti also includes a three year contingent earn-out provision with a maximum payment of approximately £12.0 million and £0.4 million (approximately $18.6 million and $0.6 million at the December 31, 2011 exchange rate) of additional non-contingent deferred consideration withheld to secure sellers’ indemnification obligations. The contingent earn-out will be determined based on the achievement of specified revenue and EBITDA objectives. Based on a weighted average probability analysis, we have accrued $7.9 million at December 31, 2011 for the contingent earn-out. The results of POSTcti has been included in the Unified Communications segment since February 1, 2011.
A factor that contributed to a purchase price resulting in the recognition of goodwill, non-deductible for tax purposes, for the purchase of POSTcti included the expansion of our hosted and managed unified communications solutions to Europe.
F-16
Table of Contents
WEST CORPORATION
NOTES TO CONSOLIDATED FINANCIAL STATEMENTS—(Continued)
YEARS ENDED DECEMBER 31, 2011, 2010 AND 2009
SPN
On November 9, 2010, we completed the acquisition of substantially all of the assets of Specialty Pharmacy Network, Inc. (“SPN”), a provider of billing and management information to payers and providers that participate in managing, administering and paying specialty pharmacy claims. SPN’s primary offering is a server based application whose data mining capabilities allow SPN to identify indicators of medical claim overpayment based on a proprietary library of pharmacy edits. The purchase price was $3.5 million and was funded by cash on hand. The results of the acquired SPN assets have been included in the Communication Services segment since November 9, 2010.
Factors that contributed to a purchase price resulting in the recognition of goodwill, non-deductible for tax purposes, for the purchase of the SPN assets included SPN’s expertise and the large market opportunity in pharmacy insurance claims.
TuVox
On July 21, 2010, we completed the acquisition of TuVox Incorporated (“TuVox”), a provider of on-demand and interactive voice recognition applications. The purchase price was $16.5 million and was funded by cash on hand. The results of operations for TuVox have been included in the Communication Services segment since July 21, 2010.
Factors that contributed to a purchase price resulting in the recognition of goodwill, non-deductible for tax purposes, for the purchase of TuVox included a reduction of future costs.
Holly
On June 1, 2010, we completed the acquisition of Holly Australia Pty Ltd, (“Holly”), a provider of carrier- grade voice platforms. The purchase price was $9.2 million and was funded by cash on hand. The results of operations for Holly have been included in the Communication Services segment since June 1, 2010.
Factors that contributed to a purchase price resulting in the recognition of goodwill, non-deductible for tax purposes, for the purchase of Holly included a reduction of future licensing costs and expansion of voice software product offerings.
SKT
On April 1, 2010, we completed the acquisition of the SKT Business Communication Solutions division of the Southern Kansas Telephone Company, Inc. (“SKT”), a provider of professional services, systems integration and information technology specializing in the consulting, project management and implementation of unified communications solutions. The purchase price was $4.0 million and was funded by cash on hand. The results of operations of SKT have been included in the consolidated financial statements in the Unified Communications segment since April 1, 2010.
Factors that contributed to a purchase price resulting in the recognition of goodwill, deductible for tax purposes, for the purchase of SKT included expansion of unified communications offerings including professional services and systems integration.
F-17
Table of Contents
WEST CORPORATION
NOTES TO CONSOLIDATED FINANCIAL STATEMENTS—(Continued)
YEARS ENDED DECEMBER 31, 2011, 2010 AND 2009
The following table summarizes the estimated fair values of the assets acquired and liabilities assumed at the respective acquisition dates for PivotPoint, Contact One, Smoothstone, Unisfair, TFCC, POSTcti, SPN, TuVox, Holly and SKT. The finite-lived intangible assets are comprised of trade names, technology, non-competition agreements and customer relationships. We are in the process of completing the valuation of certain intangible assets and the acquisition accounting allocation, and accordingly the information presented with respect to the acquisitions of PivotPoint, Contact One, Smoothstone, Unisfair, TFCC and POSTcti are provisional and subject to adjustment.
| (Amounts in thousands) |
PivotPoint | Contact One | Smoothstone | Unisfair | TFCC | POSTcti | SPN | TuVox | Holly | SKT | ||||||||||||||||||||||||||||||
| Working Capital |
$ | 91 | $ | (390 | ) | $ | 4,635 | $ | (3,749 | ) | $ | 1,080 | $ | (1,255 | ) | $ | — | $ | (1,245 | ) | $ | 1,699 | $ | 2,037 | ||||||||||||||||
| Property and equipment |
307 | 56 | 1,484 | 339 | 3,304 | 18 | — | 242 | 110 | 209 | ||||||||||||||||||||||||||||||
| Other assets, net |
30 | — | — | 42 | — | — | — | 10,365 | — | — | ||||||||||||||||||||||||||||||
| Intangible assets |
10,791 | 2,785 | 48,610 | 10,960 | 17,250 | 3,859 | 550 | 7,907 | 4,300 | 798 | ||||||||||||||||||||||||||||||
| Goodwill |
11,650 | 5,189 | 79,538 | 15,360 | 18,870 | 11,221 | 2,988 | 1,212 | 4,295 | 1,005 | ||||||||||||||||||||||||||||||
|
|
|
|
|
|
|
|
|
|
|
|
|
|
|
|
|
|
|
|
|
|||||||||||||||||||||
| Total assets acquired |
22,869 | 7,640 | 134,267 | 22,952 | 40,504 | 13,843 | 3,538 | 18,481 | 10,404 | 4,049 | ||||||||||||||||||||||||||||||
|
|
|
|
|
|
|
|
|
|
|
|
|
|
|
|
|
|
|
|
|
|||||||||||||||||||||
| Non-current deferred taxes |
— | — | 13,182 | 3,452 | — | 1,013 | — | 2,030 | 1,168 | — | ||||||||||||||||||||||||||||||
| Long-term liabilities |
— | — | 1,047 | — | — | 8,537 | — | — | — | — | ||||||||||||||||||||||||||||||
|
|
|
|
|
|
|
|
|
|
|
|
|
|
|
|
|
|
|
|
|
|||||||||||||||||||||
| Total liabilities assumed |
— | — | 14,229 | 3,452 | — | 9,550 | — | 2,030 | 1,168 | — | ||||||||||||||||||||||||||||||
|
|
|
|
|
|
|
|
|
|
|
|
|
|
|
|
|
|
|
|
|
|||||||||||||||||||||
| Net assets acquired |
$ | 22,869 | $ | 7,640 | $ | 120,038 | $ | 19,500 | $ | 40,504 | $ | 4,293 | $ | 3,538 | $ | 16,451 | $ | 9,236 | $ | 4,049 | ||||||||||||||||||||
|
|
|
|
|
|
|
|
|
|
|
|
|
|
|
|
|
|
|
|
|
|||||||||||||||||||||
Pro forma
Assuming acquisitions made since January 1, 2010, occurred as of the beginning of the periods presented, our unaudited pro forma results of operations for the years ended December 31, 2011 and 2010, respectively, would have been as follows, in thousands:
| 2011 | 2010 | 2009 | ||||||||||
| Revenue |
$ | 2,514,303 | $ | 2,470,826 | $ | 2,405,467 | ||||||
| Net Income |
$ | 123,184 | $ | 37,391 | $ | 84,065 | ||||||
| Earnings per common L share—basic |
$ | 17.18 | $ | 17.07 | $ | 17.45 | ||||||
| Earnings per common L share—diluted |
$ | 16.48 | $ | 16.37 | $ | 16.67 | ||||||
| Loss per common share—basic |
$ | (0.55 | ) | $ | (1.51 | ) | $ | (1.02 | ) | |||
| Loss per common share—diluted |
$ | (0.55 | ) | $ | (1.51 | ) | $ | (1.02 | ) | |||
The pro forma results above are not necessarily indicative of the operating results that would have actually occurred if the acquisitions had been in effect on the dates indicated, nor are they necessarily indicative of future results of the combined companies.
Our 2011 and 2010 acquisitions were included in the consolidated results of operations from their respective dates of acquisitions and included revenue of $76.5 million in 2011 and $31.7 million in 2010. The net income impact of those acquisitions was not material in 2011 or 2010. Acquisition costs for the years ended December 31, 2011 and 2010 of $4.1 million and $2.2 million, respectively, are included in selling general and administrative expenses.
F-18
Table of Contents
WEST CORPORATION
NOTES TO CONSOLIDATED FINANCIAL STATEMENTS—(Continued)
YEARS ENDED DECEMBER 31, 2011, 2010 AND 2009
| 3. | GOODWILL AND OTHER INTANGIBLE ASSETS |
The following table presents the activity in goodwill by reporting segment for the years ended December 31, 2011 and 2010, in thousands:
| Unified | Communication | |||||||||||
| Communications | Services | Consolidated | ||||||||||
| Balance at January 1, 2010 |
$ | 854,466 | $ | 811,103 | $ | 1,665,569 | ||||||
| Accumulated impairment losses |
— | — | — | |||||||||
|
|
|
|
|
|
|
|||||||
| 854,466 | 811,103 | 1,665,569 | ||||||||||
| Acquisitions |
1,005 | 11,424 | 12,429 | |||||||||
| Purchase accounting adjustments |
(71 | ) | 98 | 27 | ||||||||
| Foreign currency translation adjustment |
(11,842 | ) | 888 | (10,954 | ) | |||||||
|
|
|
|
|
|
|
|||||||
| Balance at December 31, 2010 |
843,558 | 823,513 | 1,667,071 | |||||||||
| 2010 impairment |
— | (37,675 | ) | (37,675 | ) | |||||||
|
|
|
|
|
|
|
|||||||
| Net balance at December 31, 2010 |
843,558 | 785,838 | 1,629,396 | |||||||||
| Acquisitions |
124,989 | 16,839 | 141,828 | |||||||||
| Purchase accounting adjustments |
— | (3,023 | ) | (3,023 | ) | |||||||
| Foreign currency translation adjustment |
(5,565 | ) | (1 | ) | (5,566 | ) | ||||||
|
|
|
|
|
|
|
|||||||
| Balance at December 31, 2011 |
962,982 | 837,328 | 1,800,310 | |||||||||
|
|
|
|
|
|
|
|||||||
| Accumulated impairment losses |
— | (37,675 | ) | (37,675 | ) | |||||||
|
|
|
|
|
|
|
|||||||
| Net balance at December 31, 2011 |
$ | 962,982 | $ | 799,653 | $ | 1,762,635 | ||||||
|
|
|
|
|
|
|
|||||||
The excess of the acquisition costs over the fair value of the assets acquired and liabilities assumed for the purchase of PivotPoint, Contact One, Smoothstone, Unisfair, TFCC and POSTcti were assigned to goodwill based on preliminary estimates. We are in the process of completing the acquisition accounting for certain intangible assets and liabilities. The process of completing the acquisition accounting involves numerous time consuming steps for information gathering, verification and review. We expect to finalize this process within twelve months following the respective acquisition dates.
The Company tests goodwill for impairment at the reporting unit level (one level below an operating segment) on an annual basis in the fourth quarter, or more frequently if management believes indicators of impairment exist. Goodwill of a reporting unit is tested for impairment between annual tests if an event occurs or circumstances change that would more-likely-than-not reduce the fair value of a reporting unit below its carrying amount. Impairment testing results performed during the fourth quarter of 2011, indicated that the fair value of each of our reporting units as calculated during the step one analysis exceeded the carrying value and therefore we were not required to perform step two analysis for the year ended December 31, 2011.
During 2010, the Company identified impairment indicators in one of our reporting units, our traditional direct response business (marketed as “West Direct”). As a result of these impairment indicators and the results of impairment tests performed using the discounted cash flows model, goodwill with an aggregate net carrying value of $37.7 million was written down to their fair value of zero. The impairment charge primarily resulted from the decline in revenue in 2010 and continued general decline in the direct response business. These events caused us to revise downward our projected future cash flows for this reporting unit. The impairment charge was recorded in SG&A and was non-deductible for tax purposes. Subsequent to the goodwill impairment we recognized in the third quarter, our annual impairment testing of goodwill was performed during the fourth quarter of 2010. We were not required to perform step two analysis for the year ended December 31, 2010, as the fair value of each of our reporting units as calculated during the step one analysis exceeded the carrying value.
F-19
Table of Contents
WEST CORPORATION
NOTES TO CONSOLIDATED FINANCIAL STATEMENTS—(Continued)
YEARS ENDED DECEMBER 31, 2011, 2010 AND 2009
During 2011 we completed the purchase price allocation for the acquisitions of TuVox, SPN and Holly. As a result of the TuVox finalization, goodwill was reduced $3.0 million, primarily due to deferred tax adjustments.
During 2010 we completed the purchase price allocation for the Stream57 acquisition. The results of the valuation of certain intangible assets required $0.3 million reduction to finite-lived intangible assets with a corresponding increase to goodwill and decrease in deferred taxes from what was previously estimated. Further, working capital was reduced $0.7 million and a $0.1 million working capital cash settlement was paid resulting in an increase to goodwill. As a result of completing the purchase price allocation, the estimated useful economic lives of the finite-lived intangible assets were finalized.
During 2010 we completed the purchase price allocation for the SKT acquisition. The results required no adjustment to goodwill or finite-lived intangible assets.
Other intangible assets
Below is a summary of the major intangible assets and weighted average amortization periods for each identifiable intangible asset, in thousands:
| As of December 31, 2011 | Weighted Average |
|||||||||||||||
| Intangible assets |
Acquired Cost |
Accumulated Amortization |
Net Intangible Assets |
Amortization Period (Years) |
||||||||||||
| Client Relationships |
$ | 538,154 | $ | (341,236 | ) | $ | 196,918 | 9.2 | ||||||||
| Technology & Patents |
131,446 | (61,098 | ) | 70,348 | 10.3 | |||||||||||
| Trade names |
47,110 | — | 47,110 | Indefinite | ||||||||||||
| Trade names (finite-lived) |
26,690 | (12,423 | ) | 14,267 | 4.3 | |||||||||||
| Other intangible assets |
14,452 | (9,948 | ) | 4,504 | 4.6 | |||||||||||
|
|
|
|
|
|
|
|||||||||||
| Total |
$ | 757,852 | $ | (424,705 | ) | $ | 333,147 | |||||||||
|
|
|
|
|
|
|
|||||||||||
| As of December 31, 2010 | Weighted Average |
|||||||||||||||
| Intangible assets |
Acquired Cost |
Accumulated Amortization |
Net Intangible Assets |
Amortization Period (Years) |
||||||||||||
| Client Relationships |
$ | 473,144 | $ | (289,889 | ) | $ | 183,255 | 9.0 | ||||||||
| Technology & Patents |
102,311 | (47,376 | ) | 54,935 | 10.5 | |||||||||||
| Trade names |
58,710 | — | 58,710 | Indefinite | ||||||||||||
| Trade names (finite-lived) |
12,379 | (10,170 | ) | 2,209 | 4.3 | |||||||||||
| Other intangible assets |
10,641 | (10,065 | ) | 576 | 5.6 | |||||||||||
|
|
|
|
|
|
|
|||||||||||
| Total |
$ | 657,185 | $ | (357,500 | ) | $ | 299,685 | |||||||||
|
|
|
|
|
|
|
|||||||||||
Amortization expense for finite-lived intangible assets was $61.7 million, $61.3 million and $70.1 million for the years ended December 31, 2011, 2010 and 2009, respectively. Estimated amortization expense in millions for the next five years for the intangible assets acquired in all acquisitions completed by us on or prior to December 31, 2011 is as follows:
| 2012 |
$ | 57.1 million | ||
| 2013 |
$ | 50.3 million | ||
| 2014 |
$ | 42.3 million | ||
| 2015 |
$ | 34.6 million | ||
| 2016 |
$ | 25.7 million |
F-20
Table of Contents
WEST CORPORATION
NOTES TO CONSOLIDATED FINANCIAL STATEMENTS—(Continued)
YEARS ENDED DECEMBER 31, 2011, 2010 AND 2009
The trade name intangible asset for three acquisitions (InterCall in 2003, Intrado in 2006, and TeleVox in 2007) have been determined to have an indefinite life based on management’s current intentions. If factors were to change that would indicate the need to assign a finite life to these assets, we will do so and will commence amortization. During the fourth quarter of 2011, we performed our annual impairment analysis for these trade names using the relief-from-royalty methodology. No trade names were determined to be impaired during 2011.
During 2011, it was determined that the use of Positron and ConferenceCall.com as trade names, previously considered indefinite lived, should be changed to a finite life as current customers are moved toward greater recognition of the Intrado brand name for the next generation of Public Safety services and the InterCall brand name for Unified Communications services.
The following table summarizes the finite-lived intangible assets acquired in the acquisitions made since January 1, 2010:
| Customer Relationships |
Non-Compete Agreements |
Trade Names |
Amortization Period (Years) |
Amortization recorded in |
||||||||||||||||||||||||||
| (Amounts in thousands) |
Technology | Total | 2011 | 2010 | ||||||||||||||||||||||||||
| 2011 Acquisitions: |
||||||||||||||||||||||||||||||
| PivotPoint |
$ | 8,500 | $ | 2,121 | $ | 170 | $ | — | $ | 10,791 | 1.5 to 10 | $ | 1,371 | $ | — | |||||||||||||||
| Contact One |
1,500 | 1,000 | 220 | 65 | 2,785 | 3 to 10 | 164 | — | ||||||||||||||||||||||
| Smoothstone |
29,400 | 15,400 | 2,650 | 1,160 | 48,610 | 1.5 to 15 | 3,420 | — | ||||||||||||||||||||||
| Unisfair |
2,700 | 8,000 | — | 260 | 10,960 | 3 to 10 | 1,889 | — | ||||||||||||||||||||||
| TFCC |
13,600 | 2,250 | 690 | 710 | 17,250 | 5 to 15 | 1,791 | — | ||||||||||||||||||||||
| POSTcti |
1,767 | 1,445 | 37 | 610 | 3,859 | 3 to 10 | 722 | — | ||||||||||||||||||||||
| 2010 Acquisitions: |
||||||||||||||||||||||||||||||
| SPN |
— | 440 | 110 | — | 550 | 4 to 5 | 132 | 22 | ||||||||||||||||||||||
| TuVox |
4,270 | 3,600 | — | 37 | 7,907 | 0.5 to 18 | 1,169 | 110 | ||||||||||||||||||||||
| Holly |
1,240 | 2,900 | — | 160 | 4,300 | 3 to 5 | 1,001 | 551 | ||||||||||||||||||||||
| SKT |
670 | — | 38 | 90 | 798 | 1 to 4 | 206 | 220 | ||||||||||||||||||||||
|
|
|
|
|
|
|
|
|
|
|
|
|
|
|
|||||||||||||||||
| $ | 63,647 | $ | 37,156 | $ | 3,915 | $ | 3,092 | $ | 107,810 | $ | 11,865 | $ | 903 | |||||||||||||||||
|
|
|
|
|
|
|
|
|
|
|
|
|
|
|
|||||||||||||||||
| 4. | PROPERTY AND EQUIPMENT |
Property and equipment, at cost, in thousands, consisted of the following:
| December 31, | ||||||||
| 2011 | 2010 | |||||||
| Land and improvements |
$ | 8,209 | $ | 7,428 | ||||
| Buildings |
101,972 | 98,197 | ||||||
| Telephone and computer equipment |
808,047 | 719,311 | ||||||
| Office furniture and equipment |
64,963 | 64,242 | ||||||
| Leasehold improvements |
107,906 | 108,177 | ||||||
| Construction in progress |
41,973 | 34,850 | ||||||
|
|
|
|
|
|||||
| $ | 1,133,070 | $ | 1,032,205 | |||||
|
|
|
|
|
|||||
F-21
Table of Contents
WEST CORPORATION
NOTES TO CONSOLIDATED FINANCIAL STATEMENTS—(Continued)
YEARS ENDED DECEMBER 31, 2011, 2010 AND 2009
We lease certain land, buildings and equipment under operating leases which expire at varying dates through April 2022. Rent expense on operating leases was approximately $42.5 million, $44.8 million and $53.3 million for the years ended December 31, 2011, 2010 and 2009, respectively, exclusive of related-party lease expense. On all real estate leases, we pay real estate taxes, insurance and maintenance associated with the leased sites. Certain of the leases offer extension options ranging from month-to-month to five years.
Future minimum payments under non-cancelable operating leases with initial or remaining terms of one year or more, in thousands, are as follows:
| Year Ending December 31, |
Non- Related Party Operating Leases |
Related Party Operating Lease |
Total Operating Leases |
|||||||||
| 2012 |
$ | 31,573 | $ | 731 | $ | 32,304 | ||||||
| 2013 |
21,797 | 731 | 22,528 | |||||||||
| 2014 |
16,094 | 487 | 16,581 | |||||||||
| 2015 |
11,448 | — | 11,448 | |||||||||
| 2016 |
7,498 | — | 7,498 | |||||||||
| 2017 and thereafter |
28,592 | — | 28,592 | |||||||||
|
|
|
|
|
|
|
|||||||
| Total minimum obligations |
$ | 117,002 | $ | 1,949 | $ | 118,951 | ||||||
|
|
|
|
|
|
|
|||||||
| 5. | ACCRUED EXPENSES |
Accrued expenses, in thousands, consisted of the following as of:
| December 31, | ||||||||
| 2011 | 2010 | |||||||
| Deferred revenue and customer deposits |
$ | 78,173 | $ | 48,845 | ||||
| Accrued wages |
54,259 | 46,673 | ||||||
| Interest payable |
47,724 | 31,318 | ||||||
| Accrued other taxes (non-income related) |
37,980 | 38,846 | ||||||
| Accrued phone |
27,500 | 25,568 | ||||||
| Income taxes payable |
17,997 | 1,055 | ||||||
| Accrued employee benefit costs |
12,763 | 17,214 | ||||||
| Accrued lease expense |
7,211 | 8,695 | ||||||
| Interest rate hedge position |
5,194 | 26,123 | ||||||
| Accrued settlements |
1,250 | 4,307 | ||||||
| Other current liabilities |
33,385 | 35,344 | ||||||
|
|
|
|
|
|||||
| $ | 323,436 | $ | 283,988 | |||||
|
|
|
|
|
|||||
| 6. | RELATED PARTIES |
Management Services
Affiliates of Thomas H. Lee Partners, L.P. and Quadrangle Group LLC provide management and advisory services pursuant to the management services agreement entered into in connection with the consummation of the recapitalization. The fees for services and expenses were $4.1 million for the year ended December 31, 2011
F-22
Table of Contents
WEST CORPORATION
NOTES TO CONSOLIDATED FINANCIAL STATEMENTS—(Continued)
YEARS ENDED DECEMBER 31, 2011, 2010 AND 2009
and $4.2 million each year for the years ended December 31, 2010 and 2009. On October 2, 2009, the Company filed a Registration Statement on Form S-1 (Registration No. 333-162292) with the Securities Exchange Commission and amendments to the Registration Statement on November 6, 2009, December 1, 2009, December 16, 2009, February 16, 2010, April 14, 2011, August 17, 2011, September 9, 2011 and November 2, 2011. Upon successful completion of the Proposed Offering, the contract for management services with the affiliates of Thomas H. Lee Partners, L.P. and Quadrangle Group LLC would be terminated. The early termination of this agreement will require a payment of an amount equal to the net present value (using a discount rate equal to the then prevailing yield on the U.S. Treasury Securities of like maturity) of the $4.0 million annual management fee that would have been payable under the management services agreement from the date of termination until the seventh anniversary of such termination, such fee to be due and payable at the closing of the offering.
Lease
We lease certain office space owned by a partnership whose partners own approximately 24% of our common stock at December 31, 2011. Related party lease expense was approximately $0.7 million each year for the years ended December 31, 2011, 2010 and 2009. The lease expires in 2014.
| 7. | LONG-TERM OBLIGATIONS |
Long-term obligations, in thousands, consisted of the following as of:
| December 31, | ||||||||
| 2011 | 2010 | |||||||
| Senior Secured Term Loan Facility, due 2013 |
$ | 448,434 | $ | 450,210 | ||||
| Senior Secured Term Loan Facility, due 2016 |
1,467,931 | 1,483,356 | ||||||
| Senior Secured Revolving Credit Facility, due 2012 |
— | — | ||||||
| Senior Secured Revolving Credit Facility, due 2016 |
— | — | ||||||
| 11% Senior Subordinated Notes, due 2016 |
450,000 | 450,000 | ||||||
| 8 5/8% Senior Notes, due 2018 |
500,000 | 500,000 | ||||||
| 7 7/8% Senior Notes, due 2019 |
650,000 | 650,000 | ||||||
|
|
|
|
|
|||||
| 3,516,365 | 3,533,566 | |||||||
|
|
|
|
|
|||||
| Less: current maturities |
(15,425 | ) | (15,425 | ) | ||||
|
|
|
|
|
|||||
| Long-term obligations |
$ | 3,500,940 | $ | 3,518,141 | ||||
|
|
|
|
|
|||||
On October 5, 2010, we issued $500.0 million aggregate principal amount of 8 5/8% Senior Notes due 2018, and used the gross proceeds of the notes issuance to repay $500.0 million of our senior secured term loan facility due 2013.
On November 24, 2010, we issued $650.0 million aggregate principal amount of 7 7/8% Senior Notes due 2019, and used the gross proceeds of the notes issuance to repay $650.0 million of our 9 1/2% Senior Notes due 2014.
Interest expense during 2011, 2010 and 2009 on these long-term obligations was approximately $267.7 million, $252.7 million and $250.8 million, respectively.
F-23
Table of Contents
WEST CORPORATION
NOTES TO CONSOLIDATED FINANCIAL STATEMENTS—(Continued)
YEARS ENDED DECEMBER 31, 2011, 2010 AND 2009
Future maturities of long-term debt, in thousands, were:
| Year Ending December 31, |
Amount | |||
| 2012 |
$ | 15,425 | ||
| 2013 |
$ | 463,859 | ||
| 2014 |
$ | 15,425 | ||
| 2015 |
$ | 15,425 | ||
| 2016 |
$ | 1,856,231 | ||
| Thereafter |
$ | 1,150,000 | ||
Senior Secured Term Loan Facility and Senior Secured Revolving Credit Facility.
The senior secured term loan facility and senior secured revolving credit facility bear interest at variable rates. During 2010, we and certain of our domestic subsidiaries, as borrowers and/or guarantors, Wells Fargo Bank, National Association (“Wells Fargo”), as administrative agent, and the various lenders party thereto modified our senior secured credit facilities by entering into a Restatement Agreement (the “Restatement Agreement”), amending and restating the Credit Agreement, dated as of October 24, 2006, by and among us, Wells Fargo, as successor administrative agent and the various lenders party thereto, as lenders, (as so amended and restated, the “Restated Credit Agreement”).
After giving effect to the prepayment of amortization payments payable in respect of the term loans due 2013, the amended and restated senior secured term loan facility requires annual principal payments of approximately $15.4 million, paid quarterly with balloon payments at maturity dates of October 24, 2013 and July 15, 2016 of approximately $450.2 million and $1,398.5 million, respectively. Pricing of the amended and restated senior secured term loan facility, due 2013, is based on our corporate debt rating and the grid ranges from 2.125% to 2.75% for LIBOR rate loans (LIBOR plus 2.375% at December 31, 2011), and from 1.125% to 1.75% for Base Rate loans (Base Rate plus 1.375% at December 31, 2011). The interest rate margins for the amended and restated senior secured term loans due 2016 are based on our corporate debt rating based on a grid, which ranges from 4.00% to 4.625% for LIBOR rate loans (LIBOR plus 4.25% at December 31, 2011), and from 3.00% to 3.625% for Base Rate loans (Base Rate plus 3.25% at December 31, 2011). The effective annual interest rates, inclusive of debt amortization costs, on the senior secured term loan facility for 2011 and 2010 were 6.22% and 5.21%, respectively.
Our senior secured revolving credit facilities provide senior secured financing of up to $250 million, of which approximately $92 million matures October 2012 (original maturity) and approximately $158 million matures January 2016 (extended maturity). We have also received commitments for approximately $43 million of additional extended maturity senior secured revolving credit facility commitments, which commitments would replace a portion of the original maturity senior secured revolving credit facility.
The original maturity senior secured revolving credit facility pricing is based on our total leverage ratio and the grid ranges from 1.75% to 2.50% for LIBOR rate loans (LIBOR plus 2.0% at December 31, 2011), and the margin ranges from 0.75% to 1.50% for base rate loans (Base Rate plus 1.0% at December 31, 2011). We are required to pay each non-defaulting lender a commitment fee of 0.50% in respect of any unused commitments under the original maturity senior secured revolving credit facility. The commitment fee in respect of unused commitments under the original maturity senior secured revolving credit facility is subject to adjustment based upon our total leverage ratio. The average daily outstanding balance of the original maturity senior secured revolving credit facility during 2011 and 2010 was $1.3 million and $13.1 million, respectively. The highest balance outstanding on the original maturity senior secured revolving credit facility during 2011 and 2010 was $14.7 million and $80.9 million, respectively.
F-24
Table of Contents
WEST CORPORATION
NOTES TO CONSOLIDATED FINANCIAL STATEMENTS—(Continued)
YEARS ENDED DECEMBER 31, 2011, 2010 AND 2009
The extended maturity senior secured revolving credit facility pricing is based on our total leverage ratio and the grid ranges from 2.75% to 3.50% for LIBOR rate loans (LIBOR plus 3.0% at December 31, 2011), and the margin ranges from 1.75% to 2.50% for base rate loans (Base Rate plus 2.0% at December 31, 2011). We are required to pay each non-defaulting lender a commitment fee of 0.50% in respect of any unused commitments under the extended maturity senior secured revolving credit facility. The commitment fee in respect of unused commitments under the extended maturity senior secured revolving credit facility is subject to adjustment based upon our total leverage ratio. The average daily outstanding balance of the extended maturity senior secured revolving credit facility during 2011 was $3.5 million. The highest balance outstanding on the extended maturity senior secured revolving credit facility during 2011 was $35.8 million. Prior to 2011, there had been no borrowings on the extended maturity senior secured revolving credit facility since its inception on October 5, 2010.
The senior secured credit facilities include certain customary representations and warranties, affirmative covenants, and events of default, including payment defaults, breaches of representations and warranties, covenant defaults, cross-defaults to certain indebtedness, certain events of bankruptcy, certain events under the Employee Retirement Income Security Act of 1974, material judgments, the invalidity of material provisions of the documentation with respect to the senior secured credit facilities, the failure of collateral under the security documents for the senior secured credit facilities, the failure of the senior secured credit facilities to be senior debt under the subordination provisions of certain of the Company’s subordinated debt and a change of control of the Company. If an event of default occurs, the lenders under the senior secured credit facilities will be entitled to take certain actions, including the acceleration of all amounts due under the senior secured credit facilities and all actions permitted to be taken by a secured creditor.
Subsequent to December 31, 2011, we may request additional tranches of term loans or increases to the revolving credit facility in an aggregate amount not to exceed $848.6 million, including the aggregate amount of $617.6 million of principal payments previously made in respect of the term loan facility. Availability of such additional tranches of term loans or increases to the revolving credit facility is subject to the absence of any default and pro forma compliance with financial covenants and, among other things, the receipt of commitments by existing or additional financial institutions.
2016 Senior Subordinated Notes
Our $450.0 million aggregate principal amount of 11% senior subordinated notes due 2016 (the “2016 Senior Subordinated Notes”) bear interest that is payable semiannually.
We may redeem the 2016 Senior Subordinated Notes in whole or in part at the redemption prices (expressed as percentages of principal amount of the 2016 Senior Subordinated Notes to be redeemed) set forth below plus accrued and unpaid interest thereon to the applicable date of redemption, subject to the right of holders of 2016 Senior Subordinated Notes of record on the relevant record date to receive interest due on the relevant interest payment date, if redeemed during the twelve-month period beginning on October 15 of each of the years indicated below:
| Year |
Percentage | |||
| 2011 |
105.500 | |||
| 2012 |
103.667 | |||
| 2013 |
101.833 | |||
| 2014 and thereafter |
100.000 | |||
F-25
Table of Contents
WEST CORPORATION
NOTES TO CONSOLIDATED FINANCIAL STATEMENTS—(Continued)
YEARS ENDED DECEMBER 31, 2011, 2010 AND 2009
2018 Senior Notes
On October 5, 2010, we issued $500 million aggregate principal amount of 8 5/8% senior notes that mature on October 1, 2018 (the “2018 Senior Notes”).
At any time prior to October 1, 2014, we may redeem all or a part of the 2018 Senior Notes at a redemption price equal to 100% of the principal amount of 2018 Senior Notes redeemed plus the applicable premium (as defined in the indenture governing the 2018 Senior Notes) and accrued and unpaid interest to the date of redemption, subject to the rights of holders of 2018 Senior Notes on the relevant record date to receive interest due on the relevant interest payment date.
On and after October 1, 2014, we may redeem the 2018 Senior Notes in whole or in part at the redemption prices (expressed as percentages of principal amount of the 2018 Senior Notes to be redeemed) set forth below plus accrued and unpaid interest thereon to the applicable date of redemption, subject to the right of holders of 2018 Senior Notes of record on the relevant record date to receive interest due on the relevant interest payment date, if redeemed during the twelve-month period beginning on October 1 of each of the years indicated below:
| Year |
Percentage | |||
| 2014 |
104.313 | |||
| 2015 |
102.156 | |||
| 2016 and thereafter |
100.000 | |||
At any time (which may be more than once) before October 1, 2013, we can choose to redeem up to 35% of the outstanding notes with money that we raise in one or more equity offerings, as long as: we pay 108.625% of the face amount of the notes, plus accrued and unpaid interest; we redeem the notes within 90 days completing the equity offering; and at least 65% of the aggregate principal amount of the applicable series of notes issued remains outstanding afterwards.
2019 Senior Notes
On November 24, 2010, we issued $650.0 million aggregate principal amount of 7 7/8% senior notes that mature January 15, 2019 (the “2019 Senior Notes”).
At any time prior to November 15, 2014, we may redeem all or a part of the 2019 Senior Notes at a redemption price equal to 100% of the principal amount of 2019 Senior Notes redeemed plus the applicable premium (as defined in the indenture governing the 2019 Senior Notes) and accrued and unpaid interest, to the date of redemption, subject to the rights of holders of 2019 Senior Notes on the relevant record date to receive interest due on the relevant interest payment date.
On and after November 15, 2014, we may redeem the 2019 Senior Notes in whole or in part at the redemption prices (expressed as percentages of principal amount of the 2019 Senior Notes to be redeemed) set forth below plus accrued and unpaid interest thereon, to the applicable date of redemption, subject to the right of holders of 2019 Senior Notes of record on the relevant record date to receive interest due on the relevant interest payment date, if redeemed during the twelve-month period beginning on November 15 of each of the years indicated below:
| Year |
Percentage | |||
| 2014 |
103.938 | |||
| 2015 |
101.969 | |||
| 2016 and thereafter |
100.000 | |||
F-26
Table of Contents
WEST CORPORATION
NOTES TO CONSOLIDATED FINANCIAL STATEMENTS—(Continued)
YEARS ENDED DECEMBER 31, 2011, 2010 AND 2009
At any time (which may be more than once) before November 15, 2013, we can choose to redeem up to 35% of the outstanding notes with money that we raise in one or more equity offerings, as long as: we pay 107.875% of the face amount of the notes, plus accrued and unpaid interest; we redeem the notes within 90 days completing the equity offering; and at least 65% of the aggregate principal amount of the applicable series of notes issued remains outstanding afterwards.
We and our subsidiaries, affiliates or significant shareholders may from time to time, in our or their sole discretion, purchase, repay, redeem or retire any of our outstanding debt or equity securities (including any publicly issued debt or equity securities), in privately negotiated or open market transactions, by tender offer or otherwise.
Amended and Extended Asset Securitization
On September 12, 2011, the revolving trade accounts receivable financing facility between West Receivables LLC, a wholly-owned, bankruptcy-remote direct subsidiary of West Receivables Holdings LLC and Wells Fargo Bank, National Association, was amended and extended. The amended and extended facility provides an additional $25.0 million of available financing for a total of $150.0 million and is extended to September 12, 2014, reduces the unused commitment fee by 25 basis points to 50 basis points and lowers the LIBOR spread on borrowings by 150 basis points to 175 basis points. Under the amended and extended facility, West Receivables Holdings LLC sells or contributes trade accounts receivables to West Receivables LLC, which sells undivided interests in the purchased or contributed accounts receivables for cash to one or more financial institutions. The availability of the funding is subject to the level of eligible receivables after deducting certain concentration limits and reserves. The proceeds of the facility are available for general corporate purposes. West Receivables LLC and West Receivables Holdings LLC are consolidated in our condensed consolidated financial statements included elsewhere in this report. At December 31, 2011 and 2010, the facility was undrawn. The highest balance outstanding during 2011 and 2010 was $84.5 million and $20.0 million, respectively.
The amended and extended asset securitization facility contains various customary affirmative and negative covenants and also contains customary default and termination provisions, which provide for acceleration of amounts owed under the program upon the occurrence of certain specified events, including, but not limited to, failure to pay yield and other amounts due, defaults on certain indebtedness, certain judgments, changes in control, certain events negatively affecting the overall credit quality of collateralized accounts receivable, bankruptcy and insolvency events and failure to meet financial tests requiring maintenance of certain leverage and coverage ratios, similar to those under our senior secured credit facility.
Debt Covenant Compliance
At December 31, 2011, we were in compliance with the covenants associated with all of our credit facilities.
| 8. | HEDGING ACTIVITIES |
Periodically, we have entered into interest rate swaps to hedge the cash flows from our variable rate debt, which effectively converts the hedged portion under our outstanding senior secured term loan facility to fixed rate debt. The initial assessments of hedge effectiveness were performed using regression analysis. The periodic measurements of hedge ineffectiveness are performed using the change in variable cash flows method.
The cash flow hedges are recorded at fair value with a corresponding entry, net of taxes, recorded in other comprehensive income (“OCI”) until earnings are affected by the hedged item. At December 31, 2011, the
F-27
Table of Contents
WEST CORPORATION
NOTES TO CONSOLIDATED FINANCIAL STATEMENTS—(Continued)
YEARS ENDED DECEMBER 31, 2011, 2010 AND 2009
notional amount of debt outstanding under interest rate swap agreements was $1.0 billion. The fixed interest rate on the interest rate swaps ranges from 1.685% to 2.60%. During 2011, three interest rate swaps with a notional value of $600.0 million matured. The interest rate on these three interest rate swaps ranged from 3.38% to 3.532%.
The following table presents, in thousands, the fair value of the Company’s derivatives and consolidated balance sheet location.
| Liability Derivatives |
||||||||||||
| 2011 |
2010 |
|||||||||||
| Balance Sheet Location |
Fair Value | Balance Sheet Location |
Fair Value | |||||||||
| Derivatives designated as hedging instruments: |
||||||||||||
| Interest rate swaps |
Accrued expenses | $ | 5,194 | Accrued expenses | $ | 21,765 | ||||||
| Interest rate swaps |
Other long-term liabilities | 1,911 | Other long-term liabilities | 5,725 | ||||||||
|
|
|
|
|
|||||||||
| 7,105 | 27,490 | |||||||||||
| Derivatives not designated as hedging instruments: |
||||||||||||
| Interest rate swaps |
Accrued expenses | — | Accrued expenses | 4,358 | ||||||||
|
|
|
|
|
|||||||||
| Total derivatives |
$ | 7,105 | $ | 31,848 | ||||||||
|
|
|
|
|
|||||||||
The following presents, in thousands, the impact of interest rate swaps on the consolidated statements of operations for 2011, 2010 and 2009, respectively.
| Derivatives designated as hedging instruments |
Amount of gain (loss) recognized in OCI for the years ended December 31, |
Amount of gain (loss) recognized in net income on hedges (ineffective portion) for the years ended December 31, |
||||||||||||||||||||||
| 2011 | 2010 | 2009 | 2011 | 2010 | 2009 | |||||||||||||||||||
| Interest rate swaps |
$ | 7,260 | $ | (4,602 | ) | $ | 9,373 | $ | 202 | $ | 179 | $ | 1,973 | |||||||||||
|
|
|
|
|
|
|
|
|
|
|
|
|
|||||||||||||
| Location of (gain) loss reclassified from OCI into net |
Amount of (gain) loss reclassified from OCI into net income for the years ended December 31, |
|||||||||||||||||||||||
| 2011 | 2010 | 2009 | ||||||||||||||||||||||
| Interest expense |
$ | 5,188 | $ | — | $ | 2,057 | ||||||||||||||||||
|
|
|
|
|
|
|
|||||||||||||||||||
| 9. | INCOME TAXES |
For financial reporting purposes, income (loss) before income taxes includes the following components:
| Year Ended December 31, | ||||||||||||
| 2011 | 2010 | 2009 | ||||||||||
| Income (loss) before income taxes: |
||||||||||||
| Federal |
$ | 57,339 | $ | (12,202 | ) | $ | 42,298 | |||||
| Foreign |
147,188 | 132,982 | 105,538 | |||||||||
|
|
|
|
|
|
|
|||||||
| $ | 204,527 | $ | 120,780 | $ | 147,836 | |||||||
|
|
|
|
|
|
|
|||||||
F-28
Table of Contents
WEST CORPORATION
NOTES TO CONSOLIDATED FINANCIAL STATEMENTS—(Continued)
YEARS ENDED DECEMBER 31, 2011, 2010 AND 2009
Components of income tax expense, in thousands, were as follows:
| Year Ended December 31, | ||||||||||||
| 2011 | 2010 | 2009 | ||||||||||
| Current income tax expense: |
||||||||||||
| Federal |
$ | 3,456 | $ | 8,174 | $ | 3,389 | ||||||
| State |
5,321 | 3,547 | 4,952 | |||||||||
| Foreign |
44,541 | 27,918 | 20,247 | |||||||||
|
|
|
|
|
|
|
|||||||
| 53,318 | 39,639 | 28,588 | ||||||||||
|
|
|
|
|
|
|
|||||||
| Deferred income tax expense (benefit): |
||||||||||||
| Federal |
26,183 | 14,290 | 6,946 | |||||||||
| State |
2,750 | 1,225 | 595 | |||||||||
| Foreign |
(5,217 | ) | 5,322 | 20,733 | ||||||||
|
|
|
|
|
|
|
|||||||
| 23,716 | 20,837 | 28,274 | ||||||||||
|
|
|
|
|
|
|
|||||||
| Total income tax expense |
$ | 77,034 | $ | 60,476 | $ | 56,862 | ||||||
|
|
|
|
|
|
|
|||||||
A reconciliation of income tax expense computed at statutory tax rates compared to effective income tax rates was as follows:
| Year Ended December 31, | ||||||||||||
| 2011 | 2010 | 2009 | ||||||||||
| Statutory rate |
35.0 | % | 35.0 | % | 35.0 | % | ||||||
| Goodwill impairment |
0.0 | % | 11.2 | % | 0.0 | % | ||||||
| Change in valuation allowance |
-2.6 | % | 0.0 | % | 0.0 | % | ||||||
| Share based compensation |
1.9 | % | 0.0 | % | 0.0 | % | ||||||
| State income taxes, net of Federal benefit |
1.6 | % | 2.1 | % | 2.4 | % | ||||||
| Federal tax credits |
-1.0 | % | -1.6 | % | -1.5 | % | ||||||
| Uncertain tax positions |
-0.6 | % | 1.3 | % | 0.8 | % | ||||||
| Foreign items |
3.6 | % | 1.2 | % | 1.4 | % | ||||||
| Non-deductible meals |
0.2 | % | 0.4 | % | 0.3 | % | ||||||
| Noncontrolling interest in net income |
0.0 | % | 0.0 | % | -0.7 | % | ||||||
| Other |
-0.4 | % | 0.5 | % | 0.7 | % | ||||||
|
|
|
|
|
|
|
|||||||
| 37.7 | % | 50.1 | % | 38.4 | % | |||||||
|
|
|
|
|
|
|
|||||||
F-29
Table of Contents
WEST CORPORATION
NOTES TO CONSOLIDATED FINANCIAL STATEMENTS—(Continued)
YEARS ENDED DECEMBER 31, 2011, 2010 AND 2009
Significant temporary differences between reported financial and taxable earnings that give rise to deferred tax assets and liabilities, in thousands, were as follows:
| Year Ended December 31, | ||||||||
| 2011 | 2010 | |||||||
| Deferred income tax assets: |
||||||||
| Net operating loss carryforwards |
$ | 136,159 | $ | 139,756 | ||||
| Accrued expenses |
16,292 | 21,149 | ||||||
| Tax credits |
13,022 | 15,510 | ||||||
| Benefit plans |
22,248 | 14,662 | ||||||
| Interest rate hedge activities |
2,934 | 10,564 | ||||||
| Reserves not currently deductible for tax purposes |
9,700 | 4,682 | ||||||
| Allowance for doubtful accounts |
2,937 | 2,453 | ||||||
| Foreign currency translation |
3,373 | 8,065 | ||||||
| Other |
3,253 | 4,737 | ||||||
|
|
|
|
|
|||||
| Gross deferred income tax assets |
209,918 | 221,578 | ||||||
|
|
|
|
|
|||||
| Less valuation allowance |
(114,686 | ) | (119,684 | ) | ||||
|
|
|
|
|
|||||
| Total deferred income tax assets |
$ | 95,232 | $ | 101,894 | ||||
|
|
|
|
|
|||||
| Deferred tax liabilities: |
||||||||
| Acquired intangibles amortization |
$ | 142,235 | $ | 120,020 | ||||
| Excess tax depreciation over financial depreciation |
32,135 | 25,212 | ||||||
| International earnings |
27,097 | 15,603 | ||||||
| Prepaid expenses |
5,218 | 4,972 | ||||||
|
|
|
|
|
|||||
| Total deferred tax liabilities |
206,685 | 165,807 | ||||||
|
|
|
|
|
|||||
| Net deferred tax liability |
$ | 111,453 | $ | 63,913 | ||||
|
|
|
|
|
|||||
| Deferred tax assets / liabilities included in the balance sheet are: |
||||||||
| Deferred income tax asset—current |
$ | 10,068 | $ | 29,968 | ||||
| Deferred income tax liability—long-term |
121,521 | 93,881 | ||||||
|
|
|
|
|
|||||
| Net deferred income taxes |
$ | 111,453 | $ | 63,913 | ||||
|
|
|
|
|
|||||
At December 31, 2011, we had federal and foreign net operating loss (“NOL”) carryforwards in the amount of $350.1 million which resulted in a net deferred tax asset of $32.6 million available to reduce future taxes. The NOL carryforwards are all attributable to acquired companies. We also have foreign tax credit carry forwards of $1.9 million that can be offset against foreign income tax in future years. The foreign tax credits can be carried forward for twenty years from the date of origin. The deferred tax assets at December 31, 2011, that are associated with NOLs and tax credit carryforwards, in the significant tax jurisdictions, not reduced by valuation allowances expire in periods starting 2012 through 2031. In connection with the Smoothstone and Unisfair acquisitions, we assumed U.S. NOLs of approximately $13.9 million and approximately $19.8 million of Israel NOLs, respectively. The Smoothstone NOLs are subject to limitations under Internal Revenue Code Section 382, however, we believe it is more likely than not that these NOLs will be utilized to offset future taxable income. The Unisfair NOLs are limited under the applicable Israel tax rules, and we do not believe the utilization of these NOLs is more likely than not. The valuation allowances, which reduce deferred tax assets to an amount that will more likely than not be realized, were $114.7 million at December 31, 2011 and $119.7 million at December 31, 2010. Our valuation allowance decreased by $5.0 million in 2011 as a result of the following: releasing valuation allowances related to the utilization of NOLs during the year that had full valuation allowances, new information
F-30
Table of Contents
WEST CORPORATION
NOTES TO CONSOLIDATED FINANCIAL STATEMENTS—(Continued)
YEARS ENDED DECEMBER 31, 2011, 2010 AND 2009
on acquired NOLs and planning related to the utilization of future NOLs. Also included in the net long-term deferred tax liability are offsetting amounts, $15.6 million, relating to cancellation of indebtedness (income) and original issue discount (interest expense) related to the Fifth Amendment of the Credit Agreement entered into on August 28, 2009 and the Amendment and Restatement entered into on October 5, 2010.
In 2011, 2010, and 2009, income tax benefits attributable to employee stock option transactions of $1.4 million, $1.6 million and $1.7 million, respectively were allocated to shareholders’ equity.
In preparing our tax returns, we are required to interpret complex tax laws and regulations. On an ongoing basis, we are subject to examinations by federal and state tax authorities that may give rise to different interpretations of these complex laws and regulations. The number of tax years that remain open and subject to tax audits varies depending upon the tax jurisdiction. Our most significant taxing jurisdictions include the U.S., United Kingdom and France. The French Tax Authorities are auditing 2008, 2009 and 2010. Due to the nature of the examination process, it generally takes years before these examinations are completed and matters are resolved. At December 31, 2011, we believe the aggregate amount of any additional tax liabilities that may result from examinations, if any, will not have a material adverse effect on our financial condition, results of operations or cash flows.
The following summarizes the activity related to our unrecognized tax benefits recorded in accordance with ASC 740-10 in 2011, 2010 and 2009, in thousands:
| Balance at January 1, 2009 |
$ | 15,398 | ||
| Increases for positions taken in current year |
1,128 | |||
| Increases for positions taken in prior years |
1,847 | |||
| Decreases for positions taken in prior years |
— | |||
| Decrease due to settlements with taxing authorities |
(433 | ) | ||
| Expiration of the statute of limitations for the assessment of taxes |
— | |||
|
|
|
|||
| Balance at December 31, 2009 |
17,940 | |||
| Increases for positions taken in current year |
4,283 | |||
| Decreases for positions taken in prior years |
— | |||
| Decrease due to settlements with taxing authorities |
(539 | ) | ||
| Expiration of the statute of limitations for the assessment of taxes |
(2,248 | ) | ||
|
|
|
|||
| Balance at December 31, 2010 |
19,436 | |||
| Increases for positions taken in current year |
3,680 | |||
| Decreases for positions taken in prior years |
(3,817 | ) | ||
| Decrease due to settlements with taxing authorities |
(2,309 | ) | ||
|
|
|
|||
| Balance at December 31, 2011 |
$ | 16,990 | ||
|
|
|
The unrecognized tax benefits at December 31, 2011 included $11.1 million of tax benefits that, if recognized, would affect our effective tax rate. We recognize interest related to unrecognized tax benefits and penalties as income tax expense. During 2011, 2010 and 2009, we reduced the accrued interest by approximately $0.4 million, and during 2010 and 2009 we increased the interest accrual by $0.1 million and $1.0 million, respectively. During 2011, we reduced the accrual of penalties related to uncertain tax positions by approximately $0.5 million, and during 2010 and 2009 we increased the penalty accrual by approximately $0.0 million and $0.2 million, respectively. At December 31, 2011 and 2010, the aggregate recorded liability for interest and potential penalties was $6.2 million and $7.0 million, respectively. We do not expect our unrecognized tax benefits to change significantly over the next twelve months.
F-31
Table of Contents
WEST CORPORATION
NOTES TO CONSOLIDATED FINANCIAL STATEMENTS—(Continued)
YEARS ENDED DECEMBER 31, 2011, 2010 AND 2009
We have historically determined that the undistributed earnings of our foreign subsidiaries will be repatriated to the United States and accordingly, we have provided a deferred tax liability totaling $27.1 million and $15.6 million at December 31, 2011 and 2010, respectively, on such foreign source income. For the years ended December 31, 2011 and December 31, 2010, we have evaluated our liquidity requirements in the United States and the capital requirements of our foreign subsidiaries and accrued U.S. taxes on $145.4 million and $97.8 million of unremitted foreign earnings and profits. We have determined we currently have foreign earnings of approximately $187.0 million at December 31, 2011, which will be indefinitely reinvested, and therefore deferred income taxes of approximately $31.8 million have not been provided on such foreign subsidiary earnings.
| 10. | FAIR VALUE DISCLOSURES |
Accounting Standards Codification 820 Fair Value Measurements and Disclosures (“ASC 820”) defines fair value, establishes a framework for measuring fair value, and expands disclosures about fair value measurements. The provisions of ASC 820 apply to other accounting pronouncements that require or permit fair value measurements. ASC 820:
| • | Defines fair value as the exchange price that would be received for an asset or paid to transfer a liability (an exit price) in the principal or most advantageous market for the asset or liability in an orderly transaction between market participants at the measurement date; and |
| • | Establishes a three-level hierarchy for fair value measurements based upon the transparency of inputs to the valuation of an asset or liability as of the measurement date. |
Inputs refer broadly to the assumptions that market participants would use in pricing the asset or liability, including assumptions about risk. To increase consistency and comparability in fair value measurements and related disclosures, the fair value hierarchy prioritizes the inputs to valuation techniques used to measure fair value into three broad levels. The three levels of the hierarchy are defined as follows:
| • | Level 1 inputs are quoted prices (unadjusted) in active markets for identical assets or liabilities. |
| • | Level 2 inputs are inputs other than quoted prices included within Level 1 that are observable for the asset or liability, either directly or indirectly for substantially the full term of the financial instrument. |
| • | Level 3 inputs are unobservable inputs for assets or liabilities. |
The categorization within the valuation hierarchy is based upon the lowest level of input that is significant to the fair value measurement. Following is a description of the valuation methodologies used for assets and liabilities measured at fair value.
Trading Securities (Asset). The assets held in the West Corporation Executive Retirement Savings Plan and the West Corporation Non-qualified Deferred Compensation Plan represent mutual funds, invested in debt and equity securities, classified as trading securities in accordance with ASC 320 considering the employee’s ability to change the investment allocation of their deferred compensation at any time. Quoted market prices are available for these securities in an active market, therefore, the fair value of these securities is determined by Level 1 inputs.
Interest rate swaps. The effect of the interest rate swaps is to change a variable rate debt obligation to a fixed rate for that portion of the debt that is hedged. We record the interest rate swaps at fair value. The fair value of the interest rate swaps is based on a model whose inputs are observable (LIBOR swap rates); therefore, the fair value of these interest rate swaps is based on a Level 2 input.
F-32
Table of Contents
WEST CORPORATION
NOTES TO CONSOLIDATED FINANCIAL STATEMENTS—(Continued)
YEARS ENDED DECEMBER 31, 2011, 2010 AND 2009
Assets and liabilities measured at fair value on a recurring basis, in thousands, are summarized below:
| Fair Value Measurement at December 31, 2011 Using: | ||||||||||||||||||||
| Description |
Carrying Amount |
Quoted Prices in Active Markets for Identical Assets (Level 1) |
Significant Other Observable Inputs (Level 2) |
Significant Unobservable Inputs (Level 3) |
Assets / Liabilities at Fair Value |
|||||||||||||||
| Assets |
||||||||||||||||||||
| Trading securities |
$ | 29,535 | $ | 29,535 | $ | — | $ | — | $ | 29,535 | ||||||||||
|
|
|
|
|
|
|
|
|
|
|
|||||||||||
| Liabilities |
||||||||||||||||||||
| Interest rate swaps |
$ | 7,105 | $ | — | $ | 7,105 | $ | — | $ | 7,105 | ||||||||||
|
|
|
|
|
|
|
|
|
|
|
|||||||||||
| Fair Value Measurement at December 31, 2010 Using: | ||||||||||||||||||||
| Description |
Carrying Amount |
Quoted Prices in Active Markets for Identical Assets (Level 1) |
Significant Other Observable Inputs (Level 2) |
Significant Unobservable Inputs (Level 3) |
Assets / Liabilities at Fair Value |
|||||||||||||||
| Assets |
||||||||||||||||||||
| Trading securities |
$ | 26,834 | $ | 26,834 | $ | — | $ | — | $ | 26,834 | ||||||||||
|
|
|
|
|
|
|
|
|
|
|
|||||||||||
| Liabilities |
||||||||||||||||||||
| Interest rate swaps |
$ | 31,848 | $ | — | $ | 31,848 | $ | — | $ | 31,848 | ||||||||||
|
|
|
|
|
|
|
|
|
|
|
|||||||||||
The fair value of our senior secured term loan facility, 11% senior subordinated notes, 8 5/8% senior notes and 7 7/8% senior notes based on market quotes at December 31, 2011 was approximately $3,529.0 million compared to the carrying amount of $3,516.4 million. The fair value of our senior secured term loan facility, 11% senior subordinated notes, 8 5/8% senior notes and 7 7/8% senior notes based on market quotes at December 31, 2010 was approximately $3,604.6 million compared to the carrying amount of $3,533.6 million.
Certain assets are measured at fair value on a non-recurring basis using significant unobservable inputs (Level 3) as defined by and in accordance with the provisions of ASC Topic 820. As such, working capital, property and equipment, goodwill, and other finite-lived intangible assets for our West Direct reporting unit with a net carrying amount totaling $44.2 million were written down to their fair value of $6.5 million during 2010. These write-downs resulted in a total impairment charge, recorded in SG&A of $37.7 million, which represented the balance of goodwill for the reporting unit. The fair value was determined using a discounted cash flows methodology.
| 11. | OFF—BALANCE SHEET ARRANGEMENTS |
We utilize standby letters of credit to support primarily workers’ compensation policy requirements and certain operating leases. Performance obligations of certain operating subsidiaries are supported by performance bonds and letters of credit. These obligations will expire at various dates through February 2013 and are renewed as required. The outstanding commitments on these obligations at December 31, 2011 and 2010 were $20.0 million and $23.3 million, respectively.
F-33
Table of Contents
WEST CORPORATION
NOTES TO CONSOLIDATED FINANCIAL STATEMENTS—(Continued)
YEARS ENDED DECEMBER 31, 2011, 2010 AND 2009
| 12. | EMPLOYEE BENEFITS AND INCENTIVE PLANS |
Qualified Retirement Plan
We have a 401(k) plan, which covers substantially all employees eighteen years of age or older who will also complete a minimum of 1,000 hours of service in each calendar year. Under the plan, we match 50% of employees’ contributions up to 14% of their gross salary or the statutory limit, whichever is less, if the employee satisfies the 1,000 hours of service requirement during the calendar year. Our matching contributions vest 25% per year beginning after the second service anniversary date. The matching contributions are 100% vested after the employee has attained five years of service. Total employer contributions under the plan were approximately $8.3 million, $7.5 million and $7.5 million for the years ended December 31, 2011, 2010 and 2009, respectively.
In the United Kingdom we have a Group Personal Pension Plan which is available to all employees upon the successful completion of their 3 month probationary period. Under the plan, we match employee contributions up to a maximum of 3% of their base salary. Contributions are invested immediately in the members own fund choice or the default investment option should members not wish to make their own investment choices. Total employer contributions under the plan were approximately $1.0 million, $0.9 million, and $0.5 million for the years ended December 31, 2011, 2010 and 2009, respectively.
In Canada we have a Deferred Profit Sharing Plan (“DPSP”) and a Group RRSP, which covers substantially all employees who have materially and significantly contributed to the prosperity and profits of the Company. Under the plan, we match 50% of employees’ regular contributions to the Group RRSP up to 3% of their earnings or the statutory limit, whichever is less. Our matching contributions vest 100% on the second anniversary of membership in the DPSP. Total employer contributions under the plan were approximately $0.3 million, $0.2 million and $0.2 million for the years ended December 31, 2011, 2010 and 2009, respectively.
Non-Qualified Retirement Plans
We maintain a grantor trust under the West Corporation Executive Retirement Savings Plan (“Trust”). The principal of the Trust, and any earnings thereon shall be held separate and apart from our other funds. Participation in the Trust is voluntary and is restricted to highly compensated individuals as defined by the Internal Revenue Service. We will match 50% of employee contributions, subject to the combined limits of the 401(k) plan and the Trust. Matching contributions 100% vest after completion of three years of service. Our total contributions under the plan for the years ended December 31, 2011, 2010 and 2009 were approximately $2.0 million each year. Assets under the Trust at December 31, 2011 and 2010 were $28.3 million and $25.3 million, respectively.
We also maintain a Nonqualified Deferred Compensation Plan (as amended from time to time, the “Deferred Compensation Plan”). Pursuant to the terms of the Deferred Compensation Plan, eligible management, non-employee directors or highly compensated employees approved by the board of directors may elect to defer a portion of their compensation and have such deferred compensation invested in the same investments made available to participants of the 401(k) plan or in notional equity shares. We match a percentage of any amounts invested in notional equity shares (50% during 2011, 2010 and 2009). Such matched amounts are subject to 20% vesting each year. All matching contributions are 100% vested five years after the later of January 1, 2007 or the date the executive first participates in the Deferred Compensation Plan. Amounts deferred under the Deferred Compensation Plan and any earnings credited thereunder shall be held separate and apart from our other funds, but remain subject to claims by the Company’s general creditors. Our total contributions for the years ended
F-34
Table of Contents
WEST CORPORATION
NOTES TO CONSOLIDATED FINANCIAL STATEMENTS—(Continued)
YEARS ENDED DECEMBER 31, 2011, 2010 AND 2009
December 31, 2011, 2010 and 2009 under the plan were approximately $2.0 million, $1.2 million and $2.2 million, respectively. Assets under the Deferred Compensation Plan at December 31, 2011 and 2010 were $43.8 million and $41.0 million, respectively.
2006 Executive Incentive Plan
On December 30, 2011, our Board of Directors approved amendments to certain of our compensation plans. The Board of Directors approved an amendment to the Company’s 2006 Executive Incentive Plan which amendment increased the maximum number of shares of common stock of the Company, par value $0.001 per share (“Common Stock”) that may be issued pursuant to or subject to outstanding awards under the 2006 EIP from 11,276,291 to 38,435,427. Such increased pool is in addition to shares issuable upon exercise of rollover options. The Board of Directors also took action in accordance with the terms of the 2006 EIP to adjust the number and kind of shares of stock or securities subject to awards outstanding under the 2006 EIP to give effect to the Conversion and the Reclassification.
Awards under the EIP are intended to align the incentives of the Company’s executives and investors and to improve the performance of the Company. The administrator will select participants from among those key employees and directors of and consultants and advisors to, the Company or its affiliates who, in the opinion of the administrator, are in a position to make a significant contribution to the success of the Company and its affiliates.
In general, stock options granted under the EIP become exercisable over a period of five years, with 20% of the stock option becoming exercisable at the end of each year. Once an option has vested, it generally remains exercisable until the tenth anniversary of the date of grant. In the case of a normal termination, the awards will remain exercisable for the shorter of (i) the one-year period ending with the first anniversary of the participant’s normal termination or (ii) the period ending on the latest date on which such award could have been exercised.
Stock option activity under the 2006 EIP for the years ended December 31, 2011, 2010 and 2009 is set forth below:
| Options Outstanding | ||||||||||||
| Options Available for Grant |
Number of Shares |
Weighted Average Exercise Price |
||||||||||
| Balance at January 1, 2009 |
504,847 | 2,523,500 | $ | 2.26 | ||||||||
| Granted |
(292,500 | ) | 292,500 | 3.61 | ||||||||
| Canceled |
242,000 | (242,000 | ) | 2.36 | ||||||||
| Exercised |
— | (72,500 | ) | 1.64 | ||||||||
|
|
|
|
|
|
|
|||||||
| Balance at December 31, 2009 |
454,347 | 2,501,500 | 2.42 | |||||||||
| Granted |
(235,000 | ) | 235,000 | 9.04 | ||||||||
| Canceled |
114,100 | (114,100 | ) | 3.22 | ||||||||
| Exercised |
— | (78,400 | ) | 2.00 | ||||||||
|
|
|
|
|
|
|
|||||||
| Balance at December 31, 2010 |
333,447 | 2,544,000 | 3.00 | |||||||||
| Granted |
(160,000 | ) | 160,000 | 10.60 | ||||||||
| Canceled |
101,500 | (101,500 | ) | 6.37 | ||||||||
| Exercised |
— | (78,000 | ) | 2.05 | ||||||||
| December, 2011 amendment to the Plan |
27,159,136 | — | — | |||||||||
|
|
|
|
|
|
|
|||||||
| Balance at December 31, 2011 |
27,434,083 | 2,524,500 | $ | 3.38 | ||||||||
|
|
|
|
|
|
|
|||||||
F-35
Table of Contents
WEST CORPORATION
NOTES TO CONSOLIDATED FINANCIAL STATEMENTS—(Continued)
YEARS ENDED DECEMBER 31, 2011, 2010 AND 2009
At December 31, 2011, we expect that 72% of options granted will vest over the vesting period.
At December 31, 2011, the intrinsic value of vested options was approximately $2.0 million.
The following table summarizes the information on the options granted under the EIP at December 31, 2011:
| Outstanding | Exercisable | |||||||||||||||||||||
| Range of |
Number of |
Average |
Weighted |
Number of |
Weighted |
|||||||||||||||||
| $1.64 | 1,710,500 | 4.94 | $1.64 | 1,687,500 | $1.64 | |||||||||||||||||
| $3.61 | 220,000 | 7.00 | $3.61 | 132,000 | $3.61 | |||||||||||||||||
| $6.36 | 249,000 | 6.08 | $6.36 | 153,000 | $6.36 | |||||||||||||||||
| $9.04 | 205,000 | 8.33 | $9.04 | 41,000 | $9.04 | |||||||||||||||||
| $10.60 | 140,000 | 9.08 | $10.60 | — | — | |||||||||||||||||
|
|
|
|
|
|
|
|
|
|
|
|
|
|||||||||||
| $ | 1.64 - $10.60 | 2,524,500 | 5.74 | $3.38 | 2,013,500 | $2.28 | ||||||||||||||||
|
|
|
|
|
|
|
|
|
|
|
|
|
|||||||||||
| Executive Management Rollover Options |
||||||||||||
| Class A and Class L Equity Strip Options | Options Available for Grant |
Options Outstanding | ||||||||||
| Number of Shares |
Weighted Average Exercise Price |
|||||||||||
| Balance at January 1, 2009 |
17 | 357,974 | $ | 33.48 | ||||||||
| Canceled |
— | — | — | |||||||||
| Exercised |
— | (62,520 | ) | 33.66 | ||||||||
|
|
|
|
|
|
|
|||||||
| Balance at December 31, 2009 |
17 | 295,454 | 33.33 | |||||||||
| Canceled |
— | — | — | |||||||||
| Exercised |
— | (8,128 | ) | 33.00 | ||||||||
|
|
|
|
|
|
|
|||||||
| Balance at December 31, 2010 |
17 | 287,326 | 33.34 | |||||||||
| Canceled |
— | — | — | |||||||||
| Exercised |
— | (18,975 | ) | 32.08 | ||||||||
|
|
|
|
|
|
|
|||||||
| Conversion and reclassification |
804 | 12,690,319 | (32.7377 | ) | ||||||||
|
|
|
|
|
|
|
|||||||
| Balance at December 31, 2011 |
821 | 12,958,670 | $ | 0.6923 | ||||||||
|
|
|
|
|
|
|
|||||||
Prior to the conversion, an Equity Strip was comprised of eight options of Class A common stock and one option of Class L common stock. The rollover options are fully vested.
F-36
Table of Contents
WEST CORPORATION
NOTES TO CONSOLIDATED FINANCIAL STATEMENTS—(Continued)
YEARS ENDED DECEMBER 31, 2011, 2010 AND 2009
The following table summarizes the outstanding and exercisable information on management rollover options granted under the EIP at December 31, 2011:
| Outstanding and Exercisable | ||||||||||||||
| Range
of Exercise Prices |
Number of Options |
Average Remaining Contractual Life (years) |
Weighted Average Exercise Price |
|||||||||||
| $ | 0.5846 | 147,115 | 0.8 | $ | 0.5846 | |||||||||
| $ | 0.6834 | 11,246,669 | 0.9 | $ | 0.6834 | |||||||||
| $ | 0.7043 | 425,918 | 1.0 | $ | 0.7043 | |||||||||
| $ | 0.7900 | 1,138,968 | 0.9 | $ | 0.7900 | |||||||||
|
|
|
|
|
|
|
|
|
|||||||
| $ | 0.5846 - $0.79 | 12,958,670 | 0.9 | $ | 0.6923 | |||||||||
|
|
|
|
|
|
|
|
|
|||||||
The aggregate intrinsic value of these options at December 31, 2011 was approximately $45.3 million.
We account for the stock option grants under the EIP in accordance with Accounting Standards Codification 718 Compensation-Stock Compensation (“ASC 718”). The fair value of option awards granted under the EIP during 2011 and 2010 were $3.92 and $4.09 per option, respectively. We have estimated the fair value of EIP option awards on the grant date using a Black-Scholes option pricing model that uses the assumptions noted in the following table.
| 2011 | 2010 | |||||||
| Risk-free interest rate |
1.87 | % | 3.11 | % | ||||
| Dividend yield |
0.0 | % | 0.0 | % | ||||
| Expected volatility |
33.2 | % | 40.0 | % | ||||
| Expected life (years) |
6.5 | 6.5 | ||||||
At December 31, 2011 and 2010, there was approximately $1.0 million and $1.3 million of unrecorded and unrecognized compensation cost related to unvested stock options under the EIP, respectively.
Restricted Stock
The Company is party to Restricted Stock Award and Special Bonus Agreements and Restricted Stock Award Agreements (collectively, “Restricted Stock Agreements”) with certain officers and employees of the Company, which Restricted Stock Agreements provide for the issuance of shares of Common Stock that are subject to time or performance vesting. On December 30, 2011, the Board of Directors approved the amendment of the Restricted Stock Agreements with each of the current employees party to a Restricted Stock Agreement with the Company in accordance with the terms of the 2006 EIP to provide for immediate vesting of all shares awarded thereunder outstanding for more than five years, such vesting to become effective as of the Conversion. For shares outstanding for less than five years, the board of directors approved the amendment to the Restricted Stock Agreement to provide for vesting of all such awards upon the earlier of the five year anniversary of grant and a change of control of the Company. The amendments to the Restricted Stock Agreements provided for the acceleration of an aggregate of 4,371,864 shares of Common Stock. Previously, Tranches 2 and 3 of these awards vested only upon meeting certain performance criteria and therefore share based compensation had not been recognized. The amendments to the Restricted Stock Agreements resulted in the recognition of $18.5 million of share based compensation in selling general and administrative expense for the fair value of the vested Tranche 2 and 3 shares which had been outstanding for more than five years for the year ended December 31, 2011.
F-37
Table of Contents
WEST CORPORATION
NOTES TO CONSOLIDATED FINANCIAL STATEMENTS—(Continued)
YEARS ENDED DECEMBER 31, 2011, 2010 AND 2009
Prior to the December 30, 2011 amendment of the Restricted Stock Agreements, grants of restricted stock under the EIP were in three Tranches; 33.33% of the shares in Tranche 1, 22.22% of the shares in Tranche 2 and 44.45% of the shares in Tranche 3. Restricted stock acquired under the EIP will vest during the grantee’s employment by the Company or its subsidiaries in accordance with the provisions of the EIP, as follows: The Tranche 1 shares will vest over a period of five years, with 20% of the shares becoming vested at the end of each year. Notwithstanding the above, 100% of a grantee’s outstanding and unvested Tranche 1 shares shall vest immediately upon a change of control. The vesting schedule for Tranche 2 and Tranche 3 shares previously were subject to the Total Return of the Sponsors and the Sponsor internal rate of return as of an exit event, subject to certain terms and conditions.
Restricted Stock activity under the EIP for 2011, 2010 and 2009 are set forth below:
| Restricted
Stock Outstanding |
||||||||||||
| Restricted Stock Available for Grant |
Number of Shares |
Weighted Average Grant Date Fair Value |
||||||||||
| Balance at January 1, 2009 |
177,583 | 8,015,010 | $ | 1.50 | ||||||||
| Granted |
(425,000 | ) | 425,000 | 8.72 | ||||||||
| Canceled |
333,350 | (333,350 | ) | 1.43 | ||||||||
|
|
|
|
|
|
|
|||||||
| Balance at December 31, 2009 |
85,933 | 8,106,660 | 1.88 | |||||||||
| Granted |
(2,500 | ) | 2,500 | 9.04 | ||||||||
| Canceled |
146,670 | (146,670 | ) | 3.00 | ||||||||
| Purchased as treasury shares |
— | (28,330 | ) | 2.01 | ||||||||
|
|
|
|
|
|
|
|||||||
| Balance at December 31, 2010 |
230,103 | 7,934,160 | 1.85 | |||||||||
| Granted |
— | — | — | |||||||||
| Purchased as treasury shares |
(8,770 | ) | 1.43 | |||||||||
|
|
|
|
|
|
|
|||||||
| Balance at December 31, 2011 |
230,103 | 7,925,390 | $ | 1.85 | ||||||||
|
|
|
|
|
|
|
|||||||
The following table summarizes the information on the restricted stock granted under the EIP at December 31, 2011:
| Outstanding |
Vested | |||||||||||||||||||
| Range of Grant Prices |
Number of |
Average |
Weighted |
Number of |
Weighted |
|||||||||||||||
| $ 1.43 |
7,427,890 | 4.92 | $ | 1.43 | 7,134,546 | $ | 1.43 | |||||||||||||
| $ 3.61 |
25,000 | 7.00 | $ | 3.61 | 3,333 | $ | 3.61 | |||||||||||||
| $ 6.36 |
70,000 | 6.08 | $ | 6.36 | 13,999 | $ | 6.36 | |||||||||||||
| $ 9.04 |
402,500 | 8.00 | $ | 9.04 | 53,495 | $ | 9.04 | |||||||||||||
|
|
|
|
|
|
|
|
|
|
|
|
||||||||||
| $1.43 - $9.04 |
7,925,390 | 5.09 | $ | 1.85 | 7,205,373 | $ | 1.85 | |||||||||||||
|
|
|
|
|
|
|
|
|
|
|
|
||||||||||
We account for the restricted stock in accordance with ASC 718. Share based compensation for 2011, 2010 and 2009 for the EIP restricted stock grants was approximately $19.9 million, $1.5 million and $1.1 million, respectively. No restricted stock was granted in 2011. The weighted average fair value of the restricted stock
F-38
Table of Contents
WEST CORPORATION
NOTES TO CONSOLIDATED FINANCIAL STATEMENTS—(Continued)
YEARS ENDED DECEMBER 31, 2011, 2010 AND 2009
granted under the EIP in 2010 was $9.04. We have estimated the fair value of EIP restricted stock grants on the grant date using a Black-Scholes option pricing model that uses the same assumptions noted above for the EIP option awards.
At December 31, 2011 and 2010, there was approximately $0.8 million and $2.2 million of unrecorded and unrecognized compensation cost related to Tranche 1 unvested restricted stock under the EIP, respectively. At December 31, 2011, there was approximately $2.3 million of unrecorded and unrecognized compensation cost related to Tranches 2 and 3 unvested restricted stock under the EIP.
The components of stock-based compensation expense in thousands are presented below:
| Year Ended December 31, | ||||||||||||
| 2011 | 2010 | 2009 | ||||||||||
| Stock options |
$ | 693 | $ | 609 | $ | 587 | ||||||
| Restricted stock |
19,857 | 1,489 | 1,114 | |||||||||
| Deferred compensation—notional shares |
2,791 | 2,135 | 2,139 | |||||||||
|
|
|
|
|
|
|
|||||||
| $ | 23,341 | $ | 4,233 | $ | 3,840 | |||||||
|
|
|
|
|
|
|
|||||||
The net income effect of stock-based compensation expense for 2011, 2010 and 2009 was approximately $19.0 million, $2.6 million and $2.4 million, respectively.
| 13. | EARNINGS PER SHARE |
On October 2, 2009, the Company announced its intention to commence an equity offering and accordingly is providing the following information related to earnings per share.
On December 30, 2011, we completed the conversion of our outstanding Class L Common Stock into shares of Class A Common Stock and thereafter the reclassification of all of our Class A Common Stock as a single class of Common Stock. As a result, earnings per share calculations in future periods will be presented as a single class of Common Stock.
Through December 30, 2011, we had two classes of common stock (Class L stock and Class A stock) outstanding. Each Class L share was entitled to a priority return preference equal to the sum of (x) $90 per share base amount plus (y) an amount sufficient to generate a 12% internal rate of return on that base amount from the date of the recapitalization until the priority return preference was paid in full or converted to Class A shares. Each Class L share also participated in any equity appreciation beyond the priority return on the same per share basis as the Class A shares. Class A shares participated in the equity appreciation after the Class L priority return was satisfied.
The Class L stock was considered a participating stock security requiring use of the “two-class” method for the computation of basic net income (loss) per share in accordance with ASC 260 Earnings Per Share. Losses were not allocated to the Class L stock in the computation of basic earnings per share as the Class L stock was not obligated to share in losses.
Basic earnings per share (“EPS”) excludes the effect of common stock equivalents and is computed using the “two-class” computation method, which divides earnings attributable to the Class L preference from total earnings. Any remaining income or loss is attributed to the common shares. Diluted earnings per share reflects
F-39
Table of Contents
WEST CORPORATION
NOTES TO CONSOLIDATED FINANCIAL STATEMENTS—(Continued)
YEARS ENDED DECEMBER 31, 2011, 2010 AND 2009
the potential dilution that could result if options or other contingently issuable shares were exercised or converted into common stock and notional shares from the Deferred Compensation Plan were granted. Diluted earnings per common share assumes the exercise of stock options using the treasury stock method.
| Year Ended December 31, | ||||||||||||
| (Amount in thousands) |
2011 | 2010 | 2009 | |||||||||
| Net income—West Corporation |
$ | 127,493 | $ | 60,304 | $ | 88,229 | ||||||
| Less: accretion of Class L Shares |
171,567 | 170,265 | 173,657 | |||||||||
| Net loss attributable to common stock |
(44,074 | ) | (109,961 | ) | (85,428 | ) | ||||||
| Income attributable to Class L Shares (1) |
171,567 | 170,265 | 173,657 | |||||||||
| (1) | Prior to the Conversion, the Class L shareholders were allocated their priority return which is equivalent to the accretion, while any losses were allocated to common shareholders as the Class L shareholders did not have a contractual obligation to share in losses. |
| Year Ended December 31, | ||||||||||||
| (Amounts in thousands, except per share amounts) |
2011 | 2010 | 2009 | |||||||||
| Earnings (loss) per common share: |
||||||||||||
| Basic Class L |
$ | 17.18 | $ | 17.07 | $ | 17.45 | ||||||
| Basic common stock |
$ | (0.50 | ) | $ | (1.25 | ) | $ | (0.98 | ) | |||
| Diluted Class L |
$ | 16.48 | $ | 16.37 | $ | 16.67 | ||||||
| Diluted common stock |
$ | (0.50 | ) | $ | (1.25 | ) | $ | (0.98 | ) | |||
| Weighted average number of shares outstanding: |
||||||||||||
| Basic Class L |
9,984 | 9,975 | 9,954 | |||||||||
| Basic common stock |
87,912 | 87,955 | 87,588 | |||||||||
| Dilutive impact of stock options: |
||||||||||||
| Class L |
424 | 424 | 455 | |||||||||
| Common stock |
— | — | — | |||||||||
| Diluted Class L |
10,408 | 10,399 | 10,409 | |||||||||
| Diluted common stock |
87,912 | 87,955 | 87,588 | |||||||||
For purposes of calculating the diluted earnings per share for the common stock, options outstanding to purchase common stock shares at December 31, 2011, 2010 and 2009 have been excluded from the computation of diluted common stock shares outstanding because the effect is anti-dilutive.
| 14. | COMMITMENTS AND CONTINGENCIES |
In the ordinary course of business, we and certain of our subsidiaries are defendants in various litigation matters and are subject to claims from our clients for indemnification, some of which may involve claims for damages that are substantial in amount. We do not believe the disposition of claims currently pending will have a material effect on our financial position, results of operations or cash flows.
F-40
Table of Contents
WEST CORPORATION
NOTES TO CONSOLIDATED FINANCIAL STATEMENTS—(Continued)
YEARS ENDED DECEMBER 31, 2011, 2010 AND 2009
| 15. | BUSINESS SEGMENTS |
We operate in two business segments:
Unified Communications, including conferencing and collaboration services, event services, alerts and notification services and IP-based unified communication solutions; and
Communication Services, including emergency communications, automated call processing and agent-based services.
| For the year ended December 31, | ||||||||||||
| 2011 | 2010 | 2009 | ||||||||||
| Revenue: |
||||||||||||
| Unified Communications |
$ | 1,364,032 | $ | 1,220,216 | $ | 1,126,544 | ||||||
| Communication Services |
1,137,900 | 1,173,945 | 1,254,547 | |||||||||
| Intersegment eliminations |
(10,607 | ) | (5,950 | ) | (5,343 | ) | ||||||
|
|
|
|
|
|
|
|||||||
| Total |
$ | 2,491,325 | $ | 2,388,211 | $ | 2,375,748 | ||||||
|
|
|
|
|
|
|
|||||||
| Depreciation and Amortization |
||||||||||||
| (Included in Operating Income): |
||||||||||||
| Unified Communications |
$ | 85,566 | $ | 87,278 | $ | 91,491 | ||||||
| Communication Services |
86,342 | 83,052 | 96,856 | |||||||||
|
|
|
|
|
|
|
|||||||
| Total |
$ | 171,908 | $ | 170,330 | $ | 188,347 | ||||||
|
|
|
|
|
|
|
|||||||
| Operating Income: |
||||||||||||
| Unified Communications |
$ | 363,226 | $ | 320,411 | $ | 296,096 | ||||||
| Communication Services |
104,902 | 99,770 | 104,517 | |||||||||
|
|
|
|
|
|
|
|||||||
| Total |
$ | 468,128 | $ | 420,181 | $ | 400,613 | ||||||
|
|
|
|
|
|
|
|||||||
| Capital Expenditures: |
||||||||||||
| Unified Communications |
$ | 61,063 | $ | 51,077 | $ | 57,529 | ||||||
| Communication Services |
46,952 | 50,515 | 49,273 | |||||||||
| Corporate |
12,107 | 20,457 | 15,866 | |||||||||
|
|
|
|
|
|
|
|||||||
| Total |
$ | 120,122 | $ | 122,049 | $ | 122,668 | ||||||
|
|
|
|
|
|
|
|||||||
| As of December 31, | ||||||||||||
| 2011 | 2010 | 2009 | ||||||||||
| Assets: |
||||||||||||
| Unified Communications |
$ | 1,620,444 | $ | 1,401,242 | $ | 1,395,714 | ||||||
| Communication Services |
1,379,125 | 1,375,643 | 1,436,222 | |||||||||
| Corporate |
227,949 | 228,365 | 213,326 | |||||||||
|
|
|
|
|
|
|
|||||||
| Total |
$ | 3,227,518 | $ | 3,005,250 | $ | 3,045,262 | ||||||
|
|
|
|
|
|
|
|||||||
Platform-based service revenue includes services provided in both the Unified Communications Services and Communication Services segments, while agent-based service revenue is provided in the Communication Services segment. Revenue from platform-based services was $1,759 million, $1,620 million and $1,524 million in 2011, 2010 and 2009, respectively.
For 2011, 2010 and 2009, our largest 100 clients represented approximately 55%, 57% and 56% of total revenue, respectively. The aggregate revenue as a percentage of our total revenue from our largest client, AT&T, during 2011, 2010 and 2009 was approximately 10%, 11% and 12%, respectively. AT&T represented approximately 7% of our gross receivables at December 31, 2011 and 2010.
F-41
Table of Contents
WEST CORPORATION
NOTES TO CONSOLIDATED FINANCIAL STATEMENTS—(Continued)
YEARS ENDED DECEMBER 31, 2011, 2010 AND 2009
No individual country outside of the U.S. accounted for greater than 10% of aggregate revenue for 2011, 2010 or 2009. Revenue is attributed to an organizational region based on location of the billed customer’s account. Geographic information by organizational region, in thousands, is noted below.
| 2011 | 2010 | 2009 | ||||||||||
| Revenue: |
||||||||||||
| Americas—United States |
$ | 2,018,179 | $ | 1,979,372 | $ | 2,020,850 | ||||||
| Europe, Middle East & Africa (EMEA) |
292,397 | 263,603 | 240,990 | |||||||||
| Asia Pacific |
154,238 | 125,267 | 94,497 | |||||||||
| Americas—Other |
26,511 | 19,969 | 19,411 | |||||||||
|
|
|
|
|
|
|
|||||||
| Total |
$ | 2,491,325 | $ | 2,388,211 | $ | 2,375,748 | ||||||
|
|
|
|
|
|
|
|||||||
| As of December 31, | ||||||||||||
| 2011 | 2010 | 2009 | ||||||||||
| Long-Lived Assets: |
||||||||||||
| Americas—United States |
$ | 2,373,428 | $ | 2,192,157 | $ | 2,248,274 | ||||||
| Europe, Middle East & Africa (EMEA) |
206,598 | 210,689 | 240,393 | |||||||||
| Asia Pacific |
21,599 | 19,646 | 10,458 | |||||||||
| Americas—Other |
4,107 | 5,731 | 2,521 | |||||||||
|
|
|
|
|
|
|
|||||||
| Total |
$ | 2,605,732 | $ | 2,428,223 | $ | 2,501,646 | ||||||
|
|
|
|
|
|
|
|||||||
The aggregate gain (loss) on transactions denominated in currencies other than the functional currency of West Corporation or any of its subsidiaries was approximately $4.2 million, ($2.8) million and $2.6 million in 2011, 2010 and 2009, respectively.
| 16. | CONCENTRATION OF CREDIT RISK |
Our accounts receivable subject us to the potential for credit risk with our customers. At December 31, 2011, three customers accounted for $44.5 million or 10.8% of gross accounts receivable, compared to $40.3 million, or 11.0% of gross receivables at December 31, 2010. We perform ongoing credit evaluations of our customers’ financial condition. We maintain an allowance for doubtful accounts for potential credit losses based upon historical trends, specific collection problems, historical write-offs, account aging and other analysis of all accounts and notes receivable. At February 7, 2012, $38.9 million, or 87%, of the December 31, 2011 accounts receivable from the three customers noted above had been received.
F-42
Table of Contents
WEST CORPORATION
NOTES TO CONSOLIDATED FINANCIAL STATEMENTS—(Continued)
YEARS ENDED DECEMBER 31, 2011, 2010 AND 2009
| 17. | SUPPLEMENTAL CASH FLOW INFORMATION |
The following table summarizes, in thousands, supplemental information about our cash flows for the years ended December 31, 2011, 2010 and 2009:
| Years Ended December 31, | ||||||||||||
| 2011 | 2010 | 2009 | ||||||||||
| SUPPLEMENTAL DISCLOSURE OF CASH FLOW INFORMATION: |
||||||||||||
| Cash paid for interest |
$ | 243,825 | $ | 231,698 | $ | 256,761 | ||||||
| Cash paid for redemption call premium on 2014 Senior Notes |
$ | — | $ | 32,759 | $ | — | ||||||
| Cash paid for income taxes, net of $8,069, $ 1,033 and $2,084 for refunds in 2011, 2010 and 2009 |
$ | 28,934 | $ | 28,439 | $ | 33,538 | ||||||
| SUPPLEMENTAL DISCLOSURE OF CASH INVESTING ACTIVITIES: |
||||||||||||
| Purchase of portfolio receivables |
$ | — | $ | — | $ | 1,722 | ||||||
| Collections applied to principal of portfolio receivables |
$ | — | $ | 13,739 | $ | 39,063 | ||||||
| SUPPLEMENTAL DISCLOSURE OF CASH FINANCING ACTIVITIES: |
||||||||||||
| Payments of portfolio notes payable |
$ | — | $ | 686 | $ | 34,694 | ||||||
| SUPPLEMENTAL DISCLOSURE OF NONCASH INVESTING ACTIVITIES: |
||||||||||||
| Acquisition of property through accounts payable commitments |
$ | 15,531 | $ | 13,322 | $ | 9,464 | ||||||
| Acquisition of property through assumption of long-term obligations |
$ | — | $ | — | $ | 4,008 | ||||||
| Settlement of portfolio receivables |
$ | — | $ | — | $ | 56,182 | ||||||
| SUPPLEMENTAL DISCLOSURE OF NONCASH FINANCING ACTIVITIES: |
||||||||||||
| Conversion of Class L common shares to Class A common shares |
$ | 1,675,434 | $ | — | $ | — | ||||||
| Stock and stock options exchanged in cashless exercises of stock options |
$ | 1,688 | $ | — | $ | — | ||||||
| Settlement of non-recourse portfolio notes payable |
$ | — | $ | — | $ | 56,598 | ||||||
Our 2010 and 2009 supplemental disclosure of acquisition of property through accounts payable commitments has been corrected from our original 2010 presentation to present amounts that remain unpaid at the end of the reporting period. The correction resulted in an increase of $9,464 and $9,324 in 2010 and 2009, respectively. The correction had no impact on the consolidated financial statements.
F-43
Table of Contents
WEST CORPORATION
NOTES TO CONSOLIDATED FINANCIAL STATEMENTS—(Continued)
YEARS ENDED DECEMBER 31, 2011, 2010 AND 2009
| 18. | QUARTERLY RESULTS OF OPERATIONS (UNAUDITED) |
The following is the summary of the unaudited quarterly results of operations for the two years ended December 31, 2011 and 2010, in thousands.
| Three Months Ended | Year
Ended December 31, 2011 |
|||||||||||||||||||
| March 31, 2011 |
June 30, 2011 |
September 30, 2011 |
December 31, 2011 (1) |
|||||||||||||||||
| Revenue |
$ | 610,818 | $ | 622,820 | $ | 632,803 | $ | 624,884 | $ | 2,491,325 | ||||||||||
| Cost of services |
271,603 | 276,220 | 284,406 | 281,060 | 1,113,289 | |||||||||||||||
|
|
|
|
|
|
|
|
|
|
|
|||||||||||
| Gross Profit (4) |
339,215 | 346,600 | 348,397 | 343,824 | 1,378,036 | |||||||||||||||
| SG&A |
220,408 | 223,849 | 216,450 | 249,201 | 909,908 | |||||||||||||||
|
|
|
|
|
|
|
|
|
|
|
|||||||||||
| Operating income |
118,807 | 122,751 | 131,947 | 94,623 | 468,128 | |||||||||||||||
|
|
|
|
|
|
|
|
|
|
|
|||||||||||
| Net income |
$ | 34,580 | $ | 34,378 | $ | 37,347 | $ | 21,188 | $ | 127,493 | ||||||||||
|
|
|
|
|
|
|
|
|
|
|
|||||||||||
| Three Months Ended | Year Ended December 31, 2010 |
|||||||||||||||||||
| March 31, 2010 |
June 30, 2010 |
September 30, 2010 (2) |
December 31, 2010 (3) |
|||||||||||||||||
| Revenue |
$ | 599,821 | $ | 596,549 | $ | 592,410 | $ | 599,431 | $ | 2,388,211 | ||||||||||
| Cost of services |
260,823 | 263,433 | 259,723 | 273,029 | 1,057,008 | |||||||||||||||
|
|
|
|
|
|
|
|
|
|
|
|||||||||||
| Gross Profit (4) |
338,998 | 333,116 | 332,687 | 326,402 | 1,331,203 | |||||||||||||||
| SG&A |
221,753 | 214,639 | 258,818 | 215,812 | 911,022 | |||||||||||||||
|
|
|
|
|
|
|
|
|
|
|
|||||||||||
| Operating income |
117,245 | 118,477 | 73,869 | 110,590 | 420,181 | |||||||||||||||
|
|
|
|
|
|
|
|
|
|
|
|||||||||||
| Net income (loss) |
$ | 36,003 | $ | 36,293 | $ | (8,429 | ) | $ | (3,563 | ) | $ | 60,304 | ||||||||
|
|
|
|
|
|
|
|
|
|
|
|||||||||||
| (1) | Results of operations in the fourth quarter of 2011 were affected by a pre-tax $18.5 million share based compensation expense for the modification of vesting criteria of restricted stock grants. $12.1 million was not deductible for tax purposes. |
| (2) | Results of operations in the third quarter of 2010 were affected by the Communication Services segment recording a $37.7 million goodwill impairment charge which was not deductible for tax purposes. |
| (3) | Net loss in the fourth quarter of 2010 was affected by $52.8 million of pre-tax refinancing expense. |
| (4) | Depreciation and amortization expenses are included in our SG&A and therefore our gross profit may not be comparable to that of other companies. |
| 19. | FINANCIAL INFORMATION FOR SUBSIDIARY GUARANTOR AND SUBSIDIARY NON- GUARANTOR |
West Corporation and our U.S. based wholly owned subsidiary guarantors, jointly, severally, fully and unconditionally are responsible for the payment of principal, premium and interest on our senior notes and senior subordinated notes. Presented below, in thousands, is condensed consolidated financial information for West Corporation and our subsidiary guarantors and subsidiary non-guarantors for the periods indicated.
F-44
Table of Contents
WEST CORPORATION AND SUBSIDIARIES
NOTES TO CONSOLIDATED FINANCIAL STATEMENTS
CONDENSED CONSOLIDATING STATEMENTS OF OPERATIONS
(AMOUNTS IN THOUSANDS)
| Year Ended December 31, 2011 | ||||||||||||||||||||
| Parent / Issuer |
Guarantor Subsidiaries |
Non- Guarantor Subsidiaries |
Eliminations and Consolidating Entries |
Consolidated | ||||||||||||||||
| REVENUE |
$ | — | $ | 1,970,681 | $ | 520,644 | $ | — | $ | 2,491,325 | ||||||||||
| COST OF SERVICES |
— | 897,639 | 215,650 | — | 1,113,289 | |||||||||||||||
| SELLING, GENERAL AND ADMINISTRATIVE EXPENSES |
19,927 | 733,967 | 156,014 | — | 909,908 | |||||||||||||||
|
|
|
|
|
|
|
|
|
|
|
|||||||||||
| OPERATING INCOME |
(19,927 | ) | 339,075 | 148,980 | — | 468,128 | ||||||||||||||
| OTHER INCOME (EXPENSE): |
||||||||||||||||||||
| Interest Expense, net of income |
(165,856 | ) | (117,986 | ) | 14,426 | — | (269,416 | ) | ||||||||||||
| Subsidiary Income |
270,245 | 121,029 | — | (391,274 | ) | — | ||||||||||||||
| Other, net |
1,457 | 17,197 | (12,839 | ) | — | 5,815 | ||||||||||||||
|
|
|
|
|
|
|
|
|
|
|
|||||||||||
| Other expense |
105,846 | 20,240 | 1,587 | (391,274 | ) | (263,601 | ) | |||||||||||||
| INCOME BEFORE INCOME TAX EXPENSE |
85,919 | 359,315 | 150,567 | (391,274 | ) | 204,527 | ||||||||||||||
| INCOME TAX EXPENSE (BENEFIT) |
(41,574 | ) | 89,986 | 28,622 | — | 77,034 | ||||||||||||||
|
|
|
|
|
|
|
|
|
|
|
|||||||||||
| NET INCOME—WEST CORPORATION |
$ | 127,493 | $ | 269,329 | $ | 121,945 | $ | (391,274 | ) | $ | 127,493 | |||||||||
|
|
|
|
|
|
|
|
|
|
|
|||||||||||
F-45
Table of Contents
WEST CORPORATION AND SUBSIDIARIES
NOTES TO CONSOLIDATED FINANCIAL STATEMENTS
CONDENSED CONSOLIDATING STATEMENTS OF OPERATIONS
(AMOUNTS IN THOUSANDS)
| Year Ended December 31, 2010 | ||||||||||||||||||||
| Parent / Issuer |
Guarantor Subsidiaries |
Non- Guarantor Subsidiaries |
Eliminations and Consolidating Entries |
Consolidated | ||||||||||||||||
| REVENUE |
$ | — | $ | 1,945,300 | $ | 442,911 | $ | — | $ | 2,388,211 | ||||||||||
| COST OF SERVICES |
— | 883,559 | 173,449 | — | 1,057,008 | |||||||||||||||
| SELLING, GENERAL AND ADMINISTRATIVE EXPENSES |
4,707 | 768,656 | 137,659 | — | 911,022 | |||||||||||||||
|
|
|
|
|
|
|
|
|
|
|
|||||||||||
| OPERATING INCOME |
(4,707 | ) | 293,085 | 131,803 | — | 420,181 | ||||||||||||||
| OTHER INCOME (EXPENSE): |
||||||||||||||||||||
| Interest Expense, net of income |
(157,501 | ) | (105,042 | ) | 10,074 | — | (252,469 | ) | ||||||||||||
| Refinancing Expense |
(52,804 | ) | — | — | — | (52,804 | ) | |||||||||||||
| Subsidiary Income |
192,854 | 91,665 | — | (284,519 | ) | — | ||||||||||||||
| Other, net |
6,267 | 8,726 | (9,121 | ) | — | 5,872 | ||||||||||||||
|
|
|
|
|
|
|
|
|
|
|
|||||||||||
| Other expense |
(11,184 | ) | (4,651 | ) | 953 | (284,519 | ) | (299,401 | ) | |||||||||||
| INCOME BEFORE INCOME TAX EXPENSE |
(15,891 | ) | 288,434 | 132,756 | (284,519 | ) | 120,780 | |||||||||||||
| INCOME TAX EXPENSE (BENEFIT) |
(76,195 | ) | 96,617 | 40,054 | — | 60,476 | ||||||||||||||
|
|
|
|
|
|
|
|
|
|
|
|||||||||||
| NET INCOME—WEST CORPORATION |
$ | 60,304 | $ | 191,817 | $ | 92,702 | $ | (284,519 | ) | $ | 60,304 | |||||||||
|
|
|
|
|
|
|
|
|
|
|
|||||||||||
F-46
Table of Contents
WEST CORPORATION AND SUBSIDIARIES
NOTES TO CONSOLIDATED FINANCIAL STATEMENTS
CONDENSED CONSOLIDATING STATEMENTS OF OPERATIONS
(AMOUNTS IN THOUSANDS)
| Year Ended December 31, 2009 | ||||||||||||||||||||
| Parent / Issuer |
Guarantor Subsidiaries |
Non- Guarantor Subsidiaries |
Eliminations and Consolidating Entries |
Consolidated | ||||||||||||||||
| REVENUE |
$ | — | $ | 1,909,968 | $ | 489,618 | $ | (23,838 | ) | $ | 2,375,748 | |||||||||
| COST OF SERVICES |
— | 868,400 | 223,215 | (23,838 | ) | 1,067,777 | ||||||||||||||
| SELLING, GENERAL AND ADMINISTRATIVE EXPENSES |
2,623 | 761,409 | 143,326 | — | 907,358 | |||||||||||||||
|
|
|
|
|
|
|
|
|
|
|
|||||||||||
| OPERATING INCOME |
(2,623 | ) | 280,159 | 123,077 | — | 400,613 | ||||||||||||||
| OTHER INCOME (EXPENSE): |
||||||||||||||||||||
| Interest Income |
606 | (5,790 | ) | 5,495 | — | 311 | ||||||||||||||
| Interest Expense |
(143,778 | ) | (101,216 | ) | (9,109 | ) | — | (254,103 | ) | |||||||||||
| Subsidiary Income |
180,889 | 122,574 | — | (303,463 | ) | — | ||||||||||||||
| Other, net |
3,097 | (38,668 | ) | 36,586 | — | 1,015 | ||||||||||||||
|
|
|
|
|
|
|
|
|
|
|
|||||||||||
| Other expense |
40,814 | (23,100 | ) | 32,972 | (303,463 | ) | (252,777 | ) | ||||||||||||
|
|
|
|
|
|
|
|
|
|
|
|||||||||||
| INCOME BEFORE INCOME TAX EXPENSE AND NONCONTROLLING INTEREST |
38,191 | 257,059 | 156,049 | (303,463 | ) | 147,836 | ||||||||||||||
| INCOME TAX EXPENSE (BENEFIT) |
(50,038 | ) | 77,211 | 29,689 | — | 56,862 | ||||||||||||||
|
|
|
|
|
|
|
|
|
|
|
|||||||||||
| NET INCOME |
88,229 | 179,848 | 126,360 | (303,463 | ) | 90,974 | ||||||||||||||
| LESS NET INCOME (LOSS)—NONCONTROLLING INTEREST |
— | (5 | ) | 2,750 | — | 2,745 | ||||||||||||||
|
|
|
|
|
|
|
|
|
|
|
|||||||||||
| NET INCOME—WEST CORPORATION |
$ | 88,229 | $ | 179,853 | $ | 123,610 | $ | (303,463 | ) | $ | 88,229 | |||||||||
|
|
|
|
|
|
|
|
|
|
|
|||||||||||
F-47
Table of Contents
WEST CORPORATION AND SUBSIDIARIES
NOTES TO CONSOLIDATED FINANCIAL STATEMENTS
CONDENSED CONSOLIDATING BALANCE SHEET
(AMOUNTS IN THOUSANDS)
| December 31, 2011 | ||||||||||||||||||||
| Parent / Issuer |
Guarantor Subsidiaries |
Non- Guarantor Subsidiaries |
Eliminations and Consolidating Entries |
Consolidated | ||||||||||||||||
| ASSETS |
||||||||||||||||||||
| CURRENT ASSETS: |
||||||||||||||||||||
| Cash and cash equivalents |
$ | 10,503 | $ | — | $ | 89,572 | $ | (6,239 | ) | $ | 93,836 | |||||||||
| Trust cash |
— | 16,446 | — | — | 16,446 | |||||||||||||||
| Accounts receivable, net |
— | 50,480 | 363,333 | — | 413,813 | |||||||||||||||
| Intercompany receivables |
— | 573,280 | — | (573,280 | ) | — | ||||||||||||||
| Deferred income taxes receivable |
73,709 | 13,034 | 462 | (77,137 | ) | 10,068 | ||||||||||||||
| Prepaid assets |
3,222 | 25,232 | 8,588 | — | 37,042 | |||||||||||||||
| Other current assets |
5,089 | 306,273 | (260,781 | ) | — | 50,581 | ||||||||||||||
|
|
|
|
|
|
|
|
|
|
|
|||||||||||
| Total current assets |
92,523 | 984,745 | 201,174 | (656,656 | ) | 621,786 | ||||||||||||||
| Property and equipment, net |
73,105 | 243,170 | 34,580 | — | 350,855 | |||||||||||||||
| INVESTMENT IN SUBSIDIARIES |
1,460,108 | 351,329 | — | (1,811,437 | ) | — | ||||||||||||||
| GOODWILL |
— | 1,586,988 | 175,647 | — | 1,762,635 | |||||||||||||||
| INTANGIBLES, net |
— | 283,807 | 49,340 | — | 333,147 | |||||||||||||||
| OTHER ASSETS |
98,673 | 58,378 | 2,044 | — | 159,095 | |||||||||||||||
|
|
|
|
|
|
|
|
|
|
|
|||||||||||
| TOTAL ASSETS |
$ | 1,724,409 | $ | 3,508,417 | $ | 462,785 | $ | (2,468,093 | ) | $ | 3,227,518 | |||||||||
|
|
|
|
|
|
|
|
|
|
|
|||||||||||
| LIABILITIES AND STOCKHOLDERS’ EQUITY (DEFICIT) |
||||||||||||||||||||
| CURRENT LIABILITIES: |
||||||||||||||||||||
| Accounts payable |
$ | 5,001 | $ | 68,317 | $ | 12,360 | $ | (6,239 | ) | $ | 79,439 | |||||||||
| Intercompany payables |
572,554 | — | 726 | (573,280 | ) | — | ||||||||||||||
| Accrued expenses |
70,680 | 260,490 | 69,403 | (77,137 | ) | 323,436 | ||||||||||||||
| Current maturities of long-term debt |
2,354 | 13,071 | — | — | 15,425 | |||||||||||||||
|
|
|
|
|
|
|
|
|
|
|
|||||||||||
| Total current liabilities |
650,589 | 341,878 | 82,489 | (656,656 | ) | 418,300 | ||||||||||||||
| LONG-TERM OBLIGATIONS, less current maturities |
1,890,134 | 1,610,806 | — | — | 3,500,940 | |||||||||||||||
| DEFERRED INCOME TAXES |
22,766 | 84,918 | 13,837 | — | 121,521 | |||||||||||||||
| OTHER LONG-TERM LIABILITIES |
57,333 | 16,299 | 9,538 | — | 83,170 | |||||||||||||||
| TOTAL STOCKHOLDERS’ EQUITY (DEFICIT) |
(896,413 | ) | 1,454,516 | 356,921 | (1,811,437 | ) | (896,413 | ) | ||||||||||||
|
|
|
|
|
|
|
|
|
|
|
|||||||||||
| TOTAL LIABILITIES AND STOCKHOLDERS’ EQUITY (DEFICIT) |
$ | 1,724,409 | $ | 3,508,417 | $ | 462,785 | $ | (2,468,093 | ) | $ | 3,227,518 | |||||||||
|
|
|
|
|
|
|
|
|
|
|
|||||||||||
F-48
Table of Contents
WEST CORPORATION AND SUBSIDIARIES
NOTES TO CONSOLIDATED FINANCIAL STATEMENTS
CONDENSED CONSOLIDATING BALANCE SHEET
(AMOUNTS IN THOUSANDS)
| December 31, 2010 | ||||||||||||||||||||
| Parent / Issuer |
Guarantor Subsidiaries |
Non- Guarantor Subsidiaries |
Eliminations and Consolidating Entries |
Consolidated | ||||||||||||||||
| ASSETS |
||||||||||||||||||||
| CURRENT ASSETS: |
||||||||||||||||||||
| Cash and cash equivalents |
$ | — | $ | — | $ | 102,385 | $ | (4,592 | ) | $ | 97,793 | |||||||||
| Trust cash |
— | 15,122 | — | — | 15,122 | |||||||||||||||
| Accounts receivable, net |
— | 48,738 | 317,681 | — | 366,419 | |||||||||||||||
| Intercompany receivables |
— | 416,017 | — | (416,017 | ) | — | ||||||||||||||
| Deferred income taxes receivable |
9,848 | 16,532 | 3,588 | — | 29,968 | |||||||||||||||
| Prepaid assets |
2,981 | 24,451 | 6,235 | — | 33,667 | |||||||||||||||
| Other current assets |
2,559 | 23,680 | 7,819 | — | 34,058 | |||||||||||||||
|
|
|
|
|
|
|
|
|
|
|
|||||||||||
| Total current assets |
15,388 | 544,540 | 437,708 | (420,609 | ) | 577,027 | ||||||||||||||
| Property and equipment, net |
68,026 | 243,300 | 30,040 | — | 341,366 | |||||||||||||||
| INVESTMENT IN SUBSIDIARIES |
1,069,843 | 271,278 | — | (1,341,121 | ) | — | ||||||||||||||
| GOODWILL |
— | 1,471,124 | 158,272 | — | 1,629,396 | |||||||||||||||
| INTANGIBLES, net |
— | 244,833 | 54,852 | — | 299,685 | |||||||||||||||
| OTHER ASSETS |
110,090 | 288,496 | (240,810 | ) | — | 157,776 | ||||||||||||||
|
|
|
|
|
|
|
|
|
|
|
|||||||||||
| TOTAL ASSETS |
$ | 1,263,347 | $ | 3,063,571 | $ | 440,062 | $ | (1,761,730 | ) | $ | 3,005,250 | |||||||||
|
|
|
|
|
|
|
|
|
|
|
|||||||||||
| LIABILITIES AND STOCKHOLDERS’ EQUITY (DEFICIT) |
||||||||||||||||||||
| CURRENT LIABILITIES: |
||||||||||||||||||||
| Accounts payable |
$ | 7,448 | $ | 52,291 | $ | 9,002 | $ | (4,592 | ) | $ | 64,149 | |||||||||
| Intercompany payables |
340,974 | — | 75,043 | (416,017 | ) | — | ||||||||||||||
| Accrued expenses |
10,412 | 214,349 | 59,227 | — | 283,988 | |||||||||||||||
| Current maturities of long-term debt |
4,777 | 10,648 | — | — | 15,425 | |||||||||||||||
|
|
|
|
|
|
|
|
|
|
|
|||||||||||
| Total current liabilities |
363,611 | 277,288 | 143,272 | (420,609 | ) | 363,562 | ||||||||||||||
| LONG-TERM OBLIGATIONS, less current maturities |
1,888,775 | 1,629,366 | — | — | 3,518,141 | |||||||||||||||
| DEFERRED INCOME TAXES |
20,421 | 53,839 | 19,621 | — | 93,881 | |||||||||||||||
| OTHER LONG-TERM LIABILITIES |
29,595 | 37,644 | 1,482 | — | 68,721 | |||||||||||||||
| CLASS L COMMON STOCK |
1,504,445 | — | — | — | 1,504,445 | |||||||||||||||
| TOTAL STOCKHOLDERS’ EQUITY (DEFICIT) |
(2,543,500 | ) | 1,065,434 | 275,687 | (1,341,121 | ) | (2,543,500 | ) | ||||||||||||
|
|
|
|
|
|
|
|
|
|
|
|||||||||||
| TOTAL LIABILITIES AND STOCKHOLDERS’ EQUITY (DEFICIT) |
$ | 1,263,347 | $ | 3,063,571 | $ | 440,062 | $ | (1,761,730 | ) | $ | 3,005,250 | |||||||||
|
|
|
|
|
|
|
|
|
|
|
|||||||||||
F-49
Table of Contents
WEST CORPORATION AND SUBSIDIARIES
NOTES TO CONSOLIDATED FINANCIAL STATEMENTS
CONDENSED CONSOLIDATING STATEMENTS OF CASH FLOWS
(AMOUNTS IN THOUSANDS)
| Year Ended December 31, 2011 | ||||||||||||||||||||
| Parent / Issuer |
Guarantor Subsidiaries |
Non- Guarantor Subsidiaries |
Eliminations and Consolidating Entries |
Consolidated | ||||||||||||||||
| NET CASH FLOWS FROM OPERATING ACTIVITIES: |
$ | — | $ | 306,897 | $ | 47,529 | $ | (6,239 | ) | $ | 348,187 | |||||||||
| CASH FLOWS FROM INVESTING ACTIVITIES: |
||||||||||||||||||||
| Business acquisitions |
— | (185,845 | ) | (25,794 | ) | — | (211,639 | ) | ||||||||||||
| Purchase of property and equipment |
(12,107 | ) | (89,099 | ) | (16,707 | ) | — | (117,913 | ) | |||||||||||
| Other |
— | 99 | 12 | — | 111 | |||||||||||||||
|
|
|
|
|
|
|
|
|
|
|
|||||||||||
| Net cash flows from investing activities |
(12,107 | ) | (274,845 | ) | (42,489 | ) | — | (329,441 | ) | |||||||||||
|
|
|
|
|
|
|
|
|
|
|
|||||||||||
| CASH FLOWS FROM FINANCING ACTIVITIES: |
||||||||||||||||||||
| Payments of long-term revolving credit obligations |
(524,300 | ) | — | (262,000 | ) | — | (786,300 | ) | ||||||||||||
| Proceeds from issuance of long-term revolving credit obligations |
524,300 | — | 262,000 | — | 786,300 | |||||||||||||||
| Debt issuance costs |
(770 | ) | — | (259 | ) | — | (1,029 | ) | ||||||||||||
| Principal payments of long-term obligations |
(5,327 | ) | (11,874 | ) | — | — | (17,201 | ) | ||||||||||||
| Payments of capital lease obligations |
(849 | ) | (58 | ) | (38 | ) | — | (945 | ) | |||||||||||
| Repurchase of common stock |
(5,845 | ) | — | — | — | (5,845 | ) | |||||||||||||
| Proceeds from stock options exercised, including excess tax benefits |
1,840 | — | — | — | 1,840 | |||||||||||||||
|
|
|
|
|
|
|
|
|
|
|
|||||||||||
| Net cash flows from financing activities |
(10,951 | ) | (11,932 | ) | (297 | ) | — | (23,180 | ) | |||||||||||
|
|
|
|
|
|
|
|
|
|
|
|||||||||||
| Intercompany |
33,561 | (20,120 | ) | (18,033 | ) | 4,592 | — | |||||||||||||
| EFFECT OF EXCHANGE RATES ON CASH AND CASH EQUIVALENTS |
— | — | 477 | — | 477 | |||||||||||||||
| NET CHANGE IN CASH AND CASH EQUIVALENTS |
10,503 | — | (12,813 | ) | (1,647 | ) | (3,957 | ) | ||||||||||||
| CASH AND CASH EQUIVALENTS, Beginning of period |
— | — | 102,385 | (4,592 | ) | 97,793 | ||||||||||||||
|
|
|
|
|
|
|
|
|
|
|
|||||||||||
| CASH AND CASH EQUIVALENTS, End of period |
$ | 10,503 | $ | — | $ | 89,572 | $ | (6,239 | ) | $ | 93,836 | |||||||||
|
|
|
|
|
|
|
|
|
|
|
|||||||||||
F-50
Table of Contents
WEST CORPORATION AND SUBSIDIARIES
NOTES TO CONSOLIDATED FINANCIAL STATEMENTS
CONDENSED CONSOLIDATING STATEMENTS OF CASH FLOWS
(AMOUNTS IN THOUSANDS)
| Year Ended December 31, 2010 | ||||||||||||||||||||
| Parent / Issuer |
Guarantor Subsidiaries |
Non- Guarantor Subsidiaries |
Eliminations and Consolidating Entries |
Consolidated | ||||||||||||||||
| NET CASH FLOWS FROM OPERATING ACTIVITIES: |
$ | — | $ | 239,307 | $ | 78,114 | $ | (4,592 | ) | $ | 312,829 | |||||||||
| CASH FLOWS FROM INVESTING ACTIVITIES: |
||||||||||||||||||||
| Business acquisitions |
— | (23,746 | ) | (9,750 | ) | — | (33,496 | ) | ||||||||||||
| Purchase of property and equipment |
(20,457 | ) | (83,403 | ) | (14,331 | ) | — | (118,191 | ) | |||||||||||
| Collections applied to principal of portfolio receivables |
— | 13,739 | — | — | 13,739 | |||||||||||||||
| Other |
— | 52 | — | — | 52 | |||||||||||||||
|
|
|
|
|
|
|
|
|
|
|
|||||||||||
| Net cash flows from investing activities |
(20,457 | ) | (93,358 | ) | (24,081 | ) | — | (137,896 | ) | |||||||||||
|
|
|
|
|
|
|
|
|
|
|
|||||||||||
| CASH FLOWS FROM FINANCING ACTIVITIES: |
||||||||||||||||||||
| Payments of long-term obligations |
(1,327,781 | ) | — | (47,000 | ) | — | (1,374,781 | ) | ||||||||||||
| Proceeds from issuance of long-term obligations |
1,254,850 | — | 47,000 | — | 1,301,850 | |||||||||||||||
| Debt issuance costs |
(31,083 | ) | — | — | — | (31,083 | ) | |||||||||||||
| Principal payments of long-term obligations |
(7,688 | ) | (19,059 | ) | — | — | (26,747 | ) | ||||||||||||
| Payments of capital lease obligations |
(2,005 | ) | (52 | ) | (58 | ) | — | (2,115 | ) | |||||||||||
| Repurchase of common stock |
(970 | ) | — | — | — | (970 | ) | |||||||||||||
| Proceeds from stock options exercised, including excess tax benefits |
897 | — | — | — | 897 | |||||||||||||||
| Payments of portfolio notes payable |
— | (686 | ) | — | — | (686 | ) | |||||||||||||
| Other |
(16 | ) | — | — | — | (16 | ) | |||||||||||||
|
|
|
|
|
|
|
|
|
|
|
|||||||||||
| Net cash flows from financing activities |
(113,796 | ) | (19,797 | ) | (58 | ) | — | (133,651 | ) | |||||||||||
|
|
|
|
|
|
|
|
|
|
|
|||||||||||
| Intercompany |
131,904 | (126,152 | ) | (16,015 | ) | 10,263 | — | |||||||||||||
| EFFECT OF EXCHANGE RATES ON CASH AND CASH EQUIVALENTS |
— | — | (2,557 | ) | — | (2,557 | ) | |||||||||||||
| NET CHANGE IN CASH AND CASH EQUIVALENTS |
(2,349 | ) | — | 35,403 | 5,671 | 38,725 | ||||||||||||||
| CASH AND CASH EQUIVALENTS, Beginning of period |
2,349 | — | 66,982 | (10,263 | ) | 59,068 | ||||||||||||||
|
|
|
|
|
|
|
|
|
|
|
|||||||||||
| CASH AND CASH EQUIVALENTS, End of period |
$ | — | $ | — | $ | 102,385 | $ | (4,592 | ) | $ | 97,793 | |||||||||
|
|
|
|
|
|
|
|
|
|
|
|||||||||||
F-51
Table of Contents
WEST CORPORATION AND SUBSIDIARIES
NOTES TO CONSOLIDATED FINANCIAL STATEMENTS
CONDENSED CONSOLIDATING STATEMENTS OF CASH FLOWS
(AMOUNTS IN THOUSANDS)
| Year Ended December 31, 2009 | ||||||||||||||||||||
| Parent / Issuer |
Guarantor Subsidiaries |
Non- Guarantor Subsidiaries |
Eliminations and Consolidating Entries |
Consolidated | ||||||||||||||||
| NET CASH FLOWS FROM OPERATING ACTIVITIES: |
$ | — | $ | 175,330 | $ | 107,790 | $ | (10,263 | ) | $ | 272,857 | |||||||||
| CASH FLOWS FROM INVESTING ACTIVITIES: |
||||||||||||||||||||
| Business acquisitions |
— | (23,612 | ) | (8,099 | ) | — | (31,711 | ) | ||||||||||||
| Purchase of portfolio receivables |
— | — | (1,722 | ) | — | (1,722 | ) | |||||||||||||
| Purchase of property and equipment |
(15,866 | ) | (89,380 | ) | (13,274 | ) | — | (118,520 | ) | |||||||||||
| Collections applied to principal of portfolio receivables |
— | 8,467 | 30,596 | — | 39,063 | |||||||||||||||
| Other |
— | 57 | 218 | — | 275 | |||||||||||||||
|
|
|
|
|
|
|
|
|
|
|
|||||||||||
| Net cash flows from investing activities |
(15,866 | ) | (104,468 | ) | 7,719 | — | (112,615 | ) | ||||||||||||
|
|
|
|
|
|
|
|
|
|
|
|||||||||||
| CASH FLOWS FROM FINANCING ACTIVITIES: |
||||||||||||||||||||
| Net change in revolving credit facilities |
(151,187 | ) | — | (50,487 | ) | — | (201,674 | ) | ||||||||||||
| Principal payments of long-term obligations |
(6,342 | ) | (18,942 | ) | — | — | (25,284 | ) | ||||||||||||
| Debt issuance costs |
(7,968 | ) | — | — | — | (7,968 | ) | |||||||||||||
| Proceeds from stock options exercised, including excess tax benefits |
3,200 | — | — | — | 3,200 | |||||||||||||||
| Payments of portfolio notes payable |
— | (1,603 | ) | (33,091 | ) | — | (34,694 | ) | ||||||||||||
| Noncontrolling interest distributions |
— | — | (4,131 | ) | — | (4,131 | ) | |||||||||||||
| Payments of capital lease obligations |
(904 | ) | (334 | ) | (55 | ) | — | (1,293 | ) | |||||||||||
|
|
|
|
|
|
|
|
|
|
|
|||||||||||
| Net cash flows from financing activities |
(163,201 | ) | (20,879 | ) | (87,764 | ) | — | (271,844 | ) | |||||||||||
|
|
|
|
|
|
|
|
|
|
|
|||||||||||
| Intercompany |
55,742 | (57,128 | ) | 1,386 | — | — | ||||||||||||||
| EFFECT OF EXCHANGE RATES ON CASH AND CASH EQUIVALENTS |
— | — | 2,330 | — | 2,330 | |||||||||||||||
| NET CHANGE IN CASH AND CASH EQUIVALENTS |
(123,325 | ) | (7,145 | ) | 31,461 | (10,263 | ) | (109,272 | ) | |||||||||||
| CASH AND CASH EQUIVALENTS, Beginning of period |
125,674 | 7,145 | 35,521 | — | 168,340 | |||||||||||||||
|
|
|
|
|
|
|
|
|
|
|
|||||||||||
| CASH AND CASH EQUIVALENTS, End of period |
$ | 2,349 | $ | — | $ | 66,982 | $ | (10,263 | ) | $ | 59,068 | |||||||||
|
|
|
|
|
|
|
|
|
|
|
|||||||||||
F-52
Table of Contents
WEST CORPORATION AND SUBSIDIARIES
CONSOLIDATED VALUATION ACCOUNTS
THREE YEARS ENDED DECEMBER 31, 2011
| Description (amounts in thousands) |
Balance Beginning of Year |
Reserves Obtained in Acquisitions |
Additions - Charged (Credited) to Cost and Expenses |
Deductions - Amounts Charged-Off |
Balance End of Year |
|||||||||||||||
| December 31, 2011—Allowance for doubtful accounts—Accounts receivable |
$ | 10,481 | $ | 374 | $ | 2,762 | ($ | 1,990 | ) | $ | 11,627 | |||||||||
|
|
|
|
|
|
|
|
|
|
|
|||||||||||
| December 31, 2010—Allowance for doubtful accounts—Accounts receivable |
$ | 11,819 | $ | 268 | $ | 4,222 | ($ | 5,828 | ) | $ | 10,481 | |||||||||
|
|
|
|
|
|
|
|
|
|
|
|||||||||||
| December 31, 2009—Allowance for doubtful accounts—Accounts receivable |
$ | 12,382 | $ | 18 | $ | 5,301 | ($ | 5,882 | ) | $ | 11,819 | |||||||||
|
|
|
|
|
|
|
|
|
|
|
|||||||||||
| Balance Beginning of Year |
Valuation Allowance Obtained in Acquisitions |
Additions | Deductions | Balance End of Year |
||||||||||||||||
| December 31, 2011—Allowance for deferred income tax asset valuation |
$ | (119,684 | ) | $ | (560 | ) | $ | (70 | ) | $ | 5,628 | $ | (114,686 | ) | ||||||
|
|
|
|
|
|
|
|
|
|
|
|||||||||||
| December 31, 2010—Allowance for deferred income tax asset valuation |
$ | (101,849 | ) | $ | (20,770 | ) | $ | (1,044 | ) | $ | 3,979 | $ | (119,684 | ) | ||||||
|
|
|
|
|
|
|
|
|
|
|
|||||||||||
| December 31, 2009—Allowance for deferred income tax asset valuation |
$ | (100,676 | ) | $ | (1,173 | ) | $ | — | $ | — | $ | (101,849 | ) | |||||||
|
|
|
|
|
|
|
|
|
|
|
|||||||||||
F-53
Table of Contents

Table of Contents
PART II
INFORMATION NOT REQUIRED IN PROSPECTUS
Item 13. Other Expenses of Issuance and Distribution.
The following table sets forth the estimated expenses payable by us in connection with the sale and distribution of the securities registered hereby, other than underwriting discounts or commissions. All amounts are estimates except for the SEC registration fee and the Financial Industry Regulatory Authority filing fee.
| SEC Registration Fee |
$ | 27,900 | ||
| FINRA Filing Fee |
$ | 50,500 | ||
| Stock Exchange Listing Fee |
$ | * | ||
| Printing Fees and Expenses |
$ | * | ||
| Accounting Fees and Expenses |
$ | * | ||
| Legal Fees and Expenses |
$ | * | ||
| Blue Sky Fees and Expenses |
$ | * | ||
| Transfer Agent Fees and Expenses |
$ | * | ||
| Miscellaneous |
$ | * | ||
| Total: |
$ | |||
|
|
| * | To be filed by amendment. |
Item 14. Indemnification of Directors and Officers.
Section 145 of the Delaware General Corporation Law authorizes and empowers a Delaware corporation to indemnify its directors, officers, employees and agents against liabilities incurred in connection with, and related expenses resulting from, any claim, action or suit brought against any such person as a result of his or her relationship with the corporation, provided that such persons acted in good faith and in a manner such person reasonably believed to be in, and not opposed to, the best interests of the corporation in connection with the acts or events on which such claim, action or suit is based. The finding of either civil or criminal liability on the part of such person in connection with such acts or events is not necessarily determinative of the question of whether such person has met the required standard of conduct and is, accordingly, entitled to be indemnified. Our certificate of incorporation provides for indemnification of our directors, officers, employees and agents to the fullest extent permitted under Delaware law. In addition, we have entered into separate indemnification agreements with our executive officers and directors, which require us, among other things, to indemnify them against certain liabilities that may arise by reason of their status or service (other than liabilities arising from acts or omissions not in good faith or from willful misconduct). These indemnification provisions and the indemnification agreements may be sufficiently broad to permit indemnification of our executive officers and directors for liabilities, including reimbursement of expenses incurred, arising under the Securities Act.
Section 102(b)(7) of the Delaware General Corporation Law permits a corporation to provide in its certificate of incorporation that a director of the corporation shall not be personally liable to the corporation or its stockholder for monetary damages for breach of fiduciary duty as a director, except for liability: (i) for any breach of the director’s duty of loyalty to us or its stockholders; (ii) for acts or omissions not in good faith or which include intentional misconduct or a knowing violation of law; (iii) under Section 174 of the Delaware General Corporation Law (relating to certain unlawful payments of dividend or unlawful stock purchases or redemptions); or (iv) for any transaction from which the director derived an improper personal benefit. Our certificate of incorporation includes such a provision.
Section 145(g) of the DGCL provides that a corporation shall have the power to purchase and maintain insurance on behalf of any person who is or was a director, officer, employee or agent of the corporation, or is or was serving at the request of the corporation as a director, officer, employee or agent of another corporation, partnership, joint venture, trust or other enterprise against any liability asserted against the person in any such capacity, or arising out of the person’s status as such, whether or not the corporation would have the power to
II-1
Table of Contents
indemnify such person against such liability under the provisions of the law. We maintain standard policies of insurance under which coverage is provided, subject to the terms and conditions of such policies, (1) to our directors and officers against loss arising from claims made by reason of breach of duty or other wrongful act, and (2) to us with respect to payments which may be made by us to such officers and directors pursuant to the above indemnification provisions or otherwise as a matter of law.
The underwriting agreement we will enter into in connection with the offering of common stock being registered hereby provides that the underwriters will indemnify, under certain conditions, our directors and officers (as well as certain other persons) against certain liabilities arising in connection with such offering.
The foregoing statements are subject to the detailed provisions of Sections 145 and 102(b)(7) of the Delaware General Corporation Law and our certificate of incorporation, which has been filed as an exhibit to this registration statement.
Item 15. Recent Sales of Unregistered Securities.
During the period from February 24, 2009 through February 24, 2012 we have granted 402,500 shares of restricted common stock and employee stock options to purchase an aggregate of 395,000 shares of our common stock with exercise prices ranging from $9.04 to $10.60 per share. An aggregate of 228,900 shares have been issued upon the exercise of stock options for an aggregate consideration of $435,504 as of February 24, 2012. An aggregate of 4,544,797 shares of common stock were issued upon the exercise of 100,217 rollover options during the period from February 24, 2009 through February 24, 2012 for an aggregate consideration of $2,978,357. In addition an aggregate of 1,266,312 shares of common stock were distributed from the West Corporation Deferred Compensation Plan during the period from February 24, 2009 through February 24, 2012. The shares of common stock issued upon exercise of options or equity strips were issued pursuant to written compensatory plans or arrangements in reliance on the exemptions provided by either Section 4(2) of the Securities Act or Rule 701 promulgated under Section 3(b) of the Securities Act.
All shares described in this Item 15 are deemed restricted securities for purposes of the Securities Act.
Item 16. Exhibits and Financial Statement Schedules.
The exhibits to this registration statement are listed in the Exhibit Index attached hereto and incorporated by reference herein.
Item 17. Undertakings.
(a) The undersigned registrant hereby undertakes to provide to the underwriters at the closing specified in the underwriting agreements certificates in such denominations and registered in such names as required by the underwriters to permit prompt delivery to each purchaser.
(b) Insofar as indemnification for liabilities arising under the Securities Act of 1933 may be permitted to directors, officers and controlling persons of the registrant pursuant to the foregoing provisions, or otherwise, the registrant has been advised that in the opinion of the Securities and Exchange Commission such indemnification is against public policy as expressed in the Act and is, therefore, unenforceable. In the event that a claim for indemnification against such liabilities (other than the payment by the registrant of expenses incurred or paid by a director, officer or controlling person of the registrant in the successful defense of any action, suit or proceeding) is asserted by such director, officer or controlling person in connection with the securities being registered, the registrant will, unless in the opinion of its counsel the matter has been settled by controlling precedent, submit to a court of appropriate jurisdiction the question whether such indemnification by it is against public policy as expressed in the Act and will be governed by the final adjudication of such issue.
II-2
Table of Contents
| (c) | The undersigned registrant hereby undertakes that: |
(1) For purposes of determining any liability under the Securities Act of 1933, the information omitted from the form of prospectus filed as part of this registration statement in reliance upon Rule 430A and contained in a form of prospectus filed by the registrant pursuant to Rule 424(b)(1) or (4) or 497(h) under the Securities Act shall be deemed to be part of this registration statement as of the time it was declared effective.
(2) For the purpose of determining any liability under the Securities Act of 1933, each post-effective amendment that contains a form of prospectus shall be deemed to be a new registration statement relating to the securities offered therein, and the offering of such securities at that time shall be deemed to be the initial bona fide offering thereof.
(3) For the purpose of determining liability under the Securities Act to any purchaser, each prospectus filed pursuant to Rule 424(b) as part of a registration statement relating to an offering, other than registration statements relying on Rule 430B or other than prospectuses filed in reliance on Rule 430A, shall be deemed to be part of and included in the registration statement as of the date it is first used after effectiveness. Provided, however, that no statement made in a registration statement or prospectus that is part of the registration statement or made in a document incorporated or deemed incorporated by reference into the registration statement or prospectus that is part of the registration statement will, as to a purchaser with a time of contract of sale prior to such first use, supersede or modify any statement that was made in the registration statement or prospectus that was part of the registration statement or made in any such document immediately prior to such date of first use.
(4) For the purpose of determining liability of the registrant under the Securities Act to any purchaser in the initial distribution of the securities, in a primary offering of securities of the undersigned registrant pursuant to this registration statement, regardless of the underwriting method used to sell the securities to the purchaser, if the securities are offered or sold to such purchaser by means of any of the following communications, the undersigned registrant will be a seller to the purchaser and will be considered to offer or sell such securities to such purchaser:
(i) Any preliminary prospectus or prospectus of the undersigned registrant relating to the offering required to be filed pursuant to Rule 424;
(ii) Any free writing prospectus relating to the offering prepared by or on behalf of the undersigned registrant or used or referred to by the undersigned registrant;
(iii) The portion of any other free writing prospectus relating to the offering containing material information about the undersigned registrant or its securities provided by or on behalf of the undersigned registrant; and
(iv) Any other communication that is an offer in the offering made by the undersigned registrant to the purchaser.
II-3
Table of Contents
SIGNATURES
Pursuant to the requirements of the Securities Act of 1933, the registrant has duly caused this Amendment No. 9 to the Registration Statement to be signed on its behalf by the undersigned, thereunto duly authorized, in the City of Omaha, State of Nebraska, on February 24, 2012.
| West Corporation | ||
| By: |
/S/ THOMAS B. BARKER | |
| Name: |
Thomas B. Barker | |
| Title: |
Chief Executive Officer and Chairman of the Board (Principal Executive Officer) | |
Pursuant to the requirements of the Securities Act of 1933, this Amendment No. 9 to the Registration Statement has been signed by the following persons in the capacities on the dates indicated:
| Signature |
Title |
Date | ||
| /S/ THOMAS B. BARKER Thomas B. Barker |
Chief Executive Officer and Chairman of the Board (Principal Executive Officer) |
February 24, 2012 | ||
| /S/ PAUL M. MENDLIK Paul M. Mendlik |
Chief Financial Officer and Treasurer (Principal Financial Officer) |
February 24, 2012 | ||
| /S/ ROBERT (PAT) SHIELDS Robert (Pat) Shields |
Chief Accounting Officer |
February 24, 2012 | ||
| /S/ ANTHONY J. DINOVI* Anthony J. DiNovi |
Director |
February 24, 2012 | ||
| /S/ STEVEN G. FELSHER* Steven G. Felsher |
Director |
February 24, 2012 | ||
| /S/ SOREN L. OBERG* Soren L. Oberg |
Director |
February 24, 2012 | ||
| /S/ JEFF T. SWENSON* Jeff T. Swenson |
Director |
February 24, 2012 | ||
| * | The undersigned, by signing his name hereto, signs and executes this registration statement pursuant to the Powers of Attorney executed by the above-named individuals and previously filed with the Securities and Exchange Commission. |
| By: |
/S/ THOMAS B. BARKER | |
| Attorney-in-Fact | ||
II-4
Table of Contents
EXHIBIT INDEX
Exhibits identified in parentheses below, on file with the SEC are incorporated by reference into this report.
| Exhibit Number |
Description | |||
| 1.01 | ** | Form of Underwriting Agreement | ||
| 3.01 | ** | Amended and Restated Certificate of Incorporation of the Company | ||
| 3.02 | ** | Amended and Restated Bylaws of the Company | ||
| 4.01 | ** | Specimen stock certificate for shares of common stock of the Company | ||
| 5.01 | ** | Opinion of Sidley Austin LLP | ||
| 10.01 | West Corporation 2006 Executive Incentive Plan (incorporated by reference to Exhibit 10.12 to Form 10-Q filed on November 9, 2006) (1) | |||
| 10.02 | Indenture, dated as of October 24, 2006, among West Corporation, the Guarantors named on the Signature Pages thereto and The Bank of New York, as Trustee, with respect to the 11% senior subordinated notes due 2016 (incorporated by reference to Exhibit 4.2 to Form 10-Q filed on November 9, 2006) | |||
| 10.03 | Lease, dated September 1, 1994, by and between West Telemarketing Corporation and 99-Maple Partnership (Amendment No. 1) dated December 10, 2003 (incorporated by reference to Exhibit 10.07 to Form 10-K filed February 24, 2006) | |||
| 10.04 | Employment Agreement between the Company and Thomas B. Barker dated December 31, 2008 (incorporated by reference to Exhibit 10.1 to Form 8-K filed January 7, 2009 and Exhibit 10.42 to Form 10K dated February 14, 2012) (1) | |||
| 10.05 | Employment Agreement between the Company and Nancee R. Berger dated December 31, 2008 (incorporated by reference to Exhibit 10.2 to Form 8-K filed January 7, 2009 and Exhibit 10.43 to Form 10K dated February 14, 2012) (1) | |||
| 10.06 | Employment Agreement between the Company and Paul M. Mendlik, dated December 31, 2008 (incorporated by reference to Exhibit 10.4 to Form 8-K filed January 7, 2009 and Exhibit 10.44 to Form 10K dated February 14, 2012) (1) | |||
| 10.07 | Employment Agreement between West Corporation and Todd B. Strubbe, dated September 28, 2009 (incorporated by reference to Exhibit 10.07 to Form 10-K dated February 12, 2010 and Exhibit 10.45 to Form 10-K dated February 14, 2012) (1) | |||
| 10.08 | Registration Rights and Coordination Agreement, dated as of October 24, 2006, among West Corporation, THL Investors, Quadrangle Investors, Other Investors, Founders and Managers named therein (incorporated by reference to Exhibit 4.5 to Form 10-Q filed on November 9, 2006) | |||
| 10.09 | Restatement Agreement (the “Restatement Agreement”), dated as of October 5, 2010, by and among Wells Fargo Bank, National Association, as administrative agent, West Corporation (“West”), certain domestic subsidiaries of West and the lenders party thereto (Exhibit A, the Amended and Restated Credit Agreement, is included as Exhibit 10.10) (incorporated by reference to Exhibit 10.1 to Form 8-K filed October 6, 2010) | |||
| 10.10 | * | Amended and Restated Credit Agreement, dated as of October 5, 2010, by and among West, certain domestic subsidiaries of West, Wells Fargo Bank, National Association, as administrative agent, Deutsche Bank Securities Inc. and Bank of America, N.A., as syndication agents, Wells Fargo Bank, National Association and General Electric Capital Corporation, as co-documentation agents, Wells Fargo Securities, LLC and Deutsche Bank Securities Inc., as joint lead arrangers, Wells Fargo Securities, LLC and Deutsche Bank Securities Inc., as joint bookrunners, and the lenders party thereto, adopted pursuant to the Restatement Agreement | ||
II-5
Table of Contents
| Exhibit Number |
Description | |||
| 10.11 | Guarantee Agreement, dated as of October 24, 2006, among the guarantors identified therein and Lehman Commercial Paper Inc., as Administrative Agent (incorporated by reference to Exhibit 10.11 to Amendment No. 1 to Registration Statement on Form S-1 filed on November 6, 2009) | |||
| 10.12 | Indenture, dated as of October 5, 2010, among West, the guarantors named on the signature pages thereto and The Bank of New York Mellon Trust Company, N.A., as Trustee, with respect to the 8 5/8% senior notes due 2018 (incorporated by reference to Exhibit 10.3 to Form 8-K filed October 6, 2010) | |||
| 10.13 | Indenture, dated as of November 24, 2010, among West, the guarantors named on the signature pages thereto and The Bank of New York Mellon Trust Company, N.A., as Trustee, with respect to the 7 7/8% senior notes due 2019 (incorporated by reference to Exhibit 10.2 to Form 8-K filed November 24, 2010) | |||
| 10.14 | West Corporation Nonqualified Deferred Compensation Plan, as amended and restated effective December 29, 2011 (incorporated by reference to Exhibit 10.2 to Form 8-K dated January 3, 2012) (1) | |||
| 10.15 | Amendment Number One to the West Corporation Nonqualified Deferred Compensation Plan (incorporated by reference to Exhibit 10.16 to Form 10-K dated February 14, 2012) | |||
| 10.16 | Security Agreement, dated as of October 24, 2006, among West Corporation, The Other Grantors Identified therein and Lehman Commercial Paper Inc., as Administrative Agent (incorporated by reference to Exhibit 10.3 to Form 10-Q filed on November 9, 2006) | |||
| 10.17 | Intellectual Property Security Agreement, dated as of October 24, 2006, among West Corporation, The Other Grantors Identified therein and Lehman Commercial Paper Inc., as Administrative Agent (incorporated by reference to Exhibit 10.4 to Form 10-Q filed on November 9, 2006) | |||
| 10.18 | Deed of Trust, Assignment of Leases and Rents, Security Agreement and Financing Statement, dated October 24, 2006, from West Corporation, as Trustor to Chicago Title Insurance Company, as Trustee and Lehman Commercial Paper Inc., as Beneficiary (incorporated by reference to Exhibit 10.5 to Form 10-Q filed on November 9, 2006) | |||
| 10.19 | Deed of Trust, Assignment of Leases and Rents, Security Agreement and Financing Statement, dated October 24, 2006, from West Business Services, LP to Lehman Commercial Paper Inc. (incorporated by reference to Exhibit 10.6 to Form 10-Q filed on November 9, 2006) | |||
| 10.20 | Mortgage, Assignment of Leases and Rents, Security Agreement and Financing Statement, dated October 24, 2006, from West Telemarketing, LP to Lehman Commercial Paper Inc. (incorporated by reference to Exhibit 10.7 to Form 10-Q filed on November 9, 2006) | |||
| 10.21 | Management Agreement, dated as of October 24, 2006, among Omaha Acquisition Corp., West Corporation, Quadrangle Advisors II LLC, and THL Managers VI, LLC (incorporated by reference to Exhibit 10.8 to Form 10-Q filed on November 9, 2006) | |||
| 10.22 | Founders Agreement, dated October 24, 2006, among West Corporation, Gary L. West and Mary E. West (incorporated by reference to Exhibit 10.9 to Form 10-Q filed on November 9, 2006) | |||
| 10.23 | Stockholder Agreement, dated as of October 24, 2006, among West Corporation, THL Investors, Quadrangle Investors, Other Investors, Founders and Managers named therein (incorporated by reference to Exhibit 10.10 to Form 10-Q filed on November 9, 2006) | |||
| 10.24 | Form of Rollover Agreement (incorporated by reference to Exhibit 10.11 to Form 10-Q filed on November 9, 2006) | |||
| 10.25 | Form of West Corporation Restricted Stock Award and Special Bonus Agreement (incorporated by reference to Exhibit 10.13 to Form 10-Q filed on November 9, 2006) (1) | |||
| 10.26 | Form of Option Agreement (incorporated by reference to Exhibit 10.14 to Form 10-Q filed on November 9, 2006) (1) | |||
II-6
Table of Contents
| Exhibit Number |
Description | |||
| 10.27 | Form of Rollover Option Grant Agreement (incorporated by reference to Exhibit 10.15 to Form 10-Q filed on November 9, 2006) (1) | |||
| 10.28 | West Corporation Executive Retirement Savings Plan Amended and Restated Effective as of January 1, 2008 (incorporated by reference to Exhibit 10.29 to Form 10-K filed March 3, 2009) (1) | |||
| 10.29 | Amendment Number One to West Corporation’s 2006 Executive Incentive Plan (incorporated by reference to Exhibit 10.30 to Form 10-K dated February 23, 2011) (1) | |||
| 10.30 | Amendment Number Two to West Corporation’s 2006 Executive Incentive Plan (incorporated by reference to Exhibit 10.1 to Form 8-K dated January 3, 2012) | |||
| 10.31 | Supplemental Indenture, dated as of March 16, 2007, by and among CenterPost Communications, Inc., TeleVox Software, Incorporated, West At Home, LLC and The Bank of New York, to the Indenture, dated as of October 24, 2006, by and among West Corporation, the guarantors named therein and The Bank of New York, with respect to West Corporation’s $450.0 million aggregate principal amount of 11% senior subordinated notes due October 15, 2016 (incorporated by reference to Exhibit 99.2 to Form 8-K filed on March 30, 2007) | |||
| 10.32 | Supplemental Indenture, dated as of March 30, 2007, by and among SmartTalk, Inc. and The Bank of New York, to the Indenture, dated as of October 24, 2006, by and among West Corporation, the guarantors named therein and The Bank of New York, with respect to West Corporation’s $450.0 million aggregate principal amount of 11% senior subordinated notes due October 15, 2016 (incorporated by reference to Exhibit 99.4 to Form 8-K filed on March 30, 2007) | |||
| 10.33 | Supplemental Indenture, dated as of June 19, 2007, by and among Omnium Worldwide, Inc. and The Bank of New York, to the Indenture, dated as of October 24, 2006, by and among West Corporation, the guarantors named therein and The Bank of New York, with respect to West Corporation’s $450.0 million aggregate principal amount of 11% senior subordinated notes due October 15, 2016 (incorporated by reference to Exhibit 10.35 to Form 10-K dated March 3, 2009) | |||
| 10.34 | Supplemental Indenture, dated as of August 15, 2007, by and among West Business Services Corporation, West Telemarketing Corporation and The Bank of New York, to the Indenture, dated as of October 24, 2006, by and among West Corporation, the guarantors named therein and The Bank of New York, with respect to West Corporation’s $450.0 million aggregate principal amount of 11% senior subordinated notes due October 15, 2016 (incorporated by reference to Exhibit 10.37 to Form 10-K dated March 3, 2009) | |||
| 10.35 | Supplemental Indenture, dated as of June 12, 2008, by and among HBF Communications, Inc. and The Bank of New York, to the Indenture, dated as of October 24, 2006, by and among West Corporation, the guarantors named therein and The Bank of New York, with respect to West Corporation’s $450.0 million aggregate principal amount of 11% senior subordinated notes due October 15, 2016 (incorporated by reference to Exhibit 10.39 to Form 10-K dated March 3, 2009) | |||
| 10.36 | Supplemental Indenture, dated as of February 20, 2009, by and among Intrado Information Systems Holdings, Inc., Intrado Command Systems, Inc., Geo911, Inc., Positron Public Safety Systems Corp., Masys Corporation, West Corporation, and The Bank of New York, to the Indenture, dated as of October 24, 2006, by and among West Corporation, the guarantors named therein and The Bank of New York, with respect to West Corporation’s $450.0 million aggregate principal amount of 11% senior subordinated notes due October 15, 2016 (incorporated by reference to Exhibit 10.41 to Form 10-K dated March 3, 2009) | |||
II-7
Table of Contents
| Exhibit Number |
Description | |||
| 10.37 | Supplemental Indenture, dated as of January 25, 2010, by and among Worldwide Asset Purchasing, LLC, Stream57 Corporation, West Corporation, and The Bank of New York Mellon, to the Indenture, dated as of October 24, 2006, by and among West Corporation, the guarantors named therein and The Bank of New York, with respect to West Corporation’s $450.0 million aggregate principal amount of 11% senior subordinated notes due October 15, 2016 (incorporated by reference to Exhibit 10.44 to Form 10-K filed on February 12, 2010) | |||
| 10.38 | Amended and Restated Credit Agreement By and Between West Receivables Purchasing, LLC as Borrower, and TOGM, LLC, as Lender, dated as of April 30, 2009 (incorporated by reference to Exhibit 10.01 to Form 10-Q dated May 5, 2009) | |||
| 10.39 | Amended and Restated Servicing Agreement By and Among West Asset Management, Inc., as Servicer, West Receivables Purchasing, LLC, as Borrower, and TOGM, LLC, as Lender, dated as of April 30, 2009 (incorporated by reference to Exhibit 10.02 to Form 10-Q dated May 5, 2009) | |||
| 10.40 | Form of Promissory Note between West Receivables Purchasing, LLC and TOGM, LLC (incorporated by reference to Exhibit 10.03 to Form 10-Q dated May 5, 2009) | |||
| 10.41 | Amended and Restated Operating Agreement of West Receivables Purchasing, LLC between TOGM, LLC and West Receivables Services, Inc. dated April 30, 2009 (incorporated by reference to Exhibit 10.04 to Form 10-Q dated May 5, 2009) | |||
| 10.42 | Amended and Restated Restricted Stock Award and Special Bonus Agreement between West Corporation and Thomas Barker, dated as of May 4, 2009 (incorporated by reference to Exhibit 10.05 to Form 10-Q dated May 5, 2009) (1) | |||
| 10.43 | Employment Agreement between West Corporation and Steven M. Stangl, dated December 31, 2008 (incorporated by reference to Exhibit 10.5 to Form 8-K filed January 7, 2009 and Exhibit 10.41 to Form 10-K dated February 14, 2012) (1) | |||
| 10.44 | Agreement of Resignation, Appointment and Acceptance, dated as of April 8, 2010 by and among West Corporation, The Bank of New York Mellon, as prior trustee, and The Bank of New York Mellon Trust Company, N.A. as successor Trustee with respect to West Corporation’s $450.0 million aggregate principal amount of 11% senior subordinated notes due October 15, 2016 (incorporated by reference to Exhibit 10.03 to Form 10-Q dated May 7, 2010) | |||
| 10.45 | Supplemental Indenture, dated as of May 14, 2010, by and among West Unified Communications Services, LLC, West Corporation, and The Bank of New York Mellon Trust Company, N.A., to the Indenture, dated as of October 24, 2006, by and among West Corporation, the guarantors named therein and The Bank of New York with respect to West Corporation’s $450.0 million aggregate principal amount of 11% senior subordinated notes due October 15, 2016 (incorporated by reference to Exhibit 10.02 to Form 10-Q dated August 2, 2010) | |||
| 10.46 | Restructuring Agreement dated as of December 21, 2010, by and among TOGM, LLC, West Receivables Services, Inc. and West Receivables Purchasing, LLC (incorporated by reference to Exhibit 10.50 to Form 10-K dated February 23, 2011) | |||
| 10.47 | Form of Indemnification Agreement between West Corporation and its directors and officers (incorporated by reference to Exhibit 10.01 to Form 10-Q dated May 7, 2010) | |||
| 10.48 | ** | West Corporation 2012 Employee Stock Purchase Plan (1) | ||
| 10.49 | ** | West Corporation 2012 Long-Term Incentive Plan (1) | ||
| 10.50 | ** | West Corporation Executive Incentive Compensation Plan (1) | ||
II-8
Table of Contents
| Exhibit Number |
Description | |||
| 10.51 | Supplemental Indenture, dated as of April 21, 2011, by and among 760 Northlawn Drive, LLC, Twenty First Century International Services LLC, Twenty First Century Crisis Communications, LLC, Twenty First Century Communications, Inc., Twenty First Century Communications of Canada, Inc., InterCall Communications, Inc., West UC Solutions Holdings, Inc., West Corporation, and The Bank of New York Mellon Trust Company, N.A., to the Indenture, dated as of October 24, 2006, by and among West Corporation, the guarantors named therein and The Bank of New York, with respect to West Corporation’s $450.0 million aggregate principal amount of 11% senior subordinated notes due October 15, 2016 (incorporated by reference to Exhibit 10.01 to Form 10-Q dated May 3, 2011) | |||
| 10.52 | Supplemental Indenture, dated as of April 21, 2011, by and among 760 Northlawn Drive, LLC, Twenty First Century International Services LLC, Twenty First Century Crisis Communications, LLC, Twenty First Century Communications, Inc., Twenty First Century Communications of Canada, Inc., InterCall Communications, Inc., West UC Solutions Holdings, Inc., West Corporation, and The Bank of New York Mellon Trust Company, N.A., to the Indenture, dated as of October 5, 2010, by and among West Corporation, the guarantors named therein and The Bank of New York Mellon Trust Company, N.A., with respect to West Corporation’s $500.0 million aggregate principal amount of 8 5/8% senior notes due 2018 (incorporated by reference to Exhibit 10.02 to Form 10-Q dated May 3, 2011) | |||
| 10.53 | Supplemental Indenture, dated as of April 21, 2011, by and among 760 Northlawn Drive, LLC, Twenty First Century International Services LLC, Twenty First Century Crisis Communications, LLC, Twenty First Century Communications, Inc., Twenty First Century Communications of Canada, Inc., InterCall Communications, Inc., West UC Solutions Holdings, Inc., West Corporation, and The Bank of New York Mellon Trust Company, N.A., to the Indenture, dated as of November 24, 2010, by and among West Corporation, the guarantors named therein and The Bank of New York Mellon Trust Company, N.A., with respect to West Corporation’s $500.0 million aggregate principal amount of 7 7/8% senior notes due 2019 (incorporated by reference to Exhibit 10.03 to Form 10-Q dated May 3, 2011) | |||
| 10.54 | Amendment Number One to the West Corporation Stockholder Agreement dated as of April 12, 2011 by and among West Corporation, the THL Investors, the Quadrangle Investors and the Founders (incorporated by reference to Exhibit 10.04 to Form 10-Q dated May 3, 2011) | |||
| 10.55 | West Corporation Senior Management Retention Plan (incorporated by reference to Exhibit 10.1 to Form 8-K dated September 20, 2011) | |||
| 10.56 | Supplemental Indenture, dated as of September 1, 2011, by and among InterCall Communications, Inc., Holly Connects, Inc. and Unisfair, LLC, West Corporation, and The Bank of New York Mellon Trust Company, N.A., to the Indenture, dated as of October 24, 2006, by and among West Corporation, the guarantors named therein and The Bank of New York, with respect to West Corporation’s $450.0 million aggregate principal amount of 11% senior subordinated notes due October 15, 2016 (incorporated by reference to Exhibit 10.01 to Exhibit to Form 10-Q dated November 1, 2011) | |||
| 10.57 | Supplemental Indenture, dated as of September 1, 2011, by and among InterCall Communications, Inc., Holly Connects, Inc. and Unisfair, LLC, West Corporation, and The Bank of New York Mellon Trust Company, N.A., to the Indenture, dated as of October 5, 2010, by and among West Corporation, the guarantors named therein and The Bank of New York Mellon Trust Company, N.A., with respect to West Corporation’s $500.0 million aggregate principal amount of 8 5/8% senior notes due 2018 (incorporated by reference to Exhibit 10.01 to Exhibit to Form 10-Q dated November 1, 2011) | |||
II-9
Table of Contents
| Exhibit Number |
Description | |||
| 10.58 | Supplemental Indenture, dated as of September 1, 2011, by and among InterCall Communications, Inc., Holly Connects, Inc. and Unisfair, LLC, West Corporation, and The Bank of New York Mellon Trust Company, N.A., to the Indenture, dated as of November 24, 2010, by and among West Corporation, the guarantors named therein and The Bank of New York Mellon Trust Company, N.A., with respect to West Corporation’s $500.0 million aggregate principal amount of 7 7/8% senior notes due 2019 (incorporated by reference to Exhibit 10.01 to Exhibit to Form 10-Q dated November 1, 2011) | |||
| 10.59 | Amended and Restated Restricted Stock Award and Special Bonus Agreement between West Corporation and Todd B. Strubbe dated February 14, 2012 (incorporated by reference to Exhibit 10.40 to Form 10-K dated February 14, 2012) (1) | |||
| 21.01 | Subsidiaries (incorporated by reference to Exhibit 21.01 to Form 10-K dated February 14, 2012) | |||
| 23.01 | Consent of Deloitte & Touche LLP, independent registered public accounting firm | |||
| 23.02 | ** | Consent of Sidley Austin LLP (included as part of Exhibit 5.1) | ||
| 23.03 | Consent of Corporate Valuation Advisors, Inc. dated February 23, 2012 | |||
| 24.01 | * | Power of Attorney | ||
| 24.02 | * | Power of Attorney of Steven G. Felsher | ||
| (1) | Indicates management contract or compensation plan or arrangement. |
| * | Previously filed. |
| ** | To be filed by amendment. |
II-10