Attached files
| file | filename |
|---|---|
| 8-K - FORM 8-K - NEWMONT Corp /DE/ | v303572_8k.htm |
| EX-99.1 - EXHIBIT 99.1 - NEWMONT Corp /DE/ | v303572_ex99-1.htm |

Newmont Increases Gold Reserves ~6% to Record 99 Million Ounces; Copper Reserves Also a Record at ~10 Billion Pounds
DENVER, February 23, 2012 – Newmont Mining Corporation (NYSE: NEM) (“Newmont” or “the Company”) today announced it increased attributable gold reserves by 5.3 million ounces, net of depletion, to 98.8 million ounces in 2011. Highlights include:
| · | Record gold reserves of 98.8 million ounces, an increase of 5.6% from 2010; |
| · | Record copper reserves of 9.7 billion pounds, an increase of 3.2% from 2010; and |
| · | Reserves calculated at $1,200 per ounce and $3.00 per pound, respectively. |
“We are pleased to report a 6% increase in our gold reserves to a record 98.8 million ounces and a record 9.7 billion pounds of copper in 2011, highlighting the potential of our extensive land positions in each of our four operating regions,” commented Richard O’Brien, President and CEO. “Over the last 10 years, we have added an industry leading 85 million ounces of reserves through organic growth alone, more than offsetting the 75 million ounces of depleted reserves through production.”
North America was the largest contributor to higher gold and copper reserves in 2011, up 10% and 24%, respectively, as exploration activity drove increases in gold reserves at Carlin, Phoenix, and Turquoise Ridge, and copper reserves at Phoenix.
Reserve Sensitivity to Gold Price


Attributable gold Measured and Indicated non-reserve mineralization (“NRM”)1 for 2011 was 1.4 billion tons at an average grade of 0.019 ounces per ton, up from 1.3 billion tons at an average grade of 0.019 ounces per ton for 2010. In addition, attributable gold Inferred NRM was 650 million tons at an average grade of 0.024 ounces per ton. Attributable copper Measured and Indicated NRM for 2011 was 1.0 billion tons at an average grade of 0.14%, up from 849 million tons at a grade of 0.15% from 2010. In addition, attributable copper Inferred NRM was 410 million tons at an average grade of 0.15%. Gold and copper NRM were calculated using prices of $1,400 per ounce and $3.50 per pound, respectively. Total gold and copper NRM increased 12% and 9%, respectively, over 2010 on a contained metal basis. Attributable silver Measured and Indicated NRM for 2011 was 690 million tons at an average grade of 0.92 ounces per ton, with additional inferred NRM of 520 million tons at an average grade of 0.10 ounces per ton.
Exploration: 2011 Highlights and 2012 Planned Activity
Newmont’s 2011 exploration program produced strong results for a fourth consecutive year from more than 125 drill rigs and approximately 1.3 million meters of drilling. Drill programs focused on the entire resource pipeline and led to success in early-stage exploration while converting more than enough reserves to replace depletion. With more than 150 projects in 2011 and 175 projects in 2012, our exploration programs are gaining momentum and are designed to fully support our strategic growth plan not only to 2017, but also for years beyond.
Our North American region converted the largest gold reserve (6.2 million ounces) and NRM (5.5 million ounces) led by open pit expansions at Gold Quarry, Phoenix, and underground expansion at Turf-Leeville. We continue to expect strong exploration results from the North America region again in 2012 as we expect to declare the first NRM ounces at our newly acquired Long Canyon asset. Early stage exploration yielded very encouraging results at Long Canyon, Leeville, Carlin Mine area, Mike, Phoenix and Fiber Line, and we will further advance these opportunities in 2012. Outside Nevada in 2011 we have further built our land position and advanced our target generation programs in Mexico, Alaska and BC/Yukon that we expect to continue this effort as well as to complete some scout drilling in 2012.
Our South America region converted 0.25 million ounces of gold reserves and 0.97 million ounces of gold NRM primarily from the Conga region. A number of exploration targets have been generated at the Yanacocha district and are planned for drilling in 2012. A number of targets have also been generated in the Conga region that await development outcomes. Extensive infill drilling at the Merian project in Suriname is targeted to add reserves in 2012 while follow-up drill programs at the nearby Sabajo project are accelerating with promising results.
1 For detailed information on the Company’s year-end attributable Proven and Probable Reserves and Measured, Indicated and Inferred NRM, please refer to the Supplemental Information below and the cautionary statement at the end of this release.
| Page 2 of 9 |
Our Australia-Pacific region converted 2.3 million ounces of gold reserves and 1.6 million ounces of gold NRM with the largest contributions coming from our Callie underground mine in the Tanami and at KCGM. Jundee and Waihi drill programs added new underground mine life from surface and underground drill programs. Boddington successes were seen in early-stage work expected to be reflected in potentially new NRM in the near future. Each of these sites has significant exploration upside that we expect to aggressively test in 2012. Outside Australia, drill programs will accelerate at the Elang project in Indonesia and we will continue the target generation and scout-drilling in New Zealand, Papua New Guinea and Solomon Islands.
Our Africa region converted 2.8 million ounces of gold reserve and 2.0 million ounces of gold NRM primarily from Ahafo open pit layback expansions and from the Subika underground. Drill programs successfully expanded the wingspan of early-stage Subika underground mineralization and we began drilling extensions of the Apensu open pit. Early-stage exploration around Ahafo North demonstrated potential for additional open pit and underground mineralization near the existing reserve. Drill programs at Akyem suggest potential for underground mineralization that will be further explored in 2012. Future reserve and NRM growth looks promising and will be addressed by more than doubling the Ghanaian exploration budget in 2012. Outside Ghana we have a potential new discovery in Guinea and have scout-drilled a number of targets in Burkina Faso with encouraging results that will be followed up in 2012.
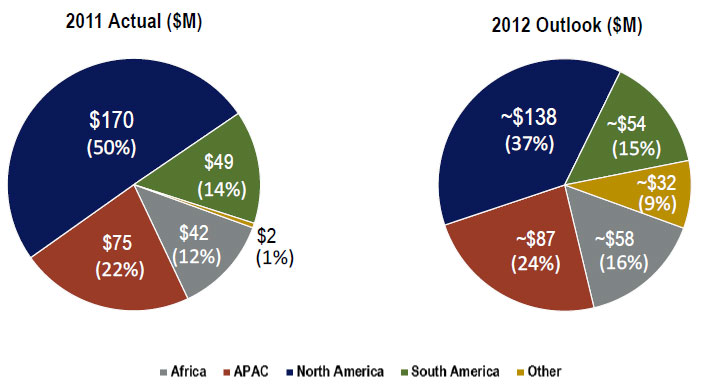
Newmont’s 2012 attributable exploration budget increased 9% over the prior year to $369 million with the largest portion assigned to North America (~$138 million). Budgets for 2012 in Australia-Pacific (~$87 million), Africa (~$58 million) and South America (~$54 million) have seen a significant increase relative to 2011 due to growth-related opportunities. Approximately $32 million is allocated to other strategic programs. Of the total attributable exploration budget, approximately two-thirds is expected to be directed towards brownfields exploration activity, with the balance of approximately one-third to be spent on greenfields programs.
Exploration Expenditure ($ Million)
| Page 3 of 9 |
Proven and probable reserves are based on extensive drilling, sampling, mine modeling and metallurgical testing from which we determined economic feasibility. Metal price assumptions follow SEC guidance not to exceed a three year trailing average. The price sensitivity of reserves depends upon several factors including grade, metallurgical recovery, operating cost, waste-to-ore ratio and ore type. Metallurgical recovery rates vary depending on the metallurgical properties of each deposit and the production process used. The reserve tables included in this release list the average metallurgical recovery rate for each deposit, which takes into account the relevant processing methods. The cut-off grade, or lowest grade of mineralized material considered economic to process, varies with material type, price, metallurgical recoveries, operating costs and co- or by-product credits. The proven and probable reserve figures presented herein are estimates based on information available at the time of calculation. No assurance can be given that the indicated levels of recovery of gold and copper will be realized. Ounces of gold or pounds of copper included in the proven and probable reserves are calculated without regard to any losses during metallurgical treatment. Reserve estimates may require revision based on actual production. Market fluctuations in the price of gold and copper, as well as increased production costs or reduced metallurgical recovery rates, could render certain proven and probable reserves containing relatively lower grades of mineralization uneconomic to exploit and might result in a reduction of reserves.
We publish reserves annually, and will recalculate reserves at December 31, 2012, taking into account metal prices, changes, if any, in future production and capital costs, divestments and depletion as well as any acquisitions and additions during 2012.
| Attributable Proven, Probable, and Combined Gold Reserves(1) | ||||||||||||||||||
| December 31, 2011 | December 31, 2010 | |||||||||||||||||
| Deposits/Districts by Reporting Unit | Proven Reserves | Probable Reserves | Proven
and Probable Reserves |
Metallurgical
Recovery |
Proven + Probable Reserves | |||||||||||||
| Newmont
Share |
Tonnage | Grade | Gold | Tonnage | Grade | Gold | Tonnage | Grade | Gold | Tonnage | Grade | Gold | ||||||
| (000 tons) | (oz/ton) | (000 ozs) | (000 tons) | (oz/ton) | (000 ozs) | (000 tons) | (oz/ton) | (000 ozs) | (000 tons) | (oz/ton) | (000 ozs) | |||||||
| North America | ||||||||||||||||||
| Carlin Open Pits, Nevada(2) | 100% | 92,600 | 0.058 | 5,410 | 239,100 | 0.030 | 7,210 | 331,700 | 0.038 | 12,620 | 77% | 263,600 | 0.043 | 11,320 | ||||
| Carlin Underground, Nevada | 100% | 11,300 | 0.271 | 3,070 | 6,700 | 0.300 | 2,020 | 18,000 | 0.282 | 5,090 | 86% | 14,600 | 0.307 | 4,480 | ||||
| Midas, Nevada | 100% | 300 | 0.315 | 80 | 500 | 0.177 | 80 | 800 | 0.226 | 160 | 95% | 600 | 0.319 | 190 | ||||
| Phoenix, Nevada | 100% | 24,900 | 0.018 | 460 | 422,200 | 0.016 | 6,790 | 447,100 | 0.016 | 7,250 | 72% | 329,800 | 0.018 | 6,090 | ||||
| Twin Creeks, Nevada | 100% | 10,600 | 0.097 | 1,020 | 37,700 | 0.073 | 2,760 | 48,300 | 0.078 | 3,780 | 80% | 57,800 | 0.076 | 4,390 | ||||
| Turquoise Ridge, Nevada(3) | 25% | 1,700 | 0.444 | 740 | 2,300 | 0.440 | 1,020 | 4,000 | 0.442 | 1,760 | 92% | 3,100 | 0.457 | 1,410 | ||||
| Nevada In-Process(4) | 100% | 23,000 | 0.020 | 460 | 0 | 0 | 23,000 | 0.020 | 460 | 65% | 28,500 | 0.022 | 610 | |||||
| Nevada Stockpiles(5) | 100% | 65,100 | 0.053 | 3,440 | 3,100 | 0.028 | 90 | 68,200 | 0.052 | 3,530 | 76% | 36,700 | 0.074 | 2,700 | ||||
| Total Nevada | 229,500 | 0.064 | 14,680 | 711,600 | 0.028 | 19,970 | 941,100 | 0.037 | 34,650 | 78% | 734,600 | 0.042 | 31,200 | |||||
| La Herradura, Mexico | 44% | 51,000 | 0.021 | 1,090 | 60,400 | 0.020 | 1,240 | 111,400 | 0.021 | 2,330 | 62% | 105,700 | 0.022 | 2,290 | ||||
| TOTAL NORTH AMERICA | 280,500 | 0.056 | 15,770 | 772,000 | 0.027 | 21,210 | 1,052,500 | 0.035 | 36,980 | 77% | 840,300 | 0.040 | 33,490 | |||||
| South America | ||||||||||||||||||
| Conga, Peru(6) | 51.35% | 0 | 0 | 303,400 | 0.021 | 6,460 | 303,400 | 0.021 | 6,460 | 75% | 317,200 | 0.019 | 6,080 | |||||
| Yanacocha Open Pits(7) | 51.35% | 34,200 | 0.050 | 1,710 | 85,700 | 0.022 | 1,860 | 119,900 | 0.030 | 3,570 | 72% | 142,300 | 0.031 | 4,440 | ||||
| Yanacocha In-Process(3) | 51.35% | 13,100 | 0.025 | 330 | 2,100 | 0.027 | 60 | 15,200 | 0.025 | 390 | 78% | 21,300 | 0.025 | 540 | ||||
| Total Yanacocha, Peru | 47,300 | 0.043 | 2,040 | 87,800 | 0.022 | 1,920 | 135,100 | 0.029 | 3,960 | 72% | 163,600 | 0.030 | 4,980 | |||||
| La Zanja, Peru(8) | 46.94% | 7,300 | 0.016 | 120 | 14,100 | 0.015 | 210 | 21,400 | 0.016 | 330 | 66% | 20,600 | 0.017 | 350 | ||||
| TOTAL SOUTH AMERICA | 54,600 | 0.040 | 2,160 | 405,300 | 0.021 | 8,590 | 459,900 | 0.023 | 10,750 | 73% | 501,400 | 0.023 | 11,410 | |||||
| Asia Pacific | ||||||||||||||||||
| Batu Hijau Open Pit(9) | 48.50% | 127,600 | 0.017 | 2,110 | 196,100 | 0.005 | 1,040 | 323,700 | 0.010 | 3,150 | 75% | 293,400 | 0.011 | 3,110 | ||||
| Batu Hijau Stockpiles(5)(9) | 48.50% | 0 | 0 | 156,900 | 0.003 | 490 | 156,900 | 0.003 | 490 | 70% | 170,700 | 0.004 | 610 | |||||
| Total Batu Hijau, Indonesia | 48.50% | 127,600 | 0.017 | 2,110 | 353,000 | 0.004 | 1,530 | 480,600 | 0.008 | 3,640 | 75% | 464,200 | 0.008 | 3,720 | ||||
| Boddington, Western Australia | 100% | 181,800 | 0.020 | 3,600 | 871,700 | 0.018 | 15,890 | 1,053,500 | 0.019 | 19,490 | 81% | 1,067,700 | 0.019 | 20,300 | ||||
| Duketon, Western Australia (10) | 16.85% | 2,000 | 0.044 | 90 | 8,800 | 0.045 | 400 | 10,800 | 0.045 | 490 | 95% | 6,300 | 0.055 | 350 | ||||
| Jundee, Western Australia | 100% | 3,100 | 0.160 | 490 | 700 | 0.237 | 160 | 3,800 | 0.174 | 650 | 91% | 4,700 | 0.160 | 750 | ||||
| Kalgoorlie Open Pit and Underground | 50% | 13,300 | 0.059 | 790 | 41,700 | 0.056 | 2,350 | 55,000 | 0.057 | 3,140 | 85% | 55,700 | 0.059 | 3,300 | ||||
| Kalgoorlie Stockpiles(5) | 50% | 53,900 | 0.023 | 1,260 | 0 | 0 | 53,900 | 0.023 | 1,260 | 78% | 15,100 | 0.031 | 470 | |||||
| Total Kalgoorlie, Western Australia | 50% | 67,200 | 0.030 | 2,050 | 41,700 | 0.056 | 2,350 | 108,900 | 0.040 | 4,400 | 83% | 70,900 | 0.053 | 3,780 | ||||
| Tanami, Northern Territories | 100% | 6,200 | 0.156 | 960 | 10,500 | 0.149 | 1,560 | 16,700 | 0.152 | 2,520 | 94% | 14,400 | 0.142 | 2,040 | ||||
| Waihi, New Zealand | 100% | 0 | 0 | 3,200 | 0.112 | 360 | 3,200 | 0.112 | 360 | 89% | 4,200 | 0.110 | 460 | |||||
| TOTAL ASIA PACIFIC | 387,900 | 0.024 | 9,300 | 1,289,600 | 0.017 | 22,250 | 1,677,500 | 0.019 | 31,550 | 82% | 1,632,300 | 0.019 | 31,400 | |||||
| Africa | ||||||||||||||||||
| Ahafo Open Pits(11) | 100% | 0 | 0 | 194,700 | 0.055 | 10,790 | 194,700 | 0.055 | 10,790 | 87% | 148,300 | 0.064 | 9,540 | |||||
| Ahafo Underground (12) | 100% | 0 | 0.000 | 0 | 5,900 | 0.11 | 660 | 5,900 | 0.112 | 660 | 89% | 0 | 0.000 | 0 | ||||
| Ahafo Stockpiles(5) | 100% | 21,000 | 0.030 | 630 | 0 | 0 | 21,000 | 0.030 | 630 | 86% | 14,100 | 0.033 | 460 | |||||
| Total Ahafo, Ghana | 100% | 21,000 | 0.030 | 630 | 200,600 | 0.057 | 11,450 | 221,600 | 0.055 | 12,080 | 87% | 162,400 | 0.062 | 10,000 | ||||
| Akyem, Ghana(13) | 100% | 0 | 0 | 144,500 | 0.051 | 7,390 | 144,500 | 0.051 | 7,390 | 88% | 137,900 | 0.052 | 7,200 | |||||
| TOTAL AFRICA | 21,000 | 0.030 | 630 | 345,100 | 0.055 | 18,840 | 366,100 | 0.053 | 19,470 | 87% | 300,300 | 0.057 | 17,210 | |||||
| TOTAL NEWMONT WORLDWIDE | 744,000 | 0.037 | 27,860 | 2,812,000 | 0.025 | 70,890 | 3,556,000 | 0.028 | 98,750 | 80% | 3,274,300 | 0.029 | 93,500 | |||||
| (1) | Reserves are calculated at a a gold price of US$1,200, A$1,250, or NZ$1,600 per ounce unless otherwise noted. 2010 reserves were calculated at a gold price of US$950, A$1,100, or NZ$1,350 per ounce unless otherwise noted. Tonnage amounts have been rounded to the nearest 100,000 unless they are less than 50,000, and gold ounces have been rounded to the nearest 10,000 |
| (2) | Includes reserves under development at the Emigrant deposits for combined total undeveloped reserves of 1.6 million ounces |
| (3) | Reserve estimates provided by Barrick, the operator of the Turquoise Ridge Joint Venture. |
| (4) | In-process material is the material on leach pads at the end of each year from which gold remains to be recovered. In-process material reserves are reported separately where tonnage or contained ounces are greater than 5% of the total site-reported reserves and contained ounces are greater than 100,000 |
| (5) | Stockpiles are comprised primarily of material that has been set aside to allow processing of higher grade material in the mills. Stockpiles increase or decrease depending on current mine plans. Stockpile reserves are reported separately where tonnage or contained ounces are greater than 5% of the total site-reported reserves and contained ounces are greater than 100,000 |
| (6) | Project is under development. |
| (7) | Reserves include the currently undeveloped deposit at La Quinua Sur, which contains reserves of 0.8 million attributable ounces |
| (8) | Reserves estimates were provided by Buenaventura, the operator of the La Zanja project. |
| (9) | Percentage reflects Newmont’s economic interest at December 31, 2011 |
| (10) | Reserve estimates provided by Regis Resources Ltd, in which Newmont holds a 16.85% interest. |
| (11) | Includes undeveloped reserves at Yamfo South, Yamfo Central, Techire West, Subenso South, Subenso North, Yamfo Northeast, and Susuan totaling 3.2 million ounces. |
| (12) | Subika Underground project is under development. |
| (13) | Project is under development. |
| Page 4 of 9 |
| Attributable Gold Mineralized Material Not in Reserves(1)(2) | |||||||||||||
| December 31, 2011 | |||||||||||||
| Deposits/Districts | Measured Material | Indicated Material | Measured
+ Indicated Material |
Inferred Material | |||||||||
| Newmont
Share |
Tonnage | Grade | Tonnage | Grade | Tonnage | Grade | Tonnage | Grade | |||||
| (000 tons) | (oz/ton) | (000 tons) | (oz/ton) | (000 tons) | (oz/ton) | (000 tons) | (oz/ton) | ||||||
| North America | |||||||||||||
| Buffalo Valley, Nevada | 70% | 0 | 0.000 | 16,500 | 0.019 | 16,500 | 0.019 | 2,900 | 0.014 | ||||
| Carlin Trend Open Pit, Nevada | 100% | 28,200 | 0.035 | 84,400 | 0.022 | 112,600 | 0.026 | 15,300 | 0.020 | ||||
| Carlin Trend Underground, Nevada | 100% | 4,700 | 0.221 | 2,900 | 0.272 | 7,600 | 0.241 | 1,300 | 0.264 | ||||
| Lone Tree Complex, Nevada | 100% | 0 | 2,200 | 0.023 | 2,200 | 0.023 | 5,000 | 0.016 | |||||
| Sandman, Nevada | 100% | 0 | 600 | 0.050 | 600 | 0.050 | 2,100 | 0.048 | |||||
| Midas, Nevada | 100% | 10 | 0.094 | 100 | 0.066 | 110 | 0.070 | 100 | 0.049 | ||||
| Phoenix, Nevada | 100% | 0 | 216,400 | 0.012 | 216,400 | 0.012 | 132,300 | 0.012 | |||||
| Twin Creeks, Nevada | 100% | 3,600 | 0.081 | 42,400 | 0.042 | 46,000 | 0.045 | 13,500 | 0.026 | ||||
| Turquoise Ridge (3), Nevada | 25% | 400 | 0.358 | 400 | 0.338 | 800 | 0.348 | 500 | 0.451 | ||||
| Nevada Stockpiles (4), Nevada | 100% | 3,100 | 0.039 | 3,100 | 0.039 | 2,300 | 0.043 | ||||||
| Total Nevada | 40,010 | 0.065 | 365,900 | 0.020 | 405,910 | 0.025 | 175,300 | 0.018 | |||||
| La Herradura, Mexico | 44% | 200 | 0.016 | 400 | 0.015 | 600 | 0.016 | 38,300 | 0.016 | ||||
| TOTAL NORTH AMERICA | 40,210 | 0.065 | 366,300 | 0.020 | 406,510 | 0.025 | 213,600 | 0.018 | |||||
| South America | |||||||||||||
| Conga, Peru | 51.35% | 0 | 89,300 | 0.012 | 89,300 | 0.012 | 130,500 | 0.011 | |||||
| Yanacocha, Peru | 51.35% | 7,000 | 0.015 | 18,400 | 0.017 | 25,400 | 0.016 | 106,100 | 0.023 | ||||
| Merian, Suriname | 50% | 0 | 28,900 | 0.039 | 28,900 | 0.039 | 18,400 | 0.036 | |||||
| La Zanja(5), Peru | 46.94% | 300 | 0.004 | 300 | 0.004 | 600 | 0.008 | 2,100 | 0.015 | ||||
| TOTAL SOUTH AMERICA | 7,300 | 0.014 | 136,900 | 0.018 | 144,200 | 0.018 | 257,100 | 0.018 | |||||
| Asia Pacific | |||||||||||||
| Batu Hijau (6), Indonesia | 48.50% | 3,400 | 0.018 | 157,400 | 0.007 | 160,800 | 0.008 | 37,300 | 0.002 | ||||
| Boddington, Western Australia | 100% | 25,100 | 0.012 | 493,400 | 0.014 | 518,500 | 0.013 | 53,100 | 0.016 | ||||
| Jundee, Western Australia | 100% | 0 | 700 | 0.194 | 700 | 0.194 | 1,000 | 0.224 | |||||
| Kalgoorlie, Western Australia | 50% | 6,100 | 0.035 | 17,200 | 0.032 | 23,300 | 0.033 | 300 | 0.078 | ||||
| Duketon (7), Western Australia | 16.85% | 1,260 | 0.030 | 6,200 | 0.026 | 7,460 | 0.000 | 15,200 | 0.024 | ||||
| Tanami, Northern Territory | 100% | 500 | 0.113 | 3,600 | 0.109 | 4,100 | 0.109 | 10,400 | 0.168 | ||||
| Waihi, New Zealand | 100% | 0 | 2,100 | 0.243 | 2,100 | 0.243 | 900 | 0.195 | |||||
| TOTAL ASIA PACIFIC | 36,360 | 0.019 | 680,600 | 0.014 | 716,960 | 0.014 | 118,200 | 0.029 | |||||
| Africa | |||||||||||||
| Ahafo Open Pit, Ghana | 100% | 0 | 91,200 | 0.037 | 91,200 | 0.037 | 44,300 | 0.042 | |||||
| Ahafo Underground, Ghana | 100% | 0 | 0 | 0 | 0.000 | 14,500 | 0.116 | ||||||
| Akyem, Ghana | 100% | 0 | 13,300 | 0.016 | 13,300 | 0.016 | 3,400 | 0.030 | |||||
| TOTAL AFRICA | 0 | 104,500 | 0.034 | 104,500 | 0.034 | 62,200 | 0.059 | ||||||
| TOTAL NEWMONT WORLDWIDE | 83,870 | 0.040 | 1,288,300 | 0.018 | 1,372,170 | 0.019 | 651,100 | 0.024 | |||||
| (1) | Mineralized material is reported exclusive of reserves |
| (2) | Mineralized Material calculated at a gold price of US$1,400, A$1,475, or NZ$1,850 per ounce unless otherwise noted. 2010 Mineralized material was calculated at a gold price of US$1150, A$1,350, or NZ$1,600 per ounce. Tonnage amounts have been rounded to the nearest 100,000 |
| (3) | Mineralized material estimates were provided by Barrick, the operator of the Turquoise Ridge Joint Venture. |
| (4) | Stockpiles are comprised primarily of material that has been set aside to allow processing of higher grade material in the mills. Stockpiles increase or decrease depending on current mine plans. |
| (5) | Mineralized material estimates were provided by Buenaventura, the operator of the La Zanja Project. |
| (6) | Percentage reflects Newmont's economic interest at December 31, 2011 |
| (7) | Mineralized material estimates provided by Regis Resources Ltd, in which Newmont holds a 16.85% interest |
| Page 5 of 9 |
| Attributable Copper Reserves(1) | ||||||||||||||||||
| December 31, 2011 | December 31, 2010 | |||||||||||||||||
| Proven Reserves | Probable Reserves | Proven + Probable Reserves | Proven + Probable Reserve | |||||||||||||||
| Deposits/Districts | Newmont Share |
Tonnage | Grade | Copper | Tonnage | Grade | Copper | Tonnage | Grade | Copper | Metallurgical | Tonnage | Grade | Copper | ||||
| (000 tons) | (Cu%) | (million pounds) |
(000 tons) | (Cu%) | (million pounds) |
(000 tons) | (Cu%) | (million pounds) | Recovery | (000 tons) | (Cu%) | (million pounds) | ||||||
| North America | ||||||||||||||||||
| Phoenix, Nevada | 100% | 24,900 | 0.15% | 70 | 425,400 | 0.15% | 1,230 | 450,300 | 0.15% | 1,300 | 61% | 332,600 | 0.15% | 1,030 | ||||
| Phoenix Copper Leach, Nevada (2) | 100% | 9,900 | 0.24% | 50 | 160,300 | 0.21% | 690 | 170,200 | 0.21% | 740 | 52% | 132,900 | 0.23% | 610 | ||||
| TOTAL NORTH AMERICA | 34,800 | 0.17% | 120 | 585,700 | 0.16% | 1,920 | 620,500 | 0.16% | 2,040 | 58% | 465,500 | 0.18% | 1,640 | |||||
| South America | ||||||||||||||||||
| Conga, Peru(3) | 51.35% | 0 | 0 | 303,400 | 0.28% | 1,690 | 303,400 | 0.28% | 1,690 | 85% | 317,200 | 0.26% | 1,660 | |||||
| TOTAL SOUTH AMERICA | 0 | 0 | 303,400 | 0.28% | 1,690 | 303,400 | 0.28% | 1,690 | 85% | 317,200 | 0.26% | 1,660 | ||||||
| Asia Pacific | ||||||||||||||||||
| Batu Hijau(3) | 48.50% | 127,600 | 0.51% | 1,300 | 196,100 | 0.35% | 1,370 | 323,700 | 0.41% | 2,670 | 76% | 293,400 | 0.44% | 2,560 | ||||
| Batu Hijau, Stockpiles(3)(4) | 48.50% | 0 | 0 | 156,900 | 0.34% | 1,060 | 156,900 | 0.34% | 1,060 | 66% | 170,700 | 0.35% | 1,200 | |||||
| Batu Hijau, Indonesia | 48.50% | 127,600 | 0.51% | 1,300 | 353,000 | 0.34% | 2,430 | 480,600 | 0.39% | 3,730 | 73% | 464,100 | 0.40% | 3,760 | ||||
| Boddington, Western Australia | 100.00% | 181,800 | 0.10% | 350 | 871,700 | 0.11% | 1,910 | 1,053,500 | 0.11% | 2,260 | 83% | 1,067,800 | 0.11% | 2,360 | ||||
| TOTAL ASIA PACIFIC | 309,400 | 0.27% | 1,650 | 1,224,700 | 0.18% | 4,340 | 1,534,100 | 0.20% | 5,990 | 77% | 1,531,900 | 0.20% | 6,120 | |||||
| TOTAL NEWMONT WORLDWIDE | 344,200 | 0.26% | 1,770 | 2,113,800 | 0.19% | 7,950 | 2,458,000 | 0.20% | 9,720 | 74% | 2,314,600 | 0.20% | 9,420 | |||||
| (1) | Reserves are calculated at US$3.00 or A$3.15 per pound copper price unless otherwise noted. 2010 reserves were calculated at US$2.50 or A$2.95 per pound copper price unless otherwise noted. Tonnage amounts have been rounded to the nearest 100,000 and pounds have been rounded to the nearest 10 million |
| (2) | Project is under development. Leach reserves are within Phoenix Reserve Pit |
| (3) | Project is under development. |
| (4) | Percentage reflects Newmont's economic interest at December 31, 2011 |
| (5) | Stockpiles are comprised primarily of material that has been set aside to allow processing of higher grade material. Stockpiles increase or decrease depending on current mine plans. Stockpiles are reported separately where tonnage or contained metal are greater than 5% of the total site reported reserves |
| Attributable Copper Mineralized Material Not in Reserves(1)(2) | |||||||||||||
| December 31, 2011 | |||||||||||||
| Deposits/Districts | Measured Material | Indicated Material | Measured + Indicated Material | Inferred Material | |||||||||
| Newmont
Share |
Tonnage | Grade | Tonnage | Grade | Tonnage | Grade | Tonnage | Grade | |||||
| (000 tons) | (Cu%) | (000 tons) | (Cu%) | (000 tons) | (Cu%) | (000 tons) | (Cu%) | ||||||
| North America | |||||||||||||
| Phoenix, Nevada | 100% | 0 | 0.00% | 216,400 | 0.09% | 216,400 | 0.09% | 132,300 | 0.10% | ||||
| Phoenix Copper Leach, Nevada | 100% | 0 | 0.00% | 14,100 | 0.20% | 14,100 | 0.20% | 54,100 | 0.20% | ||||
| TOTAL NORTH AMERICA | 230,500 | 0.10% | 230,500 | 0.10% | 188,700 | 0.13% | |||||||
| South America | |||||||||||||
| Conga, Peru | 51.35% | 0 | 0.00% | 89,300 | 0.19% | 89,300 | 0.19% | 130,480 | 0.19% | ||||
| TOTAL SOUTH AMERICA | 89,300 | 0.19% | 89,300 | 0.19% | 130,480 | 0.19% | |||||||
| Asia Pacific | |||||||||||||
| Batu Hijau, Indonesia (3) | 48.50% | 3,400 | 0.36% | 157,400 | 0.33% | 160,900 | 0.33% | 37,300 | 0.25% | ||||
| Boddington, Western Australia | 100.00% | 25,100 | 0.07% | 493,400 | 0.09% | 518,500 | 0.09% | 53,100 | 0.08% | ||||
| TOTAL ASIA PACIFIC | 28,500 | 0.10% | 650,800 | 0.15% | 679,400 | 0.15% | 90,400 | 0.15% | |||||
| TOTAL NEWMONT WORLDWIDE | 28,500 | 0.10% | 970,600 | 0.14% | 999,200 | 0.14% | 409,580 | 0.15% | |||||
| (1) | Mineralized material is reported exclusive of reserves |
| (2) | Mineralized material calculated at a copper price of US$3.50 or A$3.70 per pound unless otherwise noted. 2010 mineralized material was calculated at a copper price of US$3.00 or A$3.50 per pound. Tonnage amounts have been rounded to the nearest 100,000 |
| (3) | Percentage reflects Newmont's economic interest at December 31, 2011 |
| Page 6 of 9 |
| Attributable Proven, Probable, and Combined Silver Reserves(1) | |||||||||||||||
| December 31, 2011 | |||||||||||||||
| Deposits/Districts by Reporting Unit | Proven Reserves | Probable Reserves | Proven
and Probable Reserves |
Metallurgical Recovery | |||||||||||
| Newmont Share |
Tonnage | Grade | Silver | Tonnage | Grade | Silver | Tonnage | Grade | Silver | ||||||
| (000 tons) | (oz/ton) | (000 ozs) | (000 tons) | (oz/ton) | (000 ozs) | (000 tons) | (oz/ton) | (000 ozs) | |||||||
| North America | |||||||||||||||
| Midas, Nevada | 100% | 300 | 4.624 | 1,200 | 500 | 8.629 | 4,050 | 800 | 7.201 | 5,250 | 88% | ||||
| Phoenix, Nevada | 100% | 24,900 | 0.250 | 6,250 | 425,400 | 0.244 | 103,730 | 450,300 | 0.244 | 109,980 | 36% | ||||
| TOTAL NORTH AMERICA | 25,200 | 0.296 | 7,450 | 425,900 | 0.253 | 107,780 | 451,100 | 0.255 | 115,230 | 38% | |||||
| South America | |||||||||||||||
| Conga, Peru | 51.35% | 0 | 0 | 303,400 | 0.064 | 19,400 | 303,400 | 0.064 | 19,400 | 70% | |||||
| Yanacocha Open Pits | 51.35% | 18,500 | 0.081 | 1,490 | 71,100 | 0.137 | 9,750 | 89,600 | 0.125 | 11,240 | 25% | ||||
| Yanacocha Stockpiles (2) | 51.35% | 1,300 | 0.363 | 460 | 4,800 | 1.466 | 6,970 | 6,100 | 1.235 | 7,430 | 36% | ||||
| Yanacocha In-Process(3) | 51.35% | 0 | 0 | 59,500 | 0.485 | 28,840 | 59,500 | 0.485 | 28,840 | 12% | |||||
| Total Yanacocha, Peru | 19,800 | 0.099 | 1,950 | 135,400 | 0.337 | 45,560 | 155,200 | 0.306 | 47,510 | 19% | |||||
| TOTAL SOUTH AMERICA | 19,800 | 0.099 | 1,950 | 438,800 | 0.148 | 64,960 | 458,600 | 0.146 | 66,910 | 34% | |||||
| Asia Pacific | |||||||||||||||
| Batu Hijau Open Pit(4) | 48.50% | 127,600 | 0.047 | 5,940 | 196,100 | 0.023 | 4,470 | 323,700 | 0.032 | 10,410 | 78% | ||||
| Batu Hijau Stockpiles(2)(4) | 48.50% | 0 | 0 | 156,900 | 0.015 | 2,430 | 156,900 | 0.015 | 2,430 | 72% | |||||
| Total Batu Hijau, Indonesia | 48.50% | 127,600 | 0.047 | 5,940 | 353,000 | 0.020 | 6,900 | 480,600 | 0.027 | 12,840 | 76% | ||||
| TOTAL ASIA PACIFIC | 127,600 | 0.047 | 5,940 | 353,000 | 0.020 | 6,900 | 480,600 | 0.027 | 12,840 | 76% | |||||
| TOTAL NEWMONT WORLDWIDE | 172,600 | 0.089 | 15,340 | 1,217,700 | 0.148 | 179,640 | 1,390,300 | 0.140 | 194,980 | 39% | |||||
| (1) | Reserves are calculated at a a silver price of US$22.00, A$23.00, or NZ$29.00 per ounce unless otherwise noted. 2010 reserves were calculated at a silver price of US$15.00, A$17.50, or NZ$21.50 per ounce unless otherwise noted. Tonnage amounts have been rounded to the nearest 100,000 unless they are less than 50,000, and gold ounces have been rounded to the nearest 10,000 |
| (2) | In-process material is the material on leach pads at the end of each year from which gold remains to be recovered. In-process material reserves are reported separately where tonnage or contained ounces are greater than 5% of the total site-reported reserves and contained ounces are greater than 100,000 |
| (3) | Stockpiles are comprised primarily of material that has been set aside to allow processing of higher grade material in the mills. Stockpiles increase or decrease depending on current mine plans. Stockpile reserves are reported separately where tonnage or contained ounces are greater than 5% of the total site-reported reserves and contained ounces are greater than 100,000 |
| (4) | Percentage reflects Newmont’s economic interest at December 31, 2011 |
| Attributable Silver Mineralized Material Not in Reserves(1)(2) | |||||||||||||
| December 31, 2011 | |||||||||||||
| Deposits/Districts | Measured Material | Indicated Material | Measured
+ Indicated Material |
Inferred Material | |||||||||
| Newmont Share |
Tonnage | Grade | Tonnage | Grade | Tonnage | Grade | Tonnage | Grade | |||||
| (000 tons) | (oz/ton) | (000 tons) | (oz/ton) | (000 tons) | (oz/ton) | (000 tons) | (oz/ton) | ||||||
| North America | |||||||||||||
| Sandman, Nevada | 100% | 0 | 600 | 0.238 | 600 | 0.238 | 2,100 | 0.167 | |||||
| Midas, Nevada | 100% | 0 | 1.719 | 100 | 4.762 | 100 | 4.352 | 100 | 9.560 | ||||
| Phoenix, Nevada | 100% | 0 | 216,400 | 0.173 | 216,400 | 0.173 | 132,300 | 0.197 | |||||
| Phoenix Stockpiles (3), Nevada | 100% | 9,900 | 0.423 | 196,000 | 0.051 | 205,900 | 0.069 | 230,300 | 0.075 | ||||
| TOTAL NORTH AMERICA | 9,900 | 0.425 | 413,100 | 0.116 | 423,000 | 0.123 | 364,800 | 0.123 | |||||
| South America | |||||||||||||
| Conga, Peru | 51.35% | 0 | 0 | 89,300 | 0.047 | 89,300 | 0.047 | 99,100 | 0.033 | ||||
| Yanacocha, Peru | 51.35% | 5,100 | 0.423 | 11,400 | 0.083 | 16,500 | 0.188 | 19,200 | 0.292 | ||||
| TOTAL SOUTH AMERICA | 5,100 | 0.423 | 100,700 | 0.051 | 105,800 | 0.069 | 118,300 | 0.075 | |||||
| Asia Pacific | |||||||||||||
| Batu Hijau (4), Indonesia | 48.50% | 3,400 | 0.039 | 157,400 | 0.026 | 160,800 | 0.026 | 37,300 | 0.015 | ||||
| TOTAL ASIA PACIFIC | 3,400 | 0.039 | 157,400 | 0.026 | 160,800 | 0.026 | 37,300 | 0.015 | |||||
| TOTAL NEWMONT WORLDWIDE | 18,400 | 0.353 | 671,200 | 0.085 | 689,600 | 0.092 | 520,400 | 0.104 | |||||
| (1) | Mineralized material is reported exclusive of reserves |
| (2) | Mineralized Material calculated at a silver price of US$26.00, A$27.50, or NZ$34.50 per ounce unless otherwise noted. 2010 Mineralized material was calculated at a gold price of US$18.00, A$21.00, or NZ$25.50 per ounce. Tonnage amounts have been rounded to the nearest 100,000 |
| (3) | Stockpiles are comprised primarily of material that has been set aside to allow processing of higher grade material in the mills. Stockpiles increase or decrease depending on current mine plans. |
| (4) | Percentage reflects Newmont's economic interest at December 31, 2011 |
| Page 7 of 9 |
To view more detailed financial disclosure, including regional mine statistics, Results of Consolidated Operations, Liquidity and Capital Resources, Management’s Discussion & Analysis, relevant Risk Factors, and a complete outline of the 2011 Operating and Financial guidance by region, please see the Company’s Annual Report on Form 10-K, filed with the Securities and Exchange Commission on February 23, 2012, available at www.newmont.com.
Newmont Mining Corporation (NYSE: NEM) announced it will report Fourth Quarter and Year-End 2011 results after the market closes on Thursday, February 23, 2012. A conference call will be held on Friday, February 24 at 10:00 a.m. Eastern Time (8:00 a.m. Mountain Time); it will also be carried on the Company’s website.
| Conference Call Details | ||
| Dial-In Number | 888.566.1822 | |
| Intl Dial-In Number | 312.470.7116 | |
| Leader | John Seaberg | |
| Passcode | Newmont | |
| Replay Number | 866.396.4180 | |
| Intl Replay Number | 203.369.0506 | |
| Replay Passcode | 2012 | |
| Webcast Details | ||
| URL | http://services.choruscall.com/links/newmont120224.html | |
| Investor Contacts | ||
| John Seaberg | 303.837.5743 | john.seaberg@newmont.com |
| Karli Anderson | 303.837.6049 | karli.anderson@newmont.com |
| Media Contacts | ||
| Omar Jabara | 303.837.5114 | omar.jabara@newmont.com |
| Diane Reberger | 303.967.9455 | diane.reberger@newmont.com |
Cautionary Statement Regarding Forward-Looking Statements: This release contains “forward-looking statements” within the meaning of Section 27A of the Securities Act of 1933, as amended, and Section 21E of the Securities Exchange Act of 1934, as amended which are intended to be covered by the safe harbor created by such sections and other applicable laws. Such forward-looking statements may include, without limitation: (i) estimates of future mineral production and sales; (ii) estimates of future costs applicable to sales; (iii) estimates of future capital expenditures and consolidated advanced projects, research and development expenditures; and (iv) expectations regarding the development, growth and exploration potential of the Company’s projects. Estimates or expectations of future events or results are based upon certain assumptions, which may prove to be incorrect. Such assumptions, include, but are not limited to: (i) there being no significant change to current geotechnical, metallurgical, hydrological and other physical conditions; (ii) permitting, development, operations and expansion of the Company’s projects being consistent with current expectations and mine plans; (iii) political, social and legal developments in any jurisdiction in which the Company operates being consistent with its current expectations; (iv) certain exchange rate assumptions for the Australian dollar to the U.S. dollar, as well as other the exchange rates being approximately consistent with current levels; (v) certain price assumptions for gold, copper and oil; (vi) prices for key supplies being approximately consistent with current levels; and (vii) the accuracy of our current mineral reserve and mineral resource estimates. Where the Company expresses or implies an expectation or belief as to future events or results, such expectation or belief is expressed in good faith and believed to have a reasonable basis. However, such statements are subject to risks, uncertainties and other factors, which could cause actual results to differ materially from future results expressed, projected or implied by the “forward-looking statements”. Such risks include, but are not limited to, gold and other metals price volatility, currency fluctuations, increased production costs and variances in ore grade or recovery rates from those assumed in mining plans, political and operational risks in the countries in which we operate, and governmental regulation and judicial outcomes. For a more detailed discussion of such risks and other factors, see the Company’s 2011 Annual Report on Form 10-K, filed on February 24, 2012, with the Securities and Exchange Commission, as well as the Company’s other SEC filings. The Company does not undertake any obligation to release publicly revisions to any “forward-looking statement,” including, without limitation, outlook, to reflect events or circumstances after the date of this news release, or to reflect the occurrence of unanticipated events, except as may be required under applicable securities laws. Investors should not assume that any lack of update to a previously issued “forward-looking statement” constitutes a reaffirmation of that statement. Continued reliance on “forward-looking statements” is at investors' own risk.
| Page 8 of 9 |
Cautionary Statement regarding Reserves and NRM: Ian Douglas, Newmont’s Group Executive of Reserves, is the qualified person responsible for the preparation of the Reserve and NRM estimates in this presentation. The Reserves disclosed in this presentation have been prepared in compliance with Industry Guide 7 published by the SEC. As used in this news release, the term “Reserve” means that part of a mineral deposit that can be economically and legally extracted or produced at the time of the reserve determination. The term “economically,” as used in this definition, means that profitable extraction or production has been established or analytically demonstrated in a full feasibility study to be viable and justifiable under reasonable investment and market assumptions. The term “legally,” as used in this definition, does not imply that all permits needed for mining and processing have been obtained or that other legal issues have been completely resolved. However, for a reserve to exist, Newmont must have a justifiable expectation, based on applicable laws and regulations, that issuance of permits or resolution of legal issues necessary for mining and processing at a particular deposit will be accomplished in the ordinary course and in a timeframe consistent with Newmont’s current mine plans. Reserves in this news release may be aggregated from the Proven and Probable classes. As used in this news release, the term ”non-reserve mineralization” or “NRM” refers to Measured, Indicated and/or Inferred materials, which are exclusive of reserves. Newmont has determined that such NRM would be substantively the same as those prepared using the Guidelines established by the Society of Mining, Metallurgy and Exploration and defined as Resources. Estimates of NRM are subject to further exploration and development, are subject to additional risks, and no assurance can be given that they will eventually convert to future Mineral Reserves of the company. In addition, our current or future reserves and exploration and development projects may not result in new mineral producing operations. Even if significant mineralization is discovered and converted to reserves, it will likely take many years from the initial phases of exploration to development and ultimately to production, during which time the economic feasibility of production may change. Additionally, references to “attributable ounces,” “attributable pounds” and “attributable mineralization” in this news release are intended to mean that portion of gold or copper produced, sold or included in Proven and Probable Reserves or NRM that is attributable to our ownership or economic interest.
| Page 9 of 9 |