Attached files
| file | filename |
|---|---|
| EX-31.1 - RULE 13A-14(A) CERTIFICATION (CEO) - LoopNet, Inc. | d268090dex311.htm |
| EX-10.13 - FORM OF AMENDMENT TO OPTION AGREEMENT UNDER THE 2001 STOCK OPTION AND PURCHASE - LoopNet, Inc. | d268090dex1013.htm |
| EXCEL - IDEA: XBRL DOCUMENT - LoopNet, Inc. | Financial_Report.xls |
| EX-32.2 - SECTION 1350 CERTIFICATION (CFO) - LoopNet, Inc. | d268090dex322.htm |
| EX-32.1 - SECTION 1350 CERTIFICATION (CEO) - LoopNet, Inc. | d268090dex321.htm |
| EX-31.2 - RULE 13A-14(A) CERTIFICATION (CFO) - LoopNet, Inc. | d268090dex312.htm |
| EX-23.1 - CONSENT OF ERNST & YOUNG LLP, INDEPENDENT REGISTERED PUBLIC ACCOUNTING FIRM - LoopNet, Inc. | d268090dex231.htm |
Table of Contents
UNITED STATES SECURITIES AND EXCHANGE COMMISSION
Washington, D.C. 20549
Form 10-K
(Mark One)
| þ | ANNUAL REPORT PURSUANT TO SECTION 13 OR 15(d) OF THE SECURITIES EXCHANGE ACT OF 1934 |
For the fiscal year ended December 31, 2011
OR
| ¨ | TRANSITION REPORT PURSUANT TO SECTION 13 OR 15(d) OF THE SECURITIES EXCHANGE ACT OF 1934 |
For the transition period from to
Commission file number: 000-52026
LOOPNET, INC.
(Exact name of registrant as specified in its charter)
| Delaware | 77-0463987 | |
| (State or other jurisdiction of incorporation or organization) |
(I.R.S. Employer Identification No.) |
185 Berry Street, Suite 4000
San Francisco, CA 94107
(Address of principal executive offices)
(415) 243-4200
(Registrant’s telephone number, including area code)
N/A
(Former name, former address and former fiscal year, if changed since last report)
Securities registered pursuant to Section 12(b) of the Act:
| Title of Class |
Name of Each Exchange on Which Registered | |
| Common Stock | The NASDAQ Stock Market LLC |
Securities registered pursuant to Section 12(g) of the Act:
N/A
Indicate by check mark if the registrant is a well-known seasoned issuer, as defined in Rule 405 of the Securities Act. Yes ¨ No þ
Indicate by check mark if the registrant is not required to file reports pursuant to Section 13 or Section 15(d) of the Exchange Act. Yes ¨ No þ
Indicate by check mark whether the registrant (1) has filed all reports required to be filed by Section 13 or 15(d) of the Exchange Act during the preceding 12 months (or for such shorter period that the registrant was required to file such reports), and (2) has been subject to such filing requirements for the past 90 days. Yes þ No ¨
Indicate by check mark whether the registrant has submitted electronically and posted on its corporate Web site, if any, every Interactive Data file required to be submitted and posted pursuant to Rule 405 of Regulation S-T during the preceding 12 months (or for such shorter period that the registrant was required to submit and post such files). Yes þ No ¨
Indicate by check mark if disclosure of delinquent filers pursuant to Item 405 of Regulation S-K is not contained herein, and will not be contained, to the best of registrant’s knowledge, in definitive proxy or information statements incorporated by reference in Part III of this Form 10-K or any amendment to this Form 10-K. þ
Indicate by check mark whether the registrant is a large accelerated filer, an accelerated filer, a non-accelerated filer, or a smaller reporting company. See the definitions of “large accelerated filer,” “accelerated filer” and “smaller reporting company” in Rule 12b-2 of the Exchange Act. (Check one):
| Large accelerated filer ¨ | Accelerated filer þ | Non-accelerated filer ¨ | Smaller reporting company ¨ | |||
| (Do not check if a smaller reporting company) |
Indicate by check mark whether the registrant is a shell company (as defined in Rule 12b-2 of the Exchange Act). Yes ¨ No þ
The aggregate market value of the voting and non-voting common equity held by non-affiliates of the registrant was approximately $384,732,733 as of the last business day of the registrant’s most recently completed second fiscal quarter, based upon the closing sale price on the Nasdaq Global Select Market reported for such date. Shares of common stock held by each officer and director and by certain other persons that may be deemed to be affiliates have been excluded. This determination of affiliate status is not necessarily a conclusive determination for other purposes.
There were 35,243,417 shares of the registrant’s common stock issued and outstanding as of February 16, 2012.
DOCUMENTS INCORPORATED BY REFERENCE
Items 10, 11, 12, 13, and 14 of Part III incorporate by reference information from the Registrant’s Proxy Statement to be filed with the Securities and Exchange Commission in connection with the solicitation of proxies for the Registrant’s 2012 Annual Meeting of Stockholders.
Table of Contents
2
Table of Contents
SPECIAL NOTE REGARDING FORWARD-LOOKING STATEMENTS
This Annual Report on Form 10-K, including the sections entitled “Business,” “Risk Factors” and “Management’s Discussion and Analysis” includes forward-looking statements within the meaning of Section 27A of the Securities Act of 1933, as amended, and Section 21E of the Securities Exchange Act of 1934, as amended. All statements other than statements of historical facts contained in this report, including statements regarding our future financial position, business strategy and plans and objectives of management for future operations, are forward-looking statements. The words “believe,” “may,” “should,” “could,” “estimate,” “continue,” “anticipate,” “intend,” “expect,” “plan,” “potential,” “predict” and similar expressions, as they relate to us, are intended to identify forward-looking statements. Forward-looking statements contained in this report include, but are not limited to, statements relating to:
| • | our pending acquisition by CoStar Group, Inc. including the status of the pending regulatory review and approval of the transaction; |
| • | our future financial results; |
| • | our future advertising and marketing activities; |
| • | our future investments in technology, new products and services or companies; and |
| • | trends in the commercial real estate market and the general economy. |
We have based these forward-looking statements largely on our current expectations and projections about future events and financial trends that we believe may affect our financial condition, results of operations, business strategy and financial needs. These forward-looking statements are subject to a number of risks, uncertainties and assumptions, including those described in “Risk Factors” in Item 1A of Part I. No forward-looking statement is a guarantee of future performance and you should not place undue reliance on any forward-looking statement.
In light of these risks, uncertainties and assumptions, the forward-looking events and circumstances discussed in this report may not occur and actual results could differ materially from those anticipated or implied in the forward-looking statements. You should read this report and the documents we reference in this report with the understanding that our actual future results, financial performance and events and circumstances may be materially different from what we expect. Except as otherwise required by law, we undertake no obligation to update or revise any forward-looking statement contained in this report and you should not expect us to.
TRADEMARKS AND TRADE NAMES
“LoopNet,” “BizBuySell,” “LoopLink,” “Cityfeet,” “LandAndFarm,” “Reaction Web,” “BizQuest” and “LandsofAmerica” are our registered trademarks in the United States. We also use the marks “Property Comps,” “Property Facts” and “ProspectList.” This annual report on Form 10-K also includes trademarks, trade names and service marks of other companies. Use or display by us of other parties’ trademarks, trade names or service marks is not intended to and does not imply a relationship with, or endorsement or sponsorship of us by, these other parties.
3
Table of Contents
| Item 1. | Business. |
Pending Merger
On April 27, 2011, LoopNet, Inc. (“we,” the “Company” or “LoopNet”) entered into an Agreement and Plan of Merger (the “Merger Agreement”) with CoStar Group, Inc., a Delaware corporation (“CoStar”) under which the LoopNet will become a wholly-owned subsidiary of CoStar (the “Merger”). If the Merger is consummated, each outstanding share of our common stock will be converted into the right to receive a unit consisting of (i) $16.50 in cash, without interest, and (ii) 0.03702 shares of CoStar common stock. As previously disclosed, the holders of our Series A Preferred Stock have delivered contingent conversion notices to us pursuant to which such shares will be converted into common stock immediately prior to, and contingent upon, the completion of the Merger. On July 11, 2011, our stockholders adopted the Merger Agreement at a special meeting of the stockholders.
Completion of the Merger remains subject to the expiration or termination of the waiting period imposed by the Hart-Scott Rodino Antitrust Improvement Act of 1976 as amended (the “HSR Act”), and satisfaction or waiver of the other closing conditions specified in the Merger Agreement. Both we and CoStar filed notification and report forms with the Department of Justice and the United States Federal Trade Commission (the “FTC”) pursuant to the HSR Act on May 31, 2011. As previously announced, on June 30, 2011, we and CoStar each received a request for additional information (commonly referred to as a “second request”) from the FTC with respect to the proposed Merger. As previously announced, on October 26, 2011, at the request of the FTC, we and CoStar agreed to extend the waiting period imposed by the HSR Act from 30 to 60 days after the date of substantial compliance with the second request, which was certified by us and CoStar on November 4, 2011. As previously disclosed on January 3, 2012, we and CoStar voluntarily agreed to extend the waiting period imposed by the HSR Act on a 45-day rolling basis to allow us to continue to engage in discussions with the FTC to determine whether there is a possible basis for, and to discuss the possible terms of, a mutually acceptable consent order that would allow the Merger to close. If either we and CoStar, on the one hand, or the FTC Staff, on the other hand, believes that discussions towards a possible consent order are no longer moving forward productively, either may trigger commencement of the 45-day period, in writing, after the expiration of which the waiting period imposed by the HSR Act will expire, unless extended voluntarily by the parties or terminated sooner by the FTC. In addition, we and CoStar have agreed to extend the date after which either we or Costar may individually elect to terminate the Merger Agreement to April 30, 2012. While there can be no assurance that agreement on the terms of a possible consent order can be reached in a timely manner or at all, we and CoStar believe the discussions with the FTC Staff are currently proceeding constructively and we are hopeful that they will in the near term result in an agreement with the FTC Staff on the terms of such a consent order, subject to FTC approval.
General
LoopNet was incorporated under the laws of the state of California on June 2, 1997, and was reincorporated as a Delaware corporation in May, 2006.
We own and operate the leading online marketplace for commercial real estate in the United States, based on the number of monthly unique visitors to our marketplace, which averaged approximately 2.0 million during 2011, compared with approximately 1.5 million during 2010, and approximately 985,000 during 2009, as reported by comScore Media Metrix. comScore Media Metrix defines a unique visitor as an individual who visited any content of a website, a category, a channel, or an application. Our online marketplace, available at www.LoopNet.com, enables commercial real estate agents, working on behalf of property owners and landlords, to list properties for sale or for lease and submit detailed information on property listings including qualitative descriptions, financial and tenant information, photographs and key property characteristics, in order to find a buyer or tenant. Commercial real estate agents, buyers and tenants use the LoopNet online marketplace to search for available property listings that meet their commercial real estate criteria. By connecting the sources of commercial real estate supply and demand in an efficient manner, we believe that our online marketplace enables commercial real estate participants to initiate and complete more transactions more cost-effectively than through other means. As of December 31, 2011, the LoopNet online marketplace contained 820,391 listings.
4
Table of Contents
To access significant portions of the LoopNet online marketplace, users must become registered members. Registration requires that a user create a user record, which includes basic contact information such as name and a working email address, and also requires that a user accept our Terms of Service. Basic membership is available free-of-charge, and enables members to experience some of the benefits of the LoopNet marketplace, with limited functionality. LoopNet premium membership is available for a monthly subscription fee and provides enhanced marketing exposure for property listings and full access to search LoopNet property listings, as well as numerous other features. The minimum term of a premium membership subscription is one month, with discounts available for quarterly or annual subscriptions. A customer choosing to cancel a discounted quarterly or annual subscription will receive a refund based on the number of months remaining on the subscription, but may be subject to an adjustment according to the monthly rate rather than the discounted rate. As of December 31, 2011, we had more than 5.5 million registered members, of which 73,550 were premium members.
We believe that our information services help our commercial real estate customers make better business decisions in less time, by providing more transparency into the trends and details of specific regions, property types, properties, and transactions. For example, Property Comps, formally known as Recent Sales allows our customers to access historical sale transaction information on more than one million commercial properties nationwide. In addition, Property Facts, formally known as Property Database, a new product introduced in 2010, aggregates data from the LoopNet marketplace, LoopNet research, leading independent data providers, public records, and LoopNet members, to deliver valuable data on more than 27 million properties in the United States. Key property-specific information present in Property Facts may include owner and tenant details; mortgage and lender histories; tax records and assessed values; historical listing information; property details and photos; and, asking price and asking rent trends, among others.
Other meaningful sources of our revenue include BizBuySell and BizQuest, online marketplaces for operating businesses for sale; LoopLink, a property marketing search engine that more than 1,000 commercial real estate organizations have embedded in their Web sites; the REApplications product suite, which offers automated software for managing market research including property inventory, listings and comparables, commission management, customer relationship management (CRM), project tracking and transaction management; and, the sale of advertising and sponsorships on our Web site to parties who are seeking to market products or services to the LoopNet registered member base.
Additional information regarding our business’ seasonality is included in “Item 7 — Management’s Discussion and Analysis of Financial Condition and Results of Operations.”
Industry Background
The commercial real estate industry encompasses real estate asset types such as office, industrial, retail, multi-family, hotel, storage and land for development. According to the United States Commerce Department’s Bureau of Economic Analysis, the total value of private nonresidential structures in the United States was approximately $11 trillion as of 2011.
Much like the residential real estate industry, the commercial real estate industry relies primarily on brokers and agents who facilitate sales and leasing transactions for a commission. According to Reuters, the commercial real estate brokerage and management industry in the United States generated approximately $35 billion in combined revenue in 2011. This brokerage system is highly fragmented and, according to Reuters, the top fifty commercial real estate brokerage firms accounted for approximately 25% of industry revenue in 2011.
In most cases, commercial real estate agents associated with both small and large brokerage firms operate as independent contractors, make decisions for property marketing strategies, and seek cost-effective means to market their property listings. We believe that the majority of transactions in the industry are small and are consummated by local independent brokers.
According to the Association of Real Estate License Law Officials, there are approximately 3.0 million licensed real estate professionals in the United States, including commercial and residential real estate agents.
In addition to the brokerage community, industry participants include tenants, owners, property investors and business operators, all of which are actively involved in commercial real estate transactions. Commercial office, industrial, and retail properties are often occupied by operating businesses, which are generally either
5
Table of Contents
rent-paying tenants or owners of those properties. According to the Small Business Administration, in 2006 there were approximately 6.0 million operating businesses classified as “employers” and there were another 21.7 million operating businesses which were classified as “non-employers,” such as small family-owned and -operated businesses. We also believe that there are a large number of private investors who actively participate in commercial real estate transactions.
The traditional processes for marketing commercial real estate are inefficient. Traditionally, agents working on behalf of commercial real estate sellers and landlords market their property listings through methods such as word of mouth in the brokerage community, signage placed directly on buildings for sale or with space for lease, availability lists that are printed and shared among brokerage firms, advertisements placed in print media including newspapers and other publications, direct mail campaigns and emails sent to private distribution lists.
Similarly, the process of searching for properties available for sale or for lease has been inefficient. Unlike the residential real estate industry, which is served by local multiple listing services or other central local databases of residential real properties available for sale, there has not been an equivalent listing service in the commercial real estate or operating business for sale industries. As a result, compiling a comprehensive and reliable collection of current for sale or for lease property listings has been a slow and expensive process for individual commercial real estate participants, requiring significant resources and often resulting in inaccurate and incomplete information.
Traditional methods of gathering commercial real estate information have also been inefficient. The industry’s size, fragmentation, and structure have made the collection, sharing, and dissemination of information inconsistent and difficult. As a result, industry participants often spend considerable amounts of time and money gathering, organizing, and analyzing data on commercial real estate transactions and properties. In addition, many of these efforts are ultimately duplicative with those being undertaken by other industry participants.
The LoopNet Model
We provide an online marketplace that efficiently connects commercial real estate supply and demand. Our marketplace enables agents working on behalf of commercial real estate owners and landlords to list properties for sale or for lease. We provide tools that allow property listers to proactively contact potential buyers and tenants seeking specific types of properties. Similarly, we enable commercial real estate agents, buyers and tenants to search for available property listings that meet their criteria, such as price range, location, building size and property type. Individuals that search for and find properties that meet their requirements on our marketplace are able to contact and connect with the listing party and initiate a commercial real estate transaction such as a property purchase or lease. We offer property searchers access to a large number of available property listings that would be difficult and costly to compile through traditional means. We also enable property listers to cost-effectively reach a large number of buyers and tenants. We believe that the LoopNet online marketplace enables our members to initiate and complete more commercial real estate transactions more cost-effectively than through other means.
The key attributes of our business model include:
Scale in our commercial real estate online marketplace. We believe we have aggregated a critical mass of commercial real estate agents, property owners, landlords, buyers, tenants and for sale or for lease property listings. As of December 31, 2011, the LoopNet marketplace had approximately 5.5 million registered members; 73,550 premium members; and, was visited by approximately 2.0 million unique visitors per month, on average, during 2011, as reported by comScore Media Metrix. In aggregate, our commercial real estate marketplace contained 820,391 listings of available for sale and for lease properties, as of December 31, 2011, and, during the year ended December 31, 2011, visitors to this marketplace viewed property profiles on our website approximately 330 million times. We believe this critical mass of commercial real estate industry participants and properties listed for-sale or for-lease creates a cycle that helps us to continue to grow our member base and expand our online marketplace. Commercial real estate agents, property owners and landlords are attracted to LoopNet as a result of the large number of potential buyers and tenants, who in turn are attracted to our marketplace by the broad selection of properties listed on our marketplaces.
6
Table of Contents
Expansive member-generated content offering. The majority of our for-sale and for-lease property listings are submitted by our members through our website, using our online tools. We enable members to provide detailed content on a property listing including description, financial and tenant information, photographs and key property characteristics. We automatically compile this content into an interactive property profile that is available to our members when they search for properties on our website. We believe that the content provided in our property profiles is more comprehensive, up-to-date and useful than the information provided in traditional commercial real estate property listings, such as newspaper and magazine ads or property signs. In addition, we believe that using member-generated property listings has allowed us to grow our online marketplace more efficiently and cost-effectively than if we had compiled the listings on our own.
Compelling member experience. Our marketplace is accessible at any time and we believe it is an intuitive, easy-to-use online service. Upon registering as a member, an owner or agent working for the owner can list properties on the service, and buyers and tenants can search for property listings quickly and easily. Properties are searchable immediately upon listing by our members. Basic members can list and search the properties for free. Our members can sign up to receive an email with updated listings that meet their criteria on a daily or weekly basis. We also offer several online tools that facilitate the communication between parties who are seeking to make a commercial real estate transaction. For example, a premium member that has listed a property can use our ProspectList feature to email other members who have searched for similar properties on our website. Members searching for properties are able to use our MyLoopNet feature to store multiple property profiles online to better organize their search process and find the property that is right for them. To assist members further, we offer member support via email and phone.
We also provide our customers with single-source access to business-critical information, through our Property Comps and Property Facts offerings. Property Comps provides our customers with access to historical sale transaction information on more than one million commercial properties nationwide, while our Property Facts, delivers valuable data on more than 27 million properties in the United States, including such things as owner and tenant details; mortgage and lender histories; tax records and assessed values; historical listing information; and, property details and photos. We also provide asking price and asking rent trends by region and property-type. We believe these information services complement the commercial real estate marketplace that we operate, by helping our customers make better-informed, more rapid decisions about specific commercial real estate properties, transactions, and business strategies.
In addition to our LoopNet marketplace, we also operate BizBuySell and BizQuest, online marketplaces that enable business owners, sellers and brokers to list and search for operating businesses for sale. We believe that the operating business market is complementary in several ways to the commercial real estate market. In many cases, owners or brokers who are seeking to sell a business are also selling the commercial real estate associated with the business, and business owners are active participants in the commercial real estate market as both buyers and tenants. In addition, many commercial real estate agents also function as business brokers. We believe that BizBuySell and BizQuest benefit operating business owners, sellers and brokers by providing efficient online marketplaces to connect and initiate transactions.
The LoopNet Advantage
We developed our marketplace to address the needs of commercial real estate agents and the property owners, landlords, buyers and tenants they represent.
Benefits to Property Listers
Broad marketing exposure. Our online marketplace offers commercial real estate agents and the owners and landlords they represent an efficient way to market properties available for sale or for lease. Properties listed on our website gain exposure to our large audience of members who are interested in commercial real estate opportunities. The size and geographic breadth of our marketplace and member base enables property listers to realize marketing benefits for listings on both a local and national level. We believe that the marketing exposure provided by a property listing on our marketplace is superior to traditional commercial real estate marketing methods, such as newspapers ads and newsletters, and enables our members to complete more sale and lease transactions in a more efficient manner.
7
Table of Contents
Cost-effective and measurable marketing method. We believe that the LoopNet online marketplace is more cost effective and accountable than traditional methods for marketing commercial real estate properties. Premium members are able to use our reporting tools to track and monitor the marketing exposure of their property listings and receive a marketing statistics email that indicates the number of times a property profile has been viewed. We believe that the low cost of a monthly premium membership and the features and measurability of our product offering is superior to commercial real estate marketing alternatives.
Detailed and up-to-date property listing information. Our marketplace allows our members to provide significantly more information on a real-time basis than they typically can provide using traditional commercial real estate marketing methods. For example, when submitting a property listing, a member may choose to include files containing detailed financial spreadsheets, descriptive brochures or hyperlinks to other information. We offer a set of online tools and services that facilitate the submission and verification of commercial real estate property listing information, and we provide additional information relating to the property such as detailed location and demographic data and aerial and satellite imagery. In addition, our online marketplace enables members to update their property listings. These updates are immediately available on our marketplace, ensuring that the property listings provide the most comprehensive and timely information.
Benefits to Property Searchers
Access to a large number of detailed and up-to-date property listings. Our online commercial real estate marketplace contained 820,391 property listings as of December 31, 2011, primarily from the United States. The listings in our marketplaces include all major asset types, such as office, industrial, retail, land and multi-family properties of all sizes. Moreover, our marketplaces allow our members to update their listings and provide significantly more information on a real-time basis. We believe that commercial real estate agents, brokers, buyers, and tenants benefit from the easy, anytime access we provide to an expansive, detailed selection of up-to-date property listings.
Single-source access to business-critical information. Our online commercial real estate marketplace and information services offer our customers easy, anytime access to substantial volumes of content on commercial real estate properties throughout the United States. Through our marketplace, our customers gain access to a large selection of properties currently available for-sale and for-lease. Through our information services, our customers may gain access to historical sale transaction information; owner and tenant details; mortgage and lender histories; tax records and assessed values; historical listing information; property details and photos; and, asking price and asking rent trends by region and property-type. We believe our data sets are more comprehensive, up-to-date, and useful than independently collected commercial property and transaction data, facilitating better-informed, more rapid decisions.
Customized search engine. We have designed our online marketplace to be easy to use and navigate. Commercial real estate agents, buyers and tenants use our proprietary commercial real estate search engine to quickly find properties in our marketplace that meet their criteria. Members can search based on a number of commercial real estate industry-specific variables including property type and sub-type, location, size, price range and key word. We believe that offering a customized search engine makes our website easier to use for our members and allows them to derive more value from our online marketplace.
Products and Services
Our products and services facilitate the sale and lease of commercial real estate by enabling industry participants to list and find properties on our online marketplace and to contact and transact with one another. Through our online marketplace, commercial real estate agents working on behalf of sellers and landlords can list their properties for sale or for lease along with detailed qualitative descriptions, quantitative specifications, photographs and diagrams. Buyers and tenants of commercial real estate and their agents can perform highly targeted searches and review the property listings on our online marketplace. By addressing the needs of commercial real estate industry participants, we believe that we have built the leading online commercial real estate marketplace.
8
Table of Contents
Our customers access the LoopNet, LandsofAmerica, LandAndFarm, BizBuySell and BizQuest online marketplaces through the following product and service offerings:
Basic and premium membership. We offer two types of memberships on the LoopNet marketplace. Basic membership is available free-of-charge to anyone who registers at our website, and enables members to experience some of the benefits of the LoopNet offering, with limited functionality. LoopNet premium membership is available for a monthly subscription fee and provides enhanced marketing exposure for property listings and full access to LoopNet property listings, as well as numerous other features. Our fee for our LoopNet premium membership averaged $66.39 per month during 2011. The minimum term of a premium membership subscription is one month.
We also offer quarterly and annual subscriptions which are priced and discounted accordingly, and paid in advance for the subscription period. A customer choosing to cancel a discounted quarterly or annual subscription will receive a refund based on the number of months remaining on the subscription, but may be subject to an adjustment according to the monthly rate rather than the discounted rate. Premium membership provides members with maximum marketing exposure for property listings and full access to LoopNet property listings, as well as numerous other features provided on our marketplace. We believe that the benefits provided by a premium membership enable premium members to initiate and complete more commercial real estate transactions. The following table illustrates some of the key features of basic and premium membership:
| Basic | Premium | |||
| Membership |
Membership | |||
| Listing Benefits |
||||
| Detailed Property Listings |
ü | ü | ||
| MyLoopNet — Listing Management Center |
ü | ü | ||
| Enhanced Listing Exposure |
ü | |||
| ProspectList — Lead Generation |
ü | |||
| Marketing Exposure Statistics |
ü | |||
| Controlled Access Marketing |
ü |
| Basic | Premium | |||
| Membership |
Membership | |||
| Searching Benefits |
||||
| Listings Search Engine |
ü | ü ü | ||
| MyLoopNet — Searching Management Center |
ü | ü | ||
| Enhanced Listings Access |
ü | |||
| PropertyAlert — Email Alerts of New Listings |
Weekly | Daily | ||
| Reporting and Map-Based Presentations |
ü | |||
| MapSearch |
ü | ü |
| • | Property listing. Our property listing service allows customers to quickly and easily submit listings on properties available for sale or for lease, enabling them to reach a large audience of commercial real estate transaction participants. All listings submitted to the LoopNet online marketplace are processed through a listing quality assessment mechanism. Members can submit an unlimited number of listings and include detailed property listing information, including building description, financial and tenant information, photographs and key property characteristics. Our service automatically compiles this information into a professional-quality online brochure. |
| • | MyLoopNet-Listing Management Center. Members can use MyLoopNet to manage various features of their LoopNet membership, including managing their listings and tracking the exposure their property profiles have received. |
| • | Enhanced Listing Exposure. Property listings submitted by basic members can only be viewed by premium members. Property listings submitted by premium members are available for viewing by all registered members and have premium placement on search results. |
| • | ProspectList. Premium members have exclusive access to ProspectList, a reverse lookup search function that enables property listers to market listings to specific agents, buyers and tenants who have posted their property purchase or lease criteria on LoopNet and requested that they be contacted with property listings that match those criteria. |
9
Table of Contents
| • | Marketing Exposure Statistics. Premium members have access in MyLoopNet to various statistics on the number of exposures being generated for their listings on LoopNet. |
| • | Controlled Access Marketing. Premium members can use Controlled Access Marketing to password-protect their listings. For example, a premium member might choose to limit access to a property listing such that searchers can only access the listing details after agreeing to a confidentiality agreement with the listing agent. |
| • | Property searching. We developed our property search engine specifically for the commercial real estate market. Members use our proprietary search engine to identify properties available for sale or for lease on our online marketplace that meet their criteria. Members can search for properties based on a broad scope of commercial real estate specifications, including property type and sub-type, location, building and lot size, and price range. Members can also search using map-based geographic searching combined with various property listing attributes, including a keyword search capability. |
| • | MyLoopNet — Searching Management Center. Members can use MyLoopNet to manage various features of their LoopNet membership, including saving links to multiple property profiles and detailed search parameters for future use. Members can also use MyLoopNet to specify the criteria for PropertyAlert emails. |
| • | Enhanced Listings Access. Basic members are able to view summary details of their search results but can only view property profiles submitted by premium members. Premium members have full access to all property listings and profiles. |
| • | PropertyAlert. Members can use PropertyAlert to receive email alerts with new property listings that meet their selection criteria. Premium members receive email alerts daily, while basic members receive email alerts weekly. |
| • | Reporting and Map-Based Presentations. Premium members can automatically generate professional-quality reports and maps of properties they have selected to use for presentations to clients and interested parties. |
| • | MapSearch. Members have access to MapSearch, an interactive and dynamic aerial and satellite image map interface for property searches. |
LoopLink. LoopLink is an online real estate marketing and database services suite that enables commercial real estate firms to showcase their available properties both on the LoopNet marketplace and on the brokerage firm’s own website using our hosted search software. Within LoopNet, each LoopLink listing is branded with the client’s logo and is hyperlinked to the client’s website. Additionally, the LoopLink service provides customizable, branded property search and results screens that can be integrated into the client’s website. The LoopNet import service offers the opportunity to simplify the process of submitting listings to LoopNet from the client’s internal databases, and features advanced data matching and data integrity rules and file conversion capabilities. We charge a monthly subscription fee to commercial real estate firms for the LoopLink service. Key features of LoopLink include comprehensive reporting and listing administration tools, a searchable and seamlessly integrated professional directory, property mapping for geographic and feasibility analysis, thumbnail photos and expanded property descriptions in search results.
Property Comps. Property Comps is a comprehensive nationwide database of recent commercial real estate transactions collected from sales initiated through our online marketplace and from third party information providers. Our Property Comps service enables property searchers to review precedent sales data to inform commercial real estate valuation analysis based on asset type, asking and sale price, sale date, property address and size. Property Comps is available for a monthly subscription or on a per-property-record basis.
Property Facts. Property Facts aggregates data from the LoopNet marketplace, LoopNet research, leading independent data providers, public records, and LoopNet members, to deliver valuable data on more than 27 million properties in the United States. Key property-specific information present in Property Facts may include owner and tenant details; mortgage and lender histories; tax records and assessed values; historical listing information; property details and photos; and, asking price and asking rent trends, among others. Property Facts is currently available for a monthly subscription fee.
10
Table of Contents
Advertising and lead generation. Our large base of registered members represents an attractive marketing opportunity for parties who are in sectors related to the commercial real estate industry. We provide advertising and lead generation services which can be used, for example, to generate enhanced marketing exposure for a property listed for sale or for lease, general branding exposure for a particular party or service provider, or sales leads for specific service providers such as commercial mortgage lenders. Advertisers using our services pay fees based on 1) the number of ad impressions, 2) the number of clickthroughs for an ad, or 3) the leads that we provide to them from an ad. The market for our advertising products is comprised of any party wishing to advertise services to our community of registered members who are participating in commercial real estate and operating business for sale transactions.
Land-for-Sale. LandsofAmerica and LandAndFarm are online marketplaces for rural land for sale. Sellers pay a fee to list their land for sale, and interested buyers can search our listings for free.
Business-for-Sale. BizBuySell and BizQuest are online marketplaces for operating businesses for sale. Business sellers pay a fee to list their operating businesses for sale, and interested buyers can search our listings for free. The BizBuySell and BizQuest Franchise Directories allow interested business buyers to search hundreds of franchise opportunities, and franchisors can list their availabilities in the directory on a cost per lead basis.
REApplications. REApplications (“REApps”) provides a comprehensive integrated suite of commercial brokerage automation software. REApps’ products are focused exclusively on serving the needs of the commercial real estate sector and are web-based, available on-demand on a hosted basis, eliminating the need to install software. The REApps product suite includes core functions for managing market research including property inventory, listings & comparables, commission management, customer relationship management (CRM), project tracking and transaction management.
Sales and Marketing
The main objectives of our sales and marketing department are to increase our base of LoopNet registered members, to build awareness among our members for our suite of products and services and to convert basic members to premium members, Property Comps members and Property Facts members. In addition, some of our sales professionals focus on a specific product, such as our LoopLink service. We also have a team dedicated to selling our advertising products.
Our marketing team is responsible for generating new registered members. Our primary source of new registered members is word-of-mouth referrals. We use direct marketing and online and traditional advertising to market to potential members. Our direct marketing program includes direct mail, email and outbound telesales campaigns that are designed to deliver targeted messages to prospective members about our products and services. Our online advertising consists primarily of paid search marketing. We also sponsor and attend local industry association events, and participate in industry trade shows and conferences to engage with existing LoopNet members, identify potential new members and build brand awareness with key member constituents such as commercial real estate agents or property investors.
Our sales team is responsible for identifying and qualifying new customer prospects, responding to inbound sales inquires, selling our products and services, identifying cross-selling and education opportunities, and assisting with product training. In addition, our sales team is responsible for building internal and external awareness related to new product offerings.
Our sales team is also responsible for converting our basic members to premium members, Property Comps members and Property Facts members. We believe that encouraging basic members to use our products and services is a highly effective way to promote premium membership. We also communicate the value of our products and services to our basic members through targeted direct marketing including permission-based email and telemarketing.
Our customer and account services staff is responsible for ensuring customer satisfaction by providing high quality and tailored customer support. We solicit feedback from our customers to assess and understand market trends, provide training and demonstrations, build awareness for our products and identify new product opportunities. We believe that providing a high level of customer service is an important element of our member retention program.
11
Table of Contents
Competition
The markets in which we operate are highly competitive and fragmented, with limited barriers to entry in certain segments. We face competition from a variety of sources with respect to our different product offerings.
Because there is no comprehensive national commercial real estate multiple listing service, customers use all of the traditional practices used by the commercial real estate industry. These include print brochures created by listing agents that are mailed and distributed by hand; “current availabilities” lists printed and shared among brokerage firms; signage on properties; email brochures distributed to private distribution lists; word of mouth in the brokerage community; and newspaper advertisements. We believe that these practices do not create an efficient mechanism to market, search or compare property listings locally or nationally.
The National Association of REALTORS ® or NAR, its local boards of REALTORS ® , its various affiliates, and third party technology services providers such as ePropertyData, Xceligent, Inc. and Catylist, Inc., have created local, regional or national commercial real estate information and listing services. These services provide commercial real estate for sale and for lease property listings, and transaction comparables, which compete directly with our online commercial real estate marketplace services.
Several companies, such as Property Line, Inc., BuildingSearch.com, RealUp, CoStar Group, and Rofo.com, have created online property listing services that compete with us. These companies aggregate property listings obtained through various sources, including from commercial real estate agents. In addition, newspapers generally include on their websites classified listings of commercial real estate for sale and for lease.
Companies such as eBay, craigslist, Oodle, Move.com, Trulia and Vast provide commercial real estate listing or advertising services in addition to a wide variety of other products or services. eBay, Oodle and craigslist operate real estate listing services which include commercial real estate and operating businesses. Other large internet companies, such as Google, Yahoo! and Microsoft, have classified listing services which could be used to market and search for commercial real estate property listings.
There are several providers of commercial real estate information services and analytical products that compete with various LoopNet products and services. These include CoStar Group, CoreLogic, Real Capital Analytics, Reis, Inc., Axiometrics, IPD and Torto Wheaton Research. Providers of public records data offer products and services which also compete directly or indirectly with various LoopNet information services products. In addition, many brokerage and appraisal firms maintain their own proprietary research operations which they may utilize instead of the information services provided by LoopNet or other third party providers.
There are several large, nationally-known providers of information services to multiple industry verticals, including Thomson Reuters, Reed Elsevier, Bloomberg and McGraw-Hill, which provide information services to various segments of the commercial real estate sector today. While these firms are not directly competitive with LoopNet today, they have either expressed interest in, or have the resources to develop and bring to market, products which compete more directly with our products.
In the market for technology-enabled marketing and transaction services, we compete with a variety of providers, including Real Capital Markets, Peracon, QuickSpace, Property Line, MindMatrix, Informetrics and Catylist.
In the land for sale sector, we compete with a broad array of online marketplaces, including LandWatch, Land.Net, LandFlip and Homes & Land, as well as local and regional multiple listing services which provide land listings. In the market for operating businesses for sale and franchise opportunities, we similarly compete with a wide variety of online marketplaces and marketing services, including BusinessesForSale.com and Landmark Interactive.
Technology and Infrastructure
We have developed proprietary software that facilitates the listing and searching of commercial properties and businesses for sale or for lease on our marketplaces. The LoopNet marketplace is built primarily on Microsoft technology, utilizing the Microsoft.Net framework and Microsoft SQL Server. The system has been specifically built to provide capacity scaling through the addition of server and network hardware without making
12
Table of Contents
software changes. The system is secure, and important components have redundancy. Tape backups are performed daily and the tapes are rotated to a secure, offsite facility. Static website content is cached at locations across the United States to maximize website speed throughout the country.
Our primary website is hosted in a co-location facility in Los Angeles, California. A secondary, backup facility is maintained in a co-location facility in San Francisco, California. The backup system provides complete client functionality and business critical internal functionality with capacity to operate the business in the event of a catastrophic event affecting the Los Angeles facility. Listing data updates are sent to the backup system on a regular basis to minimize data loss in the event of a primary site failure. Both facilities are earthquake-resistant and have physical access security, environmental controls, and internal power generation capabilities.
Some business units utilize Unix technology built on RedHat Enterprise Linux and Apache web service in addition to our other technologies. Additionally, we utilize data centers in Virginia, Texas and Colorado for specific services. All of these datacenters have security, environmental, and backup controls equivalent to our primary datacenter.
As part of our normal business operations, we collect and utilize personal information. The use of all personal information is governed by our Terms and Conditions, which are posted on the website. Additionally, the use of personal information is reviewed and certified annually by TRUSTe.
We take steps to protect the personal information we collect and use. All personal information collected is stored in our databases. Access to this information by internal users is protected and controlled by network passwords. Our company has written policies and procedures that our employees must follow to protect against compromising the security of the personal information we collect and maintain, and we communicate those policies and procedures regularly to our employees. Additionally, access to our network, and consequently to the databases, is protected by an industry standard firewall. External access to the network is tested monthly by a third-party security consultant (AmbironTrustWave) for vulnerabilities. All database servers and related equipment are maintained in physically secured environments with access limited to operations personnel only. Data backups are also maintained in a physically secured offsite location with controlled access.
An additional level of protection is implemented for financially sensitive personal information. Information such as credit card numbers is stored on our databases in an encrypted format. This encryption is intended to ensure that anyone gaining access to our servers will still be unable to obtain sensitive information.
Our technology and product development expenses were $10.7 million, $12.2 million, and $17.0 million in 2009, 2010, and 2011, respectively.
Intellectual Property
We rely on a combination of trademark, copyright and trade secret laws in the United States as well as contractual provisions to protect our proprietary technology and our brand. We currently have trademarks registered or pending in the United States for our name and certain words and phrases that we use in our business. We also rely on copyright laws to protect computer programs relating to our websites and our proprietary technologies, although to date we have not registered for copyright protection. We have registered numerous Internet domain names related to our business in order to protect our proprietary interests. We also enter into confidentiality and invention assignment agreements with our employees and consultants and confidentiality agreements with other third parties, and we actively monitor access to our proprietary technology.
Protecting our intellectual property rights is costly and time-consuming. From time to time, we may encounter disputes over rights and obligations concerning our intellectual property. Also, the efforts we have taken to protect our proprietary rights may not be sufficient or effective. Any significant impairment of our intellectual property rights could harm our business, our brand and reputation, and our ability to compete.
Employees
As of December 31, 2011, we had 354 employees. None of our employees are covered by a collective bargaining agreement. We have never experienced employment-related work stoppages and we consider our employee relations to be good.
13
Table of Contents
Executive Officers
The following table sets forth information about our executive officers as the date hereof.
| Name |
Age | Position | ||
| Richard J. Boyle, Jr. |
46 | Chief Executive Officer and Chairman of the Board of Directors | ||
| Brent Stumme |
49 | Chief Financial Officer and Senior Vice President, Finance and Administration | ||
| Thomas Byrne |
45 | President and Chief Operating Officer | ||
| Jason Greenman |
44 | Chief Strategy Officer and Senior Vice President, Corporate Development | ||
| Wayne Warthen |
48 | Chief Technology Officer and Senior Vice President, Information Technology | ||
| Michael Handelsman |
45 | Senior Vice President and Group General Manager, Marketplace Verticals | ||
| Frederick Saint |
46 | Senior Vice President, Product and Business Development | ||
| Bryan Smith |
45 | Senior Vice President, Sales and Services |
Richard J. Boyle, Jr. has served as our Chief Executive Officer, and Director from July, 2001, and Chairman of the Board of Directors since February, 2006. Mr. Boyle also served as our President from July, 2001 through January, 2008. Prior to being named our President, Chief Executive Officer, and Director, Mr. Boyle was Vice President of LoopNet in charge of product and technology development and operations from December 1999 to July 2001. Prior to joining LoopNet, Mr. Boyle was Senior Vice President of Products & Technology at Risk Management Solutions. Mr. Boyle holds a B.S. in Electrical Engineering from Stanford University.
Thomas Byrne has served as President and Chief Operating Officer since January, 2008. Mr. Byrne also served as Chief Marketing Officer and Vice President, Marketing and Sales since 2002 and Senior Vice President, Marketing and Sales since February, 2006. Prior to joining LoopNet, Mr. Byrne served as Group Vice President of NextCard, a credit card company. Mr. Byrne holds a B.S. of Electrical Engineering, with highest honors, from Georgia Tech and an M.B.A. from the Harvard Business School.
Brent Stumme has served as Chief Financial Officer and Vice President, Finance and Administration since 2001 and Senior Vice President, Finance and Administration since February, 2006. Prior to joining LoopNet, Mr. Stumme was Chief Financial Officer for PropertyFirst.com, Inc., which merged with the Company in July, 2001. Prior to joining PropertyFirst, Mr. Stumme was Senior Finance Executive of the CalMat division of Vulcan Materials Company. Mr. Stumme holds a B.S. in Accounting from the University of Oregon and an M.B.A. from the University of Southern California. Mr. Stumme is a certified public accountant.
Jason Greenman has served as Chief Strategy Officer and Senior Vice President, Corporate Development since January, 2008. Mr. Greenman also served as Chief Product Officer from 2005 through 2008 and Senior Vice President, Business and Product Development from 2006 through 2008. Mr. Greenman joined LoopNet as Vice President, Business and Product Development in 2002. Prior to joining LoopNet, Mr. Greenman co-founded and served as Senior Vice President, Business Development, of Clareon Corporation, a provider of Internet-based electronic payment services, from 2000 to 2001. Mr. Greenman holds a B.S. in Product Design with distinction from Stanford University and a Master’s of Management from the Stanford University Graduate School of Business, where he was a Sloan Fellow.
Wayne Warthen has served as Chief Technology Officer since 2001 and Senior Vice President, Information Technology since February, 2006. Mr. Warthen also served as Vice President, Information Technology since 1999. Prior to joining LoopNet, Mr. Warthen was Director of Internet Infrastructure, PC/LAN services and Business Development for Experian Information Solutions from 1996 to 1999. Mr. Warthen holds a B.A. in Economics from California State University at Fullerton.
Michael Handelsman has served as Senior Vice President and Group General Manager, Marketplace Verticals since September, 2010. Mr. Handelsman also served as General Manager of BizBuySell since 2006. Prior to
14
Table of Contents
joining LoopNet, Mr. Handelsman has had senior leadership roles with Internet-based companies such as Art.com, BabyCenter.com and HomeGain.com. Mr. Handelsman holds a B.A. from Duke University and an M.B.A from Harvard Business School.
Frederick Saint has served as Senior Vice President, Product and Business Development since September, 2010. Mr. Saint also served as General Manager of Cityfeet.com in 2007 when he joined LoopNet with the acquisition of Cityfeet.com. Mr. Saint founded and served as Chief Executive Officer of Cityfeet.com in 1999. Prior to Cityfeet, Mr. Saint worked in the Real Estate Group of Banc of America Securities and was a Partner at Property Systems Corporation, a commercial real estate brokerage firm in Atlanta, Georgia. Mr. Saint holds a B.S. in Business Administration from the Wayne Calloway School of Business and Accountancy from Wake Forest University and an M.B.A. in Finance and Real Estate from the Wharton School of the University of Pennsylvania.
Bryan Smith has served as Senior Vice President, Sales and Services since September, 2010 and also served as Vice President of Sales since September, 2007. Mr. Smith joined LoopNet as Director of Sales in 2003. Prior to joining LoopNet, Mr. Smith was at All Bases Covered, where he held the role of Director, Sales & Marketing. Mr. Smith holds a B.A. in Economics from Santa Clara University
Information Available to Investors
We make publicly available free of charge on our Internet website, www.LoopNet.com, our annual report on Form 10-K, quarterly reports on Form 10-Q, current reports on Form 8-K, and amendments to those reports filed or furnished pursuant to Section 13(a) or 15(d) of the Securities Exchange Act of 1934 (“Exchange Act”), and our proxy statements as soon as reasonably practicable after we electronically file such material with, or furnish it to, the Securities and Exchange Commission (“SEC)”. Information contained on our website is not a part of this annual report on Form 10-K and information on, or that can be accessed through, our website is not deemed “filed” with the SEC and is not to be incorporated by reference into any of our filings under the Securities Act of 1933, as amended (the “Securities Act”), or the Exchange Act.
| Item 1A. | Risk Factors. |
The following risk factors and other information included in this Annual Report on Form 10-K should be carefully considered. Although the risk factors below are the ones management deems significant, additional risks and uncertainties not presently known to us or that we presumably deem less significant also may impair our business operations. If any of the following risks actually occur, our business, financial condition and operating results could be materially adversely affected.
Risks Related to our Pending Merger with CoStar
Completion of the Merger is subject to various conditions, including the expiration or termination of the waiting period imposed by the Hart-Scott Rodino Antitrust Improvement Act of 1976, as amended.
Completion of the Merger remains subject to the expiration or termination of the waiting period imposed by the HSR Act, and satisfaction or waiver of the other closing conditions specified in the Merger Agreement. Both we and CoStar filed notification and report forms with the Department of Justice and the FTC pursuant to the HSR Act on May 31, 2011. As previously announced, on June 30, 2011, we and CoStar each received a request for additional information (commonly referred to as a “second request”) from the FTC with respect to the proposed Merger. As previously announced, on October 26, 2011, at the request of the FTC, we and CoStar agreed to extend the waiting period imposed by the HSR Act from 30 to 60 days after the date of substantial compliance with the second request, which was certified by us and CoStar on November 4, 2011. As previously disclosed on January 3, 2012, we and CoStar voluntarily agreed to extend the waiting period imposed by the HSR Act on a 45-day rolling basis to allow us to continue to engage in discussions with the FTC to determine whether there is a possible basis for, and to discuss the possible terms of, a mutually acceptable consent order that would allow the Merger to close. If either we and CoStar, on the one hand, or the FTC Staff, on the other hand, believes that discussions towards a possible consent order are no longer moving forward productively, either may trigger commencement of the 45-day period, in writing, after the expiration of which the waiting period imposed by the HSR Act will expire, unless extended voluntarily by the parties or terminated sooner by the FTC. In addition, we and CoStar have agreed to extend the
15
Table of Contents
date after which either we or Costar may individually elect to terminate the Merger Agreement to April 30, 2012. As of the date hereof, we and CoStar have not yet reached agreement with the FTC on the terms of a consent order, and there can be no assurance that such agreement will be reached in a timely manner or at all.
Each party’s obligation to consummate the Merger is also subject to the accuracy of the representations and warranties of the other party (subject to certain qualifications and exceptions) and the performance in all material respects of the other party’s covenants under the Merger Agreement, including, with respect to us, customary covenants regarding operation of our business prior to closing. As a result of these conditions, we cannot assure you that the Merger will be completed, or that, if completed, it will be exactly on the terms set forth in the Merger Agreement. For example, the FTC may require divestitures or changes relating to the operations or assets of us and CoStar to obtain clearance or approval under the HSR Act. If the Merger is not completed for any reason, we expect that we would continue to be managed by our current management, under the direction of our board of directors.
The pendency of our agreement to be acquired by CoStar and the failure to complete the Merger with CoStar could adversely affect our business.
Our proposed Merger with CoStar was announced on April 27, 2011 and remains pending at this time, subject to regulatory review and approval of the transaction. This ongoing review and the possibility that the Merger may not be completed could cause disruptions in our business. If the proposed Merger is not completed, our stock price will likely fall as the current market price of our common stock reflects an assumption that a transaction will be completed. In addition, under circumstances described in the Merger Agreement, we may be required to pay a termination fee of up to $25.8 million if the Merger Agreement is terminated. Further, the failure of the proposed Merger to be completed may result in negative publicity and/or a negative impression of us in the investment community and may affect our relationship with our employees, customers and other partners in the business community.
The Merger process could adversely affect our business, stock price, reputation and results of operations.
Our efforts to complete the Merger could cause substantial disruptions in our business, which could have an adverse effect on our financial results. Among other things, uncertainty as to whether a transaction will be completed with CoStar may affect our ability to recruit prospective employees or to retain and motivate existing employees. Employee retention may be particularly challenging while the Merger is pending, because employees may experience uncertainty about their future roles with CoStar.
Uncertainty as to our future could adversely affect our business, reputation and our relationship with customers and potential customers. For example, customers and others that deal with us could defer decisions concerning working with us, or seek to change existing business relationships with us. Further, a substantial amount of the attention of management and employees is being directed toward the completion of the Merger and thus is being diverted from our day-to-day operations because matters related to the Merger (including integration planning) require substantial commitments of time and resources.
While the Merger Agreement is in effect, we are subject to restrictions on our business activities.
While the Merger Agreement is in effect, we are subject to restrictions on our business activities and must generally operate our business in the ordinary course consistent with past practice (subject to certain exceptions). These restrictions prevented us from exploring and pursing attractive business opportunities and acquiring businesses and products and continue to do so. This could have a material adverse effect on our future results of operations or financial condition should the Merger not be completed.
In certain instances, the Merger Agreement requires us to pay a termination fee of $25.8 million to CoStar, a payment which could affect the decisions of a third party considering making an alternative acquisition proposal.
Under the terms of the Merger Agreement, we may be required to pay to CoStar a termination fee of $25.8 million if the Merger Agreement is terminated under certain circumstances. This payment could affect the structure, pricing and terms proposed by a third party seeking to acquire or merge with us and could deter such third party from making a competing acquisition proposal.
16
Table of Contents
Risks Related to Our Business
The ongoing uncertainty in the commercial real estate market and overall economy could negatively affect our revenues, expenses and operating results.
Our business is sensitive to trends in the general economy and trends in commercial real estate markets, which are unpredictable and continue to be volatile and subject to uncertainty. Although we are currently seeing signs of stabilization after a prolonged downturn, the depressed debt markets continue to affect the investment sales market and have been contributing to a slow down in our industry, which we anticipate will continue through 2011. These negative general economic conditions could further reduce the overall amount of sale and leasing activity in the commercial real estate industry, and hence the demand for our services. Conditions such as continued tightening in credit markets, reduced industry-wide transaction volumes and negative trends in consumer confidence in global and domestic markets could also further dampen the general economy, and our business. While we believe the increase in the number of distressed sales and resulting decrease in asset prices will eventually translate to greater market activity, the current overall reduction in sales transaction volume continues to negatively impact our business. Therefore, our operating results, to the extent they reflect changes in the broader commercial real estate industry, may be subject to significant fluctuations. Factors that are affecting and could further affect the commercial real estate industry include:
| • | periods of economic slowdown or recession globally, in the United States or locally; |
| • | inflation; |
| • | flows of capital into or out of real estate investment in the United States or various regions of the United States; |
| • | rates of unemployment; |
| • | interest rates; |
| • | the availability and cost of capital; |
| • | wage and salary levels; or |
| • | concerns about any of the foregoing. |
We believe that the commercial real estate industry is composed of many submarkets, each of which is influenced differently, and often in opposite ways, by various economic factors. We believe that commercial real estate submarkets can be differentiated based on factors such as geographic location, value of properties, whether properties are sold or leased, and other factors. Each such submarket may be affected differently by, among other things:
| • | economic slowdown or recession; |
| • | changes in levels of rent or appreciation of asset values; |
| • | changing interest rates; |
| • | tax and accounting policies; |
| • | the availability and cost of capital; |
| • | costs of construction; |
| • | increased unemployment; |
| • | lower consumer confidence; |
| • | lower wage and salary levels; |
| • | war, terrorist attacks or natural disasters; or |
| • | the public perception that any of these conditions may occur. |
17
Table of Contents
For example, as of December 31, 2011, approximately 24% of our premium members were based in California and approximately 11% were based in Florida. Negative conditions in these or other significant commercial real estate submarkets could disproportionately affect our business as compared to competitors who have less or different geographic concentrations of their customers. Events such as a war or a significant terrorist attack are also likely to affect the general economy, and could cause a slowdown in the commercial real estate industry and therefore reduce utilization of our marketplace, which could reduce our revenue from premium members. The occurrence of any of the events listed above could increase our need to make significant expenditures to continue to attract customers to our marketplace.
Our business is largely based on a subscription model, and accordingly, any failure to increase the number of our customers or retain existing customers could cause our revenues to decline.
Our customers include premium members of our LoopNet marketplace, LoopLink users, users of our BizBuySell, BizQuest, Cityfeet, LandsofAmerica and LandAndFarm marketplaces, Property Comps and Property Facts subscribers, REApplications users and advertising and lead generation customers. The majority of our current revenues are generated by subscription fees paid by our premium members. Our growth depends in large part on increasing the number of our free basic members and then converting them into paying premium members, as well as retaining existing premium members. Either category of members may decide not to continue to use our services in favor of alternate services or because of budgetary constraints or other reasons. Since the fourth quarter of 2007, our average monthly cancellation rate for premium members has exceeded our historical rate of three to five percent, although the cancellation rate in the past couple of years, including 2011, has been within our expected range of 4.5% to 6.5%. We believe the higher cancellation rate is primarily the result of a significant slow-down in transaction activity in the commercial real estate industry that began in the fourth quarter of 2007, due to deteriorating economic conditions and due to the “credit crunch” impacting the availability and cost of debt capital for real estate transactions.
If our existing members choose not to use our services, decrease their use of our services, or change from being premium members to basic members, or we are unable to attract new members, listings on our site could be reduced, search activity on our website could decline, the usefulness of our services could be diminished, and we could incur significant expenses and/or experience declining revenues.
The value of our marketplaces to our customers is dependent on increasing the number of property listings provided by and searches conducted by our members. To grow our marketplaces, we must convince prospective members to use our services. Prospective members may not be familiar with our services and may be accustomed to using traditional methods of listing, searching, marketing and advertising commercial real estate. We cannot assure you that we will be successful in continuing to acquire more members, in continuing to convert free basic members into paying premium members or that our future sales efforts in general will be effective. Further, it is difficult to estimate the total number of active commercial real estate agents, property owners, landlords, buyers and tenants in the United States during any given period. As a result, we do not know the extent to which we have penetrated this market. If we reach the point at which we have attempted to sell our services to a significant majority of commercial real estate transaction participants in the United States, we will need to seek additional products and markets in order to maintain our rate of growth of revenues and profitability.
We rely on our marketing efforts to generate new registered members. If our marketing efforts are ineffective, we could fail to attract new registered members, which could reduce the attractiveness of our marketplace to current and potential customers and lead to a reduction in our revenues.
We believe that the attractiveness of our services and products to our current and potential customers increases as we attract additional members who provide additional property listings or conduct searches on our marketplace. This is because an increase in the number of our members and the number of listings on our website increases the utility of our website and of its associated search, listing and marketing services. In order to attract new registered members, we rely on our marketing efforts, such as word-of-mouth referrals, direct marketing, online and traditional advertising, sponsoring and attending local industry association events, and attending and exhibiting at industry trade shows and conferences. There is no guarantee that our marketing efforts will be
18
Table of Contents
effective. Furthermore, our ability to develop and successfully market our new information products and services may also be important in attracting new registered members. If we are unable to effectively market our existing and new products and services to new customers, or convert existing basic members into premium members, and we are not able to offset any decline in our rate of conversion of basic members to premium members with higher average subscription prices, our revenues and operating results could decline as a result of current premium members failing to renew their premium memberships and potential premium members failing to become premium members.
If we are unable to obtain or retain listings from commercial real estate brokers, agents, and property owners, our marketplace could be less attractive to current or potential customers, which could result in a reduction in our revenues.
Our success depends substantially on the number of commercial real estate property listings submitted by brokers, agents and property owners to our online marketplace. The number of listings on our marketplace has increased to 820,391 as of December 31, 2011, from 788,330 as of December 31, 2010, and 732,503 as of December 31, 2009. If agents marketing large numbers of property listings, such as large brokers in key real estate markets, choose not to continue their listings with us, or choose to list them with a competitor, our website would be less attractive to other real estate industry transaction participants, thus resulting in cancelled premium memberships, failure to attract and retain new members, or failure to attract advertising and lead generation revenues.
We may be unable to compete successfully with our current or future competitors.
The market to provide property listing, searching, information services and analytical products, and marketing and transaction services to the commercial real estate industry is highly competitive and fragmented, with limited barriers to entry in certain segments. In the land-for-sale and businesses-for-sale sectors, we similarly compete with a broad array of online marketplaces, as well as local and regional multiple listing services. We face competition from a variety of sources with respect to our different product offerings. We may not be able to compete successfully against our competitors that focus on one type of product or service area with respect to that particular product or service. Additionally, our current or new competitors may adopt aspects of our business model, which could reduce our ability to differentiate our services. Furthermore, listings in the commercial real estate industry are not marketed exclusively through any single channel, and accordingly our competition could aggregate a set of listings similar to ours. If our current or potential customers choose to use these services rather than ours, demand for our services could decline. Increased competition could result in a reduction in our revenues or our rate of acquisition of new customers, or loss of existing customers or market share, any of which would harm our business, operating results and financial condition.
Our focus on internal and external investments may result in flat revenue growth rates and place downward pressure on our operating margins.
In 2010 and 2011 we increased the rate of investments in our business, including internal investments in product development, data aggregation and information services, sales and marketing, to expand the breadth and depth of services we provide to our customers. In 2010, we also made external investments such as acquisitions and investments in other companies, but were limited by the Merger Agreement from doing so in 2011. For example, as part of our investment in information services, we launched the Property Facts product in 2010 and invested in further improvements in 2011. We also acquired LandsofAmerica in 2010 to further our reach in the land-for-sale category. This investment strategy is intended to accelerate our revenue growth and market share gains in the future as activity in the commercial real estate industry shows signs of stabilizing and begins to recover. While we believe this strategy will enable us to capitalize on opportunities we see in our industry and extend our leadership position, we expect our operating margins to experience a downward pressure and our revenue growth rate to be flat in the short term as a result of our planned investments and economic environment. Furthermore, if the industry fails to stabilize or deteriorates further in 2012 and beyond, such investments may not have their intended effect. For instance, our external investments may lose value and as a result, we may incur impairment charges with respect to such investments, as we did in the fourth quarter of 2011. If we are unable to successfully execute our investment strategy or fail to adequately anticipate potential problems, we may experience further decreases in our revenues and operating margins.
19
Table of Contents
If we are unable to introduce new or upgraded services, products or enabling technologies that our customers recognize as valuable, we may fail to attract new customers or retain existing customers. Our efforts to develop new and upgraded products and services could require us to incur significant costs.
To continue to attract new members to our online marketplace, we may need to continue to introduce new products or services or develop additional enabling technologies. We may choose to develop new products and services independently or choose to license or otherwise integrate content and data from third parties. Developing and delivering these new or upgraded services or products may impose costs and require the attention of our product and technology department and management. This process is costly, and we may experience difficulties in developing and delivering these new or upgraded services or products. In addition, successfully launching and selling a new service or product will require the use of our sales and marketing resources. Efforts to enhance and improve the ease of use, responsiveness, functionality and features of our existing products and services have inherent risks, and we may not be able to manage these product developments and enhancements successfully. If we are unable to continue to develop new or upgraded services or products or develop additional enabling technologies, then our customers may choose not to use our products or services.
If we are not able to successfully identify or integrate acquisitions, our management’s attention could be diverted, and efforts to integrate acquisitions could consume significant resources.
We have made acquisitions of, and investments in, other companies in the past, but were limited to some extent by the restrictions in the Merger Agreement from doing so in 2011, which restrictions remain in place. In the event the Merger is not completed, we may in the future further expand our markets and services in part through additional acquisitions of, or investments in, other complementary businesses, services, databases and technologies. For example, since October 2004, we made several acquisitions, including BizBuySell, Cityfeet.com Inc., REApplications, Inc., LandAndFarm.com, BizQuest, ReactionWeb and LandsofAmerica. Mergers and acquisitions are inherently risky, and we cannot assure you that our acquisitions will be successful. The successful execution of any acquisition strategy will depend on our ability to identify, negotiate, complete and integrate such acquisitions and, if necessary, obtain satisfactory debt or equity financing to fund those acquisitions. Failure to manage and successfully integrate acquired businesses could harm our business. Acquisitions involve numerous risks, including the following:
| • | difficulties in integrating the operations, technologies, and products of the acquired companies; |
| • | diversion of management’s attention from the normal daily operations of our business; |
| • | inability to maintain the key business relationships and the reputations of acquired businesses; |
| • | entry into markets in which we have limited or no prior experience and in which competitors have stronger market positions; |
| • | dependence on unfamiliar affiliates and partners; |
| • | insufficient revenues to offset increased expenses associated with acquisitions; |
| • | reduction or replacement of the sales of existing services by sales of products or services from acquired lines of business; |
| • | responsibility for the liabilities of acquired businesses; |
| • | inability to maintain our internal standards, controls, procedures and policies; and |
| • | potential loss of key employees of the acquired companies. |
We may also incur costs, and divert our management’s attention from our business, by pursuing potential acquisitions or other investments which are never consummated.
Although we undertake a due diligence investigation of each business that we acquire, there may be liabilities of the acquired companies that we fail to or are unable to discover during the due diligence investigation and for which we, as a successor owner, may be responsible. In connection with acquisitions, we generally seek to minimize the impact of these types of potential liabilities through indemnities and warranties from the seller, which may in some instances be supported by deferring payment of a portion of the purchase price. However, these indemnities and warranties, if obtained, may not fully cover the liabilities due to limitations in scope, amount or duration, financial limitations of the indemnitor or warrantor or other reasons.
20
Table of Contents
The number of our registered members is higher than the number of actual members.
The number of registered members in our network is higher than the number of actual members because some members have multiple registrations or others may have registered under fictitious names. Given the challenges inherent in identifying these accounts, we do not have a reliable system to accurately identify the number of actual members, and thus we rely on the number of registered members as one of our key operating metrics and our measure of the size of our marketplace. Furthermore, although the number of our registered members, which includes both basic and premium members, has increased over the last several years, the number of premium members has decreased over the same period. If the number of our actual members does not continue to grow and those members do not convert to premium members, then our business may not grow as fast as we expect, which will harm our operating and financial results.
Our operating results and revenues are subject to fluctuations that may cause our stock price to decline, and our quarterly financial results may be subject to seasonality, each of which could cause our stock price to decline.
Our revenues, expenses and operating results have fluctuated in the past and are likely to continue to do so in the future. Our revenues, expenses and operating results may fluctuate from quarter to quarter due to factors including those described below and elsewhere in this Annual Report on Form 10-K:
| • | rates of member adoption and retention; |
| • | changes in our pricing strategy and timing of changes; |
| • | changes in our marketing or other corporate strategies; |
| • | our introduction of and investments in new products and services or changes to existing products and services; |
| • | the amount and timing of our operating expenses and capital expenditures; |
| • | the amount and timing of non-cash stock-based charges; |
| • | costs related to acquisitions of businesses or technologies or impairment charges associated with such investments and acquisitions; and |
| • | other factors outside of our control. |
Our results of operations could vary significantly from quarter to quarter due to the seasonal nature of the commercial real estate industry. The timing of widely observed holidays and vacation periods, particularly slow downs during the end-of-year holiday period, and availability of real estate agents and related service providers during these periods, could significantly affect our quarterly operating results during that period. For example, we have historically experienced a significant decline in the rate of growth of both new memberships and revenues during the fourth quarter.
These fluctuations or seasonality effects could negatively affect our results of operations during the period in question and/or future periods or cause our stock price to decline.
If we are unable to enforce or defend our ownership and use of intellectual property, our business, competitive position and operating results could be harmed.
The success of our business depends in large part on our intellectual property, and our intellectual property rights, including existing and future trademarks, trade secrets, and copyrights, are and will continue to be valuable and important assets of our business. Our business could be significantly harmed if we are not able to protect the content of our databases and our other intellectual property.
We have taken measures to protect our intellectual property, such as requiring our employees and consultants with access to our proprietary information to execute confidentiality agreements. We also have taken action, and in the future may take additional action, against competitors or other parties who we believe to be infringing our intellectual property. We may in the future find it necessary to assert claims regarding our intellectual property. These measures may not be sufficient or effective to protect our intellectual property. These measures could also be expensive and could significantly divert our management’s attention from other business concerns.
21
Table of Contents
We also rely on laws, including those regarding patents, copyrights, and trade secrets, to protect our intellectual property rights. Current laws may not adequately protect our intellectual property or our databases and the data contained in them. In addition, legal standards relating to the validity, enforceability and scope of protection of proprietary rights in Internet-related businesses are uncertain and evolving, and we cannot assure you of the future viability or value of any of our proprietary rights.
Others may develop technologies that are similar or superior to our technology. Any significant impairment of our intellectual property rights could require us to develop alternative intellectual property, incur licensing or other expenses, or limit our product and service offerings.
Our services may infringe the intellectual property rights of others and we may be subject to claims of intellectual property rights infringement.
We may be subject to claims against us alleging infringement of the intellectual property rights of others, including our competitors. Any intellectual property claims, regardless of merit, could be expensive to litigate or settle and could significantly divert our management’s attention from other business concerns.
Our technologies and content may not be able to withstand third-party claims of infringement. If we were unable to successfully defend against such claims, we might have to pay damages, stop using the technology or content found to be in violation of a third party’s rights, seek a license for the infringing technology or content, or develop alternative non-infringing technology or content. Licenses for the infringing technology or content may not be available on reasonable terms, if at all. In addition, developing alternative non-infringing technology or content could require significant effort and expense. If we cannot license or develop technology or content for any infringing aspects of our business, we may be forced to limit our service offerings. Any of these results could reduce our ability to compete effectively and harm our business. See Note 11 to our consolidated financial statements for additional information with respect to certain currently pending legal matters.
Our trademarks are important to our business. Other companies may own, obtain or claim trademarks that could prevent, limit or interfere with our use of trademarks. If we were unable to use our trademarks, we would need to devote substantial resources toward developing different brand identities.
We could face liability for information on our website or general litigation claims.
We provide information on our website, including commercial real estate listings and broker listings that are submitted by our customers and third parties. We also allow third parties to advertise their products and services on our website and include links to third-party websites. We could be exposed to liability with respect to this information. Customers could assert that information concerning them on our website is misleading and contains errors or omissions. Third parties could seek damages for losses incurred if they rely upon incorrect information provided by our customers or advertisers. We could also be subject to claims that the persons posting information on our website do not have the right to post such information or are infringing the rights of third parties or do not have the qualifications or licenses they disclose. Among other things, we might be subject to claims that by directly or indirectly providing links to websites operated by third parties, we would be liable for wrongful actions by the third parties operating those websites. Even if these claims do not result in liability to us, we could incur significant costs in investigating and defending against these claims.
The Digital Millennium Copyright Act, or DMCA, allows copyright owners to obtain subpoenas compelling disclosure by an Internet service provider of the names of customers of that Internet service provider. We have been served with such subpoenas in the past, and may in the future be served with additional such subpoenas. Compliance with subpoenas under the DMCA may divert our resources, including the attention of our management, which could impede our ability to operate our business.
Our potential liability for information on our websites or distributed by us to others could require us to implement additional measures to reduce our exposure to such liability, which may require us to expend substantial resources and limit the attractiveness of our online marketplace to users. Our general liability insurance may not cover all potential claims to which we are exposed and may not be adequate to indemnify us for all liability that may be imposed.
22
Table of Contents
If we are unable to convince commercial real estate brokers and other commercial real estate professionals that our services and products are superior to traditional methods of listing, searching, and marketing commercial real estate, they could choose not to use our marketplace, which could reduce our revenues or increase our expenses.
Our primary source of new customers is participants in the commercial real estate community. Many commercial real estate professionals are use to listing, searching and marketing real estate in traditional and off-line ways, such as through the distribution of print brochures, sharing of written lists, placing signs on properties, word-of-mouth, and newspaper advertisements. Commercial real estate and investment professionals may prefer to continue to use traditional methods or may be slow to adopt and accept our online products and services. If we are not able to continue to persuade commercial real estate participants of the efficacy of our online products and services, they may choose not to use our online marketplace, which could negatively impact our business.
Our business depends on retaining and attracting capable management and operating personnel.
Our success depends in large part on our ability to retain and attract high-quality management and operating personnel, including our Chief Executive Officer and Chairman of the Board of Directors, Richard J. Boyle, Jr., our President and Chief Operating Officer, Thomas Byrne, our Chief Financial Officer and Senior Vice President, Finance and Administration, Brent Stumme, and our other Senior Vice Presidents. Our current long term business strategy was developed in large part by our senior-level officers that depends in part on their skills and knowledge to implement, and also includes a focus on new growth and investment initiatives that may require additional management expertise to successfully execute our strategy. We may not be able to offset the impact on our business of the loss of the services of Mr. Boyle or other key officers or employees or recruit additional talent. We have no employment agreements that prevent any of our key personnel from terminating their employment at any time, and we do not maintain any “key-person” life insurance for any of our personnel.
Furthermore, our business requires skilled technical, management, product and technology, and sales and marketing personnel, who are in high demand and are often subject to competing offers. Competition for qualified employees is intense in our industry, and the loss of a substantial number of qualified employees, or an inability to attract, retain and motivate additional highly skilled employees required for the expansion of our activities, could harm our business. To retain and attract key personnel, we use various measures, including an equity incentive program and incentive bonuses for key executive officers and other employees. We have also entered into change of control severance agreements with our key executive officers, which provide, in part, certain severance benefits and acceleration of unvested equity awards if their employment is terminated in connection with a change of control of the Company. These measures may not be enough to attract and retain the personnel we require to execute our business plan.
Additionally, if the Merger is consummated and the Company becomes a wholly-owned subsidiary of CoStar, we cannot assure you that the surviving subsidiary will retain members of our current management and operating personnel in their respective capacities.
Certain U.S. and foreign laws could subject us to claims or otherwise harm our business.
We are subject to a variety of laws in the U.S. and abroad that may subject us to claims or other remedies. Our failure to comply with applicable laws may subject us to additional liabilities, which could adversely affect our business, financial condition and results of operations. Laws and regulations which are particularly relevant to our business address information security, content and the distribution of content, taxation, intellectual property rights, characteristics and quality of products and services, and online advertising and marketing, including email marketing and unsolicited commercial email.
Many applicable laws were adopted prior to the advent of the Internet and do not contemplate or address the unique issues of the Internet. The laws that do reference the Internet are being interpreted by the courts, but their applicability and scope remain uncertain. For example, the laws relating to the liability of providers of online services are evolving. Claims have been either threatened or filed against us under both U.S. and foreign laws for
23
Table of Contents
defamation, libel, slander, invasion of privacy and other tort claims, unlawful activity, copyright and trademark infringement, or other theories based on the nature and content of the materials searched and the advertisements posted by our websites’ users, our products and services, or content generated by our users.
Federal and state legislation regulating email communications and Internet advertising, such as privacy-related laws that restrict or prohibit unsolicited email (commonly known as “spam”) may adversely affect our ability to market our services to consumers in a cost-effective manner. Violation of such laws may result in monetary fines or penalties or damage to our reputation. The CAN-SPAM Act of 2003, or CAN-SPAM, imposes complex and often burdensome requirements in connection with sending commercial email. Depending on how the law is interpreted and applied, CAN-SPAM may impose significant costs and burdens on our email marketing practices.
Federal, state and local tax authorities may alter tax treatment of companies engaged in Internet commerce. New, revised or existing tax regulations, whether domestic or internationally, may subject us or our affiliates to additional state sales, income and other taxes. We cannot predict the effect of current attempts to impose sales, income or other taxes on commerce over the Internet. New or revised taxes, particularly sales taxes, could negatively affect the attractiveness of advertising and selling products and services over the Internet and increase our costs. These events, if they occur, could have an adverse effect on our business and results of operations.
If we fail to protect confidential information against security breaches, or if our members or potential members are reluctant to use our marketplace because of privacy concerns, we might face additional costs, and activity in our marketplace could decline.
As part of our membership registration process, we collect, use and disclose personally identifiable information, including names, addresses, phone numbers, credit card numbers and email addresses. Our policies concerning the collection, use and disclosure of personally identifiable information are described on our websites. While we believe that our policies are appropriate and that we are in compliance with our policies, we could be subject to legal claims, government action or harm to our reputation if actual practices fail to comply or are seen as failing to comply with our policies or with local, state or federal laws concerning personally identifiable information or if our policies are inadequate to protect the personally identifiable information that we collect.
Concern among prospective customers regarding our use of the personal information collected on our websites could keep prospective customers from using our marketplace. Industry-wide incidents or incidents with respect to our websites, including misappropriation of third-party information, security breaches, or changes in industry standards, regulations or laws could deter people from using the Internet or our website to conduct transactions that involve the transmission of confidential information, which could harm our business. Under California law and the laws of a number of other states, if there is a breach of our computer systems and we know or suspect that unencrypted personal customer data has been stolen, we are required to inform any customers whose data was stolen, which could harm our reputation and business.
In addition, another California law requires businesses that maintain personal information about California residents in electronic databases to implement reasonable measures to keep that information secure. Our practice is to encrypt all personal information, but we do not know whether our current practice will continue to be deemed sufficient under the California law. Other states have enacted different and sometimes contradictory requirements for protecting personal information collected and maintained electronically. Compliance with numerous and contradictory requirements of the different states is particularly difficult for an online business such as ours which collects personal information from customers in multiple jurisdictions.
Another consequence of failure to comply is the possibility of adverse publicity and loss of consumer confidence were it known that we did not take adequate measures to assure the confidentiality of the personally identifiable information that our customers had given to us. This could result in a loss of customers and revenue that could jeopardize our success. While we intend to comply fully with all relevant laws and regulations, we cannot assure you that we will be successful in avoiding all potential liability or disruption of business in the event that we do not comply in every instance or in the event that the security of the customer data that we collect is compromised, regardless of whether our practices comply or not. If we were required to pay any significant
24
Table of Contents
amount of money in satisfaction of claims under these laws or if we were forced to cease our business operations for any length of time as a result of our inability to comply fully with any such laws, our business, operating results and financial condition could be adversely affected. Further, complying with the applicable notice requirements in the event of a security breach could result in significant costs.
Unless we develop, maintain and protect our brand identity, our business may not grow and our financial results may suffer.
In an effort to obtain additional registered members and increase use of our online marketplace by commercial real estate transaction participants, we intend to continue to pursue a strategy of enhancing our brand both through online advertising and through traditional print media. These efforts can involve significant expense and may not have a material positive impact on our brand identity. In addition, maintaining our brand will depend on our ability to provide products and services that are perceived as being high-value, which we may not be able to implement successfully. If we are unable to maintain and enhance our brand, our ability to attract and retain customers or successfully expand our operations will be harmed.
Changes in or interpretations of accounting rules and regulations could result in unfavorable accounting charges or adversely affect our reported financial results.
Generally accepted accounting principles in the United States are subject to interpretation by the Financial Accounting Standards Board, the American Institute of Certified Public Accountants, the SEC and various bodies formed to promulgate and interpret appropriate accounting principles. A change in these principles or interpretations could have a significant effect on our reported financial results, and could affect the reporting of transactions contemplated before the announcement of the change. In addition, the SEC has announced a multi-year plan that could ultimately lead to the use of International Financial Reporting Standards by United States issuers in their SEC filings. Any such change could have a significant effect on our reported financial results.
If our operating results do not meet the expectations of investors or equity research analysts, our market price may decline and we may be subject to class action litigation.
It is possible that in the future our operating results will not meet the expectations of investors or equity research analysts, causing the market price of our common stock to decline. In the past, companies that have experienced decreases in the market price of their stock have been subject to securities class action litigation. A securities class action lawsuit against us could result in substantial costs and divert our management’s attention from other business concerns.
If our website or our other services experience system failures, our customers may be dissatisfied and our operations could be impaired.
Our business depends upon the satisfactory performance, reliability and availability of our website. Problems with our website could result in reduced demand for our services. Furthermore, the software underlying our services is complex and may contain undetected errors. Despite testing, we cannot be certain that errors will not be found in our software. Any errors could result in adverse publicity, impaired use of our services, loss of revenues, cost increases or legal claims by customers.
Additionally, our services substantially depend on systems provided by third parties, over whom we have little control. Interruptions in our services could result from the failure of data providers, telecommunications providers, or other third parties. We depend on these third-party providers of Internet communication services to provide continuous and uninterrupted service. We also depend on Internet service providers that provide access to our services. Any disruption in the Internet access provided by third-party providers or any failure of third-party providers to handle higher volumes of user traffic could harm our business.
Our internal network infrastructure could be disrupted or penetrated, which could materially impact our ability to provide our services and our customers’ confidence in our services.
Our operations depend upon our ability to maintain and protect our computer systems, most of which are located in redundant and independent systems in Los Angeles, California and San Francisco, California. In addition, we utilize data centers in Virginia, Texas, and Colorado for specific services. While we believe that our
25
Table of Contents
systems are adequate to support our operations, our systems may be vulnerable to damage from break-ins, unauthorized access, vandalism, fire, floods, earthquakes, power loss, telecommunications failures and similar events. Although we maintain insurance against fires, floods, and general business interruptions, the amount of coverage may not be adequate in any particular case. Furthermore, any damage or disruption could materially impair or prohibit our ability to provide our services, which could significantly impact our business.
Experienced computer programmers, or hackers, may attempt to penetrate our network security from time to time. Although we maintain a firewall, and will continue to enhance and review our databases to prevent unauthorized and unlawful intrusions, a hacker who penetrates our network security could misappropriate proprietary information or cause interruptions in our services. We might be required to expend significant capital and resources to protect against, or to alleviate, problems caused by hackers. We also may not have a timely remedy against a hacker who is able to penetrate our network security. In addition to purposeful security breaches, the inadvertent transmission of computer viruses could expose us to litigation or to a material risk of loss. Any of these incidents could materially impact our ability to provide our services as well as materially impact the confidence of our customers in our services, either of which could significantly impact our business.
We may not be able to successfully halt the operations of websites that aggregate our data, as well as data from other companies, such as copycat websites that may misappropriate our data.
Third parties may misappropriate our data through website scraping, robots or other means and aggregate this data on their websites with data from other companies. In addition, “copycat” websites may misappropriate data on our website and attempt to imitate our brand or the functionality of our website. We may not be able to detect all such websites in a timely manner and, even if we could, technological and legal measures may be insufficient to stop their operations. In some cases, particularly in the case of websites operating outside of the United States, our available remedies may not be adequate to protect us against such websites. Regardless of whether we can successfully enforce our rights against these websites, any measures that we may take could require us to expend significant financial or other resources.
Our stock price may be volatile and you may be unable to sell your shares at or above the purchase price.
The market price of our common stock could be subject to wide fluctuations in response to, among other things, the risk factors described in this section of this Annual Report on Form 10-K, whether or not the Merger is completed and other factors beyond our control, such as fluctuations in the valuation of companies perceived by investors to be comparable to us.
Furthermore, the stock markets have experienced price and volume fluctuations that have affected and continue to affect the market prices of equity securities of many companies. These fluctuations often have been unrelated or disproportionate to the operating performance of those companies. These broad market and industry fluctuations, as well as general economic, political and market conditions, such as recessions, interest rate changes or international currency fluctuations, may negatively affect the market price of our common stock.
In the past, many companies that have experienced volatility in the market price of their stock have been subject to securities class action litigation. We may be the target of this type of litigation in the future. Securities litigation against us could result in substantial costs and divert our management’s attention from other business concerns, which could seriously harm our business.
Our principal stockholders, executive officers and directors own a significant percentage of our stock, and as a result, the trading price for our shares may be depressed and these stockholders can take actions that may be adverse to your interests.
Our executive officers and directors and entities affiliated with them, in the aggregate, beneficially own approximately 31% of our outstanding shares of common stock and since the Merger Agreement was signed have been limited in their ability to sell shares of our common stock without the consent of CoStar pursuant to Voting and Support Agreements entered into in connection with the Merger. This significant concentration of share ownership may adversely affect the trading price for our common stock because investors often perceive disadvantages in owning stock in companies with controlling stockholders. These stockholders, acting together,
26
Table of Contents
may have the ability to exert control over all matters requiring approval by our stockholders, including the election and removal of directors and any proposed merger, consolidation or sale of all or substantially all of our assets. In addition, these stockholders who are executive officers or directors, or who have representatives on our Board of Directors, could dictate the management of our business and affairs. This concentration of ownership could have the effect of delaying, deferring or preventing a change in control, or impeding a merger or consolidation, takeover or other business combination that could be favorable to our other stockholders.
Our charter documents and Delaware law could prevent a takeover that stockholders consider favorable and could also reduce the market price of our stock.
Our amended and restated certificate of incorporation and our bylaws contain provisions that could delay or prevent a change in control of our company. These provisions could also make it more difficult for stockholders to elect directors and take other corporate actions. These provisions include:
| • | providing for a classified board of directors with staggered, three-year terms; |
| • | not providing for cumulative voting in the election of directors or imposing a majority voting standard; |
| • | authorizing the board to issue, without stockholder approval, preferred stock rights senior to those of common stock; |
| • | prohibiting stockholder action by written consent; |
| • | limiting the persons who may call special meetings of stockholders; and |
| • | requiring advance notification of stockholder nominations and proposals. |
In addition, the provisions of Section 203 of the Delaware General Corporation Laws govern us. While we have waived the application of Section 203 of the Delaware General Corporation Laws with respect to the investors who acquired shares of our Series A convertible preferred stock in the April 2009 private placement, these provisions may otherwise prohibit large stockholders, in particular those owning 15% or more of our outstanding voting stock, from merging or combining with us for a certain period of time.
These and other provisions in our amended and restated certificate of incorporation, our bylaws and under Delaware law could discourage potential takeover attempts, reduce the price that investors might be willing to pay for shares of our common stock in the future and result in the market price being lower than it would be without these provisions.
| Item 1B. | Unresolved Staff Comments. |
None.
| Item 2. | Properties. |
Our headquarters are located in San Francisco, California, where we lease approximately 46,157 square feet of office space, pursuant to a lease that expires in 2015. We also lease approximately 38,590 square feet of office space in Glendora, California, pursuant to a lease that expires in 2018. We believe that these facilities are suitable and appropriately support our business needs.
| Item 3. | Legal Proceedings. |
In April 2008, LoopNet and CityFeet (collectively the “Defendants”) were sued by Real Estate Alliance, Ltd. (“REAL”) in the U.S. District Court for the Central District of California for alleged infringement of certain patents (“the REAL v. LoopNet Action”). The complaint seeks unspecified damages, attorney fees and costs. The Defendants deny the alleged infringement and have filed a counter-claim for a declaratory judgment that the patents-in-suit are invalid and not infringed. To date, discovery in the REAL v. LoopNet Action has been limited and the court has not yet set a trial date. Moreover, because the patents-in-suit have been asserted against several other entities, in another pending lawsuit in the same court, (“the earlier filed action”), the REAL v. LoopNet Action was stayed in February 2009, and administratively closed in February 2010. It is possible that REAL may attempt to re-institute the REAL v. LoopNet Action, depending upon the outcome of the earlier filed action, which is currently pending before the U.S. District Court for the Central District of California. At this time, the Company cannot predict the outcome of either the earlier filed action or the REAL v. LoopNet Action, but if the REAL v. LoopNet Action is re-instituted, the Company intends to vigorously defend itself.
27
Table of Contents
The Company and its board of directors and CoStar have been named as defendants in three putative class action lawsuits brought by alleged stockholders challenging our proposed merger with CoStar. Two of the actions, Raymond E. Williams Jr. v. LoopNet, Inc., et al. and Ronald T. West v. Richard Boyle, et al., were filed on or around May 3, 2011 and Ronald T. West v. Richard Boyle, et al. was amended on May 20, 2011. The third action, Karin Cahill v. LoopNet, Inc., et al., was filed on June 3, 2011. All three actions were filed in the Superior Court of California, County of San Francisco. The complaints generally allege, among other things, that each member of the board breached his fiduciary duties to the Company’s stockholders by authorizing the sale of the Company to CoStar for consideration that does not maximize value to the shareholders and engineering the transaction to benefit themselves without regard to the Company’s shareholders. The complaints also generally allege that the Company (and, in the case of the Ronald T. West action, CoStar) aided and abetted the breaches of fiduciary duty allegedly committed by the members of the board and made incomplete or materially misleading disclosures about the proposed transaction. The shareholder actions seek equitable relief, including an injunction against consummating the merger.
On June 21, 2011, counsel for the parties in the lawsuits entered into a memorandum of understanding in which they agreed on the terms of a settlement of all litigation, which would include the dismissal with prejudice of all claims against all of the defendants. The proposed settlement is conditional upon, among other things, the execution of an appropriate stipulation of settlement, consummation of the merger and final approval of the proposed settlement by the court. In addition, in connection with the settlement and as provided in the memorandum of understanding, the parties contemplate that plaintiff’s counsel will seek an award of attorneys’ fees and expenses as part of the settlement. There can be no assurance that the merger will be consummated, that the parties ultimately will enter into a stipulation of settlement or that the court will approve the settlement even if the parties enter into such stipulation. In such event, the proposed settlement as contemplated by the memorandum of understanding may be terminated. The settlement will not affect the amount of the merger consideration that the Company’s stockholders are entitled to receive in the merger.
On January 3, 2012, LoopNet was sued by CIVIX-DDI, LLC (“Civix”) in the U.S. District Court for the Eastern District of Virginia for alleged infringement of U.S. Patent Nos. 6,385,622 and 6,415,291. The complaint seeks unspecified damages, attorney fees and costs. On February 16, 2012, LoopNet filed an answer to Civix’s complaint and filed counterclaims against Civix seeking declaratory relief. No discovery has yet occurred, nor has a trial date been set. At this time, LoopNet cannot predict the outcome of this case, but intends to vigorously defend itself.
LoopNet has recently become aware that an entity called Earthcomber, LLC filed a lawsuit against LoopNet on January 18, 2012, in the U.S. District Court for the Northern District of Illinois for alleged infringement of U.S. Patent No. 7,589,628. The complaint seeks unspecified damages, attorneys fees and costs. LoopNet has not yet been served with a copy of the summons and complaint for this lawsuit. At this time, LoopNet cannot predict the outcome of this case, but intends to vigorously defend itself.
Currently and from time to time, we are involved in disputes and litigation incidental to the conduct of our business. While we cannot assure you as to the ultimate outcome of any legal proceedings, we are not currently party to any legal proceedings that management believes would have a material adverse effect on our financial position or results of operations.
| Item 4. | Mine Safety Disclosures. |
Not applicable.
28
Table of Contents
Item 5. Market for Registrant’s Common Equity, Related Stockholder Matters and Issuer Purchases of Equity Securities.
Market information
Our common stock trades on the Nasdaq Global Select Market under the symbol “LOOP.” We have not listed our stock on any other markets or exchanges. The following table shows the high and low sale prices for our common stock as reported by the Nasdaq Global Select Market:
| High | Low | |||||||
| 2011 |
||||||||
| First Quarter |
$ | 14.81 | $ | 9.94 | ||||
| Second Quarter |
$ | 18.95 | $ | 13.11 | ||||
| Third Quarter |
$ | 18.45 | $ | 16.91 | ||||
| Fourth Quarter |
$ | 18.80 | $ | 17.12 | ||||
| 2010 |
||||||||
| First Quarter |
$ | 11.86 | $ | 8.86 | ||||
| Second Quarter |
$ | 12.72 | $ | 8.50 | ||||
| Third Quarter |
$ | 12.95 | $ | 9.73 | ||||
| Fourth Quarter |
$ | 13.08 | $ | 10.38 | ||||
As of February 16, 2012, we had approximately 97 common stockholders of record. This does not include the number of persons whose stock is in nominee or “street name” accounts through brokers.
Dividend policy
We have never declared or paid dividends on our common stock. We intend to retain our earnings for use in our business and repurchases of our common stock, and therefore we do not anticipate declaring or paying any cash dividends in the foreseeable future. In the event we declare or pay dividends on our common stock, we are required to pay dividends on our Series A Preferred Stock, on an as converted to common stock basis.
29
Table of Contents
Performance Graph
The following graph shows the total shareholder return of an investment of $100 in cash on June 7, 2006 (the date on which our common stock was first traded on the Nasdaq Global Select Market) for (i) our common stock, (ii) the Nasdaq Composite Index and (iii) the S&P North American Tech Internet Trading Index, at the closing price on June 7, 2006. All values assume reinvestment of the full amount of all dividends, if any.
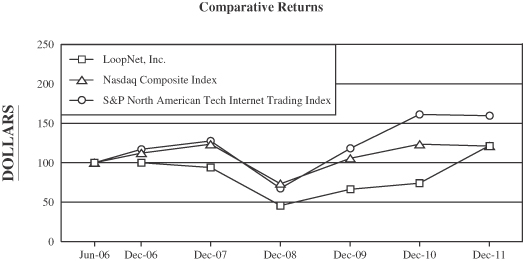
| Cumulative Total Return
|
| ||||||||||||||||||||||||||||||||||
| Cumulative Total Return | |||||||||||||||||||||||||||||||||||
| 6/7/2006 | 12/29/2006 | 12/31/2007 | 12/31/2008 | 12/31/2009 | 12/31/2010 | 12/31/2011 | |||||||||||||||||||||||||||||
| LOOPNET, INC. |
100.00 |
99.87(1) |
93.67(1) |
45.47(1) |
66.20(1) |
74.07(1) |
121.87(1) |
||||||||||||||||||||||||||||
| NASDAQ COMPOSITE INDEX |
100.00 | 112.25 | 123.26 | 73.29 | 105.45 | 123.29 | 121.07 | ||||||||||||||||||||||||||||
| S&P NORTH AMERICAN |
100.00 | 116.95 | 127.45 | 67.32 | 118.18 | 160.95 | 159.55 | ||||||||||||||||||||||||||||
| (1) | Based on the initial public offering price of $12.00 per share on June 6, 2006, the cumulative total return is $124.83, $117.08, $56.83, $82.75, $92.58 and $152.33 on 12/29/06, 12/31/07, 12/31/08, 12/31/09, 12/31/10 and 12/31/11, respectfully. |
The returns shown on the graph do not necessarily predict future performance. Furthermore, the performance graph and related information shall not be deemed to be soliciting material or to be “filed” with the SEC or to be deemed to be incorporated by reference to any filing under the Securities Act or the Exchange Act.
Issuer Purchases of Equity Securities
There were no purchases of shares under our stock repurchase program for the quarter ended December 31, 2011. We currently have $43.3 million available for repurchases of shares under a board authorization of $50.0 million on February 5, 2008, an additional authorization of $50.0 million on July 30, 2008 and an additional $29.6 million on February 3, 2010. We do not expect to repurchase additional shares of our common stock in the open market while the acquisition by CoStar remains pending.
30
Table of Contents
| Item 6. | Selected Financial Data. |
You should read the selected consolidated financial data set forth below in conjunction with our consolidated financial statements, the notes to our consolidated financial statements and “Management’s Discussion and Analysis of Financial Condition and Results of Operations” contained elsewhere in this annual report on Form 10-K.
The consolidated statements of operations data for the years ended December 31, 2007 and 2008 and the consolidated balance sheet data as of December 31, 2007, 2008 and 2009 are derived from our audited consolidated financial statements not included in this annual report on Form 10-K. The consolidated statements of operations data for each of the three years ended December 31, 2009, 2010 and 2011 and the consolidated balance sheet data as of December 31, 2010 and December 31, 2011 have been derived from our audited consolidated financial statements that are included elsewhere in this annual report on Form 10-K. Our historical results are not necessarily indicative of results to be expected for future periods.
| Year Ended December 31, | ||||||||||||||||||||
| 2007 | 2008 | 2009 | 2010 | 2011 | ||||||||||||||||
| (In thousands, except per share data) | ||||||||||||||||||||
| Consolidated Statements of Operations Data: |
||||||||||||||||||||
| Revenues |
$ | 70,729 | $ | 86,074 | $ | 76,487 | $ | 78,002 | $ | 86,661 | ||||||||||
| Cost of revenue(1) |
8,033 | 10,858 | 11,060 | 12,562 | 12,784 | |||||||||||||||
|
|
|
|
|
|
|
|
|
|
|
|||||||||||
| Gross profit |
62,696 | 75,216 | 65,427 | 65,440 | 73,877 | |||||||||||||||
| Operating expenses: |
||||||||||||||||||||
| Sales and marketing(1) |
14,667 | 18,825 | 15,064 | 16,785 | 23,642 | |||||||||||||||
| Technology and product development(1) |
6,427 | 9,075 | 10,707 | 12,231 | 16,975 | |||||||||||||||
| General and administrative(1) |
11,997 | 17,773 | 20,677 | 15,693 | 25,597 | |||||||||||||||
| Amortization of acquired intangible assets |
256 | 966 | 1,191 | 2,083 | 2,556 | |||||||||||||||
|
|
|
|
|
|
|
|
|
|
|
|||||||||||
| Total operating expenses |
33,347 | 46,639 | 47,639 | 46,792 | 68,770 | |||||||||||||||
|
|
|
|
|
|
|
|
|
|
|
|||||||||||
| Income from operations |
29,349 | 28,577 | 17,788 | 18,648 | 5,107 | |||||||||||||||
| Interest and other (expense) income, net |
5,046 | 1,998 | 211 | (2,461 | ) | (3,417 | ) | |||||||||||||
|
|
|
|
|
|
|
|
|
|
|
|||||||||||
| Income before tax |
34,395 | 30,575 | 17,999 | 16,187 | 1,690 | |||||||||||||||
| Income tax (benefit) expense |
13,268 | 12,297 | 6,246 | 461 | (453 | ) | ||||||||||||||
|
|
|
|
|
|
|
|
|
|
|
|||||||||||
| Net income |
21,127 | 18,278 | 11,753 | 15,726 | 2,143 | |||||||||||||||
| Convertible preferred stock accretion of discount |
— | — | (240 | ) | (339 | ) | (339 | ) | ||||||||||||
|
|
|
|
|
|
|
|
|
|
|
|||||||||||
| Net income applicable to common stockholders |
$ | 21,127 | $ | 18,278 | $ | 11,513 | $ | 15,387 | $ | 1,804 | ||||||||||
|
|
|
|
|
|
|
|
|
|
|
|||||||||||
| Net income per share applicable to common stockholders |
||||||||||||||||||||
| Basic |
$ | 0.55 | $ | 0.51 | $ | 0.28 | $ | 0.38 | $ | 0.04 | ||||||||||
|
|
|
|
|
|
|
|
|
|
|
|||||||||||
| Diluted |
$ | 0.52 | $ | 0.49 | $ | 0.27 | $ | 0.36 | $ | 0.04 | ||||||||||
|
|
|
|
|
|
|
|
|
|
|
|||||||||||
| (1) | Stock-based compensation is allocated as follows: |
| Year Ended December 31, | ||||||||||||||||||||
| 2007 | 2008 | 2009 | 2010 | 2011 | ||||||||||||||||
| (In thousands) | ||||||||||||||||||||
| Cost of revenue |
$ | 357 | $ | 570 | $ | 495 | $ | 546 | $ | 502 | ||||||||||
| Sales and marketing |
1,358 | 2,198 | 894 | 1,786 | 4,569 | |||||||||||||||
| Technology and product development |
600 | 1,311 | 2,298 | 2,680 | 4,490 | |||||||||||||||
| General and administrative |
1,180 | 1,855 | 3,140 | 3,220 | 4,641 | |||||||||||||||
|
|
|
|
|
|
|
|
|
|
|
|||||||||||
| Total |
$ | 3,495 | $ | 5,934 | $ | 6,827 | $ | 8,232 | $ | 14,202 | ||||||||||
|
|
|
|
|
|
|
|
|
|
|
|||||||||||
31
Table of Contents
| Year Ended December 31, | ||||||||||||||||||||
| 2007 | 2008 | 2009 | 2010 | 2011 | ||||||||||||||||
| (In thousands) | ||||||||||||||||||||
| Consolidated Balance Sheet Data: |
||||||||||||||||||||
| Cash, cash equivalents and short-term investments |
$107,889 | $64,587 | $129,011 | $92,285 | $111,102 | |||||||||||||||
| Working capital |
94,667 | 52,529 | 117,210 | 79,917 | 106,295 | |||||||||||||||
| Total assets |
137,359 | 108,210 | 174,249 | 171,990 | 199,260 | |||||||||||||||
| Total liabilities |
15,506 | 15,759 | 14,747 | 18,765 | 21,660 | |||||||||||||||
| Redeemable convertible preferred stock |
— | — | 48,207 | 48,546 | 48,885 | |||||||||||||||
| Total shareholders’ equity |
121,853 | 92,451 | 111,295 | 104,679 | 128,715 | |||||||||||||||
| Year Ended December 31, | ||||||||||||||||||||
| 2007 | 2008 | 2009 | 2010 | 2011 | ||||||||||||||||
| (In thousands) | ||||||||||||||||||||
| Consolidated Statement of Cash Flows Data: |
||||||||||||||||||||
| Cash flow provided by operating activities |
$30,301 | $25,105 | $18,632 | $21,262 | $15,781 | |||||||||||||||
| Depreciation and amortization |
1,154 | 2,199 | 2,601 | 3,480 | 4,200 | |||||||||||||||
| Capital expenditures |
(1,797 | ) | (1,319 | ) | (1,437 | ) | (1,197 | ) | (2,795 | ) | ||||||||||
| Year Ended December 31, | ||||||||||||||||||||
| 2007 | 2008 | 2009 | 2010 | 2011 | ||||||||||||||||
| Other Operating Data (unaudited): |
||||||||||||||||||||
| LoopNet registered members at end of year |
2,567,729 | 3,251,260 | 3,925,534 | 4,626,973 | 5,505,037 | |||||||||||||||
| LoopNet premium members at end of year |
88,340 | 77,283 | 68,378 | 68,608 | 73,550 | |||||||||||||||
32
Table of Contents
| Item 7. | Management’s Discussion and Analysis of Financial Condition and Results of Operations. |
You should read the following discussion and analysis by our management of our financial condition and results of operations in conjunction with our consolidated financial statements and the accompanying notes included elsewhere in this Annual Report on Form 10-K . This discussion and other parts of this Annual Report on Form 10-K contain forward-looking statements that involve risks and uncertainties, such as statements of our plans, objectives, expectations and intentions. Our actual results could differ materially from those discussed in the forward-looking statements. Factors that could cause or contribute to such differences include, but are not limited to, those discussed in Item 1A of Part I, “Risk Factors.” No forward-looking statement is a guarantee of future performance and you should not place undue reliance on any forward-looking statement, Except as otherwise required by law, we undertake no obligation to update or revise any forward-looking statement contained in this report and do not intend to do so. Please see “Special Note Regarding Forward-Looking Statements.”
Overview
We own and operate the leading online marketplace for commercial real estate in the United States, based on the number of monthly unique visitors to our marketplace, which averaged approximately 2.0 million per month during 2011, compared with approximately 1.5 million per month during 2010, and approximately 985,000 during 2009, as reported by comScore Media Metrix. comScore Media Metrix defines a unique visitor as an individual who visited any content of a website, a category, a channel, or an application. Our online marketplace, available at www.LoopNet.com, enables commercial real estate agents, working on behalf of property owners and landlords, to list properties for sale or for lease and submit detailed information on property listings including qualitative descriptions, financial and tenant information, photographs and key property characteristics, in order to find a buyer or tenant. Commercial real estate agents, buyers and tenants use the LoopNet online marketplace to search for available property listings that meet their commercial real estate criteria. We offer two types of memberships on the LoopNet online marketplace. Basic membership is available free-of-charge, and enables members to experience some of the benefits of the LoopNet offering, with limited functionality. LoopNet premium membership is available for a monthly subscription fee and provides enhanced marketing exposure for property listings and full access to LoopNet property listings, as well as numerous other features. The minimum term of a premium membership subscription is one month. Premium membership service remains the largest revenue contributor to our business and accounted for 66% of our revenues in 2011, compared with 71% in 2010 and 75% in 2009, reflecting changing market conditions, as well as our ongoing efforts to expand and develop our business beyond our core marketplace services.
Pending Acquisition by CoStar
On April 27, 2011, we entered into a definitive agreement under which CoStar will acquire all of our common stock and Series A preferred stock through a merger (the “Merger”) for $16.50 per share in cash and 0.03702 shares of CoStar common stock, and we will become a wholly owned subsidiary of CoStar. The holders of our Series A Preferred Stock have delivered contingent conversion notices to us pursuant to which such shares will be converted into common stock immediately prior to, and contingent upon, the completion of the Merger. The definitive agreement related to the Merger was approved by our stockholders on July 11, 2011. Completion of the Merger remains subject to the expiration or termination of the waiting period imposed by the Hart-Scott Rodino Antitrust Improvement Act of 1976 as amended (the “HSR Act”), and satisfaction or waiver of the other closing conditions specified in the Merger Agreement. Both we and CoStar filed notification and report forms with the Department of Justice and the FTC pursuant to the HSR Act on May 31, 2011. We and CoStar each received a request for additional information (commonly referred to as a “second request”) from the FTC and certified substantial compliance with the second request on November 4, 2011. As previously disclosed on January 3, 2012, we and CoStar voluntarily agreed to extend the waiting period imposed by the HSR Act on a 45-day rolling basis to allow us to continue to engage in discussions with the FTC to determine whether there is a possible basis for, and to discuss the possible terms of, a mutually acceptable consent order that would allow the Merger to close. If either we and CoStar, on the one hand, or the FTC Staff, on the other hand, believes that discussions towards a possible consent order are not moving forward productively, either may trigger commencement of the 45-day period, in writing, after the expiration of which the waiting period imposed by the HSR Act
33
Table of Contents
will expire, unless extended voluntarily by the parties or terminated sooner by the FTC. In addition, we and CoStar have agreed to extend the date after which either we or Costar may individually elect to terminate the Merger Agreement to April 30, 2012. As of the date hereof, we and CoStar have not yet reached substantive agreement with the FTC on the terms of a consent order, and there can be no assurance that such agreement will be reached in a timely manner or at all. We remain committed to working with the FTC as it conducts its review of the Merger.
Key Operating Metrics and Trends
We believe that the key metrics that are material to an analysis of our business are:
| • | the number of our registered members; |
| • | the number of monthly unique visitors to our marketplace; |
| • | the number of our premium members; |
| • | the average monthly subscription price paid by our premium members; |
| • | the cancellation rate of our premium members; |
| • | the number of active commercial real estate listings on our marketplace; |
| • | the number of property profiles viewed by visitors to LoopNet; |
| • | the number of unique paying subscribers to one or more of our commercial real estate subscription products and services; and |
| • | the average monthly subscription price paid by our unique subscribers to our commercial real estate subscription products and services. |
Our registered members have grown to approximately 5.5 million as of December 31, 2011, from approximately 4.6 million as of December 31, 2010, and 3.9 million as of December 31, 2009. The number of monthly unique visitors to our marketplace averaged approximately 2.0 million during 2011. Our premium members were 73,550 as of December 31, 2011, compared with 68,608 as of December 31, 2010, and 68,378 as of December 31, 2009. The average monthly subscription price paid by our premium members was $66.39 in 2011, compared to $66.59 in 2010, and $66.03 in 2009. Our average monthly cancellation rate in 2011 fell within the 4.5% to 6.5% range we began seeing in late 2007. We believe the higher cancellation rate seen in the last several years is primarily the result of a significant slow-down in transaction activity in the commercial real estate industry that began in the fourth quarter of 2007, due to deteriorating economic conditions and due to the “credit crunch” impacting the availability and cost of debt capital for real estate transactions. Premium membership fees have driven the majority of our growth in revenues since 2001 and were the source of approximately 66% of our revenues in 2011, compared with 71% in 2010 and 75% in 2009. The number of listings on our marketplace has increased to 820,391 as of December 31, 2011, from 788,330 as of December 31, 2010, and 732,503 as of December 31, 2009. The number of property profiles that were viewed by visitors of LoopNet grew to 330 million in 2011, from 227 million in 2010, and 158 million in 2009. The number of unique paying subscribers to one or more of our commercial real estate related products and services (i.e. Premium Membership, Property Comps, Property Facts, Professional Profile, LandsofAmerica, and LandAndFarm) was 95,041 as of December 31, 2011, and the average monthly revenue per unique paying subscriber during the year ending December 31, 2011 was $59.60.
The commercial real estate (“CRE”) industry has experienced and continues to experience challenging times, although certain segments of our industry have shown signs of increasing stabilization and modest improvement in transaction volumes. Industry-wide improvement, however, has been uneven, with most segments of the industry, particularly those involving smaller property transactions, remaining weak as compared to normalized historical standards. To capitalize on the CRE industry’s shifting dynamics in 2012 and beyond, we are currently focused on initiatives to increase our long-term value and expand the breadth and depth of the products and services we provide to our customers, which we believe will extend our leadership position and maximize our opportunities. To this end, we have been increasing the rate of investment in our business through execution of our strategy and business plan, ongoing investments in our existing products and services, investments in new organic initiatives.
34
Table of Contents
While we continued investing in our business throughout 2009 and 2010, during the worst commercial real estate cycle in decades, we did so cautiously in light of uncertainties around the magnitude of the decline, and the timing of recovery, in the CRE industry. However, as we began seeing early, albeit uneven, indications that activity levels in the industry may be stabilizing and in some segments, improving, we accelerated our investment plans to capitalize on the potential longer-term opportunities. In 2011, we invested several million dollars on a range of internal and external investments that we believe will complement and extend our business and, over time, create meaningful long-term shareholder value. Some of these investments are accelerations of ongoing efforts in areas that we have highlighted previously, such as our efforts to aggregate market and searching activity in our CRE, business-for-sale and land-for-sale marketplaces, aggregate more on-market available properties, organically develop new services aimed at increasing the scope of information we deliver to an expanded set of customers, our ongoing strategic investment in Xceligent, a provider of fully researched information services to CRE professionals, and various efforts to attract more demand side activity to our marketplace.
A significant area of investment for us has been our Property Facts product. Introduced in May 2010, Property Facts uses a hybrid approach that combines user-generated marketplace data with a variety of other information sources. We believe there are significant opportunities in the ability to deliver easy access to timely, useful, accurate market data at prices below traditional alternatives — particularly as we enter what we believe may be the early stage of a market recovery. We have been gathering and responding to customer feedback and continue to refine the Property Facts product. In March 2011, we began selling access to this service independent of Premium Membership in addition to continuing to offer bundles of complimentary products and services to our subscribers and customers.
Property Comps, which we developed and funded internally, was another area of investment in 2011. As transaction volumes likely accelerate over the next few years, we intend to continue to expand the breadth and depth of the data coverage in this service, providing more value to existing customers and introducing the service to many new subscribers.
We are also continuing to work on upgrading and integrating technology platforms from some of the acquisitions we have done in the past, including REApplications and LandAndFarm, and BizQuest, Reaction Web and LandsofAmerica which we acquired in 2010. For example, in December 2010, we announced the release of Enterprise Deal Tools, a suite of deal management products and tools that leverages Reaction Web’s technology and enables our corporate customers to minimize back-end work associated with property marketing campaigns and transaction management.
These planned investments, which extend throughout the organization to include product development, data aggregation and information services and sales & marketing, among others, are being made to position our business for long-term growth. This investment strategy is focused on accelerating our revenue growth and market share gains, as activity in the CRE market begins to recover. While this strategy may reduce our margins in the short term, we believe our investments will increase the likelihood that we will attain our goal of becoming a substantially larger company and extend our longer-term competitive and technological advantages.
Our Revenues and Expenses
Our primary sources of revenues are:
| • | LoopNet premium membership fees; |
| • | other property advertising fees, such as Cityfeet.com, LandsofAmerica and LandAndFarm.com; |
| • | BizBuySell and BizQuest membership fees and paid listings; |
| • | advertising on, and lead generation from, our marketplaces; |
| • | LoopLink product license fees; |
| • | LoopNet Property Comps membership fees; and |
| • | LoopNet Property Facts membership fees. |
35
Table of Contents
We have been profitable and cash flow positive each quarter since the second quarter of 2003. The key factors that impact our revenues are:
| • | the adoption of our premium membership services by the commercial real estate industry and cancellation rates; |
| • | the average monthly subscription price of our premium membership product; |
| • | the adoption of our Property Comps and Property Facts services and other new products and services by the commercial real estate industry; and |
| • | the adoption of our services by the operating business for sale industry. |
We derive the substantial majority of our revenues from customers that pay monthly fees for a suite of services to market and search for commercial real estate and operating businesses. The fee for our LoopNet premium membership averaged $66.39 per month during 2011, compared with $66.59 during 2010, and $66.03 during 2009. The minimum term of a premium membership subscription is one month. We also offer quarterly and annual memberships which are priced and discounted accordingly, and paid in advance for the subscription period. A customer choosing to cancel a discounted annual or quarterly membership will receive a refund based on the number of months the membership was used and charging the customer at the monthly rate rather than at the discounted quarterly or annual rates.
We also generate revenue from Property Comps, by charging a flat monthly fee to access our database of recent commercial real estate transactions or a per transaction fee for individual transactions; Property Facts, for which we charge a flat monthly fee to access our database of commercial property information or a per property record fee for individual property record purchases; LoopLink, which we license to commercial real estate brokerage firms who pay a monthly, quarterly or annual fee; and, BizBuySell and BizQuest, for which we charge a flat monthly fee for business brokers to market their listings or a per listing fee for owners to market their own listings. Revenues from other sources include advertising and lead generation revenues from both our LoopNet and business-for-sale marketplaces, which are recognized ratably over the period in which the advertisement is displayed, provided that no significant obligations remain and collection of the resulting receivable is probable. Advertising rates are dependent on the services provided and the placement of the advertisements. To date, the duration of our advertising commitments has generally averaged two to three months.
The largest component of our expenses is personnel costs. Personnel costs consist of salaries, benefits and incentive compensation for our employees, including commissions for salespeople. These expenses are categorized in our statements of operations based on each employee’s principal function.
Seasonality and Cyclicality
The commercial real estate market is influenced by annual seasonality factors, as well as by overall economic cycles. The market is large and fragmented, and different segments of the industry are influenced differently by various factors. Broadly speaking, the commercial real estate industry has two major components: tenants leasing space from owners or landlords, and the investment market for buying and selling properties.
We have experienced seasonality in our business in the past, and expect to continue to experience it in the future. While individual geographic markets vary, commercial real estate transaction activity is fairly consistent throughout the year, with the exception of a slow-down during the end-of-year holiday period.
The commercial real estate industry has historically experienced cyclicality. The different segments of the industry, such as office, industrial, retail, multi-family, and others, are influenced differently by different factors, and have historically moved through cycles with different timing. The “for lease” and “for sale” components of the market also do not necessarily move on the same timing cycle. During the second half of 2007 and the full years of 2008, 2009, 2010 and 2011, the commercial real estate industry has slowed significantly, due to deteriorating economic conditions and due to the “credit crunch” impacting the availability and cost of debt capital for real estate transactions compared to historical norms, although we believe that modest growth in activity levels are returning but at a fairly gradual pace.
36
Table of Contents
Results of Operations
The following table presents our historical operating results as a percentage of revenues for the periods indicated:
| Year Ended December 31, | ||||||||||||
| 2009 | 2010 | 2011 | ||||||||||
| Revenues |
100.0 | % | 100.0 | % | 100.0 | % | ||||||
| Cost of revenue |
14.5 | 16.1 | 14.8 | |||||||||
|
|
|
|
|
|
|
|||||||
| Gross profit |
85.5 | 83.9 | 85.2 | |||||||||
| Operating expenses: |
||||||||||||
| Sales and marketing |
19.7 | 21.5 | 27.3 | |||||||||
| Technology and product development |
14.0 | 15.7 | 19.6 | |||||||||
| General and administrative |
27.0 | 20.1 | 29.5 | |||||||||
| Amortization of acquired intangible assets |
1.6 | 2.7 | 2.9 | |||||||||
|
|
|
|
|
|
|
|||||||
| Total operating expenses |
62.3 | 60.0 | 79.4 | |||||||||
|
|
|
|
|
|
|
|||||||
| Income from operations |
23.3 | 23.9 | 5.9 | |||||||||
| Interest and other (expense) income, net |
0.3 | (3.2 | ) | (3.9 | ) | |||||||
|
|
|
|
|
|
|
|||||||
| Income before tax |
23.5 | 20.8 | 2.0 | |||||||||
| Income tax (benefit) expense |
8.2 | 0.6 | (0.5 | ) | ||||||||
|
|
|
|
|
|
|
|||||||
| Net income |
15.4 | 20.2 | 2.5 | |||||||||
| Convertible preferred stock accretion of discount |
(0.3 | ) | (0.4 | ) | (0.4 | ) | ||||||
|
|
|
|
|
|
|
|||||||
| Net income applicable to common stockholders |
15.1 | % | 19.7 | % | 2.1 | % | ||||||
|
|
|
|
|
|
|
|||||||
Comparison of Years Ended December 31, 2010 and 2011
Revenues
| Year Ended December 31, | ||||||||||||||||
| 2010 | 2011 | Increase | Percent Change |
|||||||||||||
| (Dollars in thousands) | ||||||||||||||||
| Revenues |
$ | 78,002 | $ | 86,661 | $ | 8,659 | 11.1 | % | ||||||||
| Premium members at year-end |
68,608 | 73,550 | 4,942 | 7.2 | % | |||||||||||
The increase in revenues was due to a combination of higher premium membership base, higher revenue from our Property Comps and Property Facts products and a favorable impact of prior year acquisitions. We currently anticipate that our revenues will grow modestly in future periods as we continue to expand the array of products and services we deliver to our customers.
Cost of Revenues
| Year Ended December 31, | ||||||||||||||||
| 2010 | 2011 | Increase | Percent Change |
|||||||||||||
| (Dollars in thousands) | ||||||||||||||||
| Cost of revenues |
$ | 12,562 | $ | 12,784 | $ | 222 | 1.8 | % | ||||||||
| Percentage of revenues |
16.1 | % | 14.8 | % | ||||||||||||
Cost of revenues consists of the expenses associated with the operation of our website, including depreciation of network infrastructure equipment, salaries and benefits of network operations personnel, Internet connectivity and hosting costs. Cost of revenues also includes salaries and benefits expenses associated with our data
37
Table of Contents
quality, data import and customer support personnel and credit card and other transaction fees relating to processing customer transactions.
The increase in cost of revenues was due to an increase in salaries and benefit costs related to an increase in the number of data quality, data import and customer support personnel, which was required in order to support our increased property listing and user activity.
We expect cost of revenues to increase in absolute dollar amounts and potentially as a percentage of revenue, as we continue to invest in current and new products and services.
Sales and Marketing
| Year Ended December 31, | ||||||||||||||||
| 2010 | 2011 | Increase | Percent Change |
|||||||||||||
| (Dollars in thousands) | ||||||||||||||||
| Sales and marketing |
$ | 16,785 | $ | 23,642 | $ | 6,857 | 40.9 | % | ||||||||
| Percentage of revenues |
21.5 | % | 27.3 | % | ||||||||||||
Sales and marketing expenses consist of the compensation and associated costs for sales and marketing personnel, advertising expenses as well as public relations and other promotional activities.
The increase in sales and marketing expenses was due in part to an increase in the number of sales personnel and increased sales commissions. Also contributing to the increase was higher stock-based compensation, which increased to $4,569,000 in 2011 compared to $1,786,000 in 2010 (see stock-based compensation explanation below).
We expect sales and marketing expenses (excluding stock-based compensation) to increase in both absolute dollar amounts and as a percentage of revenues, as we continue to expand our marketing and sales program to attract and retain customers and market new products and services.
Technology and Product Development
| Year Ended December 31, | ||||||||||||||||
| 2010 | 2011 | Increase | Percent Change |
|||||||||||||
| (Dollars in thousands) | ||||||||||||||||
| Technology and product development |
$ | 12,231 | $ | 16,975 | $ | 4,744 | 38.8 | % | ||||||||
| Percentage of revenues |
15.7 | % | 19.6 | % | ||||||||||||
Technology and product development costs include expenses for the research and development of new products and services, as well as improvements to and maintenance of existing products and services.
The increase in technology and product development expenses was due in part to increases in salaries and related costs associated with the launch of new product enhancements and services and the maintenance of our existing services. Also contributing to the increase was higher stock-based compensation, which increased to $4,490,000 in 2011 compared to $2,680,000 in 2010 (see stock-based compensation explanation below).
We expect technology and product development expenses (excluding stock-based compensation) to increase in absolute dollar amounts and potentially as a percentage of revenues as we continue to invest in current and new products and services.
General and Administrative
| Year Ended December 31, | ||||||||||||||||
| 2010 | 2011 | Increase | Percent Change |
|||||||||||||
| (Dollars in thousands) | ||||||||||||||||
| General and administrative |
$ | 15,693 | $ | 25,597 | $ | 9,904 | 63.1 | % | ||||||||
| Percentage of revenues |
20.1 | % | 29.5 | % | ||||||||||||
38
Table of Contents
General and administrative expenses consist primarily of salaries and related expenses for executive, accounting and human resources personnel. These costs also include insurance and professional fees, rent and related expenses. Professional fees primarily consist of outside legal and audit fees.
The increase in general and administrative expenses was due primarily to higher legal costs and acquisition related costs associated with the potential Merger. Also contributing to the increase was higher stock-based compensation, which increased to $4,641,000 in 2011 compared to $3,220,000 in 2010 (see stock-based compensation explanation below).
We expect general and administrative expenses (excluding stock-based compensation) to potentially increase in absolute dollar amounts and as a percentage of revenues as we continue to incur costs associated with the potential Merger.
Amortization of Acquired Intangible Assets
| Year Ended December 31, | ||||||||||||||||
| 2010 | 2011 | Increase | Percent Change |
|||||||||||||
| (Dollars in thousands) | ||||||||||||||||
| Amortization of acquired intangible assets |
$ | 2,083 | $ | 2,556 | $ | 473 | 22.7 | % | ||||||||
| Percentage of revenues |
2.7 | % | 2.9 | % | ||||||||||||
Amortization of acquired intangible assets is a result of purchased assets or businesses. These purchased transactions result in the creation of acquired intangible assets with finite lives and lead to a corresponding increase in our amortization expense in future periods. We amortize intangible assets over the period of estimated benefit, using a straight-line method and estimated useful lives up to 8 years.
The increase in amortization of acquired intangible assets was due primarily to prior year acquisitions.
We expect amortization of acquired intangible assets to potentially increase in absolute dollar amounts and as a percentage of revenues.
Stock-Based Compensation
| Year Ended December 31, | ||||||||||||||||
| 2010 | 2011 | (Decrease)/ Increase |
Percent Change |
|||||||||||||
| (Dollars in thousands) | ||||||||||||||||
| Cost of revenue |
$ | 546 | $ | 502 | $ | (44 | ) | (8.1 | )% | |||||||
| Sales and marketing |
1,786 | 4,569 | 2,783 | 155.8 | % | |||||||||||
| Technology and product development |
2,680 | 4,490 | 1,810 | 67.5 | % | |||||||||||
| General and administrative |
3,220 | 4,641 | 1,421 | 44.1 | % | |||||||||||
|
|
|
|
|
|
|
|
|
|||||||||
| Total |
$ | 8,232 | $ | 14,202 | $ | 5,970 | 72.5 | % | ||||||||
|
|
|
|
|
|
|
|
|
|||||||||
Expenses associated with stock-based compensation increased by $5,970,000 to $14,202,000 in the twelve months ended December 31, 2011 from $8,232,000 in the twelve months ended December 31, 2010. The increase was due primarily to the acceleration of a portion of the unvested stock option and restricted stock unit grants related to the pending Merger.
The stock-based compensation expense resulting from the acceleration of a portion of the unvested stock option and restricted stock unit grants has been allocated as follows:
| Cost of revenue |
$ | 0 | ||
| Sales and marketing |
2,524 | |||
| Technology and product development |
1,760 | |||
| General and administrative |
1,381 | |||
|
|
|
|||
| Total |
$ | 5,665 | ||
|
|
|
|||
39
Table of Contents
Interest and Other (Expense) Income, Net
Interest and other (expense) income increased by $956,000 to $3,417,000 of expense for the year ended December 31, 2011, from $2,461,000 of expense for the year ended December 31, 2010. The increase was due primarily to higher losses realized from our equity investments. Interest and other (expense) income include impairment of equity investments of $1,744,000 and $1,420,000 for the years ended December 31, 2011 and 2010, respectively. As of December 31, 2011, we held $111,102,000 in cash, cash equivalents and short-term investments, compared to $92,285,000 in cash, cash equivalents and short-term investments as of December 31, 2010.
Income Tax Expense
We recorded a provision benefit for income taxes of $453,000 for the year ended December 31, 2011.
Comparison of Years Ended December 31, 2009 and 2010
Revenues
| Year Ended December 31, | ||||||||||||||||
| 2009 | 2010 | Increase | Percent Change |
|||||||||||||
| (Dollars in thousands) | ||||||||||||||||
| Revenues |
$ | 76,487 | $ | 78,002 | $ | 1,515 | 2.0 | % | ||||||||
| Premium members at year-end |
68,378 | 68,608 | 230 | 0.3 | % | |||||||||||
The increase in revenues was due to a combination of higher revenue from our Property Comps product and a favorable impact of recent acquisitions.
Cost of Revenues
| Year Ended December 31, | ||||||||||||||||
| 2009 | 2010 | Increase | Percent Change |
|||||||||||||
| (Dollars in thousands) | ||||||||||||||||
| Cost of revenues |
$ | 11,060 | $ | 12,562 | $ | 1,502 | 13.6 | % | ||||||||
| Percentage of revenues |
14.5 | % | 16.1 | % | ||||||||||||
Cost of revenues consists of the expenses associated with the operation of our website, including depreciation of network infrastructure equipment, salaries and benefits of network operations personnel, Internet connectivity and hosting costs. Cost of revenues also includes salaries and benefits expenses associated with our data quality, data import and customer support personnel and credit card and other transaction fees relating to processing customer transactions.
The increase in cost of revenues was due to an increase in salaries and benefit costs related to an increase in the number of data quality, data import and customer support personnel, which was required in order to support our increased property listing and user activity.
Sales and Marketing
| Year Ended December 31, | ||||||||||||||||
| 2009 | 2010 | Increase | Percent Change |
|||||||||||||
| (Dollars in thousands) | ||||||||||||||||
| Sales and marketing |
$ | 15,064 | $ | 16,785 | $ | 1,721 | 11.4 | % | ||||||||
| Percentage of revenues |
19.7 | % | 21.5 | % | ||||||||||||
Sales and marketing expenses consist of the compensation and associated costs for sales and marketing personnel, advertising expenses as well as public relations and other promotional activities.
The increase in sales and marketing expenses was due in part to an increase in the number of sales personnel and increased sales commissions. Also contributing to the increase was higher stock-based compensation, which increased to $1,786,000 in 2010 compared to $894,000 in 2009.
40
Table of Contents
Technology and Product Development
| Year Ended December 31, | ||||||||||||||||
| 2009 | 2010 | Increase | Percent Change |
|||||||||||||
| (Dollars in thousands) | ||||||||||||||||
| Technology and product development |
$ | 10,707 | $ | 12,231 | $ | 1,524 | 14.2 | % | ||||||||
| Percentage of revenues |
14.0 | % | 15.7 | % | ||||||||||||
Technology and product development costs include expenses for the research and development of new products and services, as well as improvements to and maintenance of existing products and services.
The increase in technology and product development expenses was due in part to increases in salaries and related costs associated with the launch of new product enhancements and services and the maintenance of our existing services. Also contributing to the increase was higher stock-based compensation, which increased to $2,680,000 in 2010 compared to $2,298,000 in 2009.
General and Administrative
| Year Ended December 31, | ||||||||||||||||
| 2009 | 2010 | Decrease | Percent Change |
|||||||||||||
| (Dollars in thousands) | ||||||||||||||||
| General and administrative |
$ | 20,677 | $ | 15,693 | $ | (4,984 | ) | (24.1 | )% | |||||||
| Percentage of revenues |
27.0 | % | 20.1 | % | ||||||||||||
General and administrative expenses consist primarily of salaries and related expenses for executive, accounting and human resources personnel. These costs also include insurance and professional fees, rent and related expenses. Professional fees primarily consist of outside legal and audit fees.
The decrease in general and administrative expenses was due primarily to the decrease in litigation costs.
Amortization of Acquired Intangible Assets
| Year Ended December 31, | ||||||||||||||||
| 2009 | 2010 | Increase | Percent Change |
|||||||||||||
| (Dollars in thousands) | ||||||||||||||||
| Amortization of acquired intangible assets |
$ | 1,191 | $ | 2,083 | $ | 892 | 74.9 | % | ||||||||
| Percentage of revenues |
1.6 | % | 2.7 | % | ||||||||||||
Amortization of acquired intangible assets is a result of purchased assets or businesses. These purchased transactions result in the creation of acquired intangible assets with finite lives and lead to a corresponding increase in our amortization expense in future periods. We amortize intangible assets over the period of estimated benefit, using a straight-line method and estimated useful lives up to 8 years.
The increase in amortization of acquired intangible assets was due primarily to three new acquisitions in 2010.
Stock-Based Compensation
| Year Ended December 31, | ||||||||||||||||
| 2009 | 2010 | Increase | Percent Change |
|||||||||||||
| (Dollars in thousands) | ||||||||||||||||
| Cost of revenue |
$ | 495 | $ | 546 | $ | 51 | 10.3 | % | ||||||||
| Sales and marketing |
894 | 1,786 | 892 | 99.8 | % | |||||||||||
| Technology and product development |
2,298 | 2,680 | 382 | 16.6 | % | |||||||||||
| General and administrative |
3,140 | 3,220 | 80 | 2.5 | % | |||||||||||
|
|
|
|
|
|
|
|
|
|||||||||
| Total |
$ | 6,827 | $ | 8,232 | $ | 1,405 | 20.6 | % | ||||||||
|
|
|
|
|
|
|
|
|
|||||||||
41
Table of Contents
Expenses associated with stock-based compensation increased by $1,405,000 to $8,232,000 in the twelve months ended December 31, 2010 from $6,827,000 in the twelve months ended December 31, 2009. The increase was due primarily to stock option and restricted stock unit grants for employees hired in 2010 and additional grants to existing employees.
Interest and Other (Expense) Income, Net
Interest and other (expense) income decreased by $2,672,000 to $2,461,000 of expense for the year ended December 31, 2010, from $211,000 of income for the year ended December 31, 2009. The decrease was due to a $1,400,000 impairment charge related to a strategic investment and higher losses realized from our equity investments. As of December 31, 2010, we held $92,285,000 in cash, cash equivalents and short-term investments, compared to $129,011,000 in cash, cash equivalents and short-term investments as of December 31, 2009.
Income Tax Expense
We recorded a provision for income taxes of $461,000 for the year ended December 31, 2010, which includes positive tax adjustments of $5,423,000 primarily related to the reversal of the valuation allowance associated with the net operating loss carryforward and the research and development credit. Excluding the tax adjustments, our effective tax rate was 36.4%.
Quarterly Consolidated Statements of Income Data
The following tables present the unaudited consolidated statements of income data for the eight quarters ended December 31, 2011 in dollars and as a percentage of revenues. This quarterly information has been prepared on the same basis as our audited consolidated financial statements and, in the opinion of our management, reflects all adjustments necessary for a fair representation of the information for the periods presented. This data should be read in conjunction with our audited consolidated financial statements and the related notes included in this Annual Report on Form 10-K. Operating results for any quarter apply to that quarter only and are not necessarily indicative of results for any future period.
| Quarter Ended | ||||||||||||||||||||||||||||||||
| Mar. 31, | June 30, | Sept. 30, | Dec. 31, | Mar. 31, | June 30, | Sept. 30, | Dec. 31, | |||||||||||||||||||||||||
| 2010 | 2010 | 2010 | 2010 | 2011 | 2011 | 2011 | 2011 | |||||||||||||||||||||||||
| (In thousands, except per share data) | ||||||||||||||||||||||||||||||||
| Revenues |
$ | 18,822 | $ | 19,364 | $ | 19,779 | $ | 20,037 | $ | 20,713 | $ | 21,619 | $ | 22,214 | $ | 22,115 | ||||||||||||||||
| Cost of revenue(1) |
2,846 | 3,001 | 3,015 | 3,699 | 3,157 | 3,193 | 3,230 | 3,204 | ||||||||||||||||||||||||
|
|
|
|
|
|
|
|
|
|
|
|
|
|
|
|
|
|||||||||||||||||
| Gross profit |
15,976 | 16,363 | 16,764 | 16,338 | 17,556 | 18,426 | 18,984 | 18,911 | ||||||||||||||||||||||||
| Operating expenses: |
||||||||||||||||||||||||||||||||
| Sales and marketing(1) |
4,290 | 4,191 | 4,093 | 4,211 | 5,134 | 5,234 | 5,259 | 8,015 | ||||||||||||||||||||||||
| Technology and product development(1) |
2,949 | 2,948 | 3,157 | 3,178 | 3,659 | 3,852 | 3,852 | 5,611 | ||||||||||||||||||||||||
| General and administrative(1) |
4,371 | 3,244 | 4,496 | 3,582 | 4,924 | 5,776 | 7,598 | 7,300 | ||||||||||||||||||||||||
| Amortization of acquired intangible assets |
445 | 481 | 516 | 641 | 641 | 641 | 638 | 636 | ||||||||||||||||||||||||
|
|
|
|
|
|
|
|
|
|
|
|
|
|
|
|
|
|||||||||||||||||
| Total operating expenses |
12,055 | 10,864 | 12,262 | 11,612 | 14,358 | 15,503 | 17,347 | 21,562 | ||||||||||||||||||||||||
|
|
|
|
|
|
|
|
|
|
|
|
|
|
|
|
|
|||||||||||||||||
| Income (loss) from operations |
3,921 | 5,499 | 4,502 | 4,726 | 3,198 | 2,923 | 1,637 | (2,651 | ) | |||||||||||||||||||||||
| Interest and other (expense) income, net |
(104 | ) | (264 | ) | (301 | ) | (1,791 | ) | (317 | ) | (358 | ) | (391 | ) | (2,350 | ) | ||||||||||||||||
|
|
|
|
|
|
|
|
|
|
|
|
|
|
|
|
|
|||||||||||||||||
| Income (loss) before tax |
3,817 | 5,235 | 4,201 | 2,935 | 2,881 | 2,565 | 1,246 | (5,001 | ) | |||||||||||||||||||||||
| Income tax (benefit) expense |
1,417 | 1,929 | 1,463 | (4,348 | ) | 1,038 | 566 | 300 | (2,358 | ) | ||||||||||||||||||||||
|
|
|
|
|
|
|
|
|
|
|
|
|
|
|
|
|
|||||||||||||||||
| Net income (loss) |
2,400 | 3,306 | 2,738 | 7,283 | 1,843 | 1,999 | 946 | (2,643 | ) | |||||||||||||||||||||||
| Convertible preferred stock accretion of discount |
(85 | ) | (85 | ) | (85 | ) | (85 | ) | (85 | ) | (85 | ) | (85 | ) | (85 | ) | ||||||||||||||||
|
|
|
|
|
|
|
|
|
|
|
|
|
|
|
|
|
|||||||||||||||||
| Net income (loss) applicable to common shareholders |
$ | 2,315 | $ | 3,221 | $ | 2,653 | $ | 7,198 | $ | 1,758 | $ | 1,914 | $ | 861 | $ | (2,728 | ) | |||||||||||||||
|
|
|
|
|
|
|
|
|
|
|
|
|
|
|
|
|
|||||||||||||||||
| Net income (loss) per share applicable to common shareholders |
||||||||||||||||||||||||||||||||
| Basic |
$ | 0.06 | $ | 0.08 | $ | 0.07 | $ | 0.18 | $ | 0.04 | $ | 0.05 | $ | 0.02 | $ | (0.07 | ) | |||||||||||||||
|
|
|
|
|
|
|
|
|
|
|
|
|
|
|
|
|
|||||||||||||||||
| Diluted |
$ | 0.05 | $ | 0.07 | $ | 0.06 | $ | 0.17 | $ | 0.04 | $ | 0.04 | $ | 0.02 | $ | (0.07 | ) | |||||||||||||||
|
|
|
|
|
|
|
|
|
|
|
|
|
|
|
|
|
|||||||||||||||||
42
Table of Contents
| (1) | Stock-based compensation is allocated as follows: |
| Quarter Ended | ||||||||||||||||||||||||||||||||
| Mar. 31, | June 30, | Sept. 30, | Dec. 31, | Mar. 31, | June 30, | Sept. 30, | Dec. 31, | |||||||||||||||||||||||||
| 2010 | 2010 | 2010 | 2010 | 2011 | 2011 | 2011 | 2011 | |||||||||||||||||||||||||
| (In thousands) | ||||||||||||||||||||||||||||||||
| Cost of revenue |
$ | 128 | $ | 154 | $ | 132 | $ | 132 | $ | 130 | $ | 130 | $ | 124 | $ | 118 | ||||||||||||||||
| Sales and marketing |
485 | 444 | 409 | 449 | 585 | 493 | 518 | 2,973 | ||||||||||||||||||||||||
| Technology and product development |
682 | 684 | 675 | 638 | 801 | 684 | 680 | 2,325 | ||||||||||||||||||||||||
| General and administrative |
827 | 810 | 798 | 785 | 995 | 789 | 763 | 2,094 | ||||||||||||||||||||||||
|
|
|
|
|
|
|
|
|
|
|
|
|
|
|
|
|
|||||||||||||||||
| Total |
$ | 2,122 | $ | 2,092 | $ | 2,014 | $ | 2,004 | $ | 2,511 | $ | 2,096 | $ | 2,085 | $ | 7,510 | ||||||||||||||||
|
|
|
|
|
|
|
|
|
|
|
|
|
|
|
|
|
|||||||||||||||||
| Quarter Ended | ||||||||||||||||||||||||||||||||
| Mar. 31, | June 30, | Sept. 30, | Dec. 31, | Mar. 31, | June 30, | Sept. 30, | Dec. 31, | |||||||||||||||||||||||||
| 2010 | 2010 | 2010 | 2010 | 2011 | 2011 | 2011 | 2011 | |||||||||||||||||||||||||
| Revenues |
100.0 | % | 100.0 | % | 100.0 | % | 100.0 | % | 100.0 | % | 100.0 | % | 100.0 | % | 100.0 | % | ||||||||||||||||
| Cost of revenues |
15.1 | 15.5 | 15.2 | 18.5 | 15.2 | 14.8 | 14.5 | 14.5 | ||||||||||||||||||||||||
|
|
|
|
|
|
|
|
|
|
|
|
|
|
|
|
|
|||||||||||||||||
| Gross profit |
84.9 | 84.5 | 84.8 | 81.5 | 84.8 | 85.2 | 85.5 | 85.5 | ||||||||||||||||||||||||
| Operating expenses: |
||||||||||||||||||||||||||||||||
| Sales and marketing |
22.8 | 21.6 | 20.7 | 21.0 | 24.8 | 24.2 | 23.7 | 36.2 | ||||||||||||||||||||||||
| Technology and product development |
15.7 | 15.2 | 16.0 | 15.9 | 17.7 | 17.8 | 17.3 | 25.4 | ||||||||||||||||||||||||
| General and administrative |
23.2 | 16.8 | 22.7 | 17.9 | 23.8 | 26.7 | 34.2 | 33.0 | ||||||||||||||||||||||||
| Amortization of acquired intangible assets |
2.4 | 2.5 | 2.6 | 3.2 | 3.1 | 3.0 | 2.9 | 2.9 | ||||||||||||||||||||||||
|
|
|
|
|
|
|
|
|
|
|
|
|
|
|
|
|
|||||||||||||||||
| Total operating expenses |
64.0 | 56.1 | 62.0 | 58.0 | 69.3 | 71.7 | 78.1 | 97.5 | ||||||||||||||||||||||||
|
|
|
|
|
|
|
|
|
|
|
|
|
|
|
|
|
|||||||||||||||||
| Income (loss) from operations |
20.8 | 28.4 | 22.8 | 23.6 | 15.4 | 13.5 | 7.4 | (12.0 | ) | |||||||||||||||||||||||
| Interest and other (expense) income |
(0.6 | ) | (1.4 | ) | (1.5 | ) | (8.9 | ) | (1.5 | ) | (1.7 | ) | (1.8 | ) | (10.6 | ) | ||||||||||||||||
|
|
|
|
|
|
|
|
|
|
|
|
|
|
|
|
|
|||||||||||||||||
| Income (loss) before tax |
20.3 | 27.0 | 21.2 | 14.6 | 13.9 | 11.9 | 5.6 | (22.6 | ) | |||||||||||||||||||||||
| Income tax (benefit) expense |
7.5 | 10.0 | 7.4 | (21.7 | ) | 5.0 | 2.6 | 1.4 | (10.7 | ) | ||||||||||||||||||||||
|
|
|
|
|
|
|
|
|
|
|
|
|
|
|
|
|
|||||||||||||||||
| Net income (loss) |
12.8 | 17.1 | 13.8 | 36.3 | 8.9 | 9.2 | 4.3 | (12.0 | ) | |||||||||||||||||||||||
| Convertible preferred stock accretion of discount |
(0.5 | ) | (0.4 | ) | (0.4 | ) | (0.4 | ) | (0.4 | ) | (0.4 | ) | (0.4 | ) | (0.4 | ) | ||||||||||||||||
|
|
|
|
|
|
|
|
|
|
|
|
|
|
|
|
|
|||||||||||||||||
| Net income (loss) applicable to common shareholders |
12.3 | % | 16.6 | % | 13.4 | % | 35.9 | % | 8.5 | % | 8.9 | % | 3.9 | % | (12.3 | )% | ||||||||||||||||
|
|
|
|
|
|
|
|
|
|
|
|
|
|
|
|
|
|||||||||||||||||
Liquidity and Capital Resources
The following table summarizes our cash flows:
| Year Ended December 31, | ||||||||||||
| 2009 | 2010 | 2011 | ||||||||||
| (In thousands) | ||||||||||||
| Cash provided by operating activities |
$ | 18,632 | $ | 21,262 | $ | 15,781 | ||||||
| Cash used in investing activities |
(2,999 | ) | (27,795 | ) | (5,045 | ) | ||||||
| Cash provided by (used in) financing activities |
48,613 | (30,265 | ) | 8,064 | ||||||||
From our incorporation in 1997 until the first quarter of 2003, we financed our operations through private placements of our capital stock and cash acquired in the July, 2001 merger with PropertyFirst.com, Inc. Since the first quarter of 2003, we have financed our operations through cash flow that we generate from our operations. On June 12, 2006, we completed the initial public offering of our stock, resulting in net proceeds of $42.3 million. On April 14, 2009, we completed the Series A convertible preferred stock offering, resulting in net proceeds of $48.0 million.
As of December 31, 2011, our cash, cash equivalents and short-term investments totaled $111.1 million, compared to $92.3 million, and $129.0 million at December 31, 2010, and 2009, respectively.
Cash equivalents and short-term investments consist of money market funds, and debt securities that we classify as available for sale. Our principal sources of liquidity are our cash, cash equivalents and short-term investments, as well as the cash flow that we generate from our operations. We do not currently have any commercial debt or posted letters of credit.
43
Table of Contents
LoopNet’s Board of Directors authorized the repurchase of up to $50.0 million of the company’s common stock on February 5, 2008, an additional authorized level of $50.0 million was announced on July 30, 2008 and an additional authorized level of $29.6 million was announced on February 3, 2010. As of December 31, 2011, $43.3 million remained available for further purchases under the program. Repurchased shares are recorded as treasury stock and are accounted for under the cost method.
Due to the pending Merger, the stock repurchase program has been suspended at this time but may be reinitiated in the event that the Merger is terminated. Stock repurchases under this program may be made through open market at prevailing market prices or in privately negotiated transactions at times and in such amounts as management deems appropriate and will be funded using the company’s working capital. The timing and actual number of shares repurchased will depend on a variety of factors including corporate and regulatory requirements, price and other market conditions. The program is intended to comply with the volume, timing and other limitations set forth in Rule 10b-18 under the Securities Exchange Act of 1934.
Operating Activities
Net cash provided by operating activities was $15.8 million for the year ended December 31, 2011. Included in cash provided by operating activities were non-cash items including, $14.2 million of stock-based compensation, and $4.2 million of depreciation and amortization expense. The net cash provided by operating activities was $21.3 million and $18.6 million in the years ended December 31, 2010 and 2009, respectively.
Investing Activities
Cash used in investing activities in 2011 of $5.0 million was primarily attributable to the purchase of other investments of $2.2 million and capital expenditures of $2.8 million for the purchase of computer equipment, office equipment and furniture, and leasehold improvements.
Cash used in investing activities in 2010 of $27.8 million was primarily attributable to the three acquisitions of $22.1 million (net of cash acquired), the purchase of other investments of $4.5 million and capital expenditures of $1.2 million for the purchase of computer equipment, office equipment and furniture, and leasehold improvements.
Cash used in investing activities in 2009 of $3.0 million was attributable to $0.3 million contingent purchase price payments related to the July 2008 acquisition of LandAndFarm.com, the purchase of investments of $1.3 million, and capital expenditures amounting to $1.4 million for the purchase of computer equipment, office equipment and furniture, and leasehold improvements.
Financing Activities
Cash provided by financing activities in 2011 of $8.1 million was primarily attributable to $14.7 million of net proceeds from exercise of stock options and a $8.5 million tax benefit from the exercise of stock options, partially offset by $15.1 million in tax withholding related to net share settlements of stock options and restricted stock units.
Cash used in financing activities in 2010 of $30.3 million was primarily attributable to the Company’s stock repurchases in the amount of $31.7 million, partially offset by the net proceeds from the exercise of stock-based awards and the tax benefit from the exercise of stock options.
Cash provided by financing activities in 2009 of $48.6 million was attributable to $48.0 million in aggregate net proceeds from the sale of Series A convertible preferred stock to certain accredited investors, $0.2 million of proceeds from the exercise of stock awards and a $0.4 million tax benefit from the exercise of stock options.
Off-Balance Sheet Arrangements
We do not have any special purpose entities, and other than operating leases for office space, described below, we do not engage in off-balance sheet financing arrangements.
44
Table of Contents
Contractual Obligations and Known Future Cash Requirements
As of December 31, 2011, our principal commitments consist of obligations under certain leases for office space in California. The offices are currently leased under operating lease agreements which expire between 2015 and 2018.
Future minimum payments under these operating leases as of December 31, 2011 are as follows:
| Payments Due by Period | ||||||||||||||||||||||||
| 2012 | 2013 | 2014 | 2015 | 2016 and Thereafter |
Total | |||||||||||||||||||
| (Dollars in thousands) | ||||||||||||||||||||||||
| Operating lease obligations |
$ | 2,949 | $ | 2,995 | $ | 3,080 | $ | 1,815 | $ | 2,233 | $ | 13,072 | ||||||||||||
Advertising and Media Contracts
We purchase advertising from online vendors such as Google and Yahoo! and pay for the services on a monthly basis. We have no ongoing obligations to purchase a fixed or minimum amount with these vendors.
Future Capital Requirements
We believe that our existing cash, cash equivalents, short-term investments and cash generated from operations, whether or not the Merger is completed, will be sufficient to satisfy our currently anticipated cash requirements. Our future capital requirements will depend on many factors, including cash generated from operations, the timing and extent of spending to support product development efforts, the timing of introductions of new products and services and enhancements to existing products and services, and the continuing market acceptance of our products and services. In the event the Merger is terminated, we will likely renew our strategy of exploring complimentary businesses and technologies and may from time to time continue to make investments in, or acquisitions of, complementary businesses, products, services or technologies. These investments and acquisitions could also require us to seek additional equity or debt financing. Additional financing may not be available at all or on terms favorable to us.
Critical Accounting Policies and Estimates
The preparation of our consolidated financial statements requires us to make estimates and assumptions that affect the reported amounts of assets, liabilities, revenues, costs and expenses and related disclosures. On an ongoing basis, we evaluate our estimates and assumptions. Accordingly, our actual results may differ from these estimates.
Our significant accounting policies are described in Note 1 to the consolidated financial statements included in this Annual Report, and of those policies, we believe that the accounting policies discussed below involve the greatest degree of complexity and exercise of judgment by our management. Accordingly, we believe the following policies are the most critical for understanding and evaluating our financial condition and results of operations.
Revenue Recognition
We derive the substantial majority of our revenues from premium membership fees for our online marketplaces. We recognize revenues under the provisions of Securities and Exchange Commission (“SEC”) Staff Accounting Bulletin (“SAB”) guidance related to revenue recognition, when persuasive evidence of an agreement exists, delivery has occurred, the sales price is fixed or determinable and collectibility is reasonably assured. For the majority of our revenues, payments for LoopNet premium memberships, revenues are recognized immediately on a monthly basis as such accounts are charged on credit cards. Payments that we receive in advance of services being rendered, such as advance payments on annual and quarterly subscriptions by our premium members, are recorded as deferred revenue and recognized on a straight-line basis over the service period.
Income Taxes
Deferred tax assets and liabilities arise from the differences between the tax basis of an asset or liability and its reported amount in the consolidated financial statements, as well as from net operating loss and tax credit carryforwards. Deferred tax amounts are determined by using the tax rates expected to be in effect when the taxes
45
Table of Contents
will actually be paid or refunds received, as provided under current tax law. Valuation allowances are established when necessary to reduce deferred tax assets to the amount expected to be realized. Income tax expense or benefit is the tax payable or refundable, respectively, for the period, plus or minus the change during the period in deferred tax assets and liabilities.
In the fourth quarter of 2010, we determined that it is more likely than not that the Company would generate sufficient taxable income from operations in future years to realize tax benefits arising from the use of our net operating loss carryforwards and therefore in 2010, we reversed $6.6 million of the valuation allowance on the deferred tax assets. The release of the valuation allowance in the fourth quarter of 2010 resulted in a tax benefit of $6.6 million that was recognized in our results from operations. As of December 31, 2011, we continued to maintain a valuation allowance of approximately $0.7 million for certain state net operating loss carryforwards due to the uncertainty of realization.
At December 31, 2011, we had approximately $24.1 million of federal and $44.1 million of state net operating loss carryforwards available to reduce future taxable income, which will begin to expire in 2021 for federal and 2017 for state purposes, respectively. Under Section 382 of the Internal Revenue Code, the utilization of the net operating loss carryforwards is limited based upon changes in the percentage of our ownership. As a result of prior ownership changes, we will be able to utilize approximately $5.7 million of net operating losses in 2012, $2.9 million in 2013, $2.0 million each year thereafter until 2020 and $1.1 million in 2021 when the net operating losses would be fully utilized. We did not utilize any net operating losses in 2011.
The difference between our effective income tax rate and the federal statutory rate is primarily a function of the permanent differences. Our future effective income tax rate will depend on various factors, such as pending or future tax law changes including rate changes and the tax benefit from research and development credits, potential limitations on the use of federal and state net operating losses, and state taxes.
We evaluate our tax positions for all income tax items based on their technical merits to determine whether each position satisfies the “more likely than not to be sustained upon examination” test. The tax benefits are then measured as the largest amount of benefit, determined on a cumulative basis, that is “more likely than not” to be realized upon ultimate settlement. We report a liability for unrecognized tax benefits resulting from uncertain tax positions taken or expected to be taken in a tax return. GAAP further requires that a change in judgment related to the expected ultimate resolution of uncertain tax positions be recognized in earnings in the quarter in which such change occurs.
Long-Lived Assets and Liabilities Including Goodwill and Other Intangible Assets
We have applied the FASB authoritative guidance regarding the principles and requirements for how to account for business combinations. The Company recognizes the assets acquired and the liabilities assumed in the acquired entity at their fair values as of the acquisition date. The excess of the purchase price over the fair value of the net tangible and identifiable intangible assets acquired in a business combination is recorded in Goodwill. Goodwill and intangible assets with indefinite useful lives are no longer amortized, but instead are tested for impairment at least annually or sooner whenever events or changes in circumstances indicate that they may be impaired.
In testing for a potential impairment of goodwill, we compare the estimated fair value of the reporting unit entity with book value, including goodwill. If the estimated fair value exceeds book value, goodwill is considered not to be impaired and no additional steps are necessary. If, however, the fair value of the reporting unit entity is less than the book value, then we are required to compare the carrying amount of the goodwill with its implied fair value. We performed the annual impairment test during the fourth quarter of 2011 and concluded that goodwill and intangible assets with indefinite useful lives were not impaired.
Intangible assets with definite lives are required to be amortized over their estimated useful lives and reviewed for impairment whenever events or changes in circumstances indicate that an asset’s carrying value may not be recoverable in accordance with the authoritative guidance on property, plant, and equipment. The intangible assets are amortized using a straight-line method and we believe no events or changes in circumstances have occurred that would require an impairment test for these assets other than the required annual test.
46
Table of Contents
The recognition of an asset or liability arising from a contingent consideration is to be recognized at fair value on the acquisition date. These contingent considerations may or may not be paid depending on the resolution of certain future events. Any gain or loss due to remeasurement to the fair value on the acquisition date will be recognized through the income statement.
Stock-Based Compensation
We apply the FASB authoritative guidance in ASC 718 Compensation – Stock Compensation, surrounding share-based payments. The guidance requires that share-based payment transactions with employees be recognized in the financial statements based on their value and recognized as compensation expense over the vesting period.
In accordance with this guidance we calculated the fair value of stock option grants using the Black-Scholes option-pricing model. The weighted average assumptions used in the Black-Scholes model were 3.7 years for the expected life, 49% for the expected volatility, 1.99% for the risk free rate and 0% for dividend yield for the year ended December 31, 2011. Future expense amounts for any particular quarterly or annual period could be affected by changes in our assumptions or changes in market conditions.
In connection with this guidance, the Company reviews and updates, among other things, its forfeiture rate, expected term and volatility assumptions. Commencing January 1, 2011, the Company began estimating the weighted average expected life of the options based upon the historical exercise behavior of our employees. Prior to January 1, 2011, the Company used the simplified method to calculate the weighted average expected life of the options. There was no significant impact as a result of this change. The estimated volatility also reflects the application of the authoritative guidance and, accordingly, incorporates historical volatility of similar companies whose share price is publicly available. The risk-free interest rate is based on the U.S. Treasury yield curve in effect at the time of grant.
Recent Accounting Pronouncements
In September 2011, the FASB issued new accounting guidance that simplifies goodwill impairment tests. The new guidance states that a “qualitative” assessment may be performed to determine whether further impairment testing is necessary. The effective date for this guidance is reporting periods beginning on or after December 15, 2011. The Company will adopt this accounting standard upon its effective date, and we do not anticipate that this adoption will have a significant impact on our financial position or results of operations.
In June 2011, the FASB issued new disclosure guidance related to the presentation of the Statement of Comprehensive Income. This guidance eliminates the current option to report other comprehensive income and its components in the consolidated statement of stockholders’ equity. The requirement to present reclassification adjustments out of accumulated other comprehensive income on the face of the consolidated statement of income has been deferred. The effective date for this guidance is reporting periods beginning on or after December 15, 2011. The Company will adopt this accounting standard upon its effective date, and this adoption will not have any impact on our financial position or results of operations but will impact our financial statement presentation.
| Item 7A. | Quantitative and Qualitative Disclosures About Market Risk. |
The primary objective of our investment activities is to preserve principal while at the same time maximizing yields without significantly increasing risk. To achieve this objective, we invest in short-term, high-quality, interest- bearing securities. Our investments in debt securities are subject to interest rate risk. To minimize our exposure to an adverse shift in interest rates, we invest in short-term securities and maintain an average maturity of one year or less. If interest rates were to instantaneously increase or decrease by 100 basis points, the change in the fair market value of our short-term investments would not be a material amount to our financial statements.
| Item 8. | Financial Statements and Supplementary Data. |
Our financial statements and supplementary data required by this item are contained in separate sections of this annual report on Form 10-K. See “Index to Financial Statements” commencing on page 53 and the supplemental data contained in “Quarterly Consolidated Statements of Income Data” under Item 7.
47
Table of Contents
| Item 9. | Changes in and Disagreements with Accountants on Accounting and Financial Disclosure. |
None.
| Item 9A. | Controls and Procedures. |
(a) Evaluation of disclosure controls and procedures. Under the supervision and with the participation of our Company’s management, including the Chief Executive Officer and Chief Financial Officer, the Company has evaluated the effectiveness of the design and operation of our disclosure controls and procedures as of the end of the period covered by this Annual Report on Form 10-K. Based on that evaluation, the Chief Executive Officer and Chief Financial Officer concluded that the Company’s disclosure controls and procedures were effective to provide reasonable assurance that the information we are required to disclose in reports that we file or submit under the Exchange Act is recorded, processed, summarized and reported within the time periods specified in SEC rules and forms and that such information is accumulated and communicated to our management, including our Chief Executive Officer and Chief Financial Officer, as appropriate, to allow timely decisions regarding required disclosure.
(b) Management’s Report on Internal Control over Financial Reporting. Our management is responsible for establishing and maintaining adequate internal control over financial reporting, as defined in Exchange Act Rules 13a-15(f). We conducted an evaluation of the effectiveness of our internal control over financial reporting based on the framework and criteria established in Internal Control — Integrated Framework issued by the Committee of the Sponsoring Organizations of the Treadway Commission. Based on our evaluation, our management concluded that our internal control over financial reporting was effective as of December 31, 2011.
Our management acknowledges that because of its inherent limitations, internal control over financial reporting may not prevent or detect misstatements. A control system, no matter how well designed and operated, can provide only reasonable, not absolute, assurance that the objectives of the control system are met. Because of the inherent limitations in all control systems, no evaluation of controls can provide absolute assurance that all control issues and instances of fraud, if any, within the company have been detected.
The effectiveness of internal control over financial reporting as of December 31, 2011 has been audited by Ernst & Young LLP, an independent registered public accounting firm, as stated in their report which is included herein.
(c) Changes in internal control over financial reporting. There was no change in our internal control over financial reporting that occurred during the fourth quarter of 2011 that has materially affected, or is reasonably likely to materially affect, our internal control over financial reporting.
| Item 9B. | Other Information. |
None.
Certain information required by Part III will be included in our definitive proxy statement for the 2012 Annual Meeting of Stockholders (the “Proxy Statement”) to be filed with the SEC within 120 days after the end of the fiscal year ended December 31, 2011 and is incorporated herein by reference.
| Item | 10. Directors, Executive Officers and Corporate Governance. |
The names of the executive officers of the Company and their ages, titles and biographies as of the date hereof are incorporated by reference from Part I, Item 1, above.
The other information required by this item is incorporated by reference from the information to be contained in our Proxy Statement under the sections entitled “Directors”, “Director Biographies,” “Board of Directors and Board Committees,” “Section 16(a) Beneficial Ownership Reporting Compliance” and “Other Corporate Governance Matters.”
48
Table of Contents
We have adopted a code of business conduct and ethics for directors, officers (including our principal executive officer and principal financial and accounting officer and persons performing similar functions) and employees. The text of this code is located on our website at www.LoopNet.com under “About Us / Investor Relations /Corporate Governance.” The Company’s web site address provided above is not intended to function as a hyperlink, and the information on the Company’s web site is not and should not be considered part of this Annual Report on Form 10-K and is not incorporated by reference herein. We intend to disclose any amendments to or waivers from this code for our principal executive officer and principal financial and accounting officer on our website.
| Item | 11. Executive Compensation. |
The information required by this item is incorporated herein by reference from the information to be contained in our Proxy Statement under the sections entitled “Director Compensation,” “Executive Compensation,” “Compensation Discussion and Analysis.” and “Report of the Compensation Committee.”
| Item | 12. Security Ownership of Certain Beneficial Owners and Management and Related Stockholder Matters. |
The information required by this item is incorporated herein by reference from the information to be contained in our Proxy Statement under the section entitled “Common Stock Ownership of Certain Beneficial Owners and Management.”
Equity Compensation Plan Information
The following table provides information as of December 31, 2011 about our common stock that may be issued upon the exercise of options under our 2001 Stock Option and Purchase Plan and our 2006 Equity Incentive Plan. Our stockholders have approved each of these plans.
| Number of Securities | ||||||||||||
| Available for | ||||||||||||
| Number of Securities | Issuance Under | |||||||||||
| to be Issued | Weighted-Average | Equity Compensation | ||||||||||
| upon Exercise of | Exercise Price of | Plans (Excluding | ||||||||||
| Outstanding Options, | Outstanding Options, | Securities Reflected | ||||||||||
| Plan Name and Type |
Warrants and Rights | Warrants and Rights | in the First Column) | |||||||||
| Equity compensation plans approved by stockholders |
||||||||||||
| 2001 Stock Option and Purchase Plan |
93,022 | $ | 1.52 | — | ||||||||
| 2006 Equity Incentive Plan |
5,044,136 | $ | 10.99 | 5,955,934 | ||||||||
|
|
|
|
|
|||||||||
| Equity Compensation Plans not Approved by Stockholders |
None | None | None | |||||||||
|
|
|
|
|
|||||||||
| Total |
5,137,158 | $ | 10.81 | 5,955,934 | (1) | |||||||
|
|
|
|
|
|||||||||
| (1) | The 2006 Equity Incentive Plan is subject to an automatic annual increase of the least of (a) 1,800,000 shares, (b) 4% of the shares outstanding as of the end of the prior fiscal year, and (c) a lesser number as determined by the Company’s Board of Directors or Compensation Committee. |
| Item | 13. Certain Relationships and Related Transactions and Director Independence. |
Information regarding certain relationships and related transactions, and director independence is set forth under “Certain Relationships and Related Transactions” and “Corporate Governance — Board Independence” in the Proxy Statement, which information is incorporated herein by reference.
| Item | 14. Principal Accountant Fees and Services. |
Information regarding principal auditor fees and services is set forth under “Principal Accountant Fees and Services” in the Proxy Statement, which information is incorporated herein by reference.
49
Table of Contents
| Item 15. | Exhibits and Financial Statement Schedules. |
(a) The following documents are filed as part of this report:
(1) Financial Statements and Reports of Ernst & Young LLP
(2) Exhibits (numbered in accordance with Item 601 of Regulation S-K)
| 3.1 | First Amended and Restated Certificate of Incorporation (incorporated herein by reference to Exhibit 3.1 to the registrant’s Form 10-Q filed on August 4, 2006, File No. 000-52026) | |||
| 3.2 | Certificate of Designations of Series A Convertible Preferred Stock of the Company, filed with the Secretary of the State of the State of Delaware on March 30, 2009 (incorporated herein by reference to Exhibit 3.1 to the Company’s Current Report on Form 8-K filed with the SEC on April 2, 2009, File No. 000-52026) | |||
| 3.3 | Amended and Restated Bylaws of LoopNet, Inc., effective February 2, 2011 (incorporated herein by reference to Exhibit 3.1 to the registrant’s Form 8-K filed on February 4, 2011, File No. 000-52026) | |||
| 4.1 | Specimen Common Stock Certificate (incorporated herein by reference to Exhibit 4.1 to the registrant’s Form S-1/A filed on April 27, 2006, Registration No. 333-132138) | |||
| 4.2 | Amended and Restated Investor Rights Agreement by and among LoopNet, Inc. and certain holders of preferred stock, dated as of November 30, 2001 (incorporated herein by reference to Exhibit 4.2 to the registrant’s Form S-1 filed on March 1, 2006, Registration No. 333-132138) | |||
| 4.3 | Investors’ Rights Agreement, dated as of April 14, 2009, by and among the Company and certain investors (incorporated herein by reference to Exhibit B to the Schedule 13D filed with the SEC on April 24, 2009 by Calera Capital Partners IV, L.P., Calera Capital Partners IV Side-By-Side, L.P., Calera Capital Investors IV, L.P., and Calera Capital Management IV, Inc., File No. 005-82495) | |||
| 10.1+ | LoopNet, Inc. 2001 Stock Option and Purchase Plan (incorporated herein by reference to Exhibit 10.1 to the registrant’s Form S-1 filed on March 16, 2006, Registration No. 333-132138) | |||
| 10.2+ | Form of Option Agreement under 2001 Stock Option and Purchase Plan (incorporated herein by reference to Exhibit 10.2 to the registrant’s Form S-1 filed on March 1, 2006, Registration No. 333-132138) | |||
| 10.3+ | LoopNet, Inc. 2006 Equity Incentive Plan (incorporated herein by reference to Exhibit 10.3 to the registrant’s Form S-1/A filed on June 6, 2006, Registration No. 333-132138) | |||
| 10.4+ | Form of Option Agreement under 2006 Equity Incentive Plan (incorporated herein by reference to Exhibit 10.4 to the registrant’s Form S-1/A filed on April 27, 2006, Registration No. 333-132138) | |||
| 10.5+ | Form of Restricted Stock Unit Agreement under 2006 Equity Incentive Plan (incorporated herein by reference to Exhibit 10.11 to the registrant’s Form 8-K filed on February 5, 2008, File No. 000-52026) | |||
| 10.6+ | Form of Performance-Based Option Agreement under 2006 Equity Incentive Plan (incorporated herein by reference to Exhibit 10.6 to the registrant’s Form 10-K filed on March 1, 2010, File No. 000-52026) | |||
| 10.7+ | Form of Performance-Based Restricted Stock Unit Agreement under 2006 Equity Incentive Plan (incorporated herein by reference to Exhibit 10.7 to the registrant’s Form 10-K filed on March 1, 2010, File No. 000-52026) | |||
| 10.8+ | Form of Indemnification Agreement (incorporated herein by reference to Exhibit 10.8 to the registrant’s Form 10-K filed on March 1, 2010, File No. 000-52026) | |||
| 10.9 | Office Lease, dated January 8, 2003, between PWREF/MCC-China Basin L.L.C. and LoopNet, Inc. (incorporated herein by reference to Exhibit 10.7 to the registrant’s Form S-1/A filed on April 3, 2006, Registration No. 333-132138) | |||
| 10.10 | Seventh Amendment to Office Lease, dated January 8, 2003 between PWREF/MCC-China Basin L.L.C. and LoopNet, Inc. (incorporated herein by reference to Exhibit 10.12 to the registrant’s Form 10-Q filed on May 9, 2008, File No. 000-52026) |
50
Table of Contents
| 10.11 | Office Lease, dated November 30, 2010 between America’s Christian Credit Union and LoopNet, Inc. (incorporated herein by reference to Exhibit 10.11 to the registrant’s Form 10-K filed on March 3, 2011, File No. 000-52026) | |||
| 10.12+ | Director Compensation Policy (incorporated herein by reference to Exhibit 10.11 to the registrant’s Form S-1/A filed on April 27, 2006, Registration No. 333-132138) | |||
| 10.13+ | * | Form of Amendment to Option Agreement under the 2001 Stock Option and Purchase Plan and 2006 Equity Incentive Plan | ||
| 10.14+ | Form of Change of Control Severance Agreement (incorporated herein by reference to Exhibit 10.1 to the registrant’s Form 8-K filed on December 24, 2008, File No. 000-52026) | |||
| 10.15+ | Amendment No. 1 to the Change of Control Severance Agreement (incorporated herein by reference to Exhibit 10.1 to the registrant’s Form 8-K filed on February 4, 2011, File No. 000-52026) | |||
| 10.16+ | Securities Purchase Agreement, dated as of March 29, 2009, by and among the Company and certain purchasers (incorporated herein by reference to Exhibit A to the Schedule 13D filed with the SEC on April 24, 2009 by Calera Capital Partners IV, L.P., Calera Capital Partners IV Side-By-Side, L.P., Calera Capital Investors IV, L.P., and Calera Capital Management IV, Inc., File No. 005-82495) | |||
| 23.1 | * | Consent of Ernst & Young LLP, independent registered public accounting firm | ||
| 24.1 | * | Power of Attorney | ||
| 31.1 | * | Rule 13a-14(a) Certification (CEO) | ||
| 31.2 | * | Rule 13a-14(a) Certification (CFO) | ||
| 32.1 | * | Section 1350 Certification (CEO) | ||
| 32.2 | * | Section 1350 Certification (CFO) | ||
| 101.INS | ** | XBRL Instance Document | ||
| 101.SCH | ** | XBRL Taxonomy Extension Schema Document | ||
| 101.CAL | ** | XBRL Taxonomy Extension Calculation Linkbase Document | ||
| 101.DEF | ** | XBRL Taxonomy Extension Definition Linkbase Document | ||
| 101.LAB | ** | XBRL Taxonomy Extension Label Linkbase Document | ||
| 101.PRE | ** | XBRL Taxonomy Extension Presentation Linkbase Document |
| * | Filed herewith. |
| + | Management contract or compensatory plan. |
| ** | XBRL (Extensible Business Reporting Language) information is furnished and not filed herewith, is not a part of a registration statement or Prospectus for purposes of sections 11 or 12 of the Securities Act of 1933, is deemed not filed for purposes of section 18 of the Securities Exchange Act of 1934, and otherwise is not subject to liability under these sections. |
51
Table of Contents
Pursuant to the requirements of Section 13 or 15(d) of the Securities Exchange Act of 1934, the Registrant has duly caused this report to be signed on its behalf by the undersigned, thereunto duly authorized.
| LOOPNET, INC. | ||
| By: | /s/ Richard J. Boyle, Jr. | |
| Richard J. Boyle, Jr. | ||
| Chief Executive Officer, and Chairman of the Board of Directors | ||
Date: February 24, 2012
| By: | /s/ Brent Stumme | |
| Brent Stumme | ||
| Chief Financial Officer and | ||
| Senior Vice President, Finance | ||
| and Administration | ||
Date: February 24, 2012
POWER OF ATTORNEY
KNOW ALL PERSONS BY THESE PRESENTS, that each person whose signature appears below constitutes and appoints Richard J. Boyle, Jr. and Brent Stumme, jointly and severally, his or her attorneys-in-fact, each with the power of substitution, for him or her in any and all capacities, to sign any amendments to this Report on Form 10-K, and to file the same, with exhibits thereto and other documents in connection therewith with the Securities and Exchange Commission, hereby ratifying and confirming all that each of said attorneys-in-fact, or his or her substitute or substitutes may do or cause to be done by virtue hereof.
Pursuant to the requirements of the Securities Exchange Act of 1934, this report has been signed below by the following persons on behalf of the registrant and in the capacities and on the dates indicated.
| Signature |
Title |
Date | ||
| /S/ RICHARD J. BOYLE, JR. |
Chief Executive Officer, and Chairman of |
February 24, 2012 | ||
|
Richard J. Boyle, Jr. |
the Board of Directors (Principal Executive Officer) |
|||
| /s/ BRENT STUMME |
Chief Financial Officer and Senior Vice | February 24, 2012 | ||
|
Brent Stumme |
President, Finance and Administration (Principal Financial and Accounting Officer) |
|||
| /s/ NOEL J. FENTON |
Director | February 24, 2012 | ||
| Noel J. Fenton |
||||
| /s/ THOMAS E. UNTERMAN |
Director | February 24, 2012 | ||
| Thomas E. Unterman |
||||
52
Table of Contents
| Signature |
Title |
Date | ||
| /s/ DENNIS CHOOKASZIAN |
Director | February 24, 2012 | ||
| Dennis Chookaszian |
||||
| /s/ SCOTT INGRAHAM |
Director | February 24, 2012 | ||
| Scott Ingraham |
||||
| /s/ WILLIAM BYRNES |
Director | February 24, 2012 | ||
| William Byrnes |
||||
| /s/ JAMES T. FARRELL |
Director | February 24, 2012 | ||
| James T. Farrell |
||||
53
Table of Contents
INDEX TO FINANCIAL STATEMENTS
| Page | ||||
| Report of Independent Registered Public Accounting Firm on Internal Control Over Financial Reporting |
55 | |||
| 56 | ||||
| Financial Statements |
||||
| 57 | ||||
| 58 | ||||
| 59 | ||||
| 60 | ||||
| 61 | ||||
54
Table of Contents
REPORT OF INDEPENDENT REGISTERED PUBLIC ACCOUNTING FIRM ON INTERNAL CONTROL OVER FINANCIAL REPORTING
The Board of Directors and Stockholders
LoopNet, Inc.
We have audited LoopNet, Inc.’s internal control over financial reporting as of December 31, 2011, based on criteria established in Internal Control — Integrated Framework issued by the Committee of Sponsoring Organizations of the Treadway Commission (the COSO criteria). LoopNet, Inc.’s management is responsible for maintaining effective internal control over financial reporting, and for its assessment of the effectiveness of internal control over financial reporting included in the accompanying Management’s Report on Internal Control over Financial Reporting. Our responsibility is to express an opinion on the company’s internal control over financial reporting based on our audit.
We conducted our audit in accordance with the standards of the Public Company Accounting Oversight Board (United States). Those standards require that we plan and perform the audit to obtain reasonable assurance about whether effective internal control over financial reporting was maintained in all material respects. Our audit included obtaining an understanding of internal control over financial reporting, assessing the risk that a material weakness exists, testing and evaluating the design and operating effectiveness of internal control based on the assessed risk, and performing such other procedures as we considered necessary in the circumstances. We believe that our audit provides a reasonable basis for our opinion.
A company’s internal control over financial reporting is a process designed to provide reasonable assurance regarding the reliability of financial reporting and the preparation of financial statements for external purposes in accordance with generally accepted accounting principles. A company’s internal control over financial reporting includes those policies and procedures that (1) pertain to the maintenance of records that, in reasonable detail, accurately and fairly reflect the transactions and dispositions of the assets of the company; (2) provide reasonable assurance that transactions are recorded as necessary to permit preparation of financial statements in accordance with generally accepted accounting principles, and that receipts and expenditures of the company are being made only in accordance with authorizations of management and directors of the company; and (3) provide reasonable assurance regarding prevention or timely detection of unauthorized acquisition, use, or disposition of the company’s assets that could have a material effect on the financial statements.
Because of its inherent limitations, internal control over financial reporting may not prevent or detect misstatements. Also, projections of any evaluation of effectiveness to future periods are subject to the risk that controls may become inadequate because of changes in conditions, or that the degree of compliance with the policies or procedures may deteriorate.
In our opinion, LoopNet, Inc. maintained, in all material respects, effective internal control over financial reporting as of December 31, 2011, based on the COSO criteria.
We also have audited, in accordance with the standards of the Public Company Accounting Oversight Board (United States), the consolidated balance sheets of LoopNet, Inc. as of December 31, 2010 and 2011, and the related consolidated statements of income, stockholders’ equity, and cash flows for each of the three years in the period ended December 31, 2011 of LoopNet, Inc. and our report dated February 24, 2012 expressed an unqualified opinion thereon.
/s/ ERNST & YOUNG LLP
Los Angeles, California
February 24, 2012
55
Table of Contents
REPORT OF INDEPENDENT REGISTERED PUBLIC ACCOUNTING FIRM
The Board of Directors and Stockholders
LoopNet, Inc.
We have audited the accompanying consolidated balance sheets of LoopNet, Inc. as of December 31, 2010 and 2011, and the related consolidated statements of income, stockholders’ equity, and cash flows for each of the three years in the period ended December 31, 2011. These financial statements are the responsibility of the Company’s management. Our responsibility is to express an opinion on these financial statements based on our audits.
We conducted our audits in accordance with the standards of the Public Company Accounting Oversight Board (United States). Those standards require that we plan and perform the audit to obtain reasonable assurance about whether the financial statements are free of material misstatement. An audit includes examining, on a test basis, evidence supporting the amounts and disclosures in the financial statements. An audit also includes assessing the accounting principles used and significant estimates made by management, as well as evaluating the overall financial statement presentation. We believe that our audits provide a reasonable basis for our opinion.
In our opinion, the financial statements referred to above present fairly, in all material respects, the consolidated financial position of LoopNet, Inc. at December 31, 2010 and 2011, and the consolidated results of its operations and its cash flows for each of the three years in the period ended December 31, 2011, in conformity with U.S. generally accepted accounting principles.
We also have audited, in accordance with the standards of the Public Company Accounting Oversight Board (United States), LoopNet, Inc.’s internal control over financial reporting as of December 31, 2011, based on criteria established in Internal Control-Integrated Framework issued by the Committee of Sponsoring Organizations of the Treadway Commission and our report dated February 24, 2012 expressed an unqualified opinion thereon.
/s/ ERNST & YOUNG LLP
Los Angeles, California
February 24, 2012
56
Table of Contents
LOOPNET, INC.
| December 31, 2010 |
December 31, 2011 |
|||||||
| (In thousands, except share data) | ||||||||
| ASSETS | ||||||||
| Current assets: |
||||||||
| Cash and cash equivalents |
$ | 88,773 | $ | 107,573 | ||||
| Short-term investments |
3,512 | 3,529 | ||||||
| Accounts receivable, net of allowance of $236 and $318, respectively |
1,494 | 1,899 | ||||||
| Income tax receivable |
— | 11,045 | ||||||
| Prepaid expenses and other current assets |
1,095 | 1,445 | ||||||
| Deferred income taxes, net |
1,317 | 696 | ||||||
|
|
|
|
|
|||||
| Total current assets |
96,191 | 126,187 | ||||||
| Property and equipment, net |
2,010 | 3,165 | ||||||
| Goodwill |
41,507 | 41,507 | ||||||
| Intangibles, net |
8,940 | 6,385 | ||||||
| Deferred income taxes, net, non-current |
17,134 | 16,758 | ||||||
| Deposits and other non-current assets |
6,208 | 5,258 | ||||||
|
|
|
|
|
|||||
| Total assets |
$ | 171,990 | $ | 199,260 | ||||
|
|
|
|
|
|||||
| LIABILITIES AND STOCKHOLDERS’ EQUITY | ||||||||
| Current liabilities: |
||||||||
| Accounts payable |
$ | 471 | $ | 656 | ||||
| Accrued liabilities and other current liabilities |
3,393 | 5,765 | ||||||
| Accrued compensation and benefits |
3,522 | 4,049 | ||||||
| Deferred revenue |
8,888 | 9,422 | ||||||
|
|
|
|
|
|||||
| Total current liabilities |
16,274 | 19,892 | ||||||
| Other long-term liabilities |
2,491 | 1,768 | ||||||
| Commitments and contingencies |
||||||||
| Series A convertible preferred stock |
48,546 | 48,885 | ||||||
| Stockholders’ equity: |
||||||||
| Common stock, $.001 par value, 125,000,000 shares authorized; 39,866,097 and 42,736,152 shares issued, respectively; and 32,183,836 and 35,053,190 shares outstanding, respectively |
40 | 43 | ||||||
| Additional paid in capital |
132,019 | 154,289 | ||||||
| Other comprehensive loss |
(389 | ) | (423 | ) | ||||
| Treasury stock, at cost, 7,682,261 and 7,682,962 shares, respectively |
(86,220 | ) | (86,227 | ) | ||||
| Retained earnings |
59,229 | 61,033 | ||||||
|
|
|
|
|
|||||
| Total stockholders’ equity |
104,679 | 128,715 | ||||||
|
|
|
|
|
|||||
| Total liabilities and stockholders’ equity |
$ | 171,990 | $ | 199,260 | ||||
|
|
|
|
|
|||||
See accompanying notes.
57
Table of Contents
LOOPNET, INC.
CONSOLIDATED STATEMENTS OF INCOME
| Year ended December 31, | ||||||||||||
| 2009 | 2010 | 2011 | ||||||||||
| (In thousands, except per share data) | ||||||||||||
| Revenues |
$ | 76,487 | $ | 78,002 | $ | 86,661 | ||||||
| Cost of revenue |
11,060 | 12,562 | 12,784 | |||||||||
|
|
|
|
|
|
|
|||||||
| Gross margin |
65,427 | 65,440 | 73,877 | |||||||||
| Operating expenses: |
||||||||||||
| Sales and marketing |
15,064 | 16,785 | 23,642 | |||||||||
| Technology and product development |
10,707 | 12,231 | 16,975 | |||||||||
| General and administrative |
20,677 | 15,693 | 25,597 | |||||||||
| Amortization of acquired intangible assets |
1,191 | 2,083 | 2,556 | |||||||||
|
|
|
|
|
|
|
|||||||
| Total operating expenses |
47,639 | 46,792 | 68,770 | |||||||||
|
|
|
|
|
|
|
|||||||
| Income from operations |
17,788 | 18,648 | 5,107 | |||||||||
| Interest and other (expense) income, net |
211 | (2,461 | ) | (3,417 | ) | |||||||
|
|
|
|
|
|
|
|||||||
| Income before tax |
17,999 | 16,187 | 1,690 | |||||||||
| Income tax (benefit) expense |
6,246 | 461 | (453 | ) | ||||||||
|
|
|
|
|
|
|
|||||||
| Net income |
11,753 | 15,726 | 2,143 | |||||||||
|
|
|
|
|
|
|
|||||||
| Convertible preferred stock accretion of discount |
(240 | ) | (339 | ) | (339 | ) | ||||||
|
|
|
|
|
|
|
|||||||
| Net income applicable to common shareholders |
$ | 11,513 | $ | 15,387 | $ | 1,804 | ||||||
|
|
|
|
|
|
|
|||||||
| Net income per share applicable to common shareholders: |
||||||||||||
| Basic |
$ | 0.28 | $ | 0.38 | $ | 0.04 | ||||||
|
|
|
|
|
|
|
|||||||
| Diluted |
$ | 0.27 | $ | 0.36 | $ | 0.04 | ||||||
|
|
|
|
|
|
|
|||||||
| Number of shares used in per share calculations: |
||||||||||||
| Basic |
41,860 | 40,615 | 40,653 | |||||||||
| Diluted |
42,844 | 42,371 | 43,617 | |||||||||
See accompanying notes.
58
Table of Contents
LOOPNET, INC.
CONSOLIDATED STATEMENTS OF STOCKHOLDERS’ EQUITY
| Common Stock | Additional Paid-in Capital |
Retained Earnings (Deficit) |
Accumulated Other Comprehensive Loss |
Treasury Stock | Total Stockholders’ Equity |
|||||||||||||||||||||||||||
| Shares | Amount | Shares | Amount | |||||||||||||||||||||||||||||
| (In thousands) | ||||||||||||||||||||||||||||||||
| Balance at December 31, 2008 |
39,219 | $ | 39 | $ | 114,915 | $ | 32,329 | $ | (276 | ) | 4,926 | $ | (54,556 | ) | $ | 92,451 | ||||||||||||||||
| Stock-based award activity |
274 | — | 258 | — | — | — | — | 258 | ||||||||||||||||||||||||
| Stock-based compensation expense |
— | — | 6,827 | — | — | — | — | 6,827 | ||||||||||||||||||||||||
| Repurchase of common stock |
— | — | — | — | — | — | — | — | ||||||||||||||||||||||||
| Tax benefit from exercise of stock options |
— | — | 388 | — | — | — | — | 388 | ||||||||||||||||||||||||
| Convertible preferred stock accretion of discount |
— | — | — | (240 | ) | — | — | — | (240 | ) | ||||||||||||||||||||||
| Change in unrealized loss on available-for-sale investments |
— | — | — | — | (250 | ) | — | — | (250 | ) | ||||||||||||||||||||||
| Unrealized loss on marketable securities |
— | — | — | — | 108 | — | — | 108 | ||||||||||||||||||||||||
| Net income |
— | — | — | 11,753 | — | — | — | 11,753 | ||||||||||||||||||||||||
|
|
|
|||||||||||||||||||||||||||||||
| Total comprehensive income |
— | — | — | — | — | — | — | 11,611 | ||||||||||||||||||||||||
|
|
|
|
|
|
|
|
|
|
|
|
|
|
|
|
|
|||||||||||||||||
| Balance at December 31, 2009 |
39,493 | $ | 39 | $ | 122,388 | $ | 43,842 | $ | (418 | ) | 4,926 | $ | (54,556 | ) | $ | 111,295 | ||||||||||||||||
| Stock-based award activity |
373 | 1 | 867 | — | — | — | — | 868 | ||||||||||||||||||||||||
| Stock-based compensation expense |
— | — | 8,232 | — | — | — | — | 8,232 | ||||||||||||||||||||||||
| Repurchase of common stock |
— | — | — | — | — | 2,756 | (31,664 | ) | (31,664 | ) | ||||||||||||||||||||||
| Tax benefit from exercise of stock options |
— | — | 532 | — | — | — | — | 532 | ||||||||||||||||||||||||
| Convertible preferred stock accretion of discount |
— | — | — | (339 | ) | — | — | — | (339 | ) | ||||||||||||||||||||||
| Unrealized loss on marketable securities |
— | — | — | — | 29 | — | — | 29 | ||||||||||||||||||||||||
| Net income |
— | — | — | 15,726 | — | — | — | 15,726 | ||||||||||||||||||||||||
|
|
|
|||||||||||||||||||||||||||||||
| Total comprehensive income |
— | — | — | — | — | — | — | 15,755 | ||||||||||||||||||||||||
|
|
|
|
|
|
|
|
|
|
|
|
|
|
|
|
|
|||||||||||||||||
| Balance at December 31, 2010 |
39,866 | $ | 40 | $ | 132,019 | $ | 59,229 | $ | (389 | ) | 7,682 | $ | (86,220 | ) | $ | 104,679 | ||||||||||||||||
| Stock-based award activity |
2,870 | 3 | 14,697 | — | — | — | — | 14,700 | ||||||||||||||||||||||||
| Tax withholdings related to net share settlements of stock options and restricted stock units |
— | — | (15,081 | ) | — | — | — | — | (15,081 | ) | ||||||||||||||||||||||
| Stock-based compensation expense |
— | — | 14,202 | — | — | — | — | 14,202 | ||||||||||||||||||||||||
| Repurchase of common stock |
— | — | — | — | — | 1 | (7 | ) | (7 | ) | ||||||||||||||||||||||
| Tax benefit from exercise of stock options |
— | — | 8,452 | — | — | — | — | 8,452 | ||||||||||||||||||||||||
| Convertible preferred stock accretion of discount |
— | — | — | (339 | ) | — | — | — | (339 | ) | ||||||||||||||||||||||
| Unrealized loss on marketable securities |
— | — | — | — | (34 | ) | — | — | (34 | ) | ||||||||||||||||||||||
| Net income |
— | — | — | 2,143 | — | — | — | 2,143 | ||||||||||||||||||||||||
|
|
|
|||||||||||||||||||||||||||||||
| Total comprehensive income |
— | — | — | — | — | — | — | 2,109 | ||||||||||||||||||||||||
|
|
|
|
|
|
|
|
|
|
|
|
|
|
|
|
|
|||||||||||||||||
| Balance at December 31, 2011 |
42,736 | $ | 43 | $ | 154,289 | $ | 61,033 | $ | (423 | ) | 7,683 | $ | (86,227 | ) | $ | 128,715 | ||||||||||||||||
|
|
|
|
|
|
|
|
|
|
|
|
|
|
|
|
|
|||||||||||||||||
See accompanying notes.
59
Table of Contents
LOOPNET, INC.
CONSOLIDATED STATEMENTS OF CASH FLOWS
| Year ended December 31, | ||||||||||||
| 2009 | 2010 | 2011 | ||||||||||
| (In thousands) | ||||||||||||
| Cash flows from operating activities: |
||||||||||||
| Net income |
$ | 11,753 | $ | 15,726 | $ | 2,143 | ||||||
| Adjustments to reconcile net income to net cash provided by operating activities: |
||||||||||||
| Depreciation and amortization expense |
2,601 | 3,480 | 4,200 | |||||||||
| Stock-based compensation |
6,827 | 8,232 | 14,202 | |||||||||
| Tax benefits from exercise of stock options |
(388 | ) | (532 | ) | (8,452 | ) | ||||||
| Deferred income taxes |
(2,180 | ) | (9,834 | ) | (262 | ) | ||||||
| Impairment of equity investment |
— | 1,420 | 1,744 | |||||||||
| Changes in assets and liabilities, net of effects of acquisitions: |
||||||||||||
| Accounts receivable |
256 | (20 | ) | (405 | ) | |||||||
| Prepaid expenses and other assets |
388 | 1,498 | (283 | ) | ||||||||
| Income taxes payable |
542 | (154 | ) | — | ||||||||
| Accounts payable |
(76 | ) | (75 | ) | 185 | |||||||
| Accrued expenses and other liabilities |
7 | 1,295 | 1,648 | |||||||||
| Accrued compensation and benefits |
236 | 528 | 527 | |||||||||
| Deferred revenue |
(1,334 | ) | (302 | ) | 534 | |||||||
|
|
|
|
|
|
|
|||||||
| Net cash provided by operating activities |
18,632 | 21,262 | 15,781 | |||||||||
| Cash flows from investing activities: |
||||||||||||
| Purchase of property and equipment |
(1,437 | ) | (1,197 | ) | (2,795 | ) | ||||||
| Purchase of investments |
(1,250 | ) | (4,485 | ) | (2,250 | ) | ||||||
| Acquisitions, net of cash |
(312 | ) | (22,113 | ) | — | |||||||
|
|
|
|
|
|
|
|||||||
| Net cash used in investing activities |
(2,999 | ) | (27,795 | ) | (5,045 | ) | ||||||
| Cash flows from financing activities: |
||||||||||||
| Net proceeds from exercise of stock awards |
308 | 1,104 | 14,700 | |||||||||
| Net proceeds from sale of convertible preferred stock |
47,967 | — | — | |||||||||
| Tax withholdings related to net share settlements of stock options and restricted stock units |
(50 | ) | (237 | ) | (15,081 | ) | ||||||
| Repurchase of common stock |
— | (31,664 | ) | (7 | ) | |||||||
| Tax benefit from exercise of stock options |
388 | 532 | 8,452 | |||||||||
|
|
|
|
|
|
|
|||||||
| Net cash provided by (used in) financing activities |
48,613 | (30,265 | ) | 8,064 | ||||||||
|
|
|
|
|
|
|
|||||||
| Net increase (decrease) in cash and cash equivalents |
64,246 | (36,798 | ) | 18,800 | ||||||||
| Cash and cash equivalents at beginning of year |
61,325 | 125,571 | 88,773 | |||||||||
|
|
|
|
|
|
|
|||||||
| Cash and cash equivalents at end of year |
$ | 125,571 | $ | 88,773 | $ | 107,573 | ||||||
|
|
|
|
|
|
|
|||||||
| Supplemental disclosures of cash flow information: |
||||||||||||
| Cash paid during the year for income taxes |
$ | 8,535 | $ | 9,791 | $ | 1,595 | ||||||
| Settlement of contingent purchase price |
$ | 312 | $ | 188 | $ | 344 | ||||||
See accompanying notes.
60
Table of Contents
LOOPNET, INC.
NOTES TO CONSOLIDATED FINANCIAL STATEMENTS
| (1) | The Company and Summary of Significant Accounting Policies |
Organization and Basis of Presentation
LoopNet, Inc. (the “Company” or “LoopNet”) was incorporated under the laws of the state of California on June 2, 1997. The Company changed its name from Loop Ventures, Inc. to LoopNet, Inc. on November 3, 1998. Prior to Loop Ventures, Inc., the Company operated as a limited liability corporation known as Loop Ventures, LLC. On August 26, 1997, the owners of Loop Ventures, LLC exchanged all units held for a proportionate number of the shares of Loop Ventures, Inc. The transaction was recorded at historical basis.
On July 13, 2001, the Company merged with PropertyFirst.com, Inc. (“PropertyFirst”), with LoopNet, Inc. being the surviving company. The merger was accounted for under the purchase method of accounting. In order to preserve the existing rights and preferences of the different classes and series of PropertyFirst and LoopNet capital stock, each company reorganized by forming its own holding company. The two holding companies were limited liability companies (the “LLCs”), and continued in separate existence after the business combination of LoopNet and PropertyFirst. The LLCs were the direct owners of LoopNet, Inc. and the LLC members were the beneficial owners. In May 2006, prior to its initial public offering, the Company reincorporated in Delaware via a merger with and into LoopNet, Inc., a Delaware corporation.
On April 27, 2011, LoopNet and the CoStar Group, Inc. announced the signing of a Merger Agreement for the acquisition of LoopNet by CoStar (the “Merger”), which was approved by LoopNet’s stockholders at a special meeting on July 11, 2011. Completion of the Merger remains subject to the expiration or termination of the waiting period imposed by the Hart-Scott Rodino Antitrust Improvement Act of 1976 as amended (the “HSR Act”), and satisfaction or waiver of the other closing conditions specified in the Merger Agreement. See “Note 12 – Pending Merger with CoStar” for more information.
The accompanying consolidated financial statements include the accounts of the Company and its subsidiaries. All intercompany balances and transactions have been eliminated in consolidation. The Company evaluated subsequent events after the balance sheet date through the financial statement issuance date for appropriate accounting and disclosure.
Use of Estimates
The preparation of financial statements in conformity with U.S. generally accepted accounting principles (“GAAP”) requires management to make estimates and assumptions that affect the reported amounts of assets and liabilities and disclosure of contingent assets and liabilities at the date of the financial statements and the reported amounts of revenue, costs and expenses during the reporting period. Actual results could differ materially from these estimates.
Cash and Cash Equivalents
The Company considers all highly liquid investments with an original maturity of three months or less to be cash equivalents. As of December 31, 2011, substantially all of the Company’s cash and cash equivalents were in money market funds.
Short-term Investments
The Company accounts for short-term investments in accordance with Financial Accounting Standards Board (“FASB”) authoritative guidance on debt and equity securities investments. Management determines the appropriate classification of investments at the time of purchase and reevaluates such designation as of each balance sheet date. Short-term investments consist of marketable securities that the Company classifies as available for sale. The weighted average maturities of short-term investments are less than one year. These securities are carried at fair value, using level 1 indicators, which are quoted market prices for these securities. Unrealized gains and losses if any, net of taxes, are reported as other comprehensive income, a component of stockholders’ equity. Any realized gains or losses on the sale of investments are determined on a specific identification method, and such gains and losses are reflected as a component of interest and other income, net. As of December 31, 2011 and 2010, the cost basis of short-term investments was not significantly different than their carrying value.
61
Table of Contents
LOOPNET, INC.
NOTES TO CONSOLIDATED FINANCIAL STATEMENTS — (Continued)
Concentration of Risk
Financial instruments that potentially subject the Company to a concentration of credit risk consist of cash and cash equivalents, short-term investments and accounts receivable. Cash and cash equivalents and short-term investments are placed with high credit quality financial institutions. The Company’s revenue and accounts receivable are primarily derived from credit card transactions with subscribers and are typically settled within two to three business days.
No single customer accounted for more than 2.0% of the Company’s revenues for the years ended December 31, 2009, 2010 and 2011.
Fair Value of Financial Instruments
The Company’s financial instruments, including cash and cash equivalents, accounts receivable, and accounts payable and accrued liabilities are carried at cost, which approximates their fair value because of the short-term maturity of these instruments and the relatively stable interest rate environment.
Accounts Receivable
Accounts receivable are recorded at the invoiced amount and are non-interest bearing. The Company maintains an allowance for doubtful accounts to reserve for potentially uncollectible receivables. Management reviews the accounts receivable to identify specific subscribers where collectibility may not be probable. The amount of the allowance is determined by management estimates based on historic write-off trends and specific account analysis.
Property and Equipment
Property and equipment are stated at historical cost. Depreciation and amortization is computed using the straight-line method over the estimated useful lives of the assets, generally three years or less, or the shorter of the lease term or the estimated useful lives of the assets, if applicable.
Long-Lived Assets and Liabilities Including Goodwill and Other Intangible Assets
The Company reviews property and equipment and certain identifiable intangibles, excluding goodwill, for impairment whenever events or changes in circumstances indicate the carrying amount of an asset may not be recoverable. If property and equipment and these identifiable intangibles are considered to be impaired, the impairment to be recognized equals the amount by which the carrying value of the assets exceeds their fair value. The Company has not recorded any impairment of these assets in any of the years presented.
The Company applies FASB authoritative guidance related to goodwill and other intangibles. The authoritative guidance requires that goodwill and intangible assets with indefinite useful lives no longer be amortized, but instead be tested for impairment at least annually or sooner whenever events or changes in circumstances indicate that they may be impaired. The Company performed the annual impairment test during the fourth quarter of 2009, 2010 and 2011 and concluded that goodwill and intangible assets with indefinitive useful lives were not impaired.
The authoritative guidance also requires that intangible assets with definite lives be amortized over their estimated useful lives and reviewed for impairment whenever events or changes in circumstances indicate that an asset’s carrying value may not be recoverable in accordance with the authoritative guidance on property, plant, and equipment.
Intangible assets are comprised of customer relationships, acquired technology and a domain name acquired in connection with the Company’s acquisitions. Amortization is calculated using the straight-line method over estimated useful lives ranging from 0.5 years to 8 years.
Goodwill represents the excess of the purchase price over the fair value of identifiable assets acquired and liabilities assumed in business combinations accounted for under the purchase method. The Company believes no events or changes in circumstances have occurred that would require an impairment test for these assets other than required annual tests.
62
Table of Contents
LOOPNET, INC.
NOTES TO CONSOLIDATED FINANCIAL STATEMENTS — (Continued)
Investments in Unconsolidated Joint Ventures
The Company accounts for investments in unconsolidated joint-ventures under the equity method in accordance with ASC 323, Investments-Equity Method and Joint Ventures. The Company’s equity method investments as of December 31, 2010 and 2011 totaled $4.7 million and $3.9 million, respectively, and are included in deposits and other non-current assets on the consolidated balance sheets. For the years ended December 31, 2009, 2010 and 2011, the Company recognized losses in equity investments of $0.3 million, $0.7 million, $1.3 million, respectively, including impairment charges of $0, $1.4 million, $1.7 million, respectively, and are included in interest and other (expense) income, net on the consolidated statements of income.
Income Tax Expense
Deferred tax assets and liabilities arise from the differences between the tax basis of an asset or liability and its reported amount in the financial statements as well as from net operating loss and tax credit carry forwards. Deferred tax amounts are determined by using the tax rates expected to be in effect when the taxes will actually be paid or refunds received, as provided under current tax law. Valuation allowances are established when necessary to reduce deferred tax assets to the amount expected to be realized. Income tax expense or benefit is the tax payable or refundable, respectively, for the period plus or minus the change during the period in deferred tax assets and liabilities.
The Company follows guidance set forth in ASC 740, Income Taxes, surrounding accounting for uncertainty in income taxes. The guidance clarifies the accounting for income taxes by prescribing a minimum probability threshold that a tax position must meet before a financial statement benefit is recognized. The minimum threshold is defined as a tax position that is more likely than not to be sustained upon examination by the applicable taxing authority, including resolution of any related appeals or litigation processes, based on the technical merits of the position. The tax benefit to be recognized is measured as the largest amount of benefit that is greater than fifty percent likely of being realized upon ultimate settlement.
Business Segment
The Company considers itself to be in a single business segment which is defined as providing an online marketplace serving the commercial real estate industry and operating businesses for sale industry. Substantially all of the Company’s business comes from customers and operations located within the United States, and the Company does not have any assets located in foreign countries.
Revenue Recognition
The Company derives substantially all its revenue from customers that pay fees for a suite of services to market and search for commercial real estate and operating businesses. These services include a premium membership that gives the customer unlimited access to listings, maximized exposure for their listings along with enhanced services to market their listings. The Company recognizes revenue under the provisions of Securities and Exchange Commission (“SEC”) Staff Accounting Bulletin (“SAB”) guidance related to revenue recognition, when persuasive evidence of an agreement exists, delivery has occurred, the sales price is fixed or determinable and collectibility is reasonably assured. For the majority of our revenues, payments for LoopNet premium memberships, revenues are recognized immediately on a monthly basis as such accounts are charged on credit cards. Payments received in advance of services being rendered are recorded as deferred revenue and recognized on a straight-line basis over the service period.
Revenue from other sources includes advertising revenues which are recognized ratably over the period in which the advertisement is displayed provided that no significant obligations remain and collection of the resulting receivable is probable. Advertising rates are dependent on the services provided and the placement of the advertisements. To date, the duration of the Company’s advertising commitments has generally averaged two to three months.
63
Table of Contents
LOOPNET, INC.
NOTES TO CONSOLIDATED FINANCIAL STATEMENTS — (Continued)
Cost of Revenues
Cost of revenues consists of the expenses associated with the operation of the Company’s website, including depreciation of network infrastructure equipment, salaries and benefits of network operations personnel, internet connectivity and hosting costs. Cost of revenues also includes salaries and benefit expenses associated with the Company’s data quality, data import and customer support personnel and credit card and other transaction fees relating to processing customer transactions.
Sales and Marketing
The Company’s sales and marketing expenses relate primarily to the compensation and associated costs for sales and marketing personnel, advertising expenses as well as public relations and other promotional activities.
Advertising costs are expensed in the period they are incurred. Included in sales and marketing expenses were $2.6 million, $2.6 million and $3.2 million for the years ended December 31, 2009, 2010 and 2011, respectively.
Technology and Product Development
Technology and product development costs are expensed as incurred and include expenses for the research and development of new products and services, as well as improvements to existing products and services. Also included are costs associated with the maintenance of the Company’s existing products.
General and Administrative
General and administrative costs consist primarily of salaries and related expenses for executive, accounting and human resources personnel. These costs also include insurance and professional fees, facility costs and related expenses. Professional fees primarily consist of outside legal and audit fees. All costs are expensed as incurred.
Comprehensive Income
Comprehensive income is comprised of net income and other comprehensive income. Other comprehensive income includes unrealized gains and losses on available-for-sale investments. The differences between total comprehensive income and net income as disclosed on the consolidated statements of stockholders’ equity for the years ended December 31, 2009, 2010 and 2011 were insignificant.
Stock-Based Compensation
The Company applies FASB authoritative guidance ASC 718, Compensation-Stock Compensation, surrounding share-based compensation. The guidance requires that share-based payment transactions with employees be recognized in the financial statements based on their fair value and recognized as compensation expense over the vesting period.
Recent Accounting Pronouncements
In September 2011, the FASB issued new accounting guidance that simplifies goodwill impairment tests. The new guidance states that a “qualitative” assessment may be performed to determine whether further impairment testing is necessary. The effective date for this guidance is reporting periods beginning on or after December 15, 2011 with early adoption permitted. The Company has early adopted this accounting standard upon its effective date, and the adoption did not have a significant impact on the financial position or results of operations.
In June 2011, the FASB issued new disclosure guidance related to the presentation of the Statement of Comprehensive Income. This guidance eliminates the current option to report other comprehensive income and its components in the consolidated statement of stockholders’ equity. The requirement to present reclassification adjustments out of accumulated other comprehensive income on the face of the consolidated statement of income has been deferred. The effective date for this guidance is reporting periods beginning on or after December 15, 2011. The Company will adopt this accounting standard upon its effective date, and this adoption will not have any impact on the financial position or results of operations but will impact the financial statement presentation.
64
Table of Contents
LOOPNET, INC.
NOTES TO CONSOLIDATED FINANCIAL STATEMENTS — (Continued)
| (2) | Earnings per Share |
The number of shares used to compute basic and diluted net income per share is calculated as follows (in thousands):
| Year Ended December 31, | ||||||||||||
| 2009 | 2010 | 2011 | ||||||||||
| Weighted average common shares outstanding |
34,420 | 33,175 | 33,213 | |||||||||
| Convertible preferred stock |
7,440 | 7,440 | 7,440 | |||||||||
|
|
|
|
|
|
|
|||||||
| Shares used to compute basic net income applicable to common stockholders |
41,860 | 40,615 | 40,653 | |||||||||
| Add dilutive common equivalents: |
||||||||||||
| Stock options |
930 | 1,308 | 2,276 | |||||||||
| Restricted stock units |
54 | 448 | 688 | |||||||||
|
|
|
|
|
|
|
|||||||
| Shares used to compute diluted net income applicable to common stockholders |
42,844 | 42,371 | 43,617 | |||||||||
|
|
|
|
|
|
|
|||||||
The following is a summary of the securities outstanding during the respective periods that have been excluded from the calculations because the effect on earnings per share would have been anti-dilutive (in thousands):
| Year Ended December 31, | ||||||||||||
| 2009 | 2010 | 2011 | ||||||||||
| Stock options |
4,673 | 3,595 | 932 | |||||||||
| Restricted stock units |
113 | 55 | — | |||||||||
The following table sets forth the computation of basic and diluted EPS (in thousands, except per share data):
| Year Ended December 31, | ||||||||||||
| 2009 | 2010 | 2011 | ||||||||||
| Calculation of basic net income per share applicable to |
||||||||||||
| Net income |
$ | 11,753 | $ | 15,726 | $ | 2,143 | ||||||
| Convertible preferred stock accretion of discount |
(240 | ) | (339 | ) | (339 | ) | ||||||
|
|
|
|
|
|
|
|||||||
| Net income applicable to common shareholders |
$ | 11,513 | $ | 15,387 | $ | 1,804 | ||||||
|
|
|
|
|
|
|
|||||||
| Shares used to compute basic net income applicable to common shareholders |
41,860 | 40,615 | 40,653 | |||||||||
|
|
|
|
|
|
|
|||||||
| Basic net income per share applicable to common shareholders |
$ | 0.28 | $ | 0.38 | $ | 0.04 | ||||||
|
|
|
|
|
|
|
|||||||
| Calculation of diluted net income per share applicable to common shareholders: |
||||||||||||
| Net income |
$ | 11,753 | $ | 15,726 | $ | 2,143 | ||||||
| Convertible preferred stock accretion of discount |
(240 | ) | (339 | ) | (339 | ) | ||||||
|
|
|
|
|
|
|
|||||||
| Net income applicable to common shareholders |
$ | 11,513 | $ | 15,387 | $ | 1,804 | ||||||
|
|
|
|
|
|
|
|||||||
| Shares used to compute diluted net income applicable to common shareholders |
42,844 | 42,371 | 43,617 | |||||||||
|
|
|
|
|
|
|
|||||||
| Dilutive net income per share applicable to common shareholders |
$ | 0.27 | $ | 0.36 | $ | 0.04 | ||||||
|
|
|
|
|
|
|
|||||||
65
Table of Contents
LOOPNET, INC.
NOTES TO CONSOLIDATED FINANCIAL STATEMENTS — (Continued)
| (3) | Property and Equipment, net |
Property and equipment, net consists of the following (in thousands):
| As of December 31, | ||||||||
| 2010 | 2011 | |||||||
| Computer equipment and purchased software |
$ | 6,839 | $ | 7,630 | ||||
| Office equipment and furniture (includes leasehold improvements) |
1,102 | 2,058 | ||||||
|
|
|
|
|
|||||
| 7,941 | 9,688 | |||||||
| Less accumulated depreciation and amortization |
(5,931 | ) | (6,523 | ) | ||||
|
|
|
|
|
|||||
| Property and equipment, net |
$ | 2,010 | $ | 3,165 | ||||
|
|
|
|
|
|||||
During 2011, the Company recorded an adjustment to eliminate from property and equipment approximately $1.0 million of fully depreciated property and equipment.
| (4) | Acquisitions |
During the year ended December 31, 2010, the Company acquired BizQuest on January 4, 2010, Reaction Web on March 15, 2010 and LandsofAmerica on September 1, 2010, each pursuant to Asset Purchase Agreements for a total cash consideration of $22.1 million (net of cash acquired), plus potential gross earn-out payments ranging from zero to $4.3 million that are contingent upon achievement of certain performance targets. As of December 31, 2011, the Company recorded a discounted contingent liability of $3.1 million for these potential earn-out payments, including $1.3 million in current accrued liabilities. With these acquisitions, LoopNet has expanded its business-for-sale and land marketplaces, as well, as enhanced the Company’s suite of products.
The acquisitions were accounted for as business combinations consistent with the authoritative guidance regarding business combinations, and accordingly, the purchase prices have been allocated to the tangible assets and identifiable intangible assets acquired based on their estimated fair values on the acquisition date. The excess of the purchase prices over the aggregate fair values were recorded as goodwill. Goodwill recorded in connection with the above acquisitions is primarily attributable to the assembled workforces of the acquired businesses and the synergies expected to arise after the Company’s acquisition of those businesses.
As a result of the above acquisitions, the Company recorded intangible assets related to customer relationships, developed technology and non-competition agreements in the aggregate of $4.0 million that are being amortized on a straight-line basis. Also, included in other intangible assets are trade names of $2.5 million which have an indefinite life and are tested on an annual basis for impairment. The remaining excess purchase price over tangible assets and identifiable intangible assets for these acquisitions of $18.0 million have been recorded as goodwill.
The Company’s purchase prices were allocated as follows (in thousands):
| Customer relationships |
$ | 1,852 | ||
| Trade names |
2,521 | |||
| Developed technology |
2,068 | |||
| Non-competition agreements |
95 | |||
| Goodwill |
17,951 | |||
|
|
|
|||
| Total |
$ | 24,487 | ||
|
|
|
Customer relationships, developed technology and non-competition agreements have a weighted-average useful life of 3.4 years, 2.0 years and 2.9 years, respectively from the date of acquisition. The amount of goodwill expected to be deductible for tax purposes is $18.0 million.
66
Table of Contents
LOOPNET, INC.
NOTES TO CONSOLIDATED FINANCIAL STATEMENTS — (Continued)
The results of operations of the entities have been included in the Company’s consolidated statements of income for the period subsequent to the Company’s acquisition. The entities’ results of operations for the periods prior to the acquisition were not material to the Company’s consolidated statement of income and, accordingly, pro forma financial information have not been presented.
| (5) | Goodwill and Intangible Assets, net |
The changes in the carrying amount of goodwill for the years ended December 31, 2009, 2010 and 2011 were as follows (in thousands):
| Balance as of December 31, 2008 |
$ | 23,056 | ||
| Goodwill adjustment |
312 | |||
|
|
|
|||
| Balance as of December 31, 2009 |
23,368 | |||
| Goodwill acquired |
17,951 | |||
| Goodwill adjustment |
188 | |||
|
|
|
|||
| Balance as of December 31, 2010 and 2011 |
$ | 41,507 | ||
|
|
|
The $312,000 and $188,000 goodwill adjustments in 2009 and 2010, respectively were due to the contingent payments earned upon the achievement of certain performance targets by LandAndFarm.com, Inc.
Intangible assets, net consisted of the following (in thousands):
| As of December 31, | ||||||||
| 2010 | 2011 | |||||||
| Cost: |
||||||||
| Customer relationships |
$ | 3,563 | $ | 3,563 | ||||
| Technology |
5,445 | 5,445 | ||||||
| Non-competition agreement |
158 | 158 | ||||||
| Domain name |
4,515 | 4,515 | ||||||
|
|
|
|
|
|||||
| Total cost |
13,681 | 13,681 | ||||||
| Accumulated amortization: |
||||||||
| Customer relationships |
(1,416 | ) | (2,174 | ) | ||||
| Technology |
(2,791 | ) | (4,393 | ) | ||||
| Non-competition agreement |
(65 | ) | (110 | ) | ||||
| Domain name |
(469 | ) | (619 | ) | ||||
|
|
|
|
|
|||||
| Total accumulated amortization |
(4,741 | ) | (7,296 | ) | ||||
|
|
|
|
|
|||||
| Intangible assets, net |
$ | 8,940 | $ | 6,385 | ||||
|
|
|
|
|
|||||
Customer relationships, developed technology and non-competition agreements have a weighted-average useful life of 5.0 years, 0.8 years and 1.4 years, respectively from the date of acquisition. Amortization expense was $1.2 million, $2.1 million and $2.6 million for the years ended December 31, 2009, 2010 and 2011, respectively. As of December 31, 2011, expected amortization expense for acquisition-related intangible assets for each of the next five years and thereafter is as follows (in thousands):
| 2012 |
$ | 1,807 | ||
| 2013 |
640 | |||
| 2014 |
198 | |||
| 2015 |
80 | |||
| 2016 |
34 | |||
|
|
|
|||
| $ | 2,759 | |||
|
|
|
67
Table of Contents
LOOPNET, INC.
NOTES TO CONSOLIDATED FINANCIAL STATEMENTS — (Continued)
As of December 31, 2010 and 2011, total intangible assets with indefinite lives not subject to amortization were $ 3.6 million and are included in domain name as part of intangible assets.
| (6) | Income Tax Expense |
Income tax (benefit) expense was comprised of the following (in thousands):
| Year Ended December 31, | ||||||||||||
| 2009 | 2010 | 2011 | ||||||||||
| Current: |
||||||||||||
| Federal |
$ | 6,688 | $ | 8,025 | $ | (967 | ) | |||||
| State |
1,767 | 2,352 | (23 | ) | ||||||||
|
|
|
|
|
|
|
|||||||
| Total |
$ | 8,455 | $ | 10,377 | $ | (990 | ) | |||||
| Deferred: |
||||||||||||
| Federal |
$ | (1,513 | ) | $ | (9,066 | ) | $ | 710 | ||||
| State |
(696 | ) | (850 | ) | (173 | ) | ||||||
|
|
|
|
|
|
|
|||||||
| Total |
$ | (2,209 | ) | $ | (9,916 | ) | $ | 537 | ||||
|
|
|
|
|
|
|
|||||||
| Income tax (benefit) expense |
$ | 6,246 | $ | 461 | $ | (453 | ) | |||||
|
|
|
|
|
|
|
|||||||
A reconciliation of the statutory federal income tax rate to the effective tax rate is as follows:
| Year Ended December 31, | ||||||||||||
| 2009 | 2010 | 2011 | ||||||||||
| Statutory federal tax rate |
35.0 | % | 35.0 | % | 35.0 | % | ||||||
| State tax rate, net of federal benefit and tax credits |
3.9 | % | 6.0 | % | (13.0 | )% | ||||||
| Change in valuation allowance |
(4.4 | )% | (39.6 | )% | 5.4 | % | ||||||
| Disqualifying incentive stock options |
0 | % | 0 | % | (52.7 | )% | ||||||
| Other |
0.2 | % | 1.5 | % | (1.5 | )% | ||||||
|
|
|
|
|
|
|
|||||||
| Effective tax rate |
34.7 | % | 2.9 | % | (26.8 | )% | ||||||
|
|
|
|
|
|
|
|||||||
The tax effects of temporary differences that gave rise to significant components of deferred tax assets and liabilities were as follows (in thousands):
| As of December 31, | ||||||||
| 2010 | 2011 | |||||||
| Deferred tax assets: |
||||||||
| Net operating loss carryforwards |
$ | 10,108 | $ | 10,248 | ||||
| Depreciation and amortization |
598 | 483 | ||||||
| Stock-based compensation |
7,235 | 3,715 | ||||||
| Accruals and allowances |
364 | 504 | ||||||
| Tax credits |
1,235 | 1,385 | ||||||
| Transaction costs |
6 | 2,017 | ||||||
| Investments |
1,115 | 2,264 | ||||||
| Other |
104 | — | ||||||
|
|
|
|
|
|||||
| Total deferred tax assets |
20,765 | 20,616 | ||||||
| Valuation allowance |
(564 | ) | (704 | ) | ||||
|
|
|
|
|
|||||
| Total deferred tax assets, net of valuation allowance |
20,201 | 19,912 | ||||||
| Deferred tax liabilities: |
||||||||
| Intangibles |
(1,750 | ) | (1,750 | ) | ||||
| Other |
— | (708 | ) | |||||
|
|
|
|
|
|||||
| Total deferred tax liabilities |
(1,750 | ) | (2,458 | ) | ||||
| Deferred tax assets, net |
$ | 18,451 | $ | 17,454 | ||||
|
|
|
|
|
|||||
68
Table of Contents
LOOPNET, INC.
NOTES TO CONSOLIDATED FINANCIAL STATEMENTS — (Continued)
In the fourth quarter of 2010, the Company determined that it is more likely than not that it would generate sufficient taxable income from operations in future years to realize tax benefits arising from the use of our net operating loss carryforwards and therefore in 2010 the Company reversed $6.6 million of the valuation allowance on the deferred tax assets. The release of the valuation allowance in the fourth quarter of 2010 resulted in a tax benefit of $6.6 million that was recognized in our results from operations. As of December 31, 2011, the Company continued to maintain a valuation allowance of approximately $0.7 million for certain state net operating loss carryforwards due to the uncertainty of realization. The Company utilized net operating loss carryforwards against taxable income of $3.7 million for the fiscal years 2009 and 2010, and $0 for fiscal year 2011.
At December 31, 2011, the Company had approximately $24.1 million of federal and $44.1 million of state net operating loss carryforwards available to reduce future taxable income which will begin to expire in 2021 for federal and 2017 for state purposes, respectively.
Under Section 382 of the Internal Revenue Code, the utilization of the net operating loss carryforwards is limited based upon changes in the percentage of the ownership of the Company. As a result of prior ownership changes, the Company will be able to utilize approximately $5.7 million in 2012, $2.9 million in 2013, $2.0 million each year thereafter until 2020 and $1.1 million in 2021 when the net operating losses would be fully utilized. The Company did not utilize any net operating losses in 2011.
A reconciliation of unrecognized tax benefits as follows:
| Balance as of December 31, 2009 |
$ | — | ||
| Increases for position taken in current year |
223,640 | |||
| Decreases for positions taken in current year |
— | |||
|
|
|
|||
| Balance as of December 31, 2010 |
223,640 | |||
| Increases for position taken in current year |
14,669 | |||
| Decreases for positions taken in current year |
— | |||
|
|
|
|||
| Balance as of December 31, 2011 |
$ | 238,309 | ||
|
|
|
The Company evaluates its tax positions for all income tax items based on their technical merits to determine whether each position satisfies the “more likely than not to be sustained upon examination” test. The tax benefits are then measured as the largest amount of benefit, determined on a cumulative basis, that is “more likely than not” to be realized upon ultimate settlement. The Company will report a liability for unrecognized tax benefits resulting from uncertain tax positions taken or expected to be taken in a tax return. GAAP further requires that a change in judgment related to the expected ultimate resolution of uncertain tax positions be recognized in earnings in the quarter in which such change occurs. The liability for unrecognized tax benefits was $145,000 and $155,000 for the years ended December 31, 2010 and 2011.
The Company recognizes interest and/or penalties related to uncertain tax positions in income tax expense. To the extent accrued interest and/or penalties do not ultimately become payable, amounts accrued will be reduced and reflected as a reduction of overall income tax provision in the period that such determination is made. The interest and/or penalties expense was $0, $0 and $26,000 for the years ended December 31, 2009, 2010 and 2011.
| (7) | Series A Convertible Preferred Stock |
On April 14, 2009, the Company completed a $50 million private placement to accredited investors (the “Purchasers”). The transaction was exempt from registration pursuant to Section 4(2) of the Securities Act of 1933, as amended. Pursuant to the Securities Purchase Agreement (the “Purchase Agreement”), the Company agreed to sell to the Purchasers an aggregate of 50,000 shares of its newly-created Series A Convertible Preferred Stock, par value $0.001 per share (the “Series A Preferred Stock”). The Series A Preferred Stock is initially convertible into an aggregate of 7,440,476 shares of the Company’s common stock, par value $0.001 per share (“Common Stock”), at a conversion price of $6.72 per share (as may be adjusted for stock dividends, stock splits or similar recapitalizations).
69
Table of Contents
LOOPNET, INC.
NOTES TO CONSOLIDATED FINANCIAL STATEMENTS — (Continued)
The holders of the Series A Preferred Stock are entitled to receive, prior to any distribution to the holders of the Common Stock, an amount per share equal to the greater of (1) the Original Issue Price, plus any declared and unpaid dividends and (2) the amount that Purchasers would receive in respect of the shares of Common Stock issuable upon conversion of the Series A Preferred Stock if all of the then outstanding Series A Preferred Stock were converted into Common Stock. The rights, privileges and preferences of the Series A convertible preferred stock are set forth in the Certificate of Designations of Series A Convertible Preferred Stock attached as an exhibit to the Company’s Form 8-K filed with the SEC on April 2, 2009.
The transaction closed on April 14, 2009. The net proceeds of $48 million from the issuance of the Series A Preferred Stock are net of issuance costs of $2 million. The Series A Preferred Stock reported on the Company’s consolidated balance sheet consists of the net proceeds plus the amount of accretion for issuance costs. Such accretion costs are being accreted over 72 months with such accretion being recorded as a reduction in retained earnings.
A summary of activity related to the Series A convertible preferred stock is as follows (in thousands):
| Gross Proceeds |
$ | 50,000 | ||
| Costs and expenses of issuance |
(2,033 | ) | ||
| Accretion of discount |
918 | |||
|
|
|
|||
| Net convertible preferred stock at December 31, 2011 |
$ | 48,885 | ||
|
|
|
The rights, privileges and preferences of the Series A convertible preferred stock are set forth in the Certificate of Designations of Series A Convertible Preferred Stock attached as an exhibit to the Company’s Form 8-K filed with the SEC on April 2, 2009.
Voting
Each share of Series A Preferred Stock shall entitle the holder thereof to vote, in person or by proxy, at a special or annual meeting of the stockholders of the Company, on all matters voted on by holders of Common Stock, voting together as a single class with the holders of the Common Stock and all other shares entitled to vote thereon as a single class with the Common Stock. With respect to all such matters, each issued and outstanding share of Series A Preferred Stock shall entitle the holder thereof to cast that number of votes per share as is equal to the number of votes that such holder would be entitled to cast had such holder converted such holder’s Series A Preferred Stock into Common Stock on the record date for determining the stockholders of the Company eligible to vote on any such matters.
Dividends
Whenever the Company shall pay a dividend or distribution on the Common Stock of the Company, par value $0.001 per share, each holder of a share of Series A Preferred Stock shall be entitled to receive, at the same time the dividend or distribution is paid on the Common Stock, out of the assets of the Company legally available therefore, a dividend or distribution equal to the amount that would have been paid in respect of the Common Stock issuable upon conversion of such share of Series A Preferred Stock immediately prior to the close of business on the record date for determining the holders entitled to receive such dividend or distribution on the Common Stock, or, if no such record is taken, the date on which the record holders of Common Stock entitled to such dividend or distribution is determined.
The holders of shares of Series A Preferred Stock shall not be entitled to receive any dividends except as provided herein.
Liquidation
Upon the effective date of any voluntary or involuntary liquidation, dissolution or winding up of the Company (“Liquidation Event”), the holders of Series A Preferred Stock shall be entitled to be paid out of the assets of the Company legally available for distribution to its stockholders an amount per share (“Liquidation Preference”) equal to the greater of (a) (i) $1,000 (subject to appropriate adjustments in the event of any stock dividend, stock split,
70
Table of Contents
LOOPNET, INC.
NOTES TO CONSOLIDATED FINANCIAL STATEMENTS — (Continued)
combination or other similar recapitalization affecting such shares) (“ Original Issue Price”) plus (ii) all declared but unpaid dividends and (b) the amount that the holder of such shares of Series A Preferred Stock would receive in respect of the shares of Common Stock issuable upon conversion of such shares of Series A Preferred Stock if all of the then outstanding shares of Series A Preferred Stock were converted into Common Stock in accordance herewith immediately prior to the Liquidation Event. A Change of Control (as defined below) shall not be deemed a Liquidation Event. If, upon the effective date of a Liquidation Event, the assets of the Company shall be insufficient to make payment in full of the Liquidation Preference to all holders of the Series A Preferred Stock and all other now or hereafter authorized capital stock of the Company ranking on a parity with (upon liquidation, dissolution or winding up) the Series A Preferred Stock, then such assets shall be distributed among the holders of Series A Preferred Stock and the holders of such other capital stock of the Company ranking on a parity with (upon dissolution, liquidation or winding up) the Series A Preferred Stock at the time outstanding, ratably in proportion to the full amounts to which they would otherwise be respectively entitled.
No distribution shall be made in respect of any shares of Series A Preferred Stock pursuant to Section 3(a) unless, at the time of such distribution, all amounts due in respect of any shares of any now or hereafter authorized capital stock of the Company ranking senior to (upon liquidation, dissolution or winding-up) the Series A Preferred Stock have been paid in full.
Upon the effective date of a Liquidation Event, no distribution shall be made in respect of any shares of Common Stock or any other now or hereafter authorized capital stock of the Company ranking junior to (upon liquidation, dissolution or winding-up) the Series A Preferred Stock unless, at the time of such distribution, the holders of shares of Series A Preferred Stock shall have received the full Liquidation Preference with respect to each share.
After payment in full of the Liquidation Preference to holders of all shares of Series A Preferred Stock, the Series A Preferred Stock shall not be entitled to receive any additional cash, property or other assets of the Company upon the liquidation, dissolution or winding up of the Company.
Conversion
Each share of Series A Preferred Stock shall be convertible, at the option of the holder thereof, at any time and from time to time, and without the payment of additional consideration by the holder thereof, into a number of shares of Common Stock determined by dividing the Original Issue Price by the Conversion Price. The Conversion Price shall initially be $6.72, and shall be subject to adjustment.
Redemption at the option of the Company
If at any time the closing price of the Common Stock as reported by the principal exchange or quotation system on which such Common Stock is traded or reported exceeds sixteen dollars and eighty cents ($16.80) per share for 20 consecutive trading or reporting days, the Company shall have the option, at its sole discretion, to redeem all, but not less than all, of the then outstanding Series A Preferred Stock for cash consideration per share of Series A Preferred Stock in an amount equal to one-hundred and one percent (101%) of the Original Issue Price plus all accrued but unpaid dividends.
Redemption at the option of the Holder
At any time on or after the sixth (6th) anniversary of the Original Issuance Date and on or before the date that is ten (10) Business Days thereafter, each holder of shares of Series A Preferred Stock shall have the option, at such holder’s sole discretion, to request that the Company redeem any or all, of such holder’s then outstanding Series A Preferred Stock for cash consideration per share of Series A Preferred Stock in an amount equal to the Original Issue Price plus all declared but unpaid dividends.
| (8) | Treasury Stock |
LoopNet’s Board of Directors authorized the repurchase of up to $50.0 million of the Company’s common stock on February 5, 2008 and an additional authorized level of $50.0 million was announced on July 30, 2008.
71
Table of Contents
LOOPNET, INC.
NOTES TO CONSOLIDATED FINANCIAL STATEMENTS — (Continued)
During 2008, the Company repurchased $54.6 million of the Company’s common stock. In February 2010, the Board of Directors approved the repurchase of up to an additional $29.6 million in shares of the Company’s common stock, bringing to $75.0 million the total amount of authorized Common Stock repurchases, of which $43.3 million remained available as of December 31, 2011. Repurchased shares are recorded as treasury stock and are accounted for under the cost method.
| (9) | Stock Option Plan |
The Company adopted the 2006 Equity Incentive Plan (the “2006 Plan”), which became effective on completion of our initial public offering in June 2006. The 2006 Plan provides for the grant of stock options, stock appreciation rights, stock units and other similar stock awards. Options granted under the 2006 Plan may be either “incentive stock options,” as defined under Section 422 of the Internal Revenue Code, or non-qualified stock options. Through December 31, 2006 the Board of Directors had reserved 7,000,000 shares of common stock to be issued under the 2006 Plan. The 2006 Plan provides for an automatic annual increase in the number of shares available for issuance on January 1st of each year for the life of the plan starting 2007, equal to the least of (i) 1,800,000 shares, (ii) 4% of the shares outstanding as of the end of the prior fiscal year, or (iii) a lesser number determined by the Board of Directors or Compensation Committee.
Prior to June 6, 2006, the Company issued options under the 2001 Stock Option Plan (the “2001 Plan”). The 2001 Plan was terminated on June 6, 2006 with respect to new grants. Available shares created by cancellations will be transferred automatically to the 2006 Plan.
Incentive and nonqualified stock options typically vest over a four-year period, 25% for the first year and monthly thereafter over the remaining three years. Stock options may be exercised during continued employment, or within 60 days of terminating employment and they expire seven years from the date of grant for the 2006 Plan and ten years from the date of grant for the 2001 Plan. During 2011, the Company accelerated a portion of the unvested stock options related to the pending Merger with CoStar (see Note 12) resulting in additional stock-based compensation expense of $1.5 million.
A summary of the Company’s stock option activity was as follows:
| Options Outstanding | Options Exercisable | |||||||||||||||
| Number of Shares |
Weighted Average Exercise Price |
Number of Shares |
Weighted Average Exercise Price |
|||||||||||||
| Outstanding at December 31, 2008 |
4,637,240 | $ | 10.10 | 2,175,935 | $ | 7.96 | ||||||||||
| Granted |
2,391,697 | $ | 7.37 | |||||||||||||
| Exercised |
(232,802 | ) | $ | 1.32 | ||||||||||||
| Cancelled |
(343,510 | ) | $ | 13.15 | ||||||||||||
|
|
|
|||||||||||||||
| Outstanding at December 31, 2009 |
6,452,625 | $ | 9.24 | 3,331,025 | $ | 9.11 | ||||||||||
| Granted |
2,987,000 | $ | 10.37 | |||||||||||||
| Exercised |
(285,670 | ) | $ | 3.86 | ||||||||||||
| Cancelled |
(200,287 | ) | $ | 11.17 | ||||||||||||
|
|
|
|||||||||||||||
| Outstanding at December 31, 2010 |
8,953,668 | $ | 9.75 | 4,548,818 | $ | 9.73 | ||||||||||
| Granted |
868,000 | $ | 11.93 | |||||||||||||
| Exercised |
(4,483,275 | ) | $ | 8.75 | ||||||||||||
| Cancelled |
(201,235 | ) | $ | 14.13 | ||||||||||||
|
|
|
|||||||||||||||
| Outstanding at December 31, 2011 |
5,137,158 | $ | 10.81 | 1,868,539 | $ | 11.87 | ||||||||||
|
|
|
|||||||||||||||
Included in the options outstanding at December 31, 2011 are 1,415,000 shares of performance-based options awarded to its executive officers by the Board of Directors. These options are tied to incentivizing
72
Table of Contents
LOOPNET, INC.
NOTES TO CONSOLIDATED FINANCIAL STATEMENTS — (Continued)
execution of the Company’s long-term strategic plan. The Company is unable to assess the likelihood of achieving the strategic plan at this time and therefore the recognition of the compensation expense for these options has been deferred.
Additional information regarding stock options outstanding and exercisable as of December 31, 2011 is as follows:
| Options Outstanding | Options Exercisable | |||||||||||||||||||||||
| Exercise Prices |
Number Options Outstanding |
Weighted Average Remaining Contractual Life (Years) |
Weighted Average Exercise Price |
Number Exercisable |
Weighted Average Exercise Price |
Weighted Average Remaining Contractual Life (Years) |
||||||||||||||||||
| $0.10 |
87,146 | 2.2 | $ | 0.10 | 87,146 | $ | 0.10 | |||||||||||||||||
| $0.23 — $4.08 |
115,628 | 3.7 | 2.61 | 115,628 | 2.61 | |||||||||||||||||||
| $5.70 — $7.96 |
674,666 | 4.1 | 7.20 | 208,574 | 7.21 | |||||||||||||||||||
| $8.00 — $9.97 |
1,603,269 | 5.1 | 9.85 | 200,595 | 9.33 | |||||||||||||||||||
| $10.00 — $11.96 |
1,706,502 | 5.4 | 11.27 | 399,759 | 11.14 | |||||||||||||||||||
| $12.00 — $12.87 |
103,969 | 2.4 | 12.13 | 79,793 | 12.12 | |||||||||||||||||||
| $13.18 — $15.61 |
361,666 | 2.9 | 14.03 | 304,232 | 14.00 | |||||||||||||||||||
| $16.07 — $16.94 |
220,612 | 2.2 | 16.13 | 220,612 | 16.13 | |||||||||||||||||||
| $17.06 — $19.68 |
123,700 | 2.7 | 18.85 | 112,200 | 18.88 | |||||||||||||||||||
| $20.80 — $24.40 |
140,000 | 2.6 | 22.37 | 140,000 | 22.37 | |||||||||||||||||||
|
|
|
|
|
|
|
|
|
|
|
|
|
|||||||||||||
| $0.10 — $24.40 |
5,137,158 | 4.5 | $ | 10.81 | 1,868,539 | $ | 11.87 | 3.4 | ||||||||||||||||
|
|
|
|
|
|
|
|
|
|
|
|
|
|||||||||||||
In connection with the FASB authoritative guidance of stock-based compensation (see Note 1), the Company reviewed and updated, among other things, its forfeiture rate, expected life and volatility assumptions. Commencing January 1, 2011, the Company began estimating the weighted average expected life of the options based upon the historical exercise behavior of our employees. Prior to January 1, 2011, the Company used the simplified method to calculate the weighted average expected life of the options. There was no significant impact as a result of this change. Estimated volatility also reflects the application of the authoritative guidance and, accordingly, incorporates historical volatility of similar entities whose share prices are publicly available. The risk-free interest rate is based on the U.S. Treasury yield curve in effect at the time of grant.
The fair value of each stock option was estimated on the date of grant using the Black-Scholes method with the following assumptions:
| Year Ended December 31, | ||||||||||||
| 2009 | 2010 | 2011 | ||||||||||
| Risk-free interest rate |
2.19 | % | 1.93 | % | 1.99 | % | ||||||
| Expected volatility |
49 | % | 48 | % | 49 | % | ||||||
| Expected life |
4.6 years | 4.6 years | 3.7 years | |||||||||
| Dividend yield |
0 | % | 0 | % | 0 | % | ||||||
The weighted-average fair value of options granted in the years ended December 31, 2009, 2010 and 2011 was $3.05, $4.37, and $4.71, respectively, using the Black-Scholes option-pricing model. The total intrinsic value (market value on date of exercise less exercise price) of options exercised during 2009, 2010 and 2011 totaled $1.5 million, $2.2 million and $41.5 million, respectively. The aggregate intrinsic values of stock options outstanding and exercisable at December 31, 2011 were $39.0 million and $12.6 million, respectively.
For the year ended December 31, 2011, the Company’s stock-based compensation expense related to stock option grants was $7.6 million. As of December 31, 2011, there was $5.9 million of unrecognized compensation
73
Table of Contents
LOOPNET, INC.
NOTES TO CONSOLIDATED FINANCIAL STATEMENTS — (Continued)
expense related to unvested stock options, net of estimated forfeitures. That compensation expense is expected to be recognized over a weighted-average period of 1.2 years.
Cash received from stock options exercised for 2009, 2010 and 2011 was $0.3 million, $1.1 million and $14.7 million, respectively. Tax benefits realized from tax deductions associated with options exercises for 2009, 2010 and 2011 totaled $0.4 million, $0.5 million, and $8.5 million, respectively.
Under the 2006 Plan, the Company also issued restricted stock units. A restricted stock unit award is an agreement to issue specified numbers of shares of the Company’s common stock at specified vesting dates. Restricted stock units are measured based on the fair market values of the underlying stock on the dates of grant. Restricted stock units vest in equal 25% increments over a four-year period on the anniversary of the grant date. During 2011, the Company accelerated a portion of the restricted stock unit grants related to the pending Merger (see Note 12) resulting in additional stock-based compensation expense of $4.1 million.
A summary of the Company’s restricted stock unit activity is as follows:
| Unvested Restricted Stock Units | ||||||||||||
| Number of Shares |
Weighted Average Grant Date Fair Value |
Weighted Average Remaining Contractual Life (Years) |
||||||||||
| Outstanding at December 31, 2008 |
195,000 | $ | 11.47 | 1.7 | ||||||||
| Granted |
245,000 | $ | 7.19 | |||||||||
| Vested |
(48,750 | ) | $ | 11.47 | ||||||||
| Cancelled |
— | $ | — | |||||||||
|
|
|
|||||||||||
| Outstanding at December 31, 2009 |
391,250 | $ | 8.79 | 1.5 | ||||||||
| Granted |
1,122,500 | $ | 10.29 | |||||||||
| Vested |
(110,000 | ) | $ | 9.09 | ||||||||
| Cancelled |
— | $ | — | |||||||||
|
|
|
|||||||||||
| Outstanding at December 31, 2010 |
1,403,750 | $ | 9.98 | 3.7 | ||||||||
| Granted |
230,000 | $ | 11.71 | |||||||||
| Vested |
(562,625 | ) | $ | 10.03 | ||||||||
| Cancelled |
— | $ | — | |||||||||
|
|
|
|||||||||||
| Outstanding at December 31, 2011 |
1,071,125 | $ | 10.31 | 3.3 | ||||||||
|
|
|
|||||||||||
Included in the restricted stock units outstanding at December 31, 2011 are 573,000 shares of performance-based restricted stock units awarded to its executive officers by the Board of Directors. These restricted stock units are tied to incentivizing execution of the Company’s long-term strategic plan. The Company is unable to assess the likelihood of achieving the strategic plan at this time and therefore the recognition of the compensation expense for these options has been deferred.
For the year ended December 31, 2011, the Company’s stock-based compensation expense related to restricted stock units was $6.6 million. As of December 31, 2011, there was $2.8 million of unrecognized compensation expense related to unvested restricted stock units, net of forecasted forfeitures. That compensation expense is expected to be recognized over a weighted-average period of 1.6 years.
Total stock-based compensation has been allocated as follows (in thousands):
| Year Ended December 31, | ||||||||||||
| 2009 | 2010 | 2011 | ||||||||||
| Cost of revenue |
$ | 495 | $ | 546 | $ | 502 | ||||||
| Sales and marketing |
894 | 1,786 | 4,569 | |||||||||
| Technology and product development |
2,298 | 2,680 | 4,490 | |||||||||
| General and administrative |
3,140 | 3,220 | 4,641 | |||||||||
|
|
|
|
|
|
|
|||||||
| Total |
$ | 6,827 | $ | 8,232 | $ | 14,202 | ||||||
|
|
|
|
|
|
|
|||||||
74
Table of Contents
LOOPNET, INC.
NOTES TO CONSOLIDATED FINANCIAL STATEMENTS — (Continued)
| (10) | 401(k) Plan |
Employees may participate in the Company’s 401(k) Plan. Participating employees may contribute a portion of their salary to the Plan up to the maximum allowed by the federal tax guidelines. The Company matches employee contributions up to 4% of the employee’s salary. Employee and Company contributions are fully vested when contributed. The Company contributed $0.6 million, $0.7 million and $0.7 million for the years ended December 31, 2009, 2010 and 2011, respectively.
| (11) | Commitments and Contingencies |
Leases
The Company leases office space in California. The offices are currently leased under noncancelable operating lease agreements which expire at various dates through 2018. Future minimum payments under these noncancelable operating leases as of December 31, 2011, are as follows (in thousands):
| 2012 |
$ | 2,949 | ||
| 2013 |
2,995 | |||
| 2014 |
3,080 | |||
| 2015 |
1,815 | |||
| 2016 and thereafter |
2,233 | |||
|
|
|
|||
| $ | 13,072 | |||
|
|
|
Rent expense under operating leases for the years ended December 31, 2009, 2010 and 2011 totaled approximately $2.9 million, $2.9 million and $3.0 million, respectively. As of December 31, 2011, the Company had approximately $1.0 million of deferred rent included in current accrued liabilities.
Litigation
In April 2008, LoopNet and CityFeet (collectively the “Defendants”) were sued by Real Estate Alliance, Ltd. (“REAL”) in the U.S. District Court for the Central District of California for alleged infringement of certain patents (“the REAL v. LoopNet Action”). The complaint seeks unspecified damages, attorney fees and costs. The Defendants deny the alleged infringement and have filed a counter-claim for a declaratory judgment that the patents-in-suit are invalid and not infringed. To date, discovery in the REAL v. LoopNet Action has been limited and the court has not yet set a trial date. Moreover, because the patents-in-suit have been asserted against several other entities, in another pending lawsuit in the same court, (“the earlier filed action”), the REAL v. LoopNet Action was stayed in February 2009, and administratively closed in February 2010. It is possible that REAL may attempt to re-institute the REAL v. LoopNet Action, depending upon the outcome of the earlier filed action, which is currently pending before the U.S. District Court for the Central District of California. At this time, the Company cannot predict the outcome of either the earlier filed action or the REAL v. LoopNet Action, but if the REAL v. LoopNet Action is re-instituted, the Company intends to vigorously defend itself.
The Company and its board of directors and CoStar have been named as defendants in three putative class action lawsuits brought by alleged stockholders challenging our proposed merger with CoStar. Two of the actions, Raymond E. Williams Jr. v. LoopNet, Inc., et al. and Ronald T. West v. Richard Boyle, et al., were filed on or around May 3, 2011 and Ronald T. West v. Richard Boyle, et al. was amended on May 20, 2011. The third action, Karin Cahill v. LoopNet, Inc., et al., was filed on June 3, 2011. All three actions were filed in the Superior Court of California, County of San Francisco. The complaints generally allege, among other things, that each member of the board breached his fiduciary duties to the Company’s stockholders by authorizing the sale of the Company to CoStar for consideration that does not maximize value to the shareholders and engineering the transaction to benefit themselves without regard to the Company’s shareholders. The complaints also generally allege that the Company (and, in the case of the Ronald T. West action, CoStar) aided and abetted the breaches of fiduciary duty allegedly committed by the members of the board and made incomplete or materially misleading
75
Table of Contents
LOOPNET, INC.
NOTES TO CONSOLIDATED FINANCIAL STATEMENTS — (Continued)
disclosures about the proposed transaction. The shareholder actions seek equitable relief, including an injunction against consummating the merger.
On June 21, 2011, counsel for the parties in the lawsuits entered into a memorandum of understanding in which they agreed on the terms of a settlement of all litigation, which would include the dismissal with prejudice of all claims against all of the defendants. The proposed settlement is conditional upon, among other things, the execution of an appropriate stipulation of settlement, consummation of the merger and final approval of the proposed settlement by the court. In addition, in connection with the settlement and as provided in the memorandum of understanding, the parties contemplate that plaintiff’s counsel will seek an award of attorneys’ fees and expenses as part of the settlement. There can be no assurance that the merger will be consummated, that the parties ultimately will enter into a stipulation of settlement or that the court will approve the settlement even if the parties enter into such stipulation. In such event, the proposed settlement as contemplated by the memorandum of understanding may be terminated. The settlement will not affect the amount of the merger consideration that the Company’s stockholders are entitled to receive in the merger.
On January 3, 2012, LoopNet was sued by CIVIX-DDI, LLC (“Civix”) in the U.S. District Court for the Eastern District of Virginia for alleged infringement of U.S. Patent Nos. 6,385,622 and 6,415,291. The complaint seeks unspecified damages, attorney fees and costs. On February 16, 2012, LoopNet filed an answer to Civix’s compliant and filed counterclaims against Civix seeking declaratory relief. No discovery has yet occurred, nor has a trial date been set. At this time, LoopNet cannot predict the outcome of this case, but intends to vigorously defend itself.
LoopNet has recently become aware that an entity called Earthcomber, LLC filed a lawsuit against LoopNet on January 18, 2012, in the U.S. District Court for the Northern District of Illinois for alleged infringement of U.S. Patent No. 7,589,628. The complaint seeks unspecified damages, attorneys fees and costs. LoopNet has not yet been served with a copy of the summons and complaint for this lawsuit. At this time, LoopNet cannot predict the outcome of this case, but intends to vigorously defend itself.
Currently and from time to time, we are involved in disputes and litigation incidental to the conduct of our business. While we cannot assure you as to the ultimate outcome of any legal proceedings, we are not currently party to any legal proceedings that management believes would have a material adverse effect on our financial position or results of operations.
| (12) | Pending Merger with CoStar |
Merger Agreement with CoStar Group, Inc.
On April 27, 2011, the Company entered into a Merger Agreement with CoStar and Merger Subsidiary, pursuant to which Merger Subsidiary will be merged with and into the Company, with the Company surviving as a wholly-owned subsidiary of CoStar.
Subject to the terms and conditions of the Merger Agreement, at the effective time of the Merger, each outstanding share of the Company’s common stock will be converted into the right to receive a unit consisting of (i) $16.50 in cash, without interest, and (ii) 0.03702 shares of CoStar common stock (the “Common Stock Consideration”). As previously disclosed, the holders of the Company’s Series A Preferred Stock have delivered contingent conversion notices to the Company pursuant to which such shares will be converted into common stock immediately prior to, and contingent upon, the completion of the Merger.
Subject to the terms and conditions of the Merger Agreement, at the effective time of the Merger, each of the Company’s outstanding equity awards (including stock options and restricted stock units), whether vested or unvested, will be cancelled in exchange for cash and/or shares of CoStar common stock (depending on the type of award and the exercise price of the award, if any) based on the Common Stock Consideration less, in the case of a stock option, the per share exercise price.
The Company’s board of directors has unanimously approved the Merger Agreement. On July 11, 2011, at a special meeting of the Company’s stockholders, the Merger was approved by the holders of a majority of the
76
Table of Contents
LOOPNET, INC.
NOTES TO CONSOLIDATED FINANCIAL STATEMENTS — (Continued)
outstanding shares of the Company’s common stock and Series A Preferred Stock, voting together as a single class on an as-converted basis.
Completion of the Merger remains subject to the expiration or termination of the waiting period imposed by the HSR Act, and satisfaction or waiver of the other closing conditions specified in the Merger Agreement. As previously disclosed in the proxy statement/prospectus dated June 6, 2011, both CoStar and the Company filed notification and report forms with the Department of Justice and the FTC pursuant to the HSR Act, on May 31, 2011. As previously announced, on June 30, 2011, CoStar and the Company each received a request for additional information (commonly referred to as a “second request”) from the FTC with respect to the proposed Merger. As previously announced, on October 26, 2011, at the request of the FTC, the Company and CoStar agreed to extend the waiting period imposed by the HSR Act from 30 to 60 days after the date of substantial compliance with the second request, which was certified by the Company and CoStar on November 4, 2011. As previously announced on January 3, 2012, the Company and CoStar agreed to further extend the waiting period imposed by the HSR Act on a 45-day rolling basis to allow them to engage in discussions with the FTC to determine whether there is a possible basis for, and to discuss the possible terms of, a mutually acceptable consent order that would allow the Merger to close. If either the Company and CoStar, on the one hand, or the FTC Staff, on the other hand, believes that discussions towards a possible consent order are no longer moving forward productively, either may trigger commencement of the 45-day period, in writing, after the expiration of which the waiting period imposed by the HSR Act will expire, unless extended voluntarily by the parties or terminated sooner by the FTC. In addition, as previously announced on January 31, 2012, the Company and CoStar agreed to extend the date after which either the Company or Costar may individually elect to terminate the Merger Agreement to 11:59 PM, New York City time on April 30, 2012. As of the date hereof, the parties have not yet reached agreement on the terms of such a consent order, and there can be no assurance that such agreement will be reached in a timely manner or at all. The Company remains committed to working with the FTC as it conducts its review of the Merger.
The Merger Agreement contains customary representations, warranties and covenants by each of the Company and CoStar.
The Merger Agreement contains termination rights for both the Company and CoStar, including for the Company if its board of directors changes its recommendation of the Merger to its stockholders in connection with a superior proposal. Upon termination of the Merger Agreement under certain circumstances, the Company may be obligated to pay CoStar a termination fee of $25,800,000. Upon termination of the Merger Agreement in the event necessary antitrust approval is not obtained, CoStar may be obligated to pay the Company a termination fee of $51,600,000.
Concurrently with the execution of the Merger Agreement, the Company’s directors and certain of its executive officers and significant stockholders entered into a voting and support agreement (the “Support Agreement”) with CoStar and the Company, and agreed, in their capacities as stockholders of the Company, to, among other things, vote their shares of the Company’s capital stock in favor of the Merger and the Merger Agreement.
The foregoing description of the Merger, the Merger Agreement and the Support Agreement is qualified in its entirety by reference to the Merger Agreement and the Support Agreement, copies of which are attached as Exhibit 2.1 and Exhibit 2.2, respectively, to the Company’s Current Report on Form 8-K filed with the Securities and Exchange Commission (the “SEC”) on April 28, 2011 and which are incorporated by reference herein.
The Company cannot guarantee that the Merger will be completed or that, if completed, it will be exactly on the terms as set forth in the Merger Agreement. As of December 31, 2011, total merger related costs were $11.7 million.
77
Table of Contents
EXHIBIT INDEX
| 3.1 | First Amended and Restated Certificate of Incorporation (incorporated herein by reference to Exhibit 3.1 to the registrant’s Form 10-Q filed on August 4, 2006, File No. 000-52026) | |
| 3.2 | Certificate of Designations of Series A Convertible Preferred Stock of the Company, filed with the Secretary of the State of the State of Delaware on March 30, 2009 (incorporated herein by reference to Exhibit 3.1 to the Company’s Current Report on Form 8-K filed with the SEC on April 2, 2009, File No. 000-52026) | |
| 3.3 | Amended and Restated Bylaws of LoopNet, Inc., effective February 2, 2011 (incorporated herein by reference to Exhibit 3.1 to the registrant’s Form 8-K filed on February 4, 2011, File No. 000-52026) | |
| 4.1 | Specimen Common Stock Certificate (incorporated herein by reference to Exhibit 4.1 to the registrant’s Form S-1/A filed on April 27, 2006, Registration No. 333-132138) | |
| 4.2 | Amended and Restated Investor Rights Agreement by and among LoopNet, Inc. and certain holders of preferred stock, dated as of November 30, 2001 (incorporated herein by reference to Exhibit 4.2 to the registrant’s Form S-1 filed on March 1, 2006, Registration No. 333-132138) | |
| 4.3 | Investors’ Rights Agreement, dated as of April 14, 2009, by and among the Company and certain investors (incorporated herein by reference to Exhibit B to the Schedule 13D filed with the SEC on April 24, 2009 by Calera Capital Partners IV, L.P., Calera Capital Partners IV Side-By-Side, L.P., Calera Capital Investors IV, L.P., and Calera Capital Management IV, Inc., File No. 005-82495) | |
| 10.1+ | LoopNet, Inc. 2001 Stock Option and Purchase Plan (incorporated herein by reference to Exhibit 10.1 to the registrant’s Form S-1 filed on March 16, 2006, Registration No. 333-132138) | |
| 10.2+ | Form of Option Agreement under 2001 Stock Option and Purchase Plan (incorporated herein by reference to Exhibit 10.2 to the registrant’s Form S-1 filed on March 1, 2006, Registration No. 333-132138) | |
| 10.3+ | LoopNet, Inc. 2006 Equity Incentive Plan (incorporated herein by reference to Exhibit 10.3 to the registrant’s Form S-1/A filed on June 6, 2006, Registration No. 333-132138) | |
| 10.4+ | Form of Option Agreement under 2006 Equity Incentive Plan (incorporated herein by reference to Exhibit 10.4 to the registrant’s Form S-1/A filed on April 27, 2006, Registration No. 333-132138) | |
| 10.5+ | Form of Restricted Stock Unit Agreement under 2006 Equity Incentive Plan (incorporated herein by reference to Exhibit 10.11 to the registrant’s Form 8-K filed on February 5, 2008, File No. 000-52026) | |
| 10.6+ | Form of Performance-Based Option Agreement under 2006 Equity Incentive Plan (incorporated herein by reference to Exhibit 10.6 to the registrant’s Form 10-K filed on March 1, 2010, File No. 000-52026) | |
| 10.7+ | Form of Performance-Based Restricted Stock Unit Agreement under 2006 Equity Incentive Plan (incorporated herein by reference to Exhibit 10.7 to the registrant’s Form 10-K filed on March 1, 2010, File No. 000-52026) | |
| 10.8+ | Form of Indemnification Agreement (incorporated herein by reference to Exhibit 10.8 to the registrant’s Form 10-K filed on March 1, 2010, File No. 000-52026) | |
| 10.9 | Office Lease, dated January 8, 2003, between PWREF/MCC-China Basin L.L.C. and LoopNet, Inc. (incorporated herein by reference to Exhibit 10.7 to the registrant’s Form S-1/A filed on April 3, 2006, Registration No. 333-132138) | |
| 10.10 | Seventh Amendment to Office Lease, dated January 8, 2003 between PWREF/MCC-China Basin L.L.C. and LoopNet, Inc. (incorporated herein by reference to Exhibit 10.12 to the registrant’s Form 10-Q filed on May 9, 2008, File No. 000-52026) | |
| 10.11 | Office Lease, dated November 30, 2010 between America’s Christian Credit Union and LoopNet, Inc. (incorporated herein by reference to Exhibit 10.11 to the registrant’s Form 10-K filed on March 3, 2011, File No. 000-52026) | |
| 10.12+ | Director Compensation Policy (incorporated herein by reference to Exhibit 10.11 to the registrant’s Form S-1/A filed on April 27, 2006, Registration No. 333-132138) |
78
Table of Contents
| 10.13+* | Form of Amendment to Option Agreement under the 2001 Stock Option and Purchase Plan and 2006 Equity Incentive Plan | |
| 10.14+ | Form of Change of Control Severance Agreement (incorporated herein by reference to Exhibit 10.1 to the registrant’s Form 8-K filed on December 24, 2008, File No. 000-52026) | |
| 10.15+ | Amendment No. 1 to the Change of Control Severance Agreement (incorporated herein by reference to Exhibit 10.1 to the registrant’s Form 8-K filed on February 4, 2011, File No. 000-52026) | |
| 10.16+ | Securities Purchase Agreement, dated as of March 29, 2009, by and among the Company and certain purchasers (incorporated herein by reference to Exhibit A to the Schedule 13D filed with the SEC on April 24, 2009 by Calera Capital Partners IV, L.P., Calera Capital Partners IV Side-By-Side, L.P., Calera Capital Investors IV, L.P., and Calera Capital Management IV, Inc., File No. 005-82495) | |
| 23.1* | Consent of Ernst & Young LLP, independent registered public accounting firm | |
| 24.1* | Power of Attorney | |
| 31.1* | Rule 13a-14(a) Certification (CEO) | |
| 31.2* | Rule 13a-14(a) Certification (CFO) | |
| 32.1* | Section 1350 Certification (CEO) | |
| 32.2* | Section 1350 Certification (CFO) | |
| 101.INS** | XBRL Instance Document | |
| 101.SCH** | XBRL Taxonomy Extension Schema Document | |
| 101.CAL** | XBRL Taxonomy Extension Calculation Linkbase Document | |
| 101.DEF** | XBRL Taxonomy Extension Definition Linkbase Document | |
| 101.LAB** | XBRL Taxonomy Extension Label Linkbase Document | |
| 101.PRE** | XBRL Taxonomy Extension Presentation Linkbase Document |
| * | Filed herewith. |
| + | Management contract or compensatory plan. |
| ** | XBRL (Extensible Business Reporting Language) information is furnished and not filed herewith, is not a part of a registration statement or Prospectus for purposes of sections 11 or 12 of the Securities Act of 1933, is deemed not filed for purposes of section 18 of the Securities Exchange Act of 1934, and otherwise is not subject to liability under these sections. |
79