Attached files
| file | filename |
|---|---|
| 8-K - FORM 8-K - NABORS INDUSTRIES LTD | d305436d8k.htm |
| EX-99.1 - PRESS RELEASE - NABORS INDUSTRIES LTD | d305436dex991.htm |
 February 22, 2012
Presenter:
Anthony G. Petrello
Deputy Chairman, President & Chief Executive Officer
4Q 2011 Earnings Presentation
Exhibit 99.2 |
 Slide #2
Forward-Looking Statements
We often discuss expectations regarding our markets, demand for our products and services, and our
future performance in our annual and quarterly reports, press releases, and other written and
oral statements. Such statements, including statements in this document incorporated by
reference that relate to matters that are not historical facts are “forward-looking
statements” within the meaning of the safe harbor provisions of Section 27A of the
Securities Act of 1933 and Section 21E of the Securities Exchange Act of 1934. These
“forward-looking statements” are based on our analysis of currently available
competitive, financial and economic data and our operating plans. They are inherently uncertain
and investors must recognize that events and actual results could turn out to be significantly
different from our expectations.
You should consider the following key factors when evaluating these forward-looking statements:
•
fluctuations in worldwide prices and demand for natural gas and oil;
•
fluctuations in levels of natural gas and crude oil exploration and development
activities;
•
fluctuations in the demand for our services;
•
the existence of competitors, technological changes and developments in the oilfield
services industry;
•
the existence of operating risks inherent in the oilfield services industry;
•
the existence of regulatory and legislative uncertainties;
•
the possibility of changes in tax laws;
•
the possibility of political instability, war or acts of terrorism in any of the
countries in which we do business; and
•
general economic conditions including the capital and credit markets. Our businesses
depend, to a large degree, on the level of spending by oil and gas companies for exploration,
development and production activities. Therefore, a sustained increase or decrease in the price of
natural gas or oil, which could have a material impact on exploration and production
activities, could also materially affect our financial position, results of operations and cash
flows. The
above description of risks and uncertainties is by no means all inclusive, but is designed to highlight what we
believe are important factors to consider.
|
 Refining Our Business
>
Enhance balance sheet flexibility
>
Review each Business Unit for:
–
Strategic fit
–
Execution effectiveness
–
Capital efficiency
>
Realign with Customers
–
Drilling & Rig Services
–
Completion & Production Services
Slide #3 |
 Re-Establish Balance Sheet Flexibility
Increased Focus on Balance Sheet Management and Net Debt Reduction
Slide #4
Balance Sheet Data as of December 31, 2011
($ Millions)
Cash & Securities
540
Accounts Receivable
1,577
Working Capital
1,286
Property, Plant and Equipment, Net
8,630
Total Assets
12,912
Total Debt
4,624
Shareholders’
Equity
5,588
Net Debt to Total Capitalization
42%
Net Debt to TTM EBITDA @ 12/31/2011
2.21x
Diluted Average Shares Outstanding
292,484
Fitch, Moody’s and S&P
BBB+, Baa2, BBB |
 Re-Establish Balance Sheet Flexibility
Slide #5
Liquidity
>
Current liquidity approximately $1.0 billion
>
Expect
2012
OCF
to
fund
all
capital
expenditures,
redeem
current
debt and provide significant free cash flow
Total debt
>
Weighted average coupon is 5.8%
>
Interest coverage ratio approximately 8 to 1
Term debt
>
92%
has
maturity
of
2018
or
later
>
No
financial
covenants
Revolving debt
>
Lines
total
$1.4
billion
>
Rate
equals
Libor
plus
150
bps
(currently
1.75%)
>
Net
debt/cap
covenant
less
than
60%
Nonetheless flexibility less than historical levels |
 Business Line & Asset Class Evaluation
Criteria
>
Leadership position
>
Attractive investment returns
>
Capable of growth or otherwise strategic
Slide #6 |
 Our
Business Lines: An Overview Operating Segments by Line of Business
Drilling and Rig Services
–
US Lower 48
–
GOM Offshore
–
Canada
–
Ryan
–
Alaska
–
Peak
–
International
–
Canrig
Completion and Production Services
–
US Workover and Well Servicing
–
US Fluids Management and Logistics
–
Canada Workover and Well Servicing
–
US and Canada Pressure Pumping
Other –
Oil and Gas
Slide #7 |
 Assets
Strategically Positioned in Major US Unconventional Plays
Slide #8
Shale Plays & Basin
Working
Drilling Rigs
Frac
Crews
CTU
Well Svc
Rigs
Fluid Svc
Trucks
Frac
Tanks
Marcellus
14
4
3
27
155
720
Haynesville
32
1
-
9
43
186
Bakken/Rockies
76
11
3
84
26
323
Eagle Ford
43
4
4
33
126
588
Permian
26
3
-
92
274
1017
Barnett
3
1
-
30
95
185
Granite Wash
11
1
-
46
125
608
Other
42
-
2
227
77
100
Total
247
25
12
548
921
3727
Note: Includes 2012 scheduled new equipment deployments
|
 Nabors
Global AC Rig Fleet New build rigs for US lower 48 land are only part of the
Nabors story Slide #9
12/31/11
To Be
Delivered
Total
Alaska Drilling
3
0
3
US Lower 48 Land Drilling
119
25
144
Canada Drilling
24
(1)
2
26
International Drilling
34
2
36
US Offshore Drilling
4
2
6
Total NBR
184
31
215
(1)
Includes 10 AC Hybrid Coiled Tubing rigs |
 Our
Business Lines: An Overview Accelerating Operating Cash Flow
4Q Consolidated Run Rate exceeds Prior High and Increasing
Slide #10
GAAP
FY 2008
FY 2011
4Q11 Annualized
US Lower 48
$839
$703
$826
US Well Servicing
214
153
180
US Offshore
102
38
53
Alaska
74
63
49
Canada
128
171
214
International
580
397
382
Pressure Pumping
0
331
410
Oil & Gas
3
60
14
Other
95
90
97
Sub total
$2,035
$2,006
$2,225
Corporate & Eliminations
163
155
175
Total
$1,872
$1,851
$2,050 |
 Slide #11
Margins and Activities
(1)
Margin = gross margin per rig per day for the period. Gross margin is
computed by subtracting direct costs from operating revenues for the
period. 4Q11
3Q11
4Q10
Margin
(1)
Rig Yrs
Margin
(1)
Rig Yrs
Margin
(1)
Rig Yrs
US Lower 48
$10,922
216.7
$10,176
201.8
$9,472
184.3
US Offshore
17,250
10.0
15,318
10.8
9,542
6.5
Alaska
29,489
5.0
26,111
4.7
43,745
6.0
Canada
12,061
45.2
10,320
41.8
9,233
39.3
International
11,065
113.2
11,992
105.3
16,392
102.1
Well Servicing
Rev/Hr
Rig Hrs
Rev/Hr
Rig Hrs
Rev/Hr
Rig Hrs
US Lower 48
$511
202,816
$497
205,610
$457
169,318
Canada
$808
52,712
$787
49,788
$719
49,740 |
 Slide #12
Quarterly Adjusted Income (Loss)
Derived from Operating Activities
($000’s)
4Q11
3Q11
4Q10
US Lower 48
$130,114
$104,877
$85,308
Nabors Well Services
24,237
22,839
12,132
US Offshore
3,422
2,457
(5,142)
Alaska
5,343
3,021
11,252
Canada
36,553
21,604
16,572
International
23,450
29,015
71,814
Pressure Pumping
76,470
65,052
54,664 |
 Drilling Rigs & Services
Slide #13 |
 U.S.
Lower 48 Land Drilling Term Contracts in Force at 12/31/11
Slide #14
(1)
Represents the quarter end number of contracts in force with no incremental
contract awards in the future. Quarter end number of rigs
subject to term contracts
(1)
4Q11
1Q12
2Q12
3Q12
4Q12
3Q 2011
144
124
104
86
69
4Q 2011
186
158
131
101
75
2011 Contract Signatures
1Q11
2Q11
3Q11
4Q11
Replaced
Incremental
13
45
5
19
-
13
18
23
Total Signed
13
58
23
42 |
 Slide #15
Lower 48 Summary by Basin
Basin
Oil/Gas
Working Rigs
Approx.
Market Share
Marcellus
Gas
13
6%
Haynesville
Gas
26
13%
Bakken/Rockies
Oil/Gas
71
20%
Eagle Ford
Oil
41
15%
Permian
Oil
28
8%
Barnett
Gas
3
Granite Wash
Oil/Gas
18
5%
Other
Oil/Gas
21
N/A
Total
221 |
 Drilling Rigs & Services
US
Lower
48
Land
Drilling
-
Premium
Fleet
Makeup
Slide #16
NDUSA Rig Fleet
# of Rigs
Util.
AC
Rigs
@
12/31/11
119
100%
SCR Upgraded
65
85%
SCR
44
50%
Mechanical
41
68%
Current Total
269
83%
AC Rigs still to be deployed
25
100%
Total
294
84%
Expected % AC and AC Equivalent
71% |
 Slide #17
Canada Summary by Basin
Basin
Oil/Gas
Working
Rigs
Term Contracts
Approx.
Market Share
Horn River
Gas
6
4.0
24.0%
Montney
Oil/Gas
8
0.0
19.0%
Duvernay
Oil
13
2.0
11.0%
Oil Sands
Oil
7
2.0
6.0%
Cardium
Oil
11
0.0
13.0%
Saskatchewan
Oil
2
0.0
2.0%
Total
47 |
 Completion & Production
Services
Slide #18 |
 Pressure Pumping Assets by Basin
Slide #19
4Q 2011
1Q 2012
EOY 2012
Pressure
Pumping
Coil
Tubing
Cementing
Pressure
Pumping
Coil
Tubing
Cementing
Pressure
Pumping
Coil
Tubing
Cementing
Marcellus
3
-
30
4
2
30
4
3
31
Haynesville
1
-
3
1
-
3
1
-
3
Bakken/Rockies
9
-
6
10
2
6
11
3
10
Eagle Ford
4
3
3
4
3
3
4
4
8
Permian
3
-
1
3
-
1
3
-
4
Barnett
1
-
-
1
-
-
1
-
-
Granite Wash
1
-
5
1
-
5
1
-
6
Other Lower 48
-
2
16
-
2
16
-
2
16
Canada
-
-
-
-
-
-
2
-
-
Total
22
5
64
24
9
64
27
12
78 |
 Slide #20
Pressure Pumping Summary by Basin
Basin
Oil/Gas
# of Crews
LTSA
Spot
Approx.
Market
Position
Marcellus
Gas
4.0
2.0
2.0
T-4
th
Haynesville
Gas
1.0
0.0
1.0
T-4
th
Bakken/Rockies
Oil/Gas
11.0
8.0
3.0
2
nd
Eagle Ford
Oil/Gas
4.0
2.0
2.0
T-6
th
Permian
Oil
3.0
1.0
2.0
T-6
th
Barnett
Gas
1.0
1.0
0.0
T-5
th
Granite Wash
Oil
1.0
0.0
1.0
T-11
th
Total
25.0
14.0
11.0 |
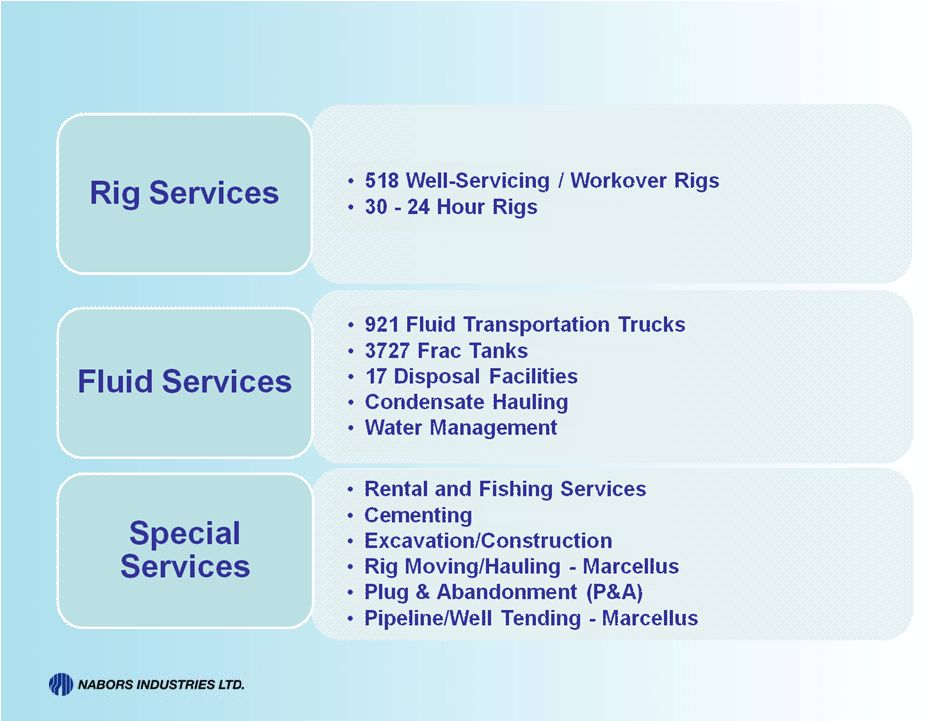 Well
Servicing Product Lines Slide #21 |
 Summary by Basin
Slide #22
Basin
Well Svc Rigs
Fluid Svc Trucks
Frac Tanks
Bakken / Rockies
84
26
323
Granite Wash / Mississippian
46
125
608
Permian Basin
92
274
1017
Marcellus / Utica
27
155
720
Eagle Ford
33
126
588
Barnett / Haynesville
39
138
371
San Joachim / Long Beach
227
77
100
Total
548
921
3727 |
 Canrig: A Technology Success Story
>
Innovation
–
200th
ROCKIT
TM
system
installed
in
2011
–
REVIT
TM
Stick-Slip
system
commercialized
in
2011
–
over
45
installations
to
date
–
Over 35% of services and rentals revenue in 2011 came from new products,
technologies and services introduced the past three years
–
Successfully
prototyped
with
a
Major
in
2011,
remote
integration
within
automatic driller
–
Received Innovation Award at 2011 OTC for Casing Running Tool
>
Investment
–
Acquired
GE
distributorship
agreement
for
AC
drive
systems
–
exclusive
in
North
America
–
Acquired license for world-class Managed Pressure Drilling technology
>
Patent Portfolio
–
Filed
or
acquired
over
100
patents
(including
foreign
patents
of
same
IP)
–
Beginning to develop patent families, while still investing in new patents
–
Successful monetization of IP portfolio
Slide #23 |