Attached files
| file | filename |
|---|---|
| 8-K - FORM 8-K - SOUTHERN Co GAS | form_8-k.htm |
| EX-99.1 - EXHIBIT 99.1 - SOUTHERN Co GAS | exhibit99_1.htm |

4Q and Year-End 2011 Earnings Presentation
February 22, 2012
®
®

2
Forward-Looking Statements &
Supplemental Information
Supplemental Information
Forward-Looking Statements
Certain expectations and projections regarding our future performance referenced in this presentation, in other reports or statements we file with the SEC or otherwise release to the public, and
on our website, are forward-looking statements. Senior officers and other employees may also make verbal statements to analysts, investors, regulators, the media and others that are forward-
looking. Forward-looking statements involve matters that are not historical facts, such as statements regarding our future operations, prospects, strategies, financial condition, economic
performance (including growth and earnings), industry conditions and demand for our products and services. Because these statements involve anticipated events or conditions, forward-looking
statements often include words such as "anticipate," "assume," "believe," "can," "could," "estimate," "expect," "forecast," "future," "goal," "indicate," "intend," "may," "outlook," "plan," "potential,"
"predict," "project," "seek," "should," "target," "would," or similar expressions. Forward-looking statements contained in this presentation include, without limitation, statements regarding future
earnings per share, dividend growth and EBIT contribution and our priorities for 2012. Our expectations are not guarantees and are based on currently available competitive, financial and
economic data along with our operating plans. While we believe our expectations are reasonable in view of the currently available information, our expectations are subject to future events,
risks and uncertainties, and there are several factors - many beyond our control - that could cause results to differ significantly from our expectations.
Such events, risks and uncertainties include, but are not limited to, changes in price, supply and demand for natural gas and related products; the impact of changes in state and federal
legislation and regulation including changes related to climate change; actions taken by government agencies on rates and other matters; concentration of credit risk; utility and energy industry
consolidation; the impact on cost and timeliness of construction projects by government and other approvals, development project delays, adequacy of supply of diversified vendors, unexpected
change in project costs, including the cost of funds to finance these projects; the impact of acquisitions and divestitures including the Nicor merger; limits on natural gas pipeline capacity; direct
or indirect effects on our business, financial condition or liquidity resulting from a change in our credit ratings or the credit ratings of our counterparties or competitors; interest rate fluctuations;
financial market conditions, including disruptions in the capital markets and lending environment and the current economic uncertainty; general economic conditions; uncertainties about
environmental issues and the related impact of such issues; the impact of changes in weather, including climate change, on the temperature-sensitive portions of our business; the impact of
natural disasters such as hurricanes on the supply and price of natural gas; the outcome of litigation; acts of war or terrorism; and other factors which are provided in detail in our filings with the
Securities and Exchange Commission. Forward-looking statements are only as of the date they are made, and we do not undertake to update these statements to reflect subsequent changes.
Supplemental Information
Company management evaluates segment financial performance based on earnings before interest and taxes (EBIT), which includes the effects of corporate expense allocations and on
operating margin. EBIT is a non-GAAP (accounting principles generally accepted in the United States of America) financial measure that includes operating income, other income and
expenses. Items that are not included in EBIT are financing costs, including debt and interest expense and income taxes. The company evaluates each of these items on a consolidated level
and believes EBIT is a useful measurement of our performance because it provides information that can be used to evaluate the effectiveness of our businesses from an operational
perspective, exclusive of the costs to finance those activities and exclusive of income taxes, neither of which is directly relevant to the efficiency of those operations. Operating margin is a non-
GAAP measure calculated as operating revenues minus cost of goods sold and revenue taxes, excluding operation and maintenance expense, depreciation and amortization, and taxes other
than income taxes. These items are included in the company's calculation of operating income. The company believes operating margin is a better indicator than operating revenues of the
contribution resulting from customer growth, since cost of goods sold and revenue taxes are generally passed directly through to customers. In addition, in this presentation, the company has
presented a non-GAAP measure of both its net income and its earnings per share each adjusted to exclude expenses incurred with respect to the Nicor merger. As the company does not
routinely engage in transactions of the magnitude of the Nicor merger, and consequently does not regularly incur transaction related expenses with correlative size, the company believes
presenting net income and EPS excluding Nicor merger expenses provides investors with an additional measure of the company’s core operating performance. EBIT, operating margin, net
income excluding merger expenses (also referred to as adjusted net income) and EPS excluding merger expenses (also referred to as adjusted EPS) should not be considered as alternatives
to, or more meaningful indicators of, the company's operating performance than operating income, net income attributable to AGL Resources Inc. or EPS as determined in accordance with
GAAP. In addition, the company's EBIT, operating margin, adjusted net income and adjusted EPS may not be comparable to similarly titled measures of another company. Reconciliations of
non-GAAP financial measures referenced in this presentation are available on the company’s Web site at www.aglresources.com
®

2011 Highlights
• 2011 GAAP EPS of $2.12 per
diluted share
diluted share
• Adjusted diluted EPS of $2.92,
excluding approximately $64 million
in after-tax costs related to Nicor
merger
excluding approximately $64 million
in after-tax costs related to Nicor
merger
• Distribution segment EBIT up 17%
2011 vs. 2010
2011 vs. 2010
• Retail segment EBIT down $10
million vs. 2010
million vs. 2010
• Wholesale, storage and shipping
segments remain challenged due to
market fundamentals
segments remain challenged due to
market fundamentals
• Nicor merger completed
December 9, 2011
December 9, 2011
• Proposed PBR stipulation agreed to
with ICC Staff and filed 2/16/11,
pending approval
with ICC Staff and filed 2/16/11,
pending approval
• 2012 EPS estimate $2.80-$2.95
per diluted share, excluding
Nicor merger-related costs
per diluted share, excluding
Nicor merger-related costs
3
(1) Change represents y/y change of 2011 Combined vs. 2010 Legacy AGLR.
(2) Adjusted net income and adjusted EPS exclude Nicor-related merger costs of approximately $64 million, net of tax.
®

4Q11 Highlights
4
Note: Please review the AGL Resources 10-K as filed with the SEC on 2/22/12 for detailed information. EBIT, Adjusted
Net Income and Adjusted EPS are non-GAAP measures. Please see the appendix to this presentation or visit the investor
relations section of www.aglresources.com for a reconciliation to GAAP.
Net Income and Adjusted EPS are non-GAAP measures. Please see the appendix to this presentation or visit the investor
relations section of www.aglresources.com for a reconciliation to GAAP.
(1) Change represents y/y change of 2011 Combined vs. 2010 Legacy AGLR.
(2) Adjusted net income and adjusted EPS exclude Nicor-related merger costs of approximately $45 million, net of tax.
®
Numbers may not foot due to rounding.

2011 Results vs. 2011 Original Guidance
5
®
(1) Higher interest expense reflects pre-funding of the Nicor merger through various debt issuances throughout
the year and fees associated with the bridge facility.
the year and fees associated with the bridge facility.

6
Consistent EPS and Dividend Growth
Diluted EPS Track Record
Dividend Growth
2012 EPS Guidance:
$2.80-$2.95 per diluted share
Dividend increase of $0.04 approved by
Board of Directors for 2012
Board of Directors for 2012
(1)For 2010, $3.00 diluted GAAP EPS; $3.05 adjusted, excluding Nicor merger costs. For 2011, $2.12 diluted GAAP EPS; $2.92 adjusted, excluding Nicor merger costs.
Please see the appendix to this presentation or visit the investor relations section of www.aglresources.com for a reconciliation to GAAP.
Please see the appendix to this presentation or visit the investor relations section of www.aglresources.com for a reconciliation to GAAP.
(2) Estimate excludes Nicor merger-related costs.
$2.80-
®

7
7
EBIT by Operating Segment
1%
79%
18%
Annual EBIT by Operating Segment
2011 EBIT Contribution by Operating Segment
NOTE: EBIT is a non-GAAP measure. Please see the appendix to this presentation or the investor relations section of www.aglresources.com for a reconciliation to GAAP.
Quarterly EBIT by Operating Segment
®
2%

• 2011 EBIT increased 17% vs. 2010
• Key drivers
• New rates and regulatory infrastructure
programs at Atlanta Gas Light and
Elizabethtown Gas added $39 million of
operating margin
programs at Atlanta Gas Light and
Elizabethtown Gas added $39 million of
operating margin
• Inclusion of Nicor for 22 days in December
resulted in additional EBIT of $15 million
(excluding change in control payments)
resulted in additional EBIT of $15 million
(excluding change in control payments)
• Effective O&M expense management;
excluding 22 days of contribution from Nicor,
costs essentially flat y/y, due primarily to lower
annual incentive compensation expense
excluding 22 days of contribution from Nicor,
costs essentially flat y/y, due primarily to lower
annual incentive compensation expense
• 4Q EBIT up 35% with similar drivers
as full year
as full year
• Customer count stable
• 2.266 million customers in 2011 (avg.) vs.
2.264 million in 2010 (avg.) for legacy AGLR
utilities
2.264 million in 2010 (avg.) for legacy AGLR
utilities
• 2.188 million Nicor Gas customers at 12/31/11
• Virginia Natural Gas rate case
concluded in December of 2011 with
no material impact to earnings
concluded in December of 2011 with
no material impact to earnings
8
8
Distribution
NOTE: COG = Cost of Goods Sold
4Q11 Financial Performance Summary
®
2011 Financial Performance Summary

9
9
Retail
• 2011 EBIT down $10 MM vs. 2010
• Weather in Georgia that was 23% warmer than
2010 resulted in lower usage and a $15 million
decline in operating margin
2010 resulted in lower usage and a $15 million
decline in operating margin
• LOCOM adjustment higher by $5 million vs. 2010
• Operating expenses lower by $5 million year-over-
year due primarily to lower legal and bad debt
expenses
year due primarily to lower legal and bad debt
expenses
• 4Q11 EBIT down $8 MM vs. 4Q10 with
similar drivers as full year
similar drivers as full year
• Market share and customer count
• Georgia market share remains 33% at end of 2011
(equivalent to 2010 and 2009)
(equivalent to 2010 and 2009)
• Georgia customer count (avg.): 485K at 12/31/11
vs. 496K at 12/31/10
vs. 496K at 12/31/10
• Continue to explore opportunities to
expand service offerings and customer
base across multiple states
expand service offerings and customer
base across multiple states
• Added Nicor National and Nicor Energy
Services to our retail segment
Services to our retail segment
4Q11 Financial Performance Summary
®

10
10
Wholesale
• 2011 EBIT down $44 million vs. 2010 due to
lower commercial activity
lower commercial activity
• Commercial activity lower by $45 million y/y
• $18 million related to Marcellus take-away
constraints
constraints
• $4 million related to customer bankruptcy
• Remainder due to ongoing low volatility and tight
storage and transportation spreads
storage and transportation spreads
• $21 million higher MTM gains/losses on hedges y/y
• $24 million higher LOCOM, net of current period
recoveries, y/y
recoveries, y/y
• 4Q11 EBIT up $3 MM vs. 4Q10 with similar
drivers as full year
drivers as full year
• Wholesale Operating Margin Components
4Q11 Financial Performance Summary
®
2011 Financial Performance Summary

11
11
Midstream
• 2011 EBIT up $3 million vs. 2010 due mainly
to full year of GTS Cavern 1 operation
to full year of GTS Cavern 1 operation
• 4Q11 EBIT up $1 million vs. 4Q10 due to
higher operating margin
higher operating margin
• Golden Triangle Storage (GTS)
• Cavern 1 in service (6 Bcf)
- Cavern 1 is 100% contracted, inclusive of 2 Bcf
Sequent contract; Average subscription rate of $0.14
Sequent contract; Average subscription rate of $0.14
• Cavern 2 under construction (7 Bcf); Completion
expected mid-year 2012, 0% contracted
expected mid-year 2012, 0% contracted
• Storage values remain depressed due to high supply
of natural gas and reduced demand
of natural gas and reduced demand
• Jefferson Island Storage and Hub (JISH)
• As of 12/31/11 JISH is 97% contracted with average
subscription rate of $0.19, inclusive of 2 Bcf Sequent
contract; 3 Bcf rolling off at the end of March 2012,
including 2 Bcf Sequent contract
subscription rate of $0.19, inclusive of 2 Bcf Sequent
contract; 3 Bcf rolling off at the end of March 2012,
including 2 Bcf Sequent contract
• Expansion permit application remains under review by
Louisiana Department of Natural Resources
Louisiana Department of Natural Resources
• Central Valley Gas Storage
• 11 Bcf under construction with expected completion
mid-year 2012, 3 Bcf under contract
mid-year 2012, 3 Bcf under contract
4Q11 Financial Performance Summary
®
2011 Financial Performance Summary
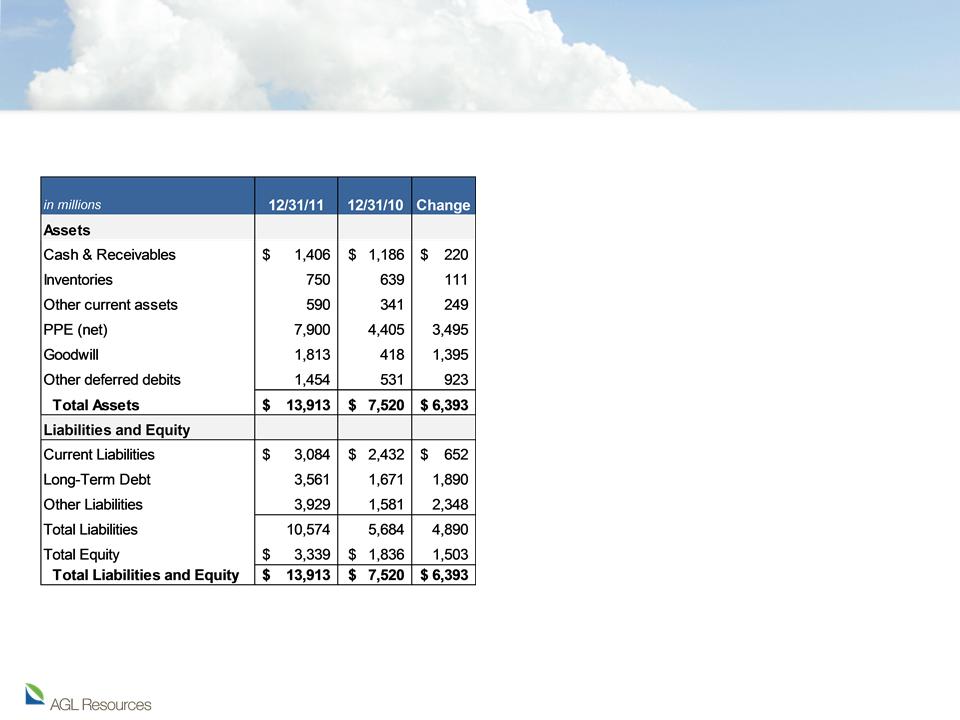
Balance Sheet Highlights
12
• Solid balance sheet with significant
opportunity to fund capital requirements
opportunity to fund capital requirements
• Good access to capital markets
• Company credit metrics support solid, investment-
grade ratings
grade ratings
• $4.9 billion debt outstanding
• Long-term debt $3.6 billion
• Short-term debt of $1.3 billion
• Debt to Cap Ratio: 58%
• 2012 cap ex estimated at $825 million
• Approximately $725 million of utility cap ex expected
in 2012 vs. $604 million in 2011 for legacy AGLR
utilities + Nicor Gas
in 2012 vs. $604 million in 2011 for legacy AGLR
utilities + Nicor Gas
• $300 million of 2012 utility cap ex is rider-based
• Approximately $100 million of non-utility cap ex
expected in 2012
expected in 2012
®

AGL Resources Debt Maturities
13
®

2012 Guidance
14
®
• AGL Resources expects diluted EPS to be in the range of $2.80 - $2.95 for
2012, excluding mark-to-market impacts and impacts from Nicor merger-
related costs
2012, excluding mark-to-market impacts and impacts from Nicor merger-
related costs
• Key assumptions include:
• Achievement of anticipated efficiencies related to corporate overhead and non-
utility businesses post-Nicor acquisition
utility businesses post-Nicor acquisition
• Normal weather
• Continued low volatility in natural gas prices
• Successful implementation of regulatory infrastructure and rate programs
• Higher pension expense due to lower discount rates
• Average diluted shares outstanding of 117.5 million
• Effective tax rate of 37.9%

15
15
PBR Settlement with ICC Staff
• On February 16, 2011 Nicor Gas filed a stipulated resolution along with Illinois
Commerce Commission (ICC) Staff that includes crediting $64 million to
customers relating to the long-running Performance Based Rate (PBR) case
pending before the ICC
Commerce Commission (ICC) Staff that includes crediting $64 million to
customers relating to the long-running Performance Based Rate (PBR) case
pending before the ICC
• Nicor Gas had already reserved $27 million for this issue
• Additional $37 million recorded in “other income/expense” in the Nicor Gas 2011 10-K
• Based upon proposed stipulation, no impact to AGLR earnings expected going forward
• Stipulation requires approval by ICC
• Illinois Attorney General’s Office and Citizens Utility Board are not parties to the
current stipulation
current stipulation
• Stipulation will be considered simultaneously with all issues in the case
• Evidentiary hearings expected to begin the week of 2/27/12
• Briefing expected to be complete by 4/26/12
• ICC ruling anticipated later this year
®

16
2012 Priorities
• Make necessary capital investment to enhance and maintain the safety and
reliability of our distribution systems, while minimizing regulatory lag
reliability of our distribution systems, while minimizing regulatory lag
• Remain a low-cost leader within the industry
• Maintain market share in Georgia and Illinois while expanding further into new
territories such as Ohio and Florida
territories such as Ohio and Florida
• Leverage experience across SouthStar and Nicor’s retail businesses
• Renew affiliated and non-affiliated asset management agreements and add new asset
management, gas-fired power generation and producer services contracts
management, gas-fired power generation and producer services contracts
• Continually enhance risk management, credit management and overall controls
Distribution
Retail
Wholesale
Midstream
Cargo Shipping
Expense &
Balance Sheet
Discipline
Balance Sheet
Discipline
• Complete construction of Golden Triangle Cavern 2 and Central Valley Gas
Storage and execute contracts for newly available capacity
Storage and execute contracts for newly available capacity
• Reduce project development costs in response to low volatility environment
• Effectively control expenses and focus on capital discipline in each of our
business segments
business segments
• Maintain strong balance sheet and liquidity profile
• Expand market share in key service areas while providing quality total
transportation and logistics solutions for our customers
transportation and logistics solutions for our customers
• Prudently deploy capital investment and diligently manage operating costs
®

Additional Resources
17
Company resources
• www.aglresources.com
• Sarah Stashak
Director, Investor Relations
404-584-4577
sstashak@aglresources.com
Industry resources
• www.aga.org
• www.eia.doe.gov
®

Appendix & GAAP Reconciliations
®

19
The following table sets forth a reconciliation of AGL Resources’ operating margin to operating income and earnings before interest and taxes (EBIT) to
earnings before income taxes, net income to net income attributable to AGL - as reported and net income attributable to AGL - as adjusted, and net income
attributable to AGL - as adjusted - to diluted EPS - as adjusted for the twelve months ended December 31, 2011 and 2010.
earnings before income taxes, net income to net income attributable to AGL - as reported and net income attributable to AGL - as adjusted, and net income
attributable to AGL - as adjusted - to diluted EPS - as adjusted for the twelve months ended December 31, 2011 and 2010.
GAAP Reconciliation
®

20
The following table sets forth a reconciliation of AGL Resources’ operating margin to operating income and earnings before interest and taxes (EBIT) to
earnings before income taxes, net income to net income attributable to AGL - as reported and net income attributable to AGL - as adjusted, and net income
attributable to AGL - as adjusted - to diluted EPS - as adjusted for the three months ended December 31, 2011 and 2010.
earnings before income taxes, net income to net income attributable to AGL - as reported and net income attributable to AGL - as adjusted, and net income
attributable to AGL - as adjusted - to diluted EPS - as adjusted for the three months ended December 31, 2011 and 2010.
GAAP Reconciliation
®

GAAP Reconciliation

22
GAAP Reconciliation
The following tables set forth a reconciliation of AGL Resources’ Statement of Income to earnings before interest and taxes (EBIT) by segment for the
twelve months ended December 31, 2011 and December 31, 2010.
twelve months ended December 31, 2011 and December 31, 2010.
®

Natural Gas Transportation Spreads
23
$5.05
$0.56
$3.34
$0.29

Natural Gas Storage Spreads
24
Intrinsic Spreads Year Ago to Expiry
Source: Nymex

25
GAAP Reconciliation
Reconciliations of operating margin, EBIT by segment, net income excluding merger expenses and EPS excluding merger expenses are available in our
quarterly reports (Form 10-Q) and annual reports (Form 10-K) filed with the Securities and Exchange Commission.
quarterly reports (Form 10-Q) and annual reports (Form 10-K) filed with the Securities and Exchange Commission.
Our management evaluates segment financial performance based on EBIT, which includes the effects of corporate expense allocations. EBIT is a non-
GAAP (accounting principles generally accepted in the United States of America) financial measure. Items that are not included in EBIT are financing
costs, including debt and interest expense and income taxes. We evaluate each of these items on a consolidated level and believe EBIT is a useful
measurement of our performance because it provides information that can be used to evaluate the effectiveness of our businesses from an operational
perspective, exclusive of the costs to finance those activities and exclusive of income taxes, neither of which is directly relevant to the efficiency of those
operations.
We also use EBIT internally to measure performance against budget and in reports for management and the Board of Directors. Projections of forward-
looking EBIT are used in our internal budgeting process, and those projections are used in providing forward-looking business segment EBIT projections
to investors. We are unable to reconcile our forward-looking EBIT business segment guidance to GAAP net income, because we do not predict the
future impact of unusual items and mark-to-market gains or losses on energy contracts. The impact of these items could be material to our operating
results reported in accordance with GAAP.
Operating margin is a non-GAAP measure calculated as revenues minus cost of goods sold and revenue taxes, excluding operation and maintenance
expense, depreciation and amortization, taxes other than income taxes, and the gain or loss on the sale of our assets. These items are included in our
calculation of operating income. We believe operating margin is a better indicator than operating revenues of the contribution resulting from customer
growth, since cost of goods sold and revenue taxes are generally passed directly through to customers.
We present our net income excluding merger expenses and our EPS excluding expenses incurred with respect to the proposed merger with Nicor. As
we do not routinely engage in transactions of the magnitude of the Nicor merger, and consequently do not regularly incur transaction related expenses of
correlative size, we believe presenting our EPS excluding Nicor merger expenses provides investors with an additional measure of our core operating
performance.
EBIT, operating margin, net income excluding merger expenses and EPS excluding merger expenses should not be considered as alternatives to, or
more meaningful indicators of, our operating performance than operating income or net income, as determined in accordance with GAAP. In addition,
our EBIT, operating margin, adjusted net income and adjusted EPS may not be comparable to similarly titled measures of another company.
more meaningful indicators of, our operating performance than operating income or net income, as determined in accordance with GAAP. In addition,
our EBIT, operating margin, adjusted net income and adjusted EPS may not be comparable to similarly titled measures of another company.
Net income attributable to AGL Resources, as adjusted and Basic and Diluted earnings per share, as adjusted are non-GAAP measures and exclude
transaction costs related to the proposed merger with Nicor. We believe these financial measures are useful to investors because they provide an
alternative method for assessing the Company’s operating results in a manner that is focused on the performance of the Company’s ongoing operations.
The presentation of these financial measures is not meant to be a substitute for financial measures prepared in accordance with GAAP.
®