Attached files
| file | filename |
|---|---|
| 8-K - VVC-VUHI 8K - VECTREN CORP | vvc_vuhi8k.htm |
| EX-99.2 - EXHIBIT 99.2 - VECTREN CORP | ex99_2.htm |
Exhbit 99.1

Presentation to the Financial
Community
Community
New York & Boston
February 21-22, 2012
Carl Chapman - Chairman, President and CEO
Jerry Benkert - Executive Vice President and CFO
Robert Goocher - Treasurer and VP - Investor Relations
Aaron Musgrave - Manager - Investor Relations

Forward-Looking Statements
All statements other than statements of historical fact are forward-looking statements made
in good faith by the company and are intended to qualify for the safe harbor from liability
established by the Private Securities Litigation Reform Act of 1995. Such statements are
based on management’s beliefs, as well as assumptions made by and information currently
available to management and include such words as “believe”, “anticipate”, ”endeavor”,
“estimate”, “expect”, “objective”, “projection”, “forecast”, “goal”, “likely”, and similar
expressions intended to identify forward-looking statements.
Vectren cautions readers that the assumptions forming the basis for forward-looking
statements include many factors that are beyond Vectren’s ability to control or estimate
precisely and actual results could differ materially from those contained in this document.
Forward-looking statements speak only as of the date on which our statement is made, and
we assume no duty to update them. More detailed information about these factors is set
forth in Vectren’s filings with the Securities and Exchange Commission, including Vectren’s
2011 annual report on Form 10-K filed on February 16, 2012.
Robert L. Goocher, Treasurer and VP - Investor Relations
rgoocher@vectren.com
812-491-4080
2
Ø NYSE Symbol: VVC
Ø 8-10% target annual total
shareholder return
shareholder return
• Annual dividends paid increased 52
consecutive years, effective Dec. 1,
2011, to annualized rate of $1.40 per
share
consecutive years, effective Dec. 1,
2011, to annualized rate of $1.40 per
share
Ø Over 1.1 million utility customers in
Indiana and Ohio
Indiana and Ohio
• Operate in constructive regulatory
environments with revenue
stabilization mechanisms
environments with revenue
stabilization mechanisms
Ø Well diversified nonutility portfolio
linked to core utility
linked to core utility
Ø ~$4.9 billion in assets
Ø ~$2.3 billion in revenues
Ø ~$2.4 billion market cap
Ø S&P: A-, Moody’s: A3
• Stable outlook for both
Vectren Corporation Overview
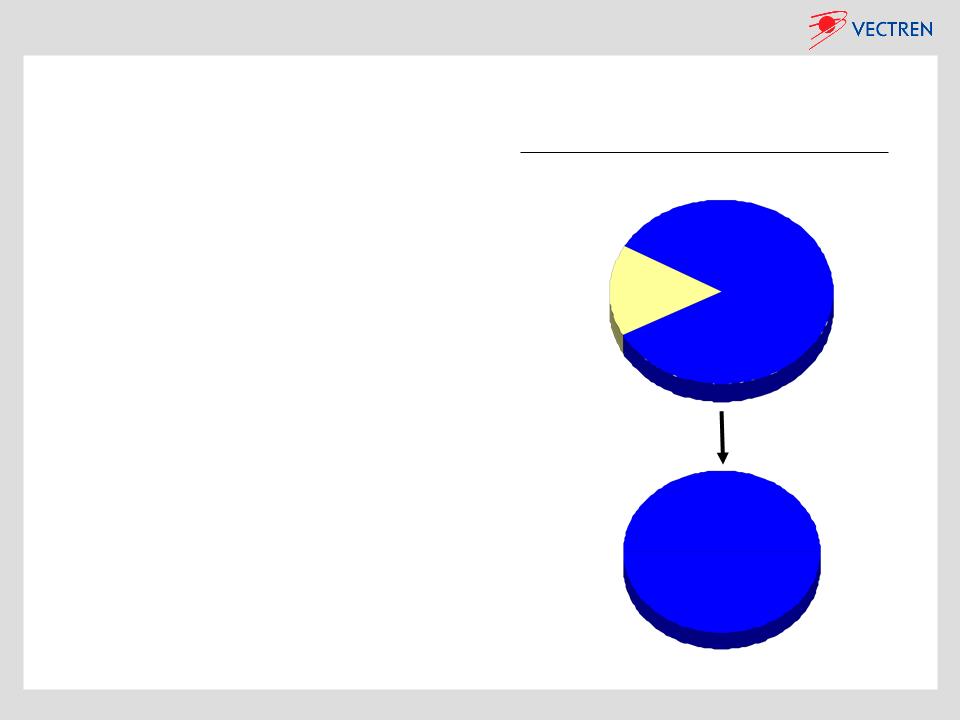
Vectren’s Core Earnings
3
Electric
~55%
Gas
~45%
Utility
~80-85%
Nonutility
~15-20%

4
Vectren at a Glance
Vectren
Nonutility
Infrastructure
Services
Services
Energy Services
Coal Mining
Energy
Marketing
Marketing
Distribution &
Transmission Pipeline
Construction
Energy Saving
Performance Contracting
& Renewable Projects
Mines and Sells
Coal to Vectren
and 3rd Parties
Wholesale
Gas Marketing
Business
Vectren
Utility
Vectren North
Indiana Gas
563,000 Customers
Vectren South
SIGECO - Electric
141,000 Customers
Vectren South
SIGECO - Gas
110,000 Customers
Vectren Ohio
VEDO
310,000 Customers
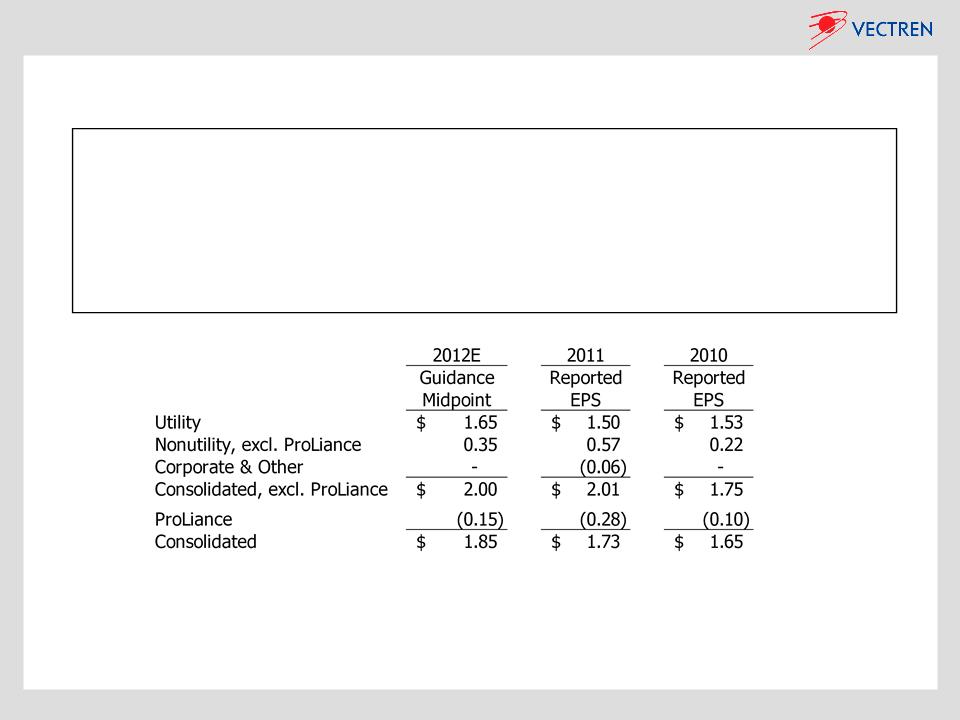
2012 EPS Guidance
Consolidated: $1.75 to $1.95 per share
Utility: $1.60 to $1.70 per share
Nonutility, excl. ProLiance: $0.30 to $0.40 per share
ProLiance: $(0.20) to $(0.10) per share
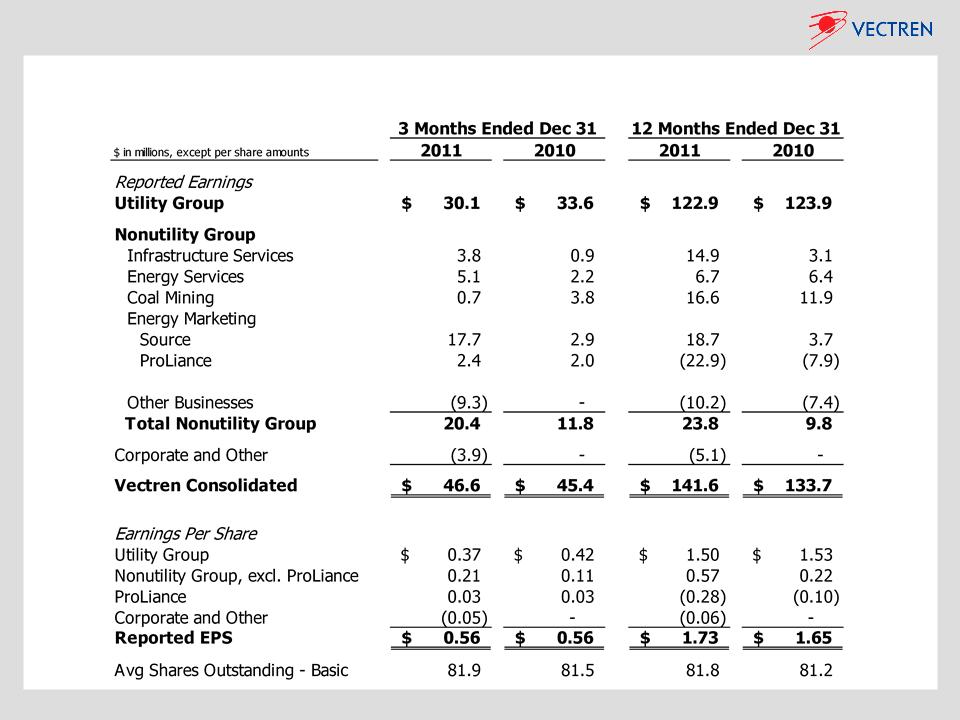
Notes on Reported EPS in 2010 & 2011
Ø 2010 EPS of $1.65 included offsetting items of favorable weather of $0.08 and charges related to legacy nonutility
investments of $(0.08)
investments of $(0.08)
Ø 2011 EPS of $1.73 included offsetting items of gain on the sale of Vectren Source of $0.15, net of tax; charges related to
legacy nonutility investments of $(0.11); & prefunding of Vectren’s Foundation for ~3 years of $(0.05)
legacy nonutility investments of $(0.11); & prefunding of Vectren’s Foundation for ~3 years of $(0.05)
5

6
Vectren Valuation Considerations
Ø Applying earnings-based multiples to the projected ProLiance loss does not accurately capture the long
-term value of Vectren
-term value of Vectren
Ø 2012 EPS Guidance Midpoint without ProLiance: $2.00 per share
• Utility results make up ~83% of 2012 guidance without ProLiance vs. ~75% of 2011 results
• Nonutility contribution less reliant on commodity-sensitive businesses
– Growth of Infrastructure Services; sale of retail gas marketer (Vectren Source)
Ø 2012 PE multiples: ~15 times for combination company peers, ~17 times for gas company peers
Ø Attractive total shareholder return targeted at 8-10% annually
• Includes attractive dividend with current yield of ~4.7%
Ø Utilities operate in constructive regulatory environments
Ø Well diversified nonutility portfolio linked to core utility offers upside earnings opportunities

7
Looking Ahead - Strategies for 2012 and Beyond
Utility
Ø Execute strategies to consistently achieve annual utility earnings growth target of 3%
• Earn allowed returns in gas and electric utilities
– Implement electric utility lost margin recovery mechanisms
– Earn current returns on infrastructure investments as provided for in 2011 IN & OH legislation
– Aggressively manage costs through performance management & strategic sourcing
• Disciplined allocation of capital to operate at cash flow neutral
– Reinvest earnings to support necessary rate base growth
– Reduce incremental external financing requirements
Nonutility
Ø Continued growth and profitability of existing portfolio of nonutility businesses
• Continue to invest in Infrastructure and Energy Services businesses to drive long-term earnings
growth
growth
• As demand dictates, open Oaktown 2 coal mine in 3rd quarter 2012 and ramp up to near full
production in 2013 (~2 million tons)
production in 2013 (~2 million tons)
• Continue the focus on improving ProLiance’s profitability prospects through further reductions in
fixed cost structure and customer growth
fixed cost structure and customer growth
8
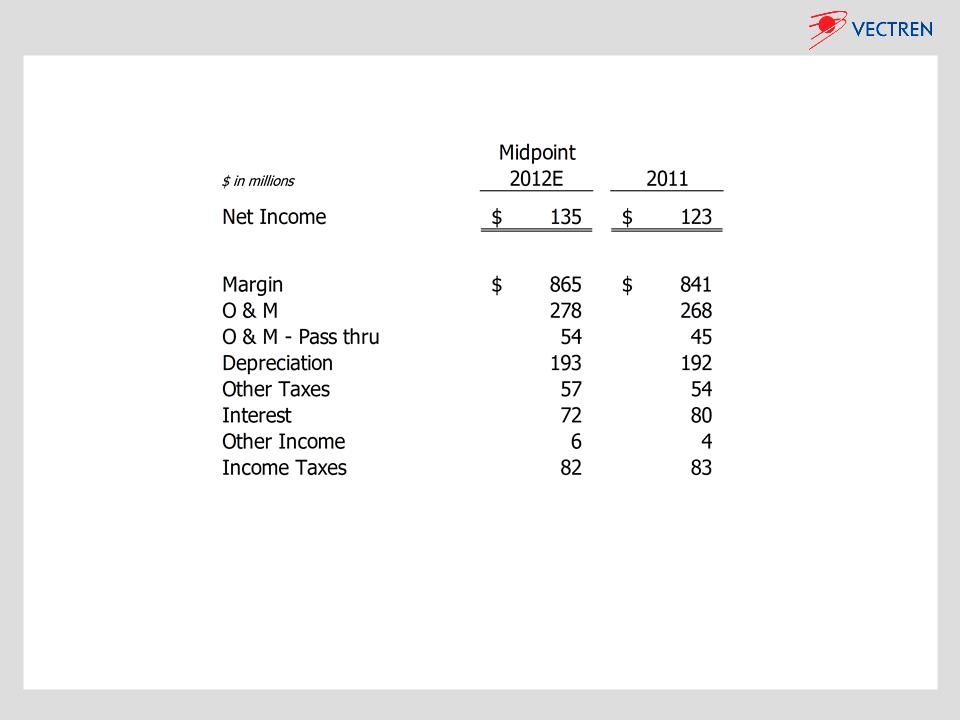
Utility Guidance & Outlook
Ø Utility Outlook
• 2012 earnings expected to increase compared to 2011 earnings
− Full year of new electric base rates implemented in May 2011 will increase 2012 earnings
− Interest expense savings in 2012 due to refinancing opportunities captured in 2011
− Expect consolidated utility group to earn at or near authorized returns in 2012
9
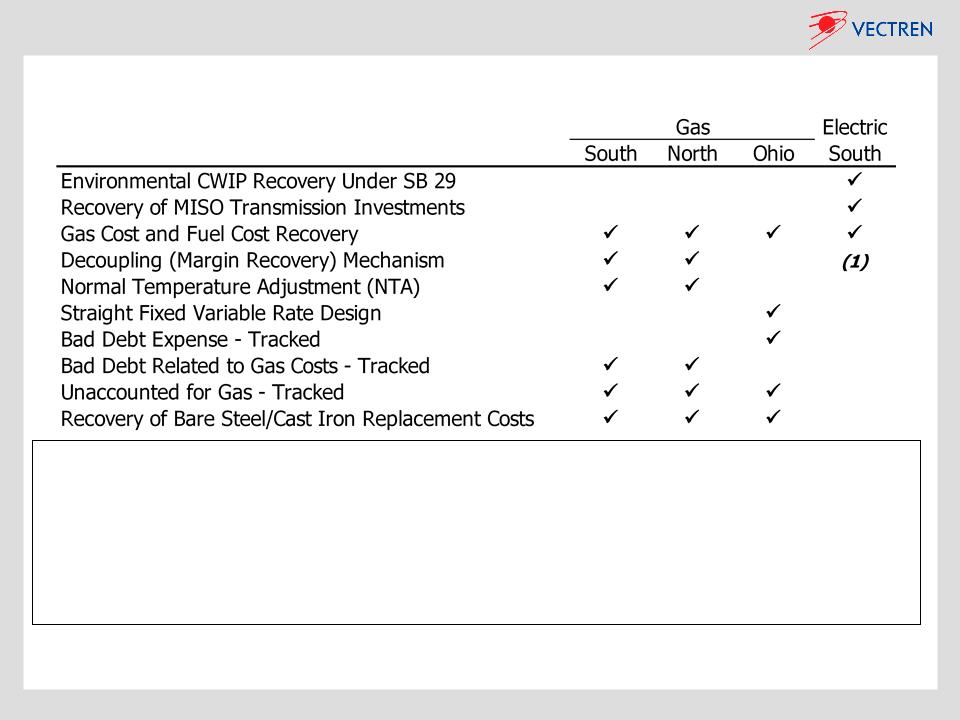
Constructive Utility Regulation & Legislation
(1) Settlement approved 9/1/2011, which provides for the ability to stabilize margins from the company's large commercial & industrial
customers associated with implementation of energy efficiency programs. The order also provides that margin reductions from residential
and commercial customers due to efficiency programs may be deferred for future recovery.
customers associated with implementation of energy efficiency programs. The order also provides that margin reductions from residential
and commercial customers due to efficiency programs may be deferred for future recovery.
Ø State legislation recently enacted in both Indiana and Ohio supporting additional investments
in infrastructure modernization programs that may be required as new federal safety or
environmental standards are enacted
in infrastructure modernization programs that may be required as new federal safety or
environmental standards are enacted
• Indiana Senate Bill 251, effective May 2011, allows for cost recovery outside a base rate
proceeding for federally mandated projects (applies to both gas and electric, capital and O&M)
proceeding for federally mandated projects (applies to both gas and electric, capital and O&M)
• Ohio House Bill 95, effective Sept. 2011, allows natural gas companies to recover costs related
to capital expenditure programs
to capital expenditure programs
10
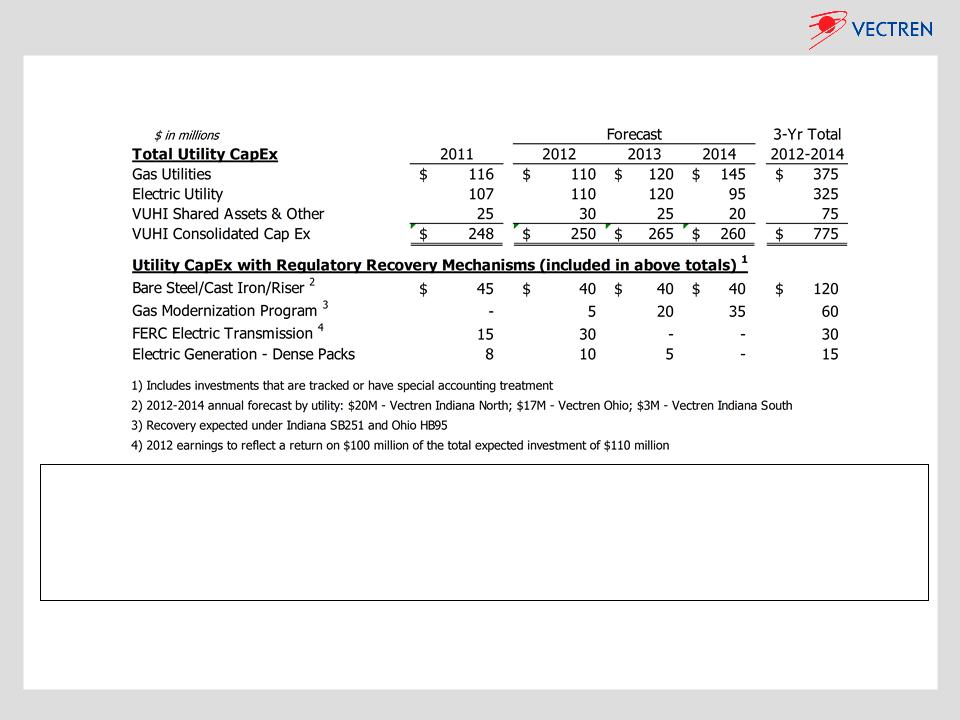
Utility CapEx and Cash Flow
Ø Targeting free cash flow neutral in 2012-2014, similar to 2011
• Depreciation & amortization expense of $190 to $205 million per year expected through 2014
Ø No need for incremental external debt or equity financings expected in near term
Ø Gas Utilities’ Rate Base: ~$1.2 billion*
• ~$0.9 billion Indiana
• ~$0.3 billion Ohio
• ~10.2% Total Gas Allowed ROE
* From last rate cases
Ø Electric Utility Rate Base: ~$1.3 billion*
• All Indiana; excludes FERC Transmission
• 10.4% Allowed ROE
Ø FERC Electric Transmission Rate Base: ~$0.1 billion
• 12.38% Allowed ROE

11
Nonutility Guidance
(1) Vectren has certain legacy nonutility businesses that have invested in leveraged leases, real estate, & other
investments. As of January 31, 2012, the total of these remaining legacy investments, net of deferred taxes, has
been reduced to ~$20 million.
investments. As of January 31, 2012, the total of these remaining legacy investments, net of deferred taxes, has
been reduced to ~$20 million.

12
Nonutility Outlook
Infrastructure Services - Miller Pipeline & Minnesota Limited
Ø Significant 2012 projected earnings contribution of ~$12.5 million
• Continuing strong demand for repair & replacement due to safety concerns with
aging natural gas & oil pipelines
aging natural gas & oil pipelines
• 1st quarter 2012 results expected to include typical seasonal loss due to weather
impacts for Minnesota Limited (acquired 3/31/2011)
impacts for Minnesota Limited (acquired 3/31/2011)
Ø Additional future opportunities driven by development of oil and natural gas in shale
formations
formations
Ø Business results driven by sustainable, long-term customer relationships built on high
quality construction & customer service
quality construction & customer service
Ø Infrastructure remains a focused growth area for Vectren; may include additional strategic
acquisitions
acquisitions

13
Nonutility Outlook
Energy Services - Energy Systems Group (ESG)
Ø 2012 projected earnings contribution of ~$6 million
• Performance contracting backlog has remained strong at $82 million at 12/31/11
• Benefits from renewable energy projects’ tax credits & energy efficiency projects’ tax
deductions
deductions
Ø Energy Services remains a long-term strategic growth area for Vectren
• Ramp up of performance contracting personnel that began in 2011 continues
through 2014
through 2014
– Returns from new hires expected 18-24 months after hire
• Progress in renewable energy markets continue - 1st of 3 anaerobic digesters online
in Feb. 2012
in Feb. 2012

14
Nonutility Outlook
Coal Mining - Vectren Fuels
Ø 2012 projected earnings contribution of ~$11 million
• Expecting an increase in coal production and sales to ~6 million tons in 2012 (from just
over 5 million tons in ‘11)
over 5 million tons in ‘11)
– Approx. 75% of 2012 expected production sold
– Includes expected sales to Vectren’s electric utility (SIGECO) of ~1.8 million tons
– Assumes 3rd quarter opening of Oaktown 2 mine (opening date dependent upon sales)
• Expecting 2012 margin of ~$5 per ton (w/o freight) compared to ~$7 per ton in 2011
– Forecasting cost (excluding freight) of $42 per ton compared to $44 per ton in 2011
– Full production expected at Oaktown 1 - conditional MSHA approval for deep cuts
on all units
on all units
– Increased productivity at Oaktown 1 and Prosperity expected as mining plan
reaches new phase
reaches new phase
Ø For 2013 and beyond, expect production of ~7.5 million tons (full production for all 3 mines -
dependent upon sales)
dependent upon sales)
• Approx. 40% of 2013 expected production sold, including expected sales to SIGECO of ~2.1
-2.5 million tons
-2.5 million tons

15
Nonutility Outlook
Energy Marketing - ProLiance
Ø 2012 results projected to reflect a net loss of ~$12.5 million; expecting improved results
over 2011 based upon:
over 2011 based upon:
• ~$55 million of firm transportation & storage demand costs at the ProLiance level
(~$73 million in 2011)
(~$73 million in 2011)
• Continued focus on G&A cost control and margin growth through adding commercial
and industrial customers
and industrial customers
• Hedge in place locking in ~75% of seasonal spread opportunity for the year at
improved spreads
improved spreads
Ø ProLiance is continuing to pursue the renegotiation of additional pipeline and storage
contracts
contracts
• Contracts representing $18 million of annualized fixed demand costs expire by 2015

16
Vectren: Strength, Stability, Utility
Utility
~80-85%
Nonutility
~15-20%
Utility: Vectren’s Core Earnings
Electric
~55%
Gas
~45%
Strength
Stability
Ø Earnings & industry reputation both
anchored by solid utility franchises
anchored by solid utility franchises
Ø ‘A’ Rated by Moody’s & S&P
Ø Strong utility & nonutility competencies
in infrastructure development are a
vital key to earnings growth
in infrastructure development are a
vital key to earnings growth
Ø Constructive regulatory environments
Ø Improving earnings stability through
mix of nonutility businesses
mix of nonutility businesses
Ø Disciplined spending for consistent
earnings growth and to support an
attractive dividend
earnings growth and to support an
attractive dividend
1.1 million customers,
Indiana and Ohio
Ø A management team that values the importance of financially strong, stable utility
operations in delivering competitive shareholder returns
operations in delivering competitive shareholder returns
17
Appendix
18
Consolidated 2011 Results
Appendix

19
Review of 2011 Highlights
Ø Utility Group
• Indiana Commission approved electric base rate case with $28.6 million annualized rate increase,
implemented May 3rd
implemented May 3rd
• Received approval to continue Indiana natural gas energy efficiency programs and decoupling
mechanisms and expand efficiency programs for electric customers with opportunity for lost margin
recovery
mechanisms and expand efficiency programs for electric customers with opportunity for lost margin
recovery
• Legislation passed in Indiana (SB251) & Ohio (HB95) supportive of infrastructure modernization
programs
programs
Ø Nonutility Group
• Acquired Minnesota Limited on 3/31/11, expanding and strengthening Infrastructure Services
segment
segment
– Immediately became a strong contributor to 2011 results, well above initial expectations
• Sold Vectren Source on 12/31/11 with proceeds of ~$84 million; gain of ~$12.4 million, net of tax
– Demonstrates Vectren’s strategic focus on reducing the reliance on earnings derived from commodity sensitive
businesses
businesses
– Source’s earnings contribution of ~$3 million per year to be partially offset by:
– Prefunding Vectren’s charitable Foundation for ~3 years, which reduces expenses by ~$2 million per year
– Interest savings from financing of Source working capital and other assets
• Ramped up production at new Oaktown 1 mine, producing 2.7 million tons (~3 million tons at full
capacity)
capacity)
– Continued development of Oaktown 2 mine; opening targeted for 3rd quarter (demand dependent)
Appendix

20
Review of 2011 Highlights - cont’d
Ø Other Highlights
• Raised annual dividends paid for 52nd consecutive year (current yield ~4.7%)
• Successfully priced two utility related long-term debt offerings totaling $250 million with weighted
average interest rates of about 5.00%
average interest rates of about 5.00%
– 2012 utility interest expense expected to be ~$8 million lower than 2011
Appendix

21
Vectren Energy Delivery of Indiana - North
Vectren Energy Delivery of Indiana - South
Vectren Energy Delivery of Ohio
Vectren’s Utility Group - Service Territories
OH
IN
Appendix

22
Generation Portfolio - Profile
Ø 5 Coal-fired base units - 1,000 MW
• 100% scrubbed for SO2
• 90% controlled for NOx
• Substantial removal of mercury and
particulate matter
particulate matter
Ø 6 Gas-fired peak-use turbines - 295 MW
Ø Purchased capacity - 100 MW thru 2012
Ø Renewable energy ~ 5%
• Landfill gas generation facility - 3MW
• Wind energy - up to 80 MW via ~20-
year purchased power contracts
year purchased power contracts
Utility Investments - Recent History & Near Future
Investments Made
Ø Over $410 million invested during last
decade in emissions control equipment
decade in emissions control equipment
Ÿ Was tracked via Indiana Senate Bill 29
(return on/of CWIP investment)
(return on/of CWIP investment)
Ø Well positioned to comply with new EPA
rules without significant additional
investment, & with no plant retirements
rules without significant additional
investment, & with no plant retirements
Ø Strongly meeting reserve requirements -
no new generation expected in near term
no new generation expected in near term
Ø Completion expected in 2012 on high
voltage transmission line; recovered timely
at 12.38% FERC-approved equity return
voltage transmission line; recovered timely
at 12.38% FERC-approved equity return
Ø Gas modernization legislation and/or
regulation will drive ramp-up in
infrastructure spending at Vectren’s
gas utilities for several years
regulation will drive ramp-up in
infrastructure spending at Vectren’s
gas utilities for several years
Ø Vectren’s gas utilities’ bare steel & cast
iron replacement program began in 2008
iron replacement program began in 2008
Ÿ ~$800 million program, ~20 years
Looking Ahead
Appendix

Infrastructure Services - Miller Pipeline & Minnesota Limited
Miller Pipeline
ØProvides underground pipeline construction and
repair services for natural gas, water and
wastewater companies
repair services for natural gas, water and
wastewater companies
ØOver 55 years in construction business
ØHeadquartered in Indianapolis, IN
ØMajor customers are regional utilities, such as
Vectren, NiSource, Duke, LG&E, Alagasco and
Citizens
Vectren, NiSource, Duke, LG&E, Alagasco and
Citizens
Minnesota Limited
ØProvides underground pipeline construction
and repair services for natural gas and
petroleum transmission companies
and repair services for natural gas and
petroleum transmission companies
ØOver 45 years in construction business
ØHeadquartered in Big Lake, MN
ØMajor customers include Northern Natural,
Consumers Energy, Enbridge Energy and
Minnesota Pipe Line
Consumers Energy, Enbridge Energy and
Minnesota Pipe Line
23
Appendix
Strategy: Drive business growth through sustainable, long-term customer relationships built
upon high quality construction and customer service, and strategic acquisitions
upon high quality construction and customer service, and strategic acquisitions
• 2011 net revenues of ~$370
million
million
• Approximately ~2,650
employees at peak in 2011
employees at peak in 2011
• Operates in ~25 states, primarily
in the Upper Midwest, Midwest,
Mid-Atlantic and Southern
regions
in the Upper Midwest, Midwest,
Mid-Atlantic and Southern
regions
Installation of gas service under a road using
horizontal directional drilling
horizontal directional drilling
Lowering of a section of 16-inch pipeline on a
35-mile project in Minnesota
35-mile project in Minnesota

24
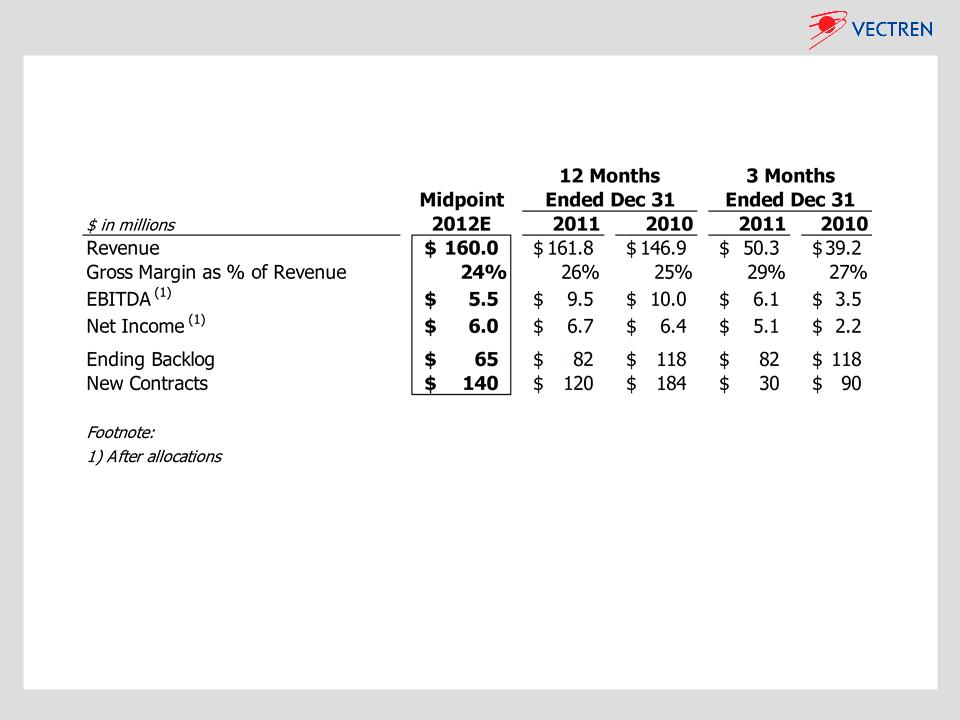
Nonutility Metrics - Infrastructure Services
Appendix
Metrics include results from Minnesota Limited following 3/31/2011 (acquisition date)

25
Energy Services - Energy Systems Group (ESG)
Performance Contracting
ØDesigns and constructs facility improvements that
pay for themselves from energy savings and
operational improvements
pay for themselves from energy savings and
operational improvements
• Assist customers with arranging financing (ESG does
not provide financing)
not provide financing)
ØMajor customers include hospitals, universities,
governments and schools (HUGS)
governments and schools (HUGS)
ØTargeting projects that qualify for the Energy
Efficient Commercial Building federal income tax
deductions (Rev. Code 179D) -available thru 2013
Efficient Commercial Building federal income tax
deductions (Rev. Code 179D) -available thru 2013
Renewable Energy Services
ØDesigns, constructs, and often operates
renewable energy projects
renewable energy projects
• Near-term opportunities include:
– Landfill gas projects
– Anaerobic digester projects
• Tax credits available for certain
renewable energy projects
renewable energy projects
• 2011 revenues of ~$160 million
• Backlog of $82 million at 12/31/11
• Approximately 250 employees at
12/31/11
12/31/11
• Licensed to do business in 36
states, primarily in the Midwest,
Mid-Atlantic and Southern regions
states, primarily in the Midwest,
Mid-Atlantic and Southern regions
Strategy: Continue to grow performance contracting and renewable energy business
segments through additional sales force and expanding geographic footprint
segments through additional sales force and expanding geographic footprint
Appendix
Construction of anaerobic digester at
Wisconsin dairy farm
Wisconsin dairy farm
Campus sustainability and energy conservation
project at the University of Baltimore, MD
project at the University of Baltimore, MD
26
Nonutility Metrics - Energy Services
Appendix

27
Coal Mining - Vectren Fuels
• 2011 revenues of ~$285 million
• 2011 sales of 5.2 million tons
• ~75% of 2012 production sold
• Approx. 675 contract mining jobs
as of 12/31/11
as of 12/31/11
• Approx. 800 contract mining jobs
with completion of Oaktown #2
with completion of Oaktown #2
• 13 power plants within 50 mile
radius
radius
Strategy: Mine and sell Indiana (Illinois Basin) coal to Vectren’s electric utility and other
third parties. Long-term demand expected to increase as economy improves,
inventory levels fall, scrubbers are installed and Appalachian production declines
third parties. Long-term demand expected to increase as economy improves,
inventory levels fall, scrubbers are installed and Appalachian production declines
Continuous Miner at Prosperity Mine
Box Cuts at Oaktown Mines 1 & 2
Appendix
Prosperity Mine
Ø30 million tons of reserves as of 12/31/11
Ø4.0 lbs SO2 - 11,300 BTU
ØMax annual production of ~2.5 million tons
Oaktown Mines 1 & 2
Ø102 million tons of reserves as of 12/31/11
ØLess than 6.0 lbs SO2 - 11,200 BTU
ØMax annual production
• Oaktown #1: ~3 million tons
• Oaktown #2: ~2 million tons
• Opening of Oaktown #2 targeted for third quarter 2012,
depending upon demand
depending upon demand
ØAs of 12/31/11, approximately $10 million of additional
capital is required to complete Oaktown #2
capital is required to complete Oaktown #2

28
Nonutility Metrics - Coal Mining
Appendix

29
Energy Marketing - ProLiance
Profit Improvement Initiatives
Ø~$55 million of firm transportation & storage
demand costs at the ProLiance level in 2012 (~$73
million in 2011); ~33 Bcf of storage at 12/31/12
demand costs at the ProLiance level in 2012 (~$73
million in 2011); ~33 Bcf of storage at 12/31/12
ØContracts representing another ~$18 million of
annualized fixed demand costs expire by 2015
annualized fixed demand costs expire by 2015
ØContinued focus on G&A cost control and margin
growth via adding commercial & industrial customers
growth via adding commercial & industrial customers
Balance Sheet Recap
Ø As of 12/31/11, ProLiance had members’
equity of over $160 million (~$135 million
after AOCI), no long-term debt
outstanding, and $86 million of seasonal
short-term borrowings outstanding
equity of over $160 million (~$135 million
after AOCI), no long-term debt
outstanding, and $86 million of seasonal
short-term borrowings outstanding
• 2011 revenues of ~$1.4 billion
• Approximately 100 employees
at 12/31/11
at 12/31/11
• At 12/31/11, 47 Bcf of natural
gas storage
gas storage
• Operates throughout the
Midwest & Southeast
Midwest & Southeast
Strategy: Execute profit improvement initiatives currently underway, including efforts to
lower pipeline and storage demand costs through ongoing renegotiations
lower pipeline and storage demand costs through ongoing renegotiations
Appendix
Gas marketing operations where ProLiance
buys, sells and optimizes gas supplies
• Retail services to ~1,800
commercial and industrial
customers
commercial and industrial
customers
• Wholesale services to utilities,
municipals, power generators
municipals, power generators
• Balanced book approach - VaR
capped at $2.5 million
capped at $2.5 million
Investment: Wholesale gas marketer owned Vectren (61%; equity acctg.) & Citizens Energy Group (39%)

30
Nonutility Metrics - Energy Marketing
Appendix

Use of Non-GAAP Performance Measures and Per Share Measures
Per share earnings contributions of the Utility Group, Nonutility Group, and Corporate and Other
are presented herein and are non-GAAP measures. Such per share amounts are based on the
earnings contribution of each group included in Vectren’s consolidated results divided by
Vectren’s basic average shares outstanding during the period. The earnings per share of the
groups do not represent a direct legal interest in the assets and liabilities allocated to the
groups, but rather represent a direct equity interest in Vectren Corporation's assets and
liabilities as a whole. These non-GAAP measures are used by management to evaluate the
performance of individual businesses. In addition, other items giving rise to period over period
variances, such as weather, are presented on an after tax and per share basis. These amounts
are calculated at a statutory tax rate divided by Vectren’s basic average shares outstanding
during the period. Accordingly, management believes these measures are useful to investors in
understanding each business’ contribution to consolidated earnings per share and in analyzing
consolidated period to period changes and the potential for earnings per share contributions in
future periods. Reconciliations of the non-GAAP measures to their most closely related GAAP
measure of consolidated earnings per share are included throughout the presentation
presented. The non-GAAP financial measures disclosed by the Company should not be
considered a substitute for, or superior to, financial measures calculated in accordance with
GAAP, and the financial results calculated in accordance with GAAP.
31
Appendix