Attached files
| file | filename |
|---|---|
| 8-K - FORM 8-K - TMS International Corp. | d305102d8k.htm |
Exhibit 99.1

February 21, 2012
To Holders of Tube City IMS Corporation’s
9 3/4% Senior Subordinated Notes due 2015
As required by Section 4.02(1) of the Indenture for the Tube City IMS Corporation 9 3/4 % Senior Subordinated Notes due 2015, we are supplying the following information:
| 1) | The Form 10-K of TMS International Corp., our parent company, for the year ending December 31, 2011; and |
| 2) | Reconciling financial statements providing details of the balances and adjustments necessary to reconcile from the TMS International Corp. results to the results of Tube City IMS Corporation. |
The reconciling financial statements include explanatory notes which discuss the relationship between the entities and the adjustments involved.
4
TMS INTERNATIONAL CORP. – TUBE CITY IMS CORPORATION
RECONCILING STATEMENTS OF OPERATIONS
(In thousands of dollars, except share and per share data)
| Year ended December 31, 2011 | ||||||||||||
| TMS International Corp. |
TMS Stand alone Balances & Adjustments |
Tube City IMS Corporation |
||||||||||
| (unaudited) | (unaudited) | |||||||||||
| Revenue: |
||||||||||||
| Revenue from sale of materials |
$ | 2,192,188 | $ | — | $ | 2,192,188 | ||||||
| Service revenue |
469,283 | — | 469,283 | |||||||||
|
|
|
|
|
|
|
|||||||
| Total revenue |
2,661,471 | — | 2,661,471 | |||||||||
| Costs and expenses: |
||||||||||||
| Cost of raw materials shipments |
2,112,011 | — | 2,112,011 | |||||||||
| Site operating costs |
356,183 | — | 356,183 | |||||||||
| Selling, general and administrative expenses |
58,646 | (1 | ) | 58,645 | ||||||||
| Provision for bad debts |
590 | 590 | ||||||||||
| Share based compensation associated with initial public offering |
1,304 | — | 1,304 | |||||||||
| Provision for transition agreement |
745 | — | 745 | |||||||||
| Depreciation |
47,493 | — | 47,493 | |||||||||
| Amortization |
12,401 | — | 12,401 | |||||||||
|
|
|
|
|
|
|
|||||||
| Total costs and expenses |
2,589,373 | (1 | ) | 2,589,372 | ||||||||
|
|
|
|
|
|
|
|||||||
| Income from operations |
72,098 | 1 | 72,099 | |||||||||
| Interest expense, net |
(32,201 | ) | 1,026 | (31,175 | ) | |||||||
| Loss on early extinguishment of debt |
(581 | ) | — | (581 | ) | |||||||
|
|
|
|
|
|
|
|||||||
| Income before income taxes |
39,316 | 1,027 | 40,343 | |||||||||
| Income tax expense |
(15,410 | ) | (481 | ) | (15,891 | ) | ||||||
|
|
|
|
|
|
|
|||||||
| Net income |
23,906 | 546 | 24,452 | |||||||||
| Net loss attributable to noncontrolling interest |
726 | — | 726 | |||||||||
| Accretion of Preferred Stock Dividends |
(7,156 | ) | 7,156 | — | ||||||||
|
|
|
|
|
|
|
|||||||
| Income applicable to common shares |
$ | 17,476 | $ | 7,702 | $ | 25,178 | ||||||
|
|
|
|
|
|
|
|||||||
| Net Income per common share: |
||||||||||||
| Basic |
$ | 0.59 | $ | 27.57 | ||||||||
| Diluted |
$ | 0.59 | $ | 27.57 | ||||||||
| Average common shares outstanding: |
||||||||||||
| Basic |
29,593,776 | 913,260 | ||||||||||
| Diluted |
29,596,359 | 913,260 | ||||||||||
The accompanying notes are an integral part of these reconciling financial statements.
5
TMS INTERNATIONAL CORP. – TUBE CITY IMS CORPORATION
RECONCILING STATEMENTS OF OPERATIONS
(In thousands of dollars, except share and per share data)
| Year ended December 31, 2010 | ||||||||||||
| TMS International Corp. |
TMS Stand alone Balances & Adjustments |
Tube City IMS Corporation |
||||||||||
| (unaudited) | (unaudited) | |||||||||||
| Revenue: |
||||||||||||
| Revenue from sale of materials |
$ | 1,632,822 | $ | — | $ | 1,632,822 | ||||||
| Service revenue |
397,808 | — | 397,808 | |||||||||
|
|
|
|
|
|
|
|||||||
| Total revenue |
2,030,630 | — | 2,030,630 | |||||||||
| Costs and expenses: |
||||||||||||
| Cost of raw materials shipments |
1,564,504 | — | 1,564,504 | |||||||||
| Site operating costs |
293,003 | — | 293,003 | |||||||||
| Selling, general and administrative expenses |
53,139 | (2 | ) | 53,137 | ||||||||
| Provision for bad debts |
64 | — | 64 | |||||||||
| Depreciation |
49,317 | — | 49,317 | |||||||||
| Amortization |
12,191 | — | 12,191 | |||||||||
|
|
|
|
|
|
|
|||||||
| Total costs and expenses |
1,972,218 | (2 | ) | 1,972,216 | ||||||||
| Income from operations |
58,412 | 2 | 58,414 | |||||||||
| Interest expense, net |
(40,361 | ) | 7,437 | (32,924 | ) | |||||||
|
|
|
|
|
|
|
|||||||
| Income before income taxes |
18,051 | 7,439 | 25,490 | |||||||||
| Income tax expense |
(10,903 | ) | (2,603 | ) | (13,506 | ) | ||||||
|
|
|
|
|
|
|
|||||||
| Net income |
7,148 | 4,836 | 11,984 | |||||||||
| Accretion of Preferred Stock Dividends |
(22,824 | ) | 22,824 | — | ||||||||
|
|
|
|
|
|
|
|||||||
| Net (Loss) income applicable to common shares |
$ | (15,676 | ) | $ | 27,660 | $ | 11,984 | |||||
|
|
|
|
|
|
|
|||||||
| Net (Loss) income per common share: |
||||||||||||
| Basic |
$ | (3.17 | ) | $ | 13.12 | |||||||
| Diluted |
$ | (3.17 | ) | $ | 13.12 | |||||||
| Average common shares outstanding: |
||||||||||||
| Basic |
4,944,193 | 913,260 | ||||||||||
| Diluted |
4,944,193 | 913,260 | ||||||||||
The accompanying notes are an integral part of these reconciling financial statements.
6
TMS INTERNATIONAL CORP. – TUBE CITY IMS CORPORATION
RECONCILING STATEMENTS OF OPERATIONS
(In thousands of dollars, except share and per share data)
| Year ended December 31, 2009 | ||||||||||||
| TMS International Corp. |
TMS Stand alone Balances & Adjustments |
Tube City IMS Corporation |
||||||||||
| (unaudited) | (unaudited) | |||||||||||
| Revenue: |
||||||||||||
| Revenue from sale of materials |
$ | 989,257 | $ | — | $ | 989,257 | ||||||
| Service revenue |
309,082 | — | 309,082 | |||||||||
|
|
|
|
|
|
|
|||||||
| Total revenue |
1,298,339 | — | 1,298,339 | |||||||||
| Costs and expenses: |
||||||||||||
| Cost of raw materials shipments |
939,993 | — | 939,993 | |||||||||
| Site operating costs |
233,120 | — | 233,120 | |||||||||
| Selling, general and administrative expenses |
44,638 | (13 | ) | 44,625 | ||||||||
| Recovery of bad debt, net |
(5,419 | ) | — | (5,419 | ) | |||||||
| Provision for transition agreement |
2,243 | — | 2,243 | |||||||||
| Depreciation |
57,567 | — | 57,567 | |||||||||
| Amortization |
12,193 | — | 12,193 | |||||||||
|
|
|
|
|
|
|
|||||||
| Total costs and expenses |
1,284,335 | (13 | ) | 1,284,322 | ||||||||
| Income from operations |
14,004 | 13 | 14,017 | |||||||||
| Interest expense, net |
(44,825 | ) | 7,475 | (37,350 | ) | |||||||
| Gain on early extinguishment of debt |
1,505 | 1,505 | ||||||||||
| Goodwill impairment |
(55,000 | ) | (55,000 | ) | ||||||||
| Recognition of cumulative translation adjustment |
(1,560 | ) | (1,560 | ) | ||||||||
|
|
|
|
|
|
|
|||||||
| Loss before income taxes |
(85,876 | ) | 7,488 | (78,388 | ) | |||||||
| Income tax benefit |
6,885 | (2,621 | ) | 4,264 | ||||||||
|
|
|
|
|
|
|
|||||||
| Net loss |
(78,991 | ) | 4,867 | (74,124 | ) | |||||||
| Accretion of Preferred Stock Dividends |
(21,069 | ) | 21,069 | — | ||||||||
|
|
|
|
|
|
|
|||||||
| Net (Loss) income applicable to common shares |
$ | (100,060 | ) | $ | 25,936 | $ | (74,124 | ) | ||||
|
|
|
|
|
|
|
|||||||
| Net (Loss) income per common share: |
||||||||||||
| Basic |
$ | (20.14 | ) | $ | (81.16 | ) | ||||||
| Diluted |
$ | (20.14 | ) | $ | (81.16 | ) | ||||||
| Average common shares outstanding: |
||||||||||||
| Basic |
4,969,164 | 913,260 | ||||||||||
| Diluted |
4,969,164 | 913,260 | ||||||||||
The accompanying notes are an integral part of these reconciling financial statements.
7
TMS INTERNATIONAL CORP. – TUBE CITY IMS CORPORATION
RECONCILING BALANCE SHEETS
(In thousands of dollars, except share and per share data)
| December 31, 2011 | ||||||||||||
| TMS International Corp. |
TMS Stand alone Balances & Adjustments |
Tube City IMS Corporation |
||||||||||
| (unaudited) | (unaudited) | |||||||||||
| Assets | ||||||||||||
| Current assets: |
||||||||||||
| Cash and cash equivalents |
$ | 108,830 | $ | (54,510 | ) | $ | 54,320 | |||||
| Accounts receivable, net of allowance for doubtful accounts of $2,613 |
292,546 | — | 292,546 | |||||||||
| Inventories |
56,297 | — | 56,297 | |||||||||
| Prepaid and other current assets |
31,041 | 22 | 31,063 | |||||||||
| Deferred tax asset |
7,114 | — | 7,114 | |||||||||
|
|
|
|
|
|
|
|||||||
| Total current assets |
495,828 | (54,488 | ) | 441,340 | ||||||||
| Property, plant and equipment, net |
161,017 | — | 161,017 | |||||||||
| Deferred financing costs, net of accumulated amortization of $9,517 |
10,638 | — | 10,638 | |||||||||
| Goodwill |
241,771 | — | 241,771 | |||||||||
| Other intangibles, net of accumulated amortization of $56,374 |
153,066 | — | 153,066 | |||||||||
| Other noncurrent assets |
3,675 | (74 | ) | 3,601 | ||||||||
|
|
|
|
|
|
|
|||||||
| Total assets |
$ | 1,065,995 | $ | (54,562 | ) | $ | 1,011,433 | |||||
|
|
|
|
|
|
|
|||||||
| Liabilities, Redeemable Preferred Stock and Stockholders’ Equity | ||||||||||||
| Current liabilities: |
||||||||||||
| Accounts payable |
$ | 225,999 | $ | — | $ | 225,999 | ||||||
| Accounts payable overdraft |
47,817 | — | 47,817 | |||||||||
| Salaries, wages and related benefits |
28,105 | — | 28,105 | |||||||||
| Accrued expenses |
24,340 | (49 | ) | 24,291 | ||||||||
| Revolving bank borrowings |
159 | — | 159 | |||||||||
| Current portion of long-term debt |
3,585 | — | 3,585 | |||||||||
|
|
|
|
|
|
|
|||||||
| Total current liabilities |
330,005 | (49 | ) | 329,956 | ||||||||
| Long-term debt |
379,250 | — | 379,250 | |||||||||
| Indebtedness to noncontrolling interest |
5,275 | — | 5,275 | |||||||||
| Deferred tax liability |
53,791 | — | 53,791 | |||||||||
| Other noncurrent liabilities |
20,833 | 5,704 | 26,537 | |||||||||
|
|
|
|
|
|
|
|||||||
| Total liabilities |
789,154 | 5,655 | 794,809 | |||||||||
| Redeemable preferred stock: |
||||||||||||
| TMS International Corp. redeemable, convertible preferred stock, 50,000 shares authorized with 22,000 shares designated as Class A; $0.001 par value per share; 0 shares issued and outstanding |
— | — | — | |||||||||
| Stockholders’ equity: |
||||||||||||
| Tube City IMS Corporation Common stock, 913,260 shares issued and outstanding; par value $.001 per share; 2,500,000 shares authorized |
— | 1 | 1 | |||||||||
| TMS International Corp. Class A common stock; 200,000,000 shares authorized, $0.001 par value per share; 12,894,333 shares issued and outstanding |
13 | (13 | ) | — | ||||||||
| TMS International Corp. Class B common stock; 30,000,000 shares authorized, $0.001 par value per share; 26,361,640 shares issued and outstanding |
26 | (26 | ) | — | ||||||||
| Capital in excess of par value |
434,841 | (155,584 | ) | 279,257 | ||||||||
| Accumulated deficit |
(148,232 | ) | 95,405 | (52,827 | ) | |||||||
| Accumulated other comprehensive income |
(11,075 | ) | — | (11,075 | ) | |||||||
|
|
|
|
|
|
|
|||||||
| Total TMS International Corp./Tube City IMS Corp. stockholders’ equity |
275,573 | (60,217 | ) | 215,356 | ||||||||
| Noncontrolling interest |
1,268 | — | 1,268 | |||||||||
|
|
|
|
|
|
|
|||||||
| Total stockholders’ equity |
276,841 | (60,217 | ) | 216,624 | ||||||||
|
|
|
|
|
|
|
|||||||
| Total liabilities, redeemable preferred stock and stockholders’ equity |
$ | 1,065,995 | $ | (54,562 | ) | $ | 1,011,433 | |||||
|
|
|
|
|
|
|
|||||||
The accompanying notes are an integral part of these condensed consolidated financial statements.
8
TMS INTERNATIONAL CORP. – TUBE CITY IMS CORPORATION
RECONCILING BALANCE SHEETS
(In thousands of dollars, except share and per share data)
| December 31, 2010 | ||||||||||||
| TMS International Corp. |
TMS Stand alone Balances & Adjustments |
Tube City IMS Corporation |
||||||||||
| (unaudited) | ||||||||||||
| Assets | ||||||||||||
| Current assets: |
||||||||||||
| Cash and cash equivalents |
$ | 49,492 | $ | — | $ | 49,492 | ||||||
| Accounts receivable, net of allowance for doubtful accounts of $2,125 |
207,147 | — | 207,147 | |||||||||
| Inventories |
38,664 | — | 38,664 | |||||||||
| Prepaid and other current assets |
19,562 | — | 19,562 | |||||||||
| Deferred tax asset |
6,702 | — | 6,702 | |||||||||
|
|
|
|
|
|
|
|||||||
| Total current assets |
321,567 | — | 321,567 | |||||||||
| Property, plant and equipment, net |
138,540 | — | 138,540 | |||||||||
| Deferred financing costs, net of accumulated amortization of $9,280 |
8,384 | — | 8,384 | |||||||||
| Goodwill |
242,148 | — | 242,148 | |||||||||
| Other intangibles, net of accumulated amortization of $47,232 |
165,295 | — | 165,295 | |||||||||
| Other noncurrent assets |
2,971 | — | 2,971 | |||||||||
|
|
|
|
|
|
|
|||||||
| Total assets |
$ | 878,905 | $ | — | $ | 878,905 | ||||||
|
|
|
|
|
|
|
|||||||
| Liabilities, Redeemable Preferred Stock and Stockholders’ (Deficit) Equity | ||||||||||||
| Current liabilities: |
||||||||||||
| Accounts payable |
$ | 177,668 | $ | — | $ | 177,668 | ||||||
| Accounts payable overdraft |
25,802 | — | 25,802 | |||||||||
| Salaries, wages and related benefits |
28,934 | — | 28,934 | |||||||||
| Accrued expenses |
30,834 | (809 | ) | 30,025 | ||||||||
| Revolving bank borrowings |
304 | — | 304 | |||||||||
| Current portion of long-term debt |
3,185 | — | 3,185 | |||||||||
|
|
|
|
|
|
|
|||||||
| Total current liabilities |
266,727 | (809 | ) | 265,918 | ||||||||
| Long-term debt |
380,997 | — | 380,997 | |||||||||
| Indebtedness to related parties |
42,155 | (42,155 | ) | — | ||||||||
| Deferred tax liability |
42,932 | 1,982 | 44,914 | |||||||||
| Other noncurrent liabilities |
20,203 | 3,242 | 23,445 | |||||||||
|
|
|
|
|
|
|
|||||||
| Total liabilities |
753,014 | (37,740 | ) | 715,274 | ||||||||
| Redeemable preferred stock: |
||||||||||||
| TMS International Corp. redeemable, convertible preferred stock, 50,000 shares authorized with 25,000 shares designated as Class A; $0.001 par value per share; 21,883 shares issued and outstanding, liquidation preference of $296,844, accumulated and unpaid dividend of $80,203. |
296,844 | (296,844 | ) | — | ||||||||
| Stockholders’ (deficit) equity: |
||||||||||||
| Tube City IMS Corporation Common stock, 913,260 shares issued and outstanding; par value $.001 per share; 2,500,000 shares authorized |
— | 1 | 1 | |||||||||
| TMS International Corp. Class A common stock; 200,000,000 shares authorized, $0.001 par value per share; no shares issued and outstanding |
— | — | — | |||||||||
| TMS International Corp. Class B common stock; 30,000,000 shares authorized, $0.001 par value per share; 4,943,992 shares issued and outstanding |
— | — | — | |||||||||
| Capital in excess of par value |
— | 246,871 | 246,871 | |||||||||
| Accumulated deficit |
(165,717 | ) | 87,712 | (78,005 | ) | |||||||
| Accumulated other comprehensive income |
(5,502 | ) | — | (5,502 | ) | |||||||
|
|
|
|
|
|
|
|||||||
| Total TMS International Corp./Tube City IMS Corp. stockholders’ (deficit) equity |
(171,219 | ) | 334,584 | 163,365 | ||||||||
| Noncontrolling interest |
266 | — | 266 | |||||||||
|
|
|
|
|
|
|
|||||||
| Total stockholders’ (deficit) equity |
(170,953 | ) | 334,584 | 163,631 | ||||||||
|
|
|
|
|
|
|
|||||||
| Total liabilities, redeemable preferred stock and stockholders’ (deficit) equity |
$ | 878,905 | $ | — | $ | 878,905 | ||||||
|
|
|
|
|
|
|
|||||||
The accompanying notes are an integral part of these condensed consolidated financial statements.
9
TMS INTERNATIONAL CORP. – TUBE CITY IMS CORPORATION
RECONCILING STATEMENTS OF CASH FLOWS
(In thousands of dollars)
| Year ended December 31, 2011 | ||||||||||||
| TMS International Corp. |
TMS Stand alone Balances & Adjustments |
Tube City IMS Corporation |
||||||||||
| (unaudited) | (unaudited) | |||||||||||
| Cash flows from operating activities: |
||||||||||||
| Net Income |
$ | 23,906 | $ | 644 | $ | 24,550 | ||||||
| Adjustments to reconcile Net Income to net cash (used in) operating activities: |
||||||||||||
| Depreciation and Amortization |
59,894 | — | 59,894 | |||||||||
| Amortization of deferred financing costs |
2,491 | — | 2,491 | |||||||||
| Deferred income tax |
12,300 | 383 | 12,683 | |||||||||
| Provision for bad debts |
590 | — | 590 | |||||||||
| Loss (gain) on the disposal of equipment |
291 | — | 291 | |||||||||
| Non-cash share-based compensation cost |
2,231 | — | 2,231 | |||||||||
| Non-cash loss (gain) from debt extinguishment |
581 | — | 581 | |||||||||
| Increase (decrease) from changes in: |
||||||||||||
| Accounts receivable |
(85,989 | ) | — | (85,989 | ) | |||||||
| Inventories |
(17,633 | ) | — | (17,633 | ) | |||||||
| Prepaid and other current assets |
(2,789 | ) | — | (2,789 | ) | |||||||
| Other noncurrent assets |
(79 | ) | — | (79 | ) | |||||||
| Accounts payable and accounts payable overdraft |
70,346 | — | 70,346 | |||||||||
| Accrued expenses |
(4,639 | ) | (2,738 | ) | (7,377 | ) | ||||||
| Other noncurrent liabilities |
(236 | ) | — | (236 | ) | |||||||
| Other, net |
(2,320 | ) | 84 | (2,236 | ) | |||||||
|
|
|
|
|
|
|
|||||||
| Net cash provided by (used for) operating activities |
$ | 58,945 | $ | (1,627 | ) | $ | 57,318 | |||||
| Cash flows from investing activities: |
||||||||||||
| Capital expenditures |
(83,076 | ) | — | (83,076 | ) | |||||||
| Proceeds from sale of equipment |
673 | — | 673 | |||||||||
| Acquisition |
(50 | ) | — | (50 | ) | |||||||
| Contingent payment for acquired business |
(337 | ) | — | (337 | ) | |||||||
| Cash flows related to IU International, net |
(402 | ) | — | (402 | ) | |||||||
|
|
|
|
|
|
|
|||||||
| Net cash used for investing activities |
(83,192 | ) | — | (83,192 | ) | |||||||
| Cash flows from financing activities: |
||||||||||||
| Revolving credit facility borrowing (repayments), net |
(115 | ) | — | (115 | ) | |||||||
| Issuance of debt |
5,275 | — | 5,275 | |||||||||
| IPO proceeds/capital contribution |
128,657 | (105,835 | ) | 22,822 | ||||||||
| Debt issuance and termination fees |
(5,326 | ) | — | (5,326 | ) | |||||||
| Repayment of debt |
(46,223 | ) | 42,155 | (4,068 | ) | |||||||
| Contributions from noncontrolling interests |
1,849 | — | 1,849 | |||||||||
|
|
|
|
|
|
|
|||||||
| Net cash provided by (used for) financing activities |
84,117 | (63,680 | ) | 20,437 | ||||||||
| Effect of exchange rate changes on cash & equivalents |
(532 | ) | — | (532 | ) | |||||||
| Cash and cash equivalents: |
||||||||||||
| Net increase (decrease) in cash |
59,338 | (65,307 | ) | (5,969 | ) | |||||||
| Cash at beginning of period |
49,492 | — | 49,492 | |||||||||
|
|
|
|
|
|
|
|||||||
| Cash at end of period |
$ | 108,830 | $ | (65,307 | ) | $ | 43,523 | |||||
|
|
|
|
|
|
|
|||||||
The accompanying notes are an integral part of these condensed consolidated financial statements.
10
TMS INTERNATIONAL CORP. – TUBE CITY IMS CORPORATION
RECONCILING STATEMENTS OF CASH FLOWS
(In thousands of dollars)
| Year ended December 31, 2010 | ||||||||||||
| TMS International Corp. |
TMS Stand alone Balances & Adjustments |
Tube City IMS Corporation |
||||||||||
| (unaudited) | (unaudited) | |||||||||||
| Cash flows from operating activities: |
||||||||||||
| Net Income |
$ | 7,148 | $ | 4,836 | $ | 11,984 | ||||||
| Adjustments to reconcile Net Income to net cash provided by operating activities: |
||||||||||||
| Depreciation and Amortization |
61,508 | — | 61,508 | |||||||||
| Amortization of deferred financing costs |
2,468 | — | 2,468 | |||||||||
| Deferred income tax |
9,618 | 2,603 | 12,221 | |||||||||
| Provision for bad debts |
123 | — | 123 | |||||||||
| Loss (gain) on the disposal of equipment |
(362 | ) | — | (362 | ) | |||||||
| Non-cash share-based compensation cost |
29 | — | 29 | |||||||||
| Interest paid-in-kind |
4,657 | (4,657 | ) | — | ||||||||
| Increase (decrease) from changes in: |
||||||||||||
| Accounts receivable |
(42,652 | ) | — | (42,652 | ) | |||||||
| Inventories |
(6,799 | ) | — | (6,799 | ) | |||||||
| Prepaid and other current assets |
(11,758 | ) | — | (11,758 | ) | |||||||
| Other noncurrent assets |
329 | — | 329 | |||||||||
| Accounts payable and accounts payable overdraft |
48,157 | — | 48,157 | |||||||||
| Accrued expenses |
15,989 | 164 | 16,153 | |||||||||
| Other non current liabilities |
(1,699 | ) | — | (1,699 | ) | |||||||
| Other, net |
(319 | ) | — | (319 | ) | |||||||
|
|
|
|
|
|
|
|||||||
| Net cash provided by operating activities |
$ | 86,437 | $ | 2,946 | $ | 89,383 | ||||||
| Cash flows from investing activities: |
||||||||||||
| Capital expenditures |
(39,816 | ) | — | (39,816 | ) | |||||||
| Proceeds from sale of equipment |
1,394 | — | 1,394 | |||||||||
| Acquisition |
(495 | ) | — | (495 | ) | |||||||
| Amount returned from escrow related to prior acquisition |
1,712 | — | 1,712 | |||||||||
| Contingent payment for acquired business |
(339 | ) | — | (339 | ) | |||||||
| Cash flows related to IU International, net |
(331 | ) | — | (331 | ) | |||||||
|
|
|
|
|
|
|
|||||||
| Net cash used for investing activities |
(37,875 | ) | — | (37,875 | ) | |||||||
| Cash flows from financing activities: |
||||||||||||
| Revolving credit facility borrowing (repayments), net |
(4,115 | ) | — | (4,115 | ) | |||||||
| Repayment of debt |
(25,193 | ) | 20,424 | (4,769 | ) | |||||||
| Contributions from noncontrolling interest |
266 | 266 | ||||||||||
|
|
|
|
|
|
|
|||||||
| Net cash provided by (used for) financing activities |
(29,042 | ) | 20,424 | (8,618 | ) | |||||||
| Effect of exchange rate changes on cash & equivalents |
158 | — | 158 | |||||||||
| Cash and cash equivalents: |
||||||||||||
| Net increase in cash |
19,678 | 23,370 | 43,048 | |||||||||
| Cash at beginning of period |
29,814 | (23,370 | ) | 6,444 | ||||||||
|
|
|
|
|
|
|
|||||||
| Cash at end of period |
$ | 49,492 | $ | — | $ | 49,492 | ||||||
|
|
|
|
|
|
|
|||||||
The accompanying notes are an integral part of these condensed consolidated financial statements.
11
TMS INTERNATIONAL CORP. – TUBE CITY IMS CORPORATION
RECONCILING STATEMENTS OF CASH FLOWS
(In thousands of dollars)
| Year ended December 31, 2009 | ||||||||||||
| TMS International Corp. |
TMS Stand alone Balances & Adjustments |
Tube City IMS Corporation |
||||||||||
| (unaudited) | (unaudited) | |||||||||||
| Cash flows from operating activities: |
||||||||||||
| Net Income |
$ | (78,991 | ) | $ | 4,867 | $ | (74,124 | ) | ||||
| Adjustments to reconcile Net Income to net cash provided by operating activities: |
||||||||||||
| Depreciation and Amortization |
69,760 | — | 69,760 | |||||||||
| Amortization of deferred financing costs |
2,331 | — | 2,331 | |||||||||
| Deferred income tax |
(8,474 | ) | 2,621 | (5,853 | ) | |||||||
| Provision for bad debts |
680 | — | 680 | |||||||||
| Loss (gain) on the disposal of equipment |
(301 | ) | — | (301 | ) | |||||||
| Non-cash share-based compensation cost |
30 | — | 30 | |||||||||
| Interest paid-in-kind |
6,611 | (6,611 | ) | — | ||||||||
| Non-cash gain from debt extinguishment |
(1,505 | ) | (1,505 | ) | ||||||||
| Impairment of goodwill |
55,000 | 55,000 | ||||||||||
| Recognition of cumulative translation adjustment |
1,560 | 1,560 | ||||||||||
| Increase (decrease) from changes in: |
||||||||||||
| Accounts receivable |
(22,479 | ) | — | (22,479 | ) | |||||||
| Inventories |
(13,229 | ) | — | (13,229 | ) | |||||||
| Prepaid and other current assets |
5,795 | — | 5,795 | |||||||||
| Other noncurrent assets |
(325 | ) | — | (325 | ) | |||||||
| Accounts payable and accounts payable overdraft |
59,673 | — | 59,673 | |||||||||
| Accrued expenses |
(4,747 | ) | (806 | ) | (5,553 | ) | ||||||
| Other non current liabilities |
(329 | ) | — | (329 | ) | |||||||
| Other, net |
1,925 | 1,925 | ||||||||||
|
|
|
|
|
|
|
|||||||
| Net cash provided by operating activities |
$ | 72,985 | $ | 71 | $ | 73,056 | ||||||
| Cash flows from investing activities: |
||||||||||||
| Capital expenditures |
(37,635 | ) | — | (37,635 | ) | |||||||
| Proceeds from sale of equipment |
3,337 | — | 3,337 | |||||||||
| Contingent payment for acquired business |
(426 | ) | — | (426 | ) | |||||||
| Cash flows related to IU International, net |
(1,416 | ) | — | (1,416 | ) | |||||||
|
|
|
|
|
|
|
|||||||
| Net cash used for investing activities |
(36,140 | ) | — | (36,140 | ) | |||||||
| Cash flows from financing activities: |
||||||||||||
| Revolving credit facility borrowing (repayments), net |
(46,760 | ) | — | (46,760 | ) | |||||||
| Issuance of debt |
39,153 | (38,732 | ) | 421 | ||||||||
| Fees paid to amend term loan |
(588 | ) | (588 | ) | ||||||||
| Repurchase of senior notes |
(430 | ) | (430 | ) | ||||||||
| Repayment of debt |
(4,436 | ) | 500 | (3,936 | ) | |||||||
| Capital contributions |
— | 15,871 | 15,871 | |||||||||
|
|
|
|
|
|
|
|||||||
| Net cash used for financing activities |
(13,061 | ) | (22,361 | ) | (35,422 | ) | ||||||
| Effect of exchange rate changes on cash & equivalents |
238 | — | 238 | |||||||||
| Cash and cash equivalents: |
||||||||||||
| Net increase (decrease) in cash |
24,022 | (22,290 | ) | 1,732 | ||||||||
| Cash at beginning of period |
5,792 | (1,080 | ) | 4,712 | ||||||||
|
|
|
|
|
|
|
|||||||
| Cash at end of period |
$ | 29,814 | $ | (23,370 | ) | $ | 6,444 | |||||
|
|
|
|
|
|
|
|||||||
The accompanying notes are an integral part of these condensed consolidated financial statements.
12
Notes to Reconciling Financial Statements.
Note 1—Basis of Presentation
The reconciling financial statements have been prepared for the purpose of reconciling the balances and activities of TMS International Corp. with those of Tube City IMS Corporation, an indirect wholly owned subsidiary thereof. The statements should be read in conjunction with the Annual Report on Form 10-K of TMS International Corp. for the period ended December 31, 2011. These statements are not prepared in accordance with generally accepted accounting principles and are furnished solely for the purpose of reconciling the financial statements of TMS International Corp. to the financial statements of Tube City IMS Corporation as of and for the years ending December 31, 2011, 2010 and 2009. Operating results for the years ending December 31, 2011, 2010 and 2009 are not necessarily indicative of the results that may be expected for future periods.
On April 19, 2011, TMS International Corp. completed an initial public offering of its class A common stock. In connection with this offering, TMS International Corp. amended and restated its certificate of incorporation to create two classes of common stock; class A common stock and class B common stock. TMS International Corp. also effectuated a 207.4307-for-one stock split on April 13, 2011 for its class B common shares, the effect of which has been applied retroactively in these consolidated financial statements.
The chart below provides details of the organizational structure of TMS International Corp. and its subsidiaries immediately after giving effect to the offering (including the underwriters’ overallotment option):
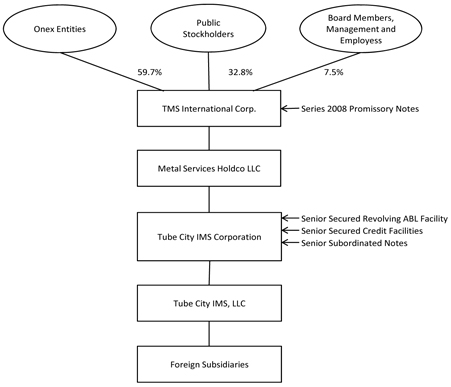
Onex Corporation and its affiliates beneficially own approximately 84.8% of the aggregate voting power of our outstanding common stock.
A portion of the net offering proceeds to TMS International Corp. was used to pay off all amounts outstanding under the series 2008 promissory notes, which were an obligation of TMS International Corp., and $13.8 million was contributed as equity to Tube City IMS Corporation. The remaining proceeds were used or remain at TMS International Corp. for general corporate purposes.
13
Note 2—Reconciling Balances and Adjustments
Series 2008 Promissory Notes
Prior to their repayment in connection with the initial public offering, the series 2008 promissory notes were an unsecured obligation of TMS International Corp. that were subordinated in right to payment to all existing and future senior indebtedness. The holders of the series 2008 promissory notes were also owners, or affiliates of owners of TMS International Corp.’s common stock. The series 2008 promissory notes are therefore reported as indebtedness to related parties. The series 2008 promissory notes were an obligation only of TMS International Corp. and were not an obligation of Tube City IMS Corporation.
TMS International Corp. Series A Preferred Stock
TMS International Corp. was initially capitalized via the sale of units which consisted of one share of common stock and one share of series A preferred stock with an initial liquidation value of $9,900 per share. The series A preferred stock carried an accumulating dividend of 8%. The funds generated in the initial capitalization of TMS International Corp. were used to acquire the common stock of Tube City IMS Corporation. Tube City IMS Corporation has only common stock and no preferred stock.
In reconciling from TMS International Corp. to Tube City IMS Corporation, the effects of the preferred stock, including the accretion of accumulated and unpaid dividends thereon, are reversed.
All shares of the TMS International Corp. series A preferred stock were converted into shares of TMS International Corp. class B common stock in connection with the initial public offering.
Related Tax Effects
The remaining reconciling adjustments relate to the tax effects of the different entities. The adjustments include recording a $5.6 million liability on the financial statements of Tube City IMS Corporation at September 30, 2011 based on the use of certain tax benefits of TMS International Corp pursuant to a tax sharing arrangement.
14