Attached files
| file | filename |
|---|---|
| 8-K - FORM 8-K - NEVADA POWER CO | d304959d8k.htm |
| EX-99.1 - PRESS RELEASE DATED FEBRUARY 21, 2012 - NEVADA POWER CO | d304959dex991.htm |
Exhibit 99.2
Fourth Quarter 2011 Earnings Call Supplemental Slides
February 21, 2012
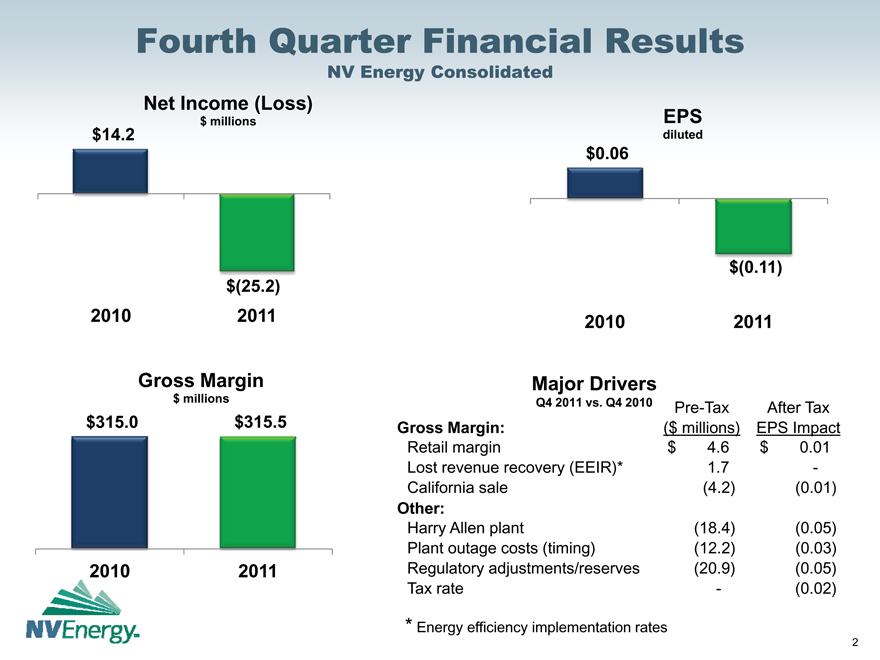
Fourth Quarter Financial Results
NV Energy Consolidated
Net Income (Loss)
$14.2 $ millions
$(25.2) 2010 2011
EPS
diluted
$0.06
$(0.11) 2010 2011
Gross Margin
$ millions
$315.0 $315.5
Major Drivers
Q4 2011 vs. Q4 2010 Pre-Tax After Tax
Gross Margin: ($ millions) EPS Impact
Retail margin $ 4.6 $ 0.01
Lost revenue recovery (EEIR)* 1.7 —
California sale (4.2) (0.01)
Other:
Harry Allen plant (18.4) (0.05)
Plant outage costs (timing) (12.2) (0.03)
Regulatory adjustments/reserves (20.9) (0.05)
Tax rate — (0.02)
* Energy efficiency implementation rates
2
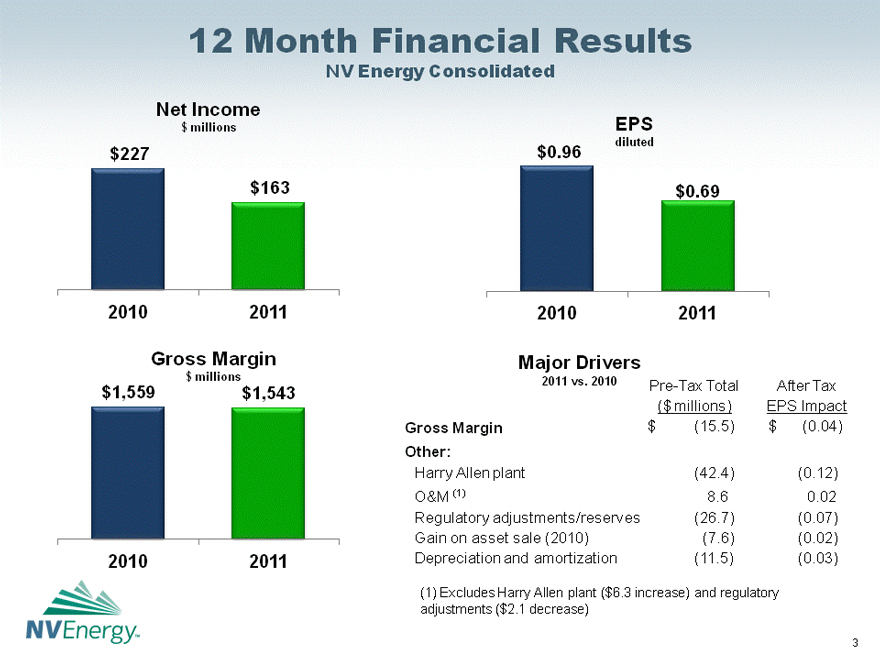
12 Month Financial Results
NV Energy Consolidated
Net Income
$ millions EPS diluted
$227 $0.96 $163 $0.69
2010 2011 2010 2011
Gross Margin
$ millions
$1,559 $1,543
2010 2011
Major Drivers
2011 vs. 2010 Pre-Tax Total After Tax
($ millions) EPS Impact
Gross Margin $ (15.5) $ (0.04)
Other:
Harry Allen plant (42.4) (0.12)
O&M (1) 8.6 0.02
Regulatory adjustments/reserves (26.7) (0.07)
Gain on asset sale (2010) (7.6) (0.02)
Depreciation and amortization (11.5) (0.03)
(1) Excludes Harry Allen plant ($6.3 increase) and regulatory
adjustments ($2.1 decrease)
3
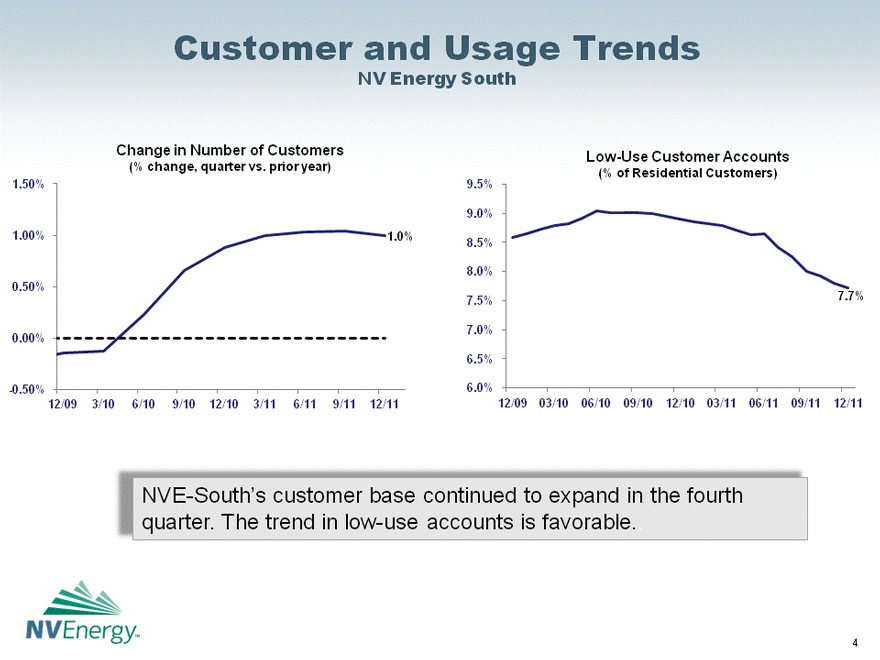
Customer and Usage Trends
NV Energy South
Change in Number of Customers (% change, quarter vs. prior year)
Low-Use Customer Accounts (% of Residential Customers)
1.50%
1.00% 1.0%
0.50%
0.00%
-0.50%
12/09 3/10 6/10 9/10 12/10 3/11 6/11 9/11 12/11
9.5%
9.0%
8.5%
8.0%
7.5% 7.7%
7.0%
6.5%
6.0%
12/09 03/10 06/10 09/10 12/10 03/11 06/11 09/11 12/11
NVE-South’s customer base continued to expand in the fourth quarter. The trend in low-use accounts is favorable.
4
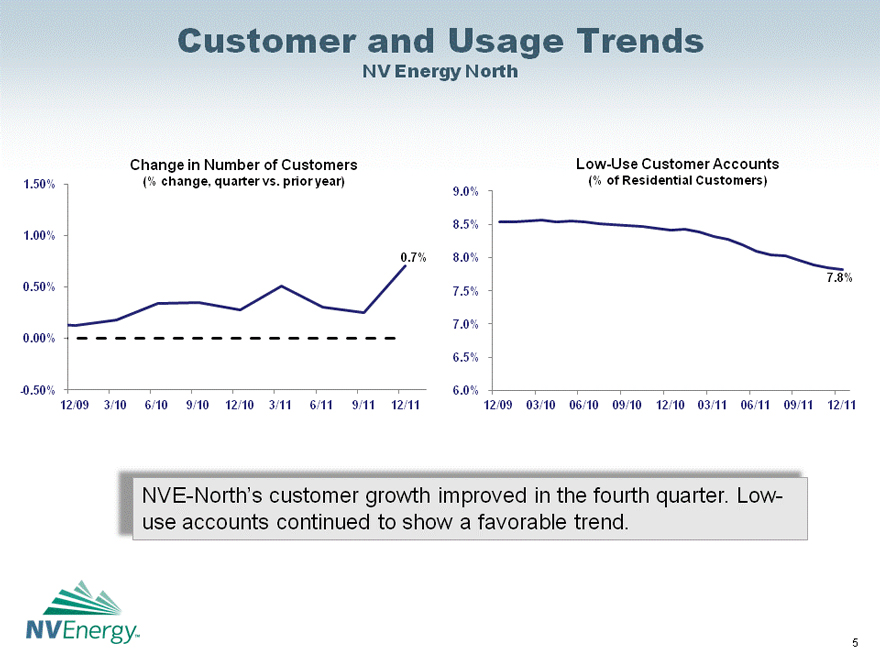
Customer and Usage Trends
NV Energy North
Change in Number of Customers
1.50% (% change, quarter vs. prior year)
1.00%
0.7%
0.50%
0.00%
-0.50%
12/09 3/10 6/10 9/10 12/10 3/11 6/11 9/11 12/11
Low-Use Customer Accounts
9.0% (% of Residential Customers)
8.5%
8.0%
7.8%
7.5%
7.0%
6.5%
6.0%
12/09 03/10 06/10 09/10 12/10 03/11 06/11 09/11 12/11
NVE-North’s customer growth improved in the fourth quarter. Low-use accounts continued to show a favorable trend.
5
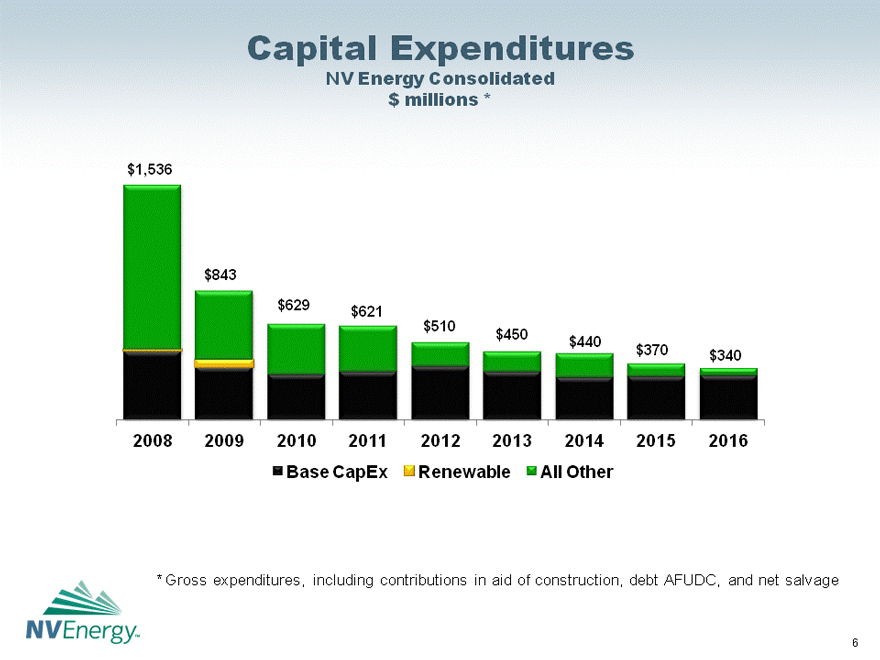
Capital Expenditures
NV Energy Consolidated $ millions *
$1,536
$843 $629 $621 $510 $450 $440 $370 $340
2008 2009 2010 2011 2012 2013 2014 2015 2016 Base CapEx Renewable All Other
* Gross expenditures, including contributions in aid of construction, debt AFUDC, and net salvage
6