Attached files
| file | filename |
|---|---|
| EX-99.1 - PRESS RELEASE - BROCADE COMMUNICATIONS SYSTEMS INC | d303958dex991.htm |
| 8-K - FORM 8-K - BROCADE COMMUNICATIONS SYSTEMS INC | d303958d8k.htm |
 Q1 FY 2012 EARNINGS
February 21, 2012
1
Exhibit 99.2 |
| Prepared comments provided by Rob Eggers, Investor Relations
Thank you for your interest in Brocade’s Q1 Fiscal 2012 earnings
presentation, which includes prepared remarks, slides, and a press
release detailing fiscal first quarter 2012 financial results. The press release was issued shortly after 1:00 p.m. Pacific time
on February 21, 2012, via Marketwire. The press release, along with these
prepared comments and slides, has been furnished to the SEC on Form
8-K and will be made available on Brocade’s Investor Relations website at www.brcd.com. |
| Cautionary Statements and Disclosures
2
This presentation includes forward-looking statements regarding
Brocade’s financial results, plans guidance, strategy and business
outlook, TAX rate, OEM inventory, as well as EMEA economic outlook, worldwide SAN demand and growth
rate, IT spending, which are only predictions and involve risks and
uncertainties such that actual results may vary significantly. These and
other risks are set forth in more detail in our Form 10-K for the fiscal year ended October 29,
2011. These forward-looking statements reflect beliefs, assumptions,
outlook, estimates, and predictions as of today, and Brocade expressly
assumes no obligation to update any such forward-looking statements.
In addition, this presentation includes various third-party estimates
regarding the total available market and other measures,
which
do
not
necessarily
reflect
the
views
of
Brocade.
Further,
Brocade
does
not
guarantee
the
accuracy
or
reliability of any such information or forecast.
Certain financial information is presented on a non-GAAP basis. Management
believes that non-GAAP financial measures used in this presentation
allow management to gain a better understanding of Brocade’s comparative
operating
performance
both
from
period
to
period,
and
to
its
competitors’
operating
results.
Management
also
believes
these non-GAAP financial measures help indicate Brocade's baseline
performance before gains, losses or charges that are considered by
management to be outside ongoing operating results. Accordingly, management uses these non-GAAP
financial measures for planning and forecasting of future periods and in making
decisions regarding operations performance and the allocation of
resources. The most directly comparable GAAP information and a reconciliation
between the non-GAAP and GAAP figures are provided in the accompanying
press release, which has been furnished to the SEC on Form 8-K and
posted on Brocade’s website, and is included in the subsequent slide in this presentation.
Please see risk factors on Form 10-K filed with the SEC
|
 Quarterly Net Income (Loss)
GAAP/Non-GAAP Reconciliation
(In $ Thousands)
Q1 11
Q2 11
Q3 11
Q4 11
Q1 12
Net income (loss) on a GAAP basis
$ 26,918
$ 26,079
$ 1,937
$ (4,324)
$ 58,584
Gross margin adjustments:
Stock-based compensation
2,860
4,167
4,234
4,345
4,375
Amortization of acquired intangibles
14,466
14,466
14,466
14,090
14,090
Provision for (benefit from) certain pre-acquisition litigation
–
–
(14,334)
–
–
Legal fees associated with certain pre-acquisition litigation
77
216
92
59
(51)
Total gross margin adjustments
17,403
18,849
4,458
18,494
18,415
Operating expense adjustments:
Stock-based compensation
17,046
18,363
16,733
15,326
17,444
Amortization of acquired intangibles
16,190
15,023
15,023
14,476
14,993
Legal fees associated with indemnification obligations and other
related costs, net
124
–
–
–
–
Loss on sale of subsidiary
–
–
–
12,756
–
Total operating expense adjustments
33,360
33,386
31,756
42,558
32,437
Total operating income adjustments
50,763
52,235
36,214
61,052
50,851
Original issue discount and debt issuance costs of debt related to lenders
that did not participate in the refinancing
–
–
25,465
–
–
Income tax effect of adjustments
(17,208)
(17,037)
(17,657)
22,018
(16,623)
Non-GAAP net income
60,473
61,277
45,959
78,746
92,812
3 |
 Q1
12 Q4 11
Q1 11
GAAP gross margin
61.5%
59.5%
58.8%
Non-GAAP gross margin
64.8%
62.9%
62.0%
GAAP product gross margin
63.2%
61.1%
61.1%
Non-GAAP product gross margin
66.6%
64.7%
64.6%
GAAP services gross margin
52.0%
51.1%
46.7%
Non-GAAP services gross margin
54.5%
53.4%
48.7%
GAAP operating margin
12.4%
9.9%
7.8%
Non-GAAP operating margin
21.5%
21.0%
17.1%
Additional Financial Information |
 Agenda
Dan Fairfax
CFO
Mike Klayko
CEO
4
Prepared comments followed by live Q&A call |
| Today’s prepared comments include remarks by Mike Klayko, Brocade CEO,
regarding the company’s quarterly results, its strategy,
and a review of operations, as well as industry trends and market/technology
drivers related to its business; and by Dan Fairfax, Brocade CFO, who
will provide a financial review. A management discussion and live
question-and-answer conference call will be webcast beginning at 2:30 p.m. Pacific Time on
February
21
at
www.brcd.com
and
will
be
archived
on
the
Brocade
Investor
Relations
website. |
 Fiscal 2012: Q1 Earnings
5
Mike Klayko, CEO |
| Prepared comments provided by Mike Klayko, CEO
|
 Q1 Executive Summary
* For non-GAAP results, please see GAAP reconciliation
6
•
$561M record revenue, up 2% Qtr./Qtr.
and 3% Yr./Yr.
•
64.8% non-GAAP gross margin
•
21.5% non-GAAP operating margin
•
$0.12 GAAP EPS
•
$0.20 non-GAAP EPS, up 22%
Qtr./Qtr.
and 61% Yr./Yr.
•
$127M operating cash flow and $70M
debt reduction in Q1
•
Record Storage product revenue of $353M,
up 17% Qtr./Qtr. and 7% Yr./Yr.
•
Record
Service Provider business revenue
of $64M
•
Ethernet product revenue of $123M,
down 22% Qtr./Qtr. and 2% Yr./Yr.
•
Non-GAAP
product margin improved
to 66.6%
•
Global Services non-GAAP gross margin
improved to 54.5%
OVERALL RESULTS
PRODUCT
AND SERVICES RESULTS
Includes non-GAAP results* |
| Q1 was a revenue record-setting quarter for Brocade. We continue
to see strong momentum across many areas of our business, which resulted
in Q1 revenue of $561M, an all-time high for Brocade. We also significantly increased profits, coming
in at $0.12 of EPS on a GAAP basis and $0.20 of EPS on a non-GAAP basis. We
improved both gross margin and operating margin in the quarter, exceeding
our FY12 target model for both measures, and generated strong operating cash flow.
Our Storage business, including product and services, was a clear highlight for
Q1 with revenue coming in at $406M, a company record in what is
seasonally a strong quarter. The Service Provider business also established a record with revenue at
$64M in part due to customers investing in network infrastructure to address
emerging opportunities such as cloud services. A third highlight was the
continued adoption of our Ethernet fabric solutions. In Q1 we have now surpassed 400 customers for
our Brocade VDX switches and also saw a higher attach rate for the VCS software
used to create an Ethernet fabric. The strength in these areas of the
business helped offset some of the softness in other areas of our Ethernet business. Our
Federal business was down sequentially, which we had anticipated
given the typical purchasing patterns we see in Q1.
Enterprise revenue was lower in Q1 primarily due to the continued build-out
of our two-tiered distribution channel, some transactions getting
pushed out of the quarter, in part due to the anticipation of our new Campus products, and special
discounting for a few large transactions in the quarter.
|
 Executing on FY12 Playbook
1.
Differentiate Through Innovation
2.
Grow Top Line Profitably
3.
Execute on 2011 Investments
4.
Increase Shareholder Value
5.
Be an Employer of Choice
7 |
| Much of the success we saw in Q1 is directly attributable to
our achievements in product innovation over the last few years. In fact,
innovation remains one of the strongest differentiators for Brocade in a
competitive networking field. Brocade remains committed to
out-innovating the rest of the networking industry through fundamental, game-changing products and solutions. We believe that
executing to this strategy will fuel Brocade’s growth for the next decade.
|
 Innovation as a Differentiator Today
8
Product Awards
Milestones
Adapters:
Adapters:
Brocade 1860
Brocade 1860
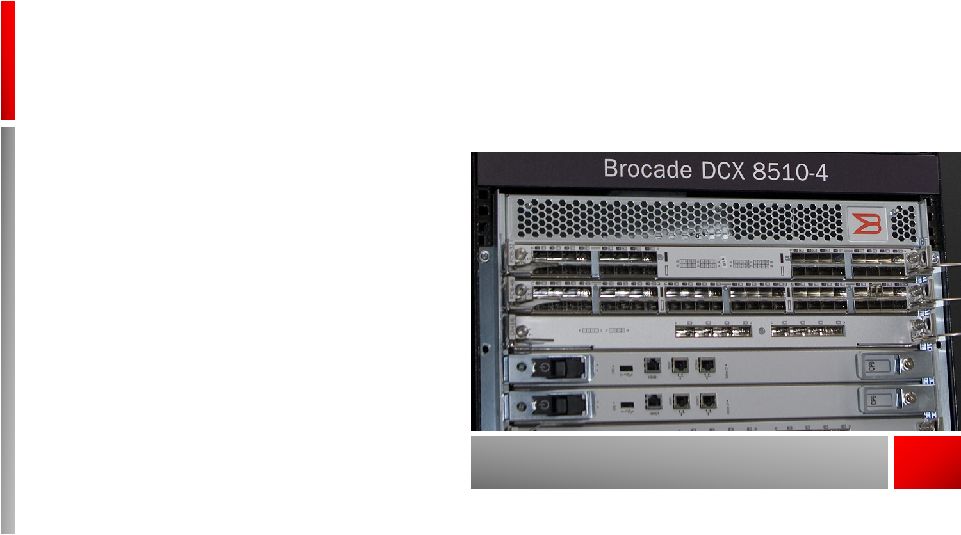
16 Gbps SAN:
16 Gbps SAN:
Brocade 6510
Brocade 6510
Ethernet Fabrics:
Ethernet Fabrics:
Brocade VCS and VDX
Brocade VCS and VDX
Brocade 100 GbE
Brocade 100 GbE
modules
modules
115
115
line cards
line cards
shipped
shipped
to-date
to-date
Recognized leadership in key technology transitions
|
| Product Awards
Milestones
Three recent examples of our innovation success are in the areas
of Ethernet fabrics, next-generation SAN technologies,
and 100 Gigabit Ethernet. In Q1 we received notable industry recognition and
achieved significant milestones, specifically:
•
Our pioneering efforts in building the Ethernet fabric category and introducing
solutions well ahead of the market garnered some significant industry
recognition in Q1. The editors at TechTarget named the Brocade VCS software as
the “Gold”
product of the year in the Virtualization category. They also named the
Brocade VDX 6720 as its “Silver” product of the year award
winner in the Computing Hardware category. •
Brocade’s decision to transition the SAN industry to the next phase based
on 16 gigabit-per-second (Gbps) Fibre Channel was well-timed
as validated by the Dell’Oro Group in Q1 who noted that: “Total SAN switch sales enjoyed a
record quarter—propelled by both new technologies and higher priced
products”. In addition, we received awards for our new 16 Gbps
Brocade 6510 Switch and our Brocade 1860 Fabric Adapter. •
In Q1 Brocade crossed a milestone in 100 Gigabit Ethernet (GbE) by shipping
over two hundred 100 GbE ports since the launch of our 2-port module
last year. Research organizations such as CERN along with large Service
Providers and very large enterprises are now taking active steps to
increase their network size to terabit scale and beyond. The Brocade 100
GbE module is a cost-effective solution to accelerate this migration for CERN and other customers. |
 9
MARCH 6, 2012
Join us for this virtual event.
THE EFFORTLESS NETWORK
™
EVENT
Brocade Campus LAN. Automated. Scalable. Affordable.
REGISTER ON BROCADE.COM |
 REGISTER ON BROCADE.COM
Brocade is now turning our attention to the next phase of our innovation agenda
by tackling some of the most pressing challenges and
opportunities faced by enterprise and service provider customers. We will unveil
part of this agenda at “The Effortless
Network” event on March 6 where we will introduce game-changing
solutions and technologies that will modernize the campus LAN environment for
the next decade. We believe that the campus LAN incumbents have failed to
innovate in any meaningful way in recent years. The result is that
today’s campus LANs are not designed optimally to tackle the next wave
of IT challenges such as enterprise mobility, video, and
virtualization. This is an opportunity for Brocade to significantly
differentiate ourselves through fundamental innovation that will deliver a
new level of simplicity, automation and value. |
 Innovation Agenda to be Unveiled
at Technology Day Summit
10
•
Ethernet Fabric Advancement
•
Software-defined networking
•
Networking “Big Data” |
| In early May, Brocade will host our annual Technology Day Summit,
where we will outline more innovations for both the Data Center and
Service Provider environments. This includes the next wave of our
Ethernet fabric capabilities as well as our solutions for
software-defined networking and Big Data opportunities. The message
is simple. The success we enjoyed in Q1 is a direct result of the investments we made in R&D over the last few
years in key technology segments. We are now ready with the next
phase of our innovation that will fuel future growth.
|
 •
Record revenue quarter
•
$353M in product revenue
•
17% growth Qtr./Qtr.
•
Continued fast ramp of 16 Gbps
Fibre Channel products
•
27% of Brocade Director sales in Q1
•
Survey data reinforces Brocade’s
Fibre Channel strategy
•
Customers plan to increase SAN
purchases over next 3 years
Q1 Storage Business Highlights
Strength across all product segments
11 |
| Now I’ll turn to updates from our key business segments starting
with the Storage business, which exceeded our expectations for revenue
this quarter. This performance helps to demonstrate that there is strong
customer demand for this technology due to major IT imperatives such as
managing server virtualization and digital data growth. Q1 was highlighted
by record revenue of $406M, up 12% Qtr./Qtr., for the total Storage
business, which includes products and services. In terms of product
revenue, we were up 17% sequentially, generating nearly $353M. We also saw the continued fast
ramp of our next-generation 16 Gbps products in Q1. In fact, 16 Gbps
products accounted for 27% of our total Director sales in the quarter.
There is no doubt that the transition in the SAN industry to 16 Gbps is underway and is being validated by strong
customer demand.
Our Q1 performance reinforced the results from our customer survey that showed
customers expect to increase their purchases of SANs over the next three
years. That research validated the fact that Fibre Channel is preferred among end users for mission-
critical applications, because it is a familiar, tried-and-true
technology. |
 •
Installed base of 400+
Brocade VDX customers
to-date
•
100+ new customers in Q1
•
Revenue up 33% Qtr./Qtr.
Q1 Ethernet Fabric Progress
12 |
| We are also making good progress in the Ethernet fabric business, a
market category that we helped pioneer with the introduction of our
VDX switches and VCS software. Sales of our VDX switches and VCS
software were up 33% sequentially and we now have an installed base
of more than 400 customers in high-performance, data-intensive
industries such as financial services, research networks, and media and
entertainment.
Our Ethernet fabric technology strategy is highly differentiated
as it is designed to allow our customers to scale over time, unlike the
all-or- nothing designs of some of our competitors. Therefore, we
expect many of our current customers to continue to build out their
Ethernet fabrics to keep pace with the growing demands on their data
center networks. |
 •
Record Service Provider
business revenue
•
Brocade MLX and MLXe revenue
up 17% Yr./Yr.
•
Brocade ADX revenue up 13% Yr./Yr.
•
Total Ethernet business revenue
of $154M
•
Federal business down Qtr./Qtr.
as expected
•
Long-term trends align to strength
of the Brocade portfolio
Q1 Ethernet Business Update
13 |
| Total Ethernet revenue, including products and services, was $154M in
the quarter. The highlight of our Ethernet business was the Service
Provider segment, which generated more than $64M in revenue, another company
record. We are seeing demand in part from these customers as they upgrade
their network infrastructure to enable the delivery of new services and
capabilities such as cloud computing. This trend helped increase sales of
key products that are optimized for the Service Provider market including the Brocade MLX and MLXe
routers, which saw revenue growth of 17% Yr./Yr., and the Brocade ADX
application delivery switches, with 13% growth in revenue Yr./Yr. The
strength we saw in Service Provider helped offset some expected softness in other areas of the Ethernet business. For example, we
saw lower Federal Ethernet revenue in our seasonally slower Q1. We also saw a
decline in our Enterprise Ethernet revenue in the quarter. Some
transactions got pushed out of the quarter as we transition to “The
Effortless Network” portfolio. As we mentioned at Analyst Day, we
continue to focus our direct sales force towards large transactions for
Service Provider and Enterprise accounts while we move smaller accounts
to the channel. We saw this strategy working with the record Service Provider revenue in the quarter, but need to continue to
drive more growth through the channel. In addition, we had some special
discounting for a few large transactions in the quarter. On a
forward-looking basis, there are some key industry trends in the Ethernet market that align favorably to our strengths in this business.
For example, the Dell’Oro Group recently issued a report saying 10 Gigabit
Ethernet will be the top-selling Ethernet switch technology by 2016
and the forecast for 100 GbE revenue has that technology growing by triple-digit percentages for the next five years. I believe these
trends have positive implications for Brocade’s long-term Ethernet
business growth as more emphasis is placed on providing high-
performance, ultra-reliable solutions for demanding Enterprise, Data
Center, and Service Provider networks. |
 •
All-time high revenue quarter
•
Record Storage quarter and continued
fast ramp of 16 Gbps products
•
Delivering on Playbook strategy of
“Innovation as a Differentiator”
•
Diversity of business portfolio and balance
across segments drove strong performance
Q1 Summary
Executing to our long-term strategy
14 |
| In summary, Q1 was a record quarter in many regards and built
on the momentum from last quarter. We exceeded both revenue and
profitability in Q1 versus our outlook. It is clear that we are executing well
on our Playbook strategy of using “innovation as a differentiator”
and it is reflected in Q1’s strong performance.
We are excited about the next phase of our innovation roadmap that will fuel
future growth and I look forward to sharing more information with you at
The Effortless Network and Technology Day Summit events. Thank you. |
 Q1 FY 2012 Financials
Dan Fairfax, CFO
15 |
| Prepared comments provided by Dan Fairfax, CFO
|
 Key Financial Metrics
* Non-GAAP, please see GAAP reconciliation
16
Q1 11
Q2 11
Q3 11
Q4 11
Q1 12
Q1 12
Qtr./Qtr.
Q1 12
Yr./Yr.
Revenue
$546M
$548M
$503M
$550M
$561M
+2%
+3%
Storage product revenue
$331M
$329M
$275M
$303M
$353M
+17%
+7%
Ethernet product revenue
$126M
$129M
$139M
$158M
$123M
-22%
-2%
Global Services revenue
$89M
$91M
$89M
$89M
$84M
-6%
-5%
Non-GAAP gross margin*
62.0%
63.4%
61.8%
62.9%
64.8%
+1.9 pts
+2.8 pts
Non-GAAP operating margin*
17.1%
17.9%
14.0%
21.0%
21.5%
+0.5 pts
+4.4 pts
GAAP EPS—diluted
$0.05
$0.05
$0.00
-$0.01
$0.12
+$0.13
+$0.07
Non-GAAP EPS—diluted*
$0.12
$0.12
$0.09
$0.16
$0.20
+$0.04
+$0.08
Operating cash flow
$118M
$114M
$11M
$206M
$127M
-38%
+8%
Net debt
$503M
$394M
$374M
$382M
$241M
-37%
-52% |
| In Q1 12, Brocade generated record revenue of $561M, which was up 2%
Qtr./Qtr. and up 3% compared to Q1 11 results. Storage product revenue
grew 17% Qtr./Qtr. and 7% Yr./Yr. driven by good growth across all Storage product segments and continued ramp of our recently
introduced 16 Gbps products. Storage product revenue represented 63% of total
revenue in the first quarter, higher than the 61% reported in Q1 11 and
55% in Q4 11.
Q1 Ethernet product revenue was down 22% Qtr./Qtr. and slightly lower Yr./Yr.
The expected seasonally lower Federal revenue and lower Enterprise
revenue were offset in part by the strong growth in Service Provider revenue. Ethernet product revenue in Q1 represented 22% of
total revenue, down slightly from 23% in Q1 11 and down from 29% in Q4 when our
Ethernet revenue is seasonally stronger. Global Services revenue was $84M in Q1, down 6% Qtr./Qtr. and down 5% Yr./Yr.,
primarily driven by lower professional services revenue as a result of
the sale of our SBS consulting business at the end of Q4 11. The SBS business had previously contributed approximately $5M of
revenue per quarter. Our Global Services revenue represented approximately 15%
of total Q1 revenue, down slightly from Q1 11 and Q4 11.
Non-GAAP gross margin was 64.8% in Q1, better than the guidance we
provided; up 190 basis points from Q4 11 and up 280 basis points fro Q1
11. The higher-than-expected gross margin was driven by higher revenue and a favorable product mix due to the increase of Storage
revenue in the quarter. Non-GAAP operating margin was 21.5% in Q1, an
improvement of 50 basis points sequentially and above our outlook of 17%
to 19% that we provided for the quarter.
GAAP EPS on a diluted basis was $0.12 and non-GAAP EPS was $0.20 for the
quarter. In Q1 the effective GAAP tax benefit was (5.8)% and the
effective non-GAAP tax rate was 12.6%. The lower-than-expected
non-GAAP tax rate was driven by the resolution of both Federal and State tax
audits in the quarter which resulted in the favorable tax rate. Excluding the
benefit of the lower tax rate from the results of these audits, non-
GAAP EPS would have been $0.17 in Q1, higher than our guidance of $0.12 to
$0.14 for the quarter.
During Q1 we generated $127M in operating cash flow and paid down $70M on our
term loan, $62M more than the required principal payment. Net debt was
$241M exiting Q1 12, down from $382M at the end of fiscal 2011. Weighted average diluted shares outstanding were
469M in Q1, down 17M from Q4, and now reflect the full benefit of the
repurchase of 46.5M shares in Q4 11. |
 Total Storage Business Revenue
17
$392.5
$389.4
$334.3
$361.3
$392.5
$389.4
$334.3
$361.3
Product and Global Services Split
Revenue Segment Split
$406.4
$406.4
Record Storage business revenue in Q1 2012
$330.9
$328.8
$275.4
$302.9
$352.9
$61.6
$60.6
$58.9
$58.4
$53.5
Q1 11
Q2 11
Q3 11
Q4 11
Q1 12
$144.3
$136.5
$115.4
$127.9
$144.6
$138.5
$143.9
$115.8
$127.6
$155.5
$48.1
$48.4
$44.2
$47.4
$52.9
$61.6
$60.6
$58.9
$58.4
$53.5
Q1 11
Q2 11
Q3 11
Q4 11
Q1 12
Global
Services
Products
Global
Services
Server
Switch
Director |
| Turning your attention to our Storage business, including hardware
and Storage-based support and services, Q1 revenue was a record
$406.4M, up 12% sequentially and up 4% from Q1 11.
Demand for Storage products was higher than expected in our seasonally strong
Q1. This resulted in record Storage product revenue of $352.9M in the
quarter, up 17% sequentially and up 7% Yr./Yr. We experienced good
revenue growth across our Director, Switch, and Server product segments
in Q1, led by Switch segment growth of 22% Qtr./Qtr. Demand for our 16 Gbps portfolio of products continues to
track very well with approximately 27% of our Director revenue and
approximately 17% of Director and Switch revenue coming from our new 16
Gbps products. Our Server product group, including embedded switches and
server adapter products (HBAs and Mezzanine Cards), posted revenue of
$52.9M, up 12% from Q4 and up 10% Yr./Yr. Embedded switch revenue was up
10% Yr./Yr. while our server adapter product revenue was up 5%
Yr./Yr. |
 Total Ethernet Business Revenue
$153.2
$158.9
$168.5
$189.2
Record Service Provider revenue offset by lower Enterprise revenue
$153.2
$158.9
$168.5
$189.2
Customer Segment Split
18
$154.3
$154.3
Product and Global Services Split
$126.1
$128.7
$138.9
$158.1
$123.4
$27.1
$30.2
$29.6
$31.1
$30.8
Q1 11
Q2 11
Q3 11
Q4 11
Q1 12
Global
Services
Products
$93.5
$97.9
$90.6
$108.1
$69.2
$39.3
$42.5
$53.4
$47.2
$64.5
$20.4
$18.5
$24.5
$33.9
$20.5
Q1 11
Q2 11
Q3 11
Q4 11
Q1 12
Federal
Service
Provider
Enterprise |
| Moving on to our Ethernet business, including hardware and
Ethernet-based support and services, Q1 revenue was $154.3M, up 1% Yr./Yr.
and down 18% from our seasonally strong Q4.
Looking at the individual product families, the Brocade MLX and MLXe router
revenue was up 17% Yr./Yr., the Brocade ADX Layer 4–7 product
revenue was up 13% Yr./Yr. while the Brocade FCX stackable switch revenue was down 16% Yr./Yr.
As we drill down into the Ethernet business details for Q1, we saw excellent
growth in the Service Provider segment achieving $64.5M in revenue, a
new record for the company. We continued to make progress in expanding our customer base as well increasing our share
in
some of the larger Service Providers customers. The Enterprise business was
lower year-over-year driven by softness in Americas specifically
and due to our continued build-out of our two-tiered distribution channel. Some deals were pushed out of the quarter and we
believe some customers may be postponing purchases in anticipation of our new
Campus LAN products coming out later this year. As expected, our Federal
Ethernet business was lower sequentially and generated $20.5M in revenue and was essentially flat compared
to
Q1 11.
From a geographic viewpoint, EMEA and Japan were both higher
year-over-year, with Americas, excluding Federal, relatively flat while APAC
was down year-over-year.
We continued to see good progress with Ethernet fabric-enabled Brocade VDX
product revenue, which grew 33% sequentially to more than
$7M in Q1. We now have over 400 VDX customers and also saw strong attach rates
of the VCS software enabling Ethernet fabrics in the quarter. We believe
we are in a leading competitive position and expect these products, as
well as additional product releases, to drive more meaningful growth for
us in the future. |
 Revenue: Routes to Market,
10% Customers, Geographic Splits
Routes to Market
Geographic Split
19
47%
53%
43%
41%
48%
19%
11%
18%
21%
21%
34%
36%
39%
38%
31%
Q1 11
Q2 11
Q3 11
Q4 11
Q1 12
Channel/Direct
Other OEM
10% Customers
41%
38%
39%
38%
39%
59%
62%
61%
62%
61%
Q1 11
Q2 11
Q3 11
Q4 11
Q1 12
Domestic
International |
| In Q1, Brocade had three customers (EMC, HP, and IBM) that each
contributed revenue of at least 10% of the total company revenue. These
three customers contributed 48% of revenue in Q1, up from 41% in Q4 and up slightly from 47% in Q1 11 when we had the same
three 10% customers. Other OEMs represented 21% of revenue in Q1, no change from
Q4 11 and up from 19% in Q1 11. Channel and Direct were 31% of revenue in
Q1, a decrease from 38% in Q4 and 34% in Q1 11, driven by the shift of more Storage revenue which is
predominately shipped to OEM partners.
The mix of business based on ship-to location was 61% domestic and 39%
international in the quarter, reflecting a slight shift in mix to
international revenue from Q4. In Q1 11 the revenue mix was 59% domestic and
41% international. |
 Revenue and Non-GAAP Gross Margin*
* Non-GAAP, please see GAAP reconciliation
Revenue Split by Product/Services
20
Non-GAAP Gross Margin*by Product/Services
$546
$548
$503
$550
$561
$457
$457
$414
$461
$477
$89
$91
$89
$89
$84
Q1 11
Q2 11
Q3 11
Q4 11
Q1 12
Global
Services
Product
Q1 11
Q2 11
Q3 11
Q4 11
Q1 12
62.0%
64.6%
48.7%
63.4%
66.2%
49.0%
61.8%
62.9%
64.8%
64.5%
64.7%
66.6%
49.5%
53.4%
54.5%
Total
Product
Global Services |
| Q1 non-GAAP Company gross margin of 64.8% was above the range of
62.0% to 63.0% provided for the quarter. Gross margin improved 190 basis
points quarter-over-quarter driven by a more favorable product mix to Storage, improvements in Global Services gross margin
from the sale of SBS, and growth in overall revenue in the quarter. Gross margin
was higher by 280 basis points Yr./Yr. on improved product and services
margins, more favorable product mix and higher overall revenue. Q1
product non-GAAP gross margin was 66.6%, above our 63% to 66% target range, and up from 64.7% in Q4 11 and 64.6% in Q1 11
driven by overall product mix and improving margin for Storage products. Q1
Storage non-GAAP gross margin was in the mid-70’s, higher
compared to both Q1 11 and Q4 11 driven by revenue growth and a favorable
product mix to Directors and other higher price per port products. Q1
Ethernet non-GAAP gross margin was in the mid-40’s, lower than Q1 11 and Q4 11, driven by increased overhead costs on
lower revenue and increased competitive pricing pressure in certain large
deals. Global Services non-GAAP gross margin was 54.5% in Q1, an
improvement of 110 basis points compared to the 53.4% reported in Q4 11
and up significantly compared to the 48.7% reported in Q1 11 driven primarily
from the sale of SBS. Global Services gross margin in the
quarter was slightly above our target model of 51% to 54%.
|
 Operating Performance vs. Target Model (FY 12)
*
Non-GAAP, please see GAAP reconciliation
Non-GAAP Gross Margin*
Non-GAAP Operating Expenses*
as a Percentage of Revenues
21
FY 12 target model: 44–46%
FY 12 target model: 61–63%
FY 12 target model: 16–18%
Outperformed target model in all areas
Non-GAAP Operating Margin*
62.0%
63.4%
61.8%
62.9%
64.8%
Q1 11
Q2 11
Q3 11
Q4 11
Q1 12
44.9%
45.4%
47.8%
41.8%
43.3%
Q1 11
Q2 11
Q3 11
Q4 11
Q1 12
17.1%
17.9%
14.0%
21.0%
21.5%
Q1 11
Q2 11
Q3 11
Q4 11
Q1 12 |
| Non-GAAP gross margins were 64.8% for Q1, which was above our
target model range of 61% to 63% for FY12 and up
significantly compared to 62.0% reported in Q1 11 and 62.9% reported in Q4 11,
due to a favorable shift in product mix and increased volume.
On a non-GAAP basis, total operating expenses were 43.3% of revenues in Q1,
better than our target model of 44% to 46% for FY12 and better compared
to 44.9% reported in Q1 11. Operating expenses on a dollar basis increased from Q4 11 driven by
our annual employee cost of living increases, new FY12 variable compensation
plans, as well as a return of more normalized spending patterns in Q1.
As you may recall, last year we implemented various cost-cutting actions in response to the uncertain
macro-economic environment which resulted in lower operating expenses in Q3
and Q4. Total operating expenses were slightly lower on a
year-over-year basis. Q1 ending headcount of 4,542 was relatively flat from the prior quarter.
Non-GAAP operating margins were 21.5% in Q1, up 50 basis points Qtr./Qtr.
and up 440 basis points compared to Q1 11. The higher operating margins,
compared to our expected range of 17% to 19% for the quarter, were primarily driven by higher-than-
expected revenue and higher gross margins. |
 Balance Sheet and Cash Flow Highlights
As of January 28, 2012
* Adjusted EBITDA is as defined in the term debt credit agreement
Q1 11
Q2 11
Q3 11
Q4 11
Q1 12
Q1 12
Qtr./Qtr.
Q1 12
Yr./Yr.
Cash from operations
$118M
$114M
$11M
$206M
$127M
-38%
+8%
Capital expenditures
$23M
$27M
$26M
$20M
$18M
-10%
-22%
Free cash flow
$95M
$87M
($15M)
$186M
$109M
-41%
+15%
Debt payments
$40M
$59M
$12M
$50M
$70M
+40%
+75%
Cash, equivalents, and
short-term investments
$416M
$466M
$473M
$415M
$485M
+17%
+17%
Senior secured debt
$919M
$860M
$847M
$797M
$726M
-9%
-21%
Adjusted EBITDA*
$114M
$121M
$91M
$138M
$140M
+1%
+23%
Stock repurchase
$0
$0
$10M
$201M
$0
–
–
Senior secured leverage ratio
2.01x
1.86x
1.87x
1.72x
1.48x
-14%
-26%
Covenant
2.5x
2.5x
2.5x
2.5x
2.25x
–
–
Fixed charge coverage ratio
1.79x
2.26x
2.29x
2.63x
3.05x
+16%
+70%
Covenant
1.5x
1.5x
1.5x
1.5x
1.75x
–
–
22 |
| Cash generated from operations was $127M in Q1. We continued to see
good shipment linearity in the quarter which resulted in DSOs of 36 days.
Total capital expenditures in the quarter were $18M, slightly lower than $20M in our Q4 11.
Cash, equivalents, and short-term investments were $485M, up $70M from Q4 11
and up $69M from Q1 11. With the
$70M principal reduction of our term loan in Q1, our remaining term loan
principal is $120M exiting the quarter. We have $178M remaining of our
Board-authorized stock repurchase program, and with the steady and accelerated reduction of the
term loan, we plan to be more active with our share repurchases.
Adjusted EBITDA in the quarter was $140M, which was slightly higher than Q4 11
and up $26M Yr./Yr. The Senior Secured Leverage Ratio was 1.48x and the
Fixed Charge Coverage Ratio was 3.05x. Both ratios have improved
significantly over the past year and have significant headroom to the
covenant requirements of our term credit agreement. |
 Strong Cash Flow: Reducing Debt
and Shares Outstanding
* Share repurchase in quarter
23
Term Loan Balance ($M)
Strong Operating Cash Flow ($M)
S&P Credit Rating Upgrade
Average Diluted Shares Outstanding (M)
$118
$114
$11
$206
$127
Q1 11
Q2 11
Q3 11
Q4 11
Q1 12
$311
$252
$240
$190
$120
Q1 11
Q2 11
Q3 11
Q4 11
Q1 12
491
502
510
486
469
Q1 11
Q2 11
Q3 11*
Q4 11*
Q1 12 |
| I am very pleased with the financial discipline and focus that we
have at Brocade. Our cash flow from operations continues to be very
strong, which has helped us to reduce our term loan by more than $190M over the past four quarters. Along with
that we have repurchased more than 48M shares over the past three
quarters. In Q1, Standard & Poor’s recognized the stability of
our business and the improvements we have made in our financial profile
and upgraded Brocade’s credit rating as well as our bond debt rating. |
 Q2 2012 Planning Assumptions and Outlook
IT market conditions
•
Uncertainty around macro economic conditions
•
IT spending is growing
•
Certain customer segments growing slower
than others
Brocade business
•
Expect Storage TAM to be near high end of
annual growth rate of 2 to 5%
Other P&L items
•
Structure tax rate will be 27% to 29% for the
rest of FY12
•
Continue share repurchases
OEM inventories
•
Expected range of one to two weeks of supply
* Non-GAAP, please see GAAP reconciliation
Financial Outlook
Q2 2012
Revenue range
$530M–$545M
Non-GAAP gross margin*
62.0%–63.0%
Non-GAAP operating expenses*
46.0%–46.5%
Non-GAAP operating margin*
15.5%–17.0%
Other income/other expense
~($13M)
Non-GAAP tax rate*
27%–29%
Fully diluted shares outstanding
475M–480M
Non-GAAP EPS*
$0.11–$0.12
Operating cash flow
$90M–$100M
Capital expenditures
$20M–$23M
Free cash flow
$67M–$80M
24 |
| Looking forward to Q2 12, we contemplated the following in setting
our outlook: •
The current macro environment and economy continue to show uncertainty,
especially within the Eurozone countries. •
IT spending is growing but certain customer segments may see slower growth than
others. •
We continued to see good demand for our Storage products in Q1. We plan our
Storage business around expected long- term industry growth rates of
2 to 5% per year and expect the growth rate for FY12 to be towards the higher end of that
range.
•
We expect to see some small increases in operating expense dollars driven
primarily by higher engineering and prototype spending, launch costs for
new product offerings, and normal seasonal spending increases in our fiscal Q2.
•
Exiting Q1, OEM inventory was a little more than one week based on Storage
business revenue and we expect OEMs to hold between one week and two
weeks of inventory going forward. OEM inventory levels have and may change due to
seasonally stronger and weaker quarters of the year as well as product
transitions. •
From a tax rate perspective, we are planning at a structural rate of 27% to 29%
non-GAAP for the rest of the year. Discrete events, like what we
experienced in Q1, can impact our tax rate from time to time. However we do not provide guidance on
such events due to the inherent uncertainty of their timing.
•
And finally, we plan to continue our share repurchases.
That concludes Brocade’s prepared comments.
Thank you for your interest in Brocade. |
 Prepared Comments and Live Conference Call
February 21, 2012, 2:30pm
Jason Nolet
VP of Data Center
and Enterprise
Networking
Dan Fairfax
CFO
John McHugh
CMO & VP of
Marketing
Ian Whiting
SVP of WW Sales
Mike Klayko
CEO
Dave Stevens
CTO & VP of
Corporate
Development
25 |
| Prepared comments provided by Rob Eggers, Investor Relations
That concludes Brocade’s prepared comments. At 2:30 p.m. Pacific Time on
February 21 Brocade will host a webcast conference call at
www.brcd.com.
Thank you for your interest in Brocade. |
 Appendix and Reconciliations
26 |
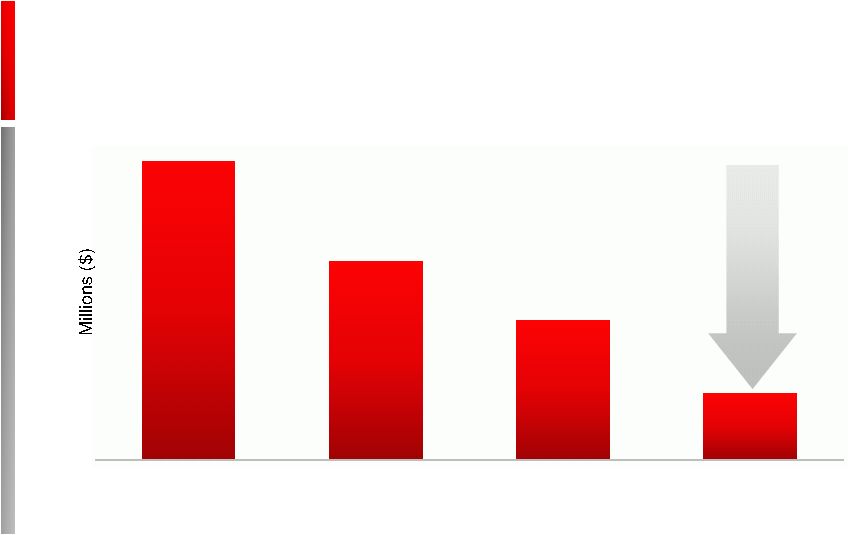 Net Debt: Defined as Total Debt Less Total Cash
Decreased by over $830M from Q1 09 to Q1 12
Nearly
80%
reduction in 3 years
27
$1,073
$713
$503
$241
Q1 09
Q1 10
Q1 11
Q1 12 |
 Q1 Cash and Debt Metrics
*
Adjusted EBITDA is as defined in the term debt credit agreement
** Cash, equivalents and short-term investments
Adjusted EBITDA* Performance
(In Millions)
Reducing Debt Position
(In Millions)
Within Debt Covenant
Cash Balance**
(In Millions)
28
$114
$121
$91
$138
$140
$458
$463
$452
$464
$490
Q1 11
Q2 11
Q3 11
Q4 11
Q1 12
Quarter
Trailing
12
Months
2.01
1.86
1.87
1.72
1.48
2.50
2.50
2.50
2.50
2.25
Q1 11
Q2 11
Q3 11
Q4 11
Q1 12
Senior
Debt
Leverage
Ratio
Covenant
$919
$860
$847
$797
$726
$311
$252
$240
$190
$120
Q1 11
Q2 11
Q3 11
Q4 11
Q1 12
Total Secured Debt
Term Debt
$416
$466
$473
$415
$485
Q1 11
Q2 11
Q3 11
Q4 11
Q1 12
Ending Cash Balance |
 Adjusted EBITDA and Sr. Secured Leverage Ratio
As defined in the term credit agreement
Consolidated Senior Secured Leverage Ratio
Q1 FY 11
Q2 FY 11
Q3 FY 11
Q4 FY 11
Q1 FY 12
$ Thousand
Actual
Actual
Actual
Actual
Actual
Consolidated Net Income (Loss)
$26,918
$26,079
$1,937
($4,324)
$58,584
plus
(i) Consolidated Interest Charges
$21,546
$20,745
$42,066
$13,483
$13,047
(ii) Provision for Federal, state, local and foreign income taxes payable
$0
$0
$0
$45,446
$0
(iii) Depreciation and amortization expense
$52,522
$51,712
$51,220
$50,898
$50,105
(iv) Fees, costs and expenses incurred on or prior to the Acquisition Closing
Date in connection with the Acquisition and the financing thereof
$0
$0
$0
$0
$0
(v) Any cash restructuring charges and integration costs in connection with the
Acquisition, in an aggregate amount not to exceed $75,000,000
$0
$0
$0
$0
$0
(vi) Non-cash restructuring charges incurred in connection with the
Transaction, all as approved by Arrangers
$848
$779
$687
$580
$483
(vii) Other non-recurring expenses reducing such Consolidated Net Income
which do not represent a cash item in such period or any future period
(in each case of or by the Borrower and its Subsidiaries for such
Measurement Period) $175
$1,735
$136
$13,035
$0
(viii) Any non-cash charges for stock compensation expense in compliance
with FAS 123R and amortization
of
the
fair
value
of
unvested
options
under
the
Acquired
Business’
employee
stock
option
plan assumed by the Borrower
$19,906
$22,530
$20,969
$19,670
$21,819
(ix)
Legal fees and expenses relating to the Borrower’s indemnification
obligations for the benefit of its former officers and directors in
connection with its historical stock option litigation $15
$0
$0
$0
$0
Minus
(i)
Federal, state, local and foreign income tax credits
$5,717
$612
$10,300
$0
$3,207
(ii)
All non-cash items increasing Consolidated Net Income (in each case of or
by the Borrower and its Subsidiaries for such Measurement Period)
$1,995
$1,992
$15,408
$1,024
$840
Consolidated EBITDA
$114,218
$120,976
$91,307
$137,764
$139,991
4 Quarter Trailing Consolidated EBITDA
$458,465
$463,371
$452,483
$464,266
$490,038
Consolidated Senior Secured Debt
$919,312
$859,983
$847,031
$796,782
$726,325
Consolidated Senior Secured Leverage Ratio (x)
2.01
1.86
1.87
1.72
1.48
29 |
 Segment Revenue Detail
Product segment breakdown
30
Q1 11
Q2 11
Q3 11
Q4 11
Q1 12
SAN Product Breakdown
Directors
44%
41%
42%
42%
41%
Switches
42%
44%
42%
42%
44%
Server
15%
15%
16%
16%
15%
Ethernet Product Breakdown
Chassis
58%
57%
52%
50%
57%
Stackables
42%
43%
48%
50%
43% |
 Thank You
www.brcd.com
31 |