Attached files
| file | filename |
|---|---|
| 8-K - 8-K - RED ROBIN GOURMET BURGERS INC | a12-5206_18k.htm |
| EX-99.1 - EX-99.1 - RED ROBIN GOURMET BURGERS INC | a12-5206_1ex99d1.htm |
Exhibit 99.2
|
|
FISCAL Q411 RESULTS February 16, 2012 1 |
|
|
Forward-Looking Statements 2 Forward-looking statements in this presentation regarding our expected earnings per share and restaurant sales, new restaurant growth, and all statements that are not historical facts, including without limitation statements concerning our future economic performance, plans or objectives, are made under the Safe Harbor provisions of the Private Securities Litigation Reform Act of 1995. Any forward-looking statements speak only as of the date on which such statements are made, and we undertake no obligation to update such statements to reflect events or circumstances arising after such date. Without limiting the generality of the foregoing, words such as “will,” “expect,” “believe,” “anticipate,” “intend,” “estimate,” or “continue” or the negative or other variations thereof or comparable terminology are intended to identify forward-looking statements. These statements are based on assumptions believed by the Company to be reasonable. We caution investors not to place undue reliance on any such forward-looking statements. Forward-looking statements, by their nature, involve risks and uncertainties that could cause actual results to differ materially from those described in the statements. These risks, described in the Company’s Form 10-K, Form 10-Q and Form 8-K reports (including all amendments to those reports) include but are not limited to the following: the ability to continue the strategies and achieve anticipated revenue and cost savings from Project RED and other initiatives; the uncertain general economic conditions; high levels of unemployment and uncertain consumer confidence; the effectiveness of Company marketing strategies, loyalty program and guest count initiatives; competition in the casual dining market and discounting by competitors; changes in commodity prices; the cost and availability of key food products, labor and energy; availability of capital or credit facility or other debt resources or cash flows to fund operations, growth opportunities and repurchases of the Company’s common stock; the ability to fulfill planned expansion, including in both new and existing markets; the concentration of the Company’s restaurants in the Western United States and the associated disproportionate impact of macroeconomic factors; risks related to doing business with franchisees; health concerns about the Company’s food products and preparation; the Company’s ability to protect its intellectual property and proprietary information; federal, state and local regulation of our business including healthcare reform, labor and insurance costs; and other risk factors described from time to time in the Company’s filings with the U.S. Securities and Exchange Commission. This presentation may also contain non-GAAP financial information. Management uses this information in its internal analysis of results and believes that this information may be informative to investors in gauging the quality of our financial performance, identifying trends in our results and providing meaningful period-to-period comparisons. For a reconciliation of non-GAAP measures presented in this document, see the accompanying supplemental information posted to the investor relations section of our website at www.redrobin.com.” |
|
|
Q411 Headlines Higher sales, net income, and earnings per share Increased company-owned restaurant gross sales Significant cost savings – ahead of schedule Opened 13 new company-owned restaurants in 2011, including first Red Robin’s Burger Works™ Delivered on 2011 business objectives 3 |
|
|
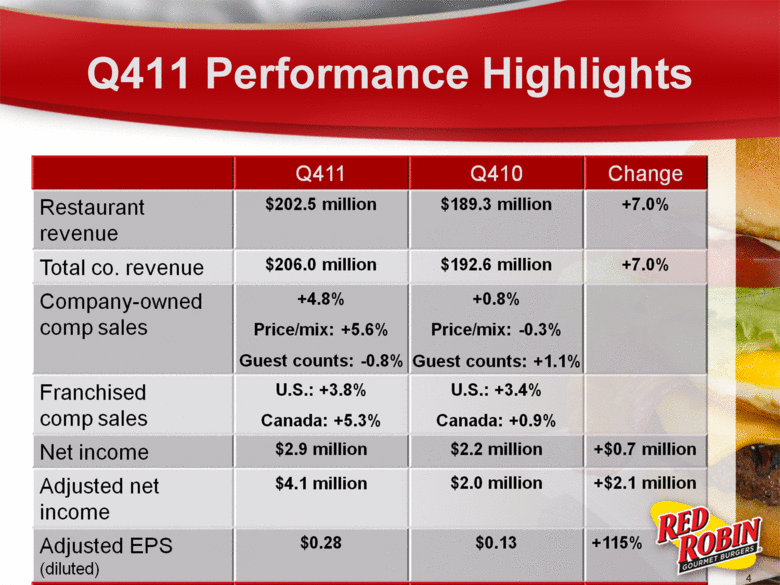
Q411 Performance Highlights 4 Q411 Q410 Change Restaurant revenue $202.5 million $189.3 million +7.0% T t l $206 0 illi $192 6 illi +7 0% Total co. revenue 206.0 million 192.6 million 7.0% Company-owned comp sales +4.8% +0.8% Price/mix: +5.6% Guest counts: -0.8% Price/mix: -0.3% Guest counts: +1.1% Franchised comp sales U.S.: +3.8% Canada: +5.3% U.S.: +3.4% Canada: +0.9% Net income $ 2.9 million $ 2.2 million +$0.7 million 9 o o $0 o Adjusted net income $4.1 million $2.0 million +$2.1 million Adjusted EPS (diluted) $0.28 $0.13 +115%
|
|
|
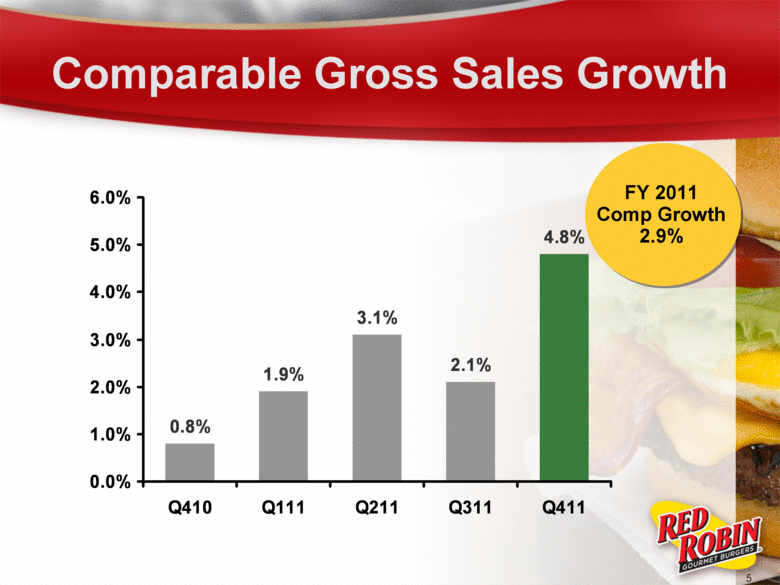
Comparable Gross Sales Growth 5 FY 2011 Comp Growth 2.9% 0.8% 1.9% 3.1% 2.1% 4.8% 0.0% 1.0% 2.0% 3.0% 4.0% 5.0% 6.0% Q410 Q111 Q211 Q311 Q411 |
|
|
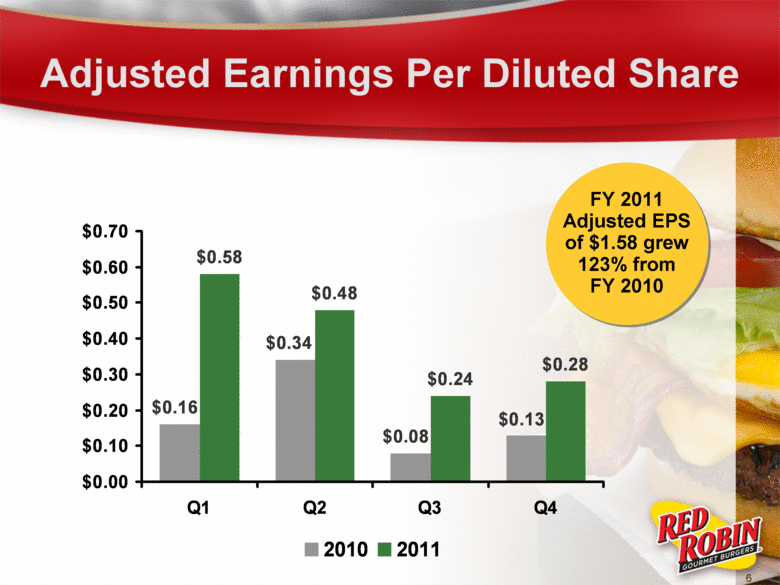
Adjusted Earnings Per Diluted Share 6 FY 2011 Adjusted EPS of $1.58 grew 123% from FY 2010 $0.58 $0.48 $0.24 $0.28 $0.13 $0.08 $0.34 $0.16 $0.00 $0.10 $0.20 $0.30 $0.40 $0.50 $0.60 $0.70 Q1 Q2 Q3 Q4 2010 2011 |
|
|
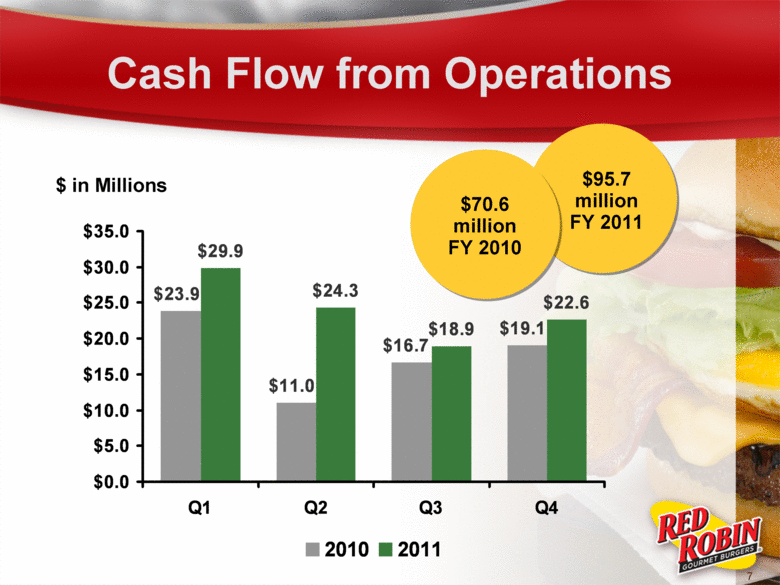
Cash Flow from Operations 7 $ in Millions $95.7 million FY 2011 $70.6 million FY 2010 $29.9 $24.3 $18.9 $22.6 $19.1 $16.7 $11.0 $23.9 $0.0 $5.0 $10.0 $15.0 $20.0 $25.0 $30.0 $35.0 Q1 Q2 Q3 Q4 2010 2011 |
|
|
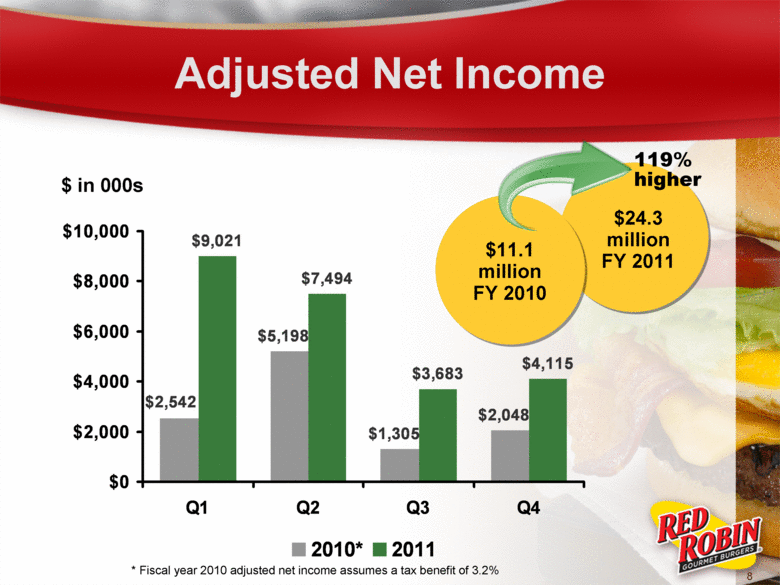
Adjusted Net Income 8 $24.3 million FY 2011 $11.1 million FY 2010 119% higher $ in 000s * Fiscal year 2010 adjusted net income assumes a tax benefit of 3.2% $9,021 $7,494 $3,683 $4,115 $2,048 $1,305 $5,198 $2,542 $0 $2,000 $4,000 $6,000 $8,000 $10,000 Q1 Q2 Q3 Q4 2010* 2011 |
|
|
2011 Objectives 9 |
|
|
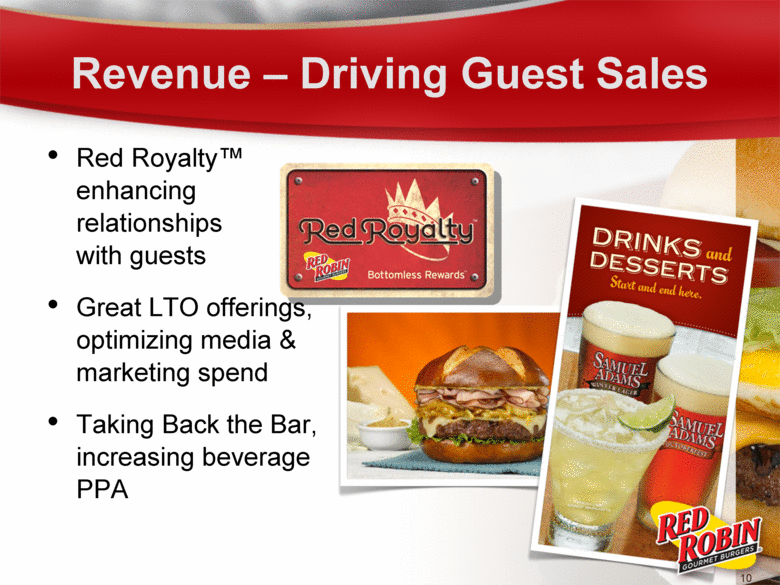
Revenue – Driving Guest Sales Red Royalty™ enhancing relationships with guests Great LTO offerings, optimizing media & marketing spend Taking Back the Bar, increasing beverage PPA 10 |
|
|
Expense Management Reduction in operating costs are being realized quicker than planned In 2011, captured nearly two-thirds of $16-$18 million in targeted savings 11 |
|
|
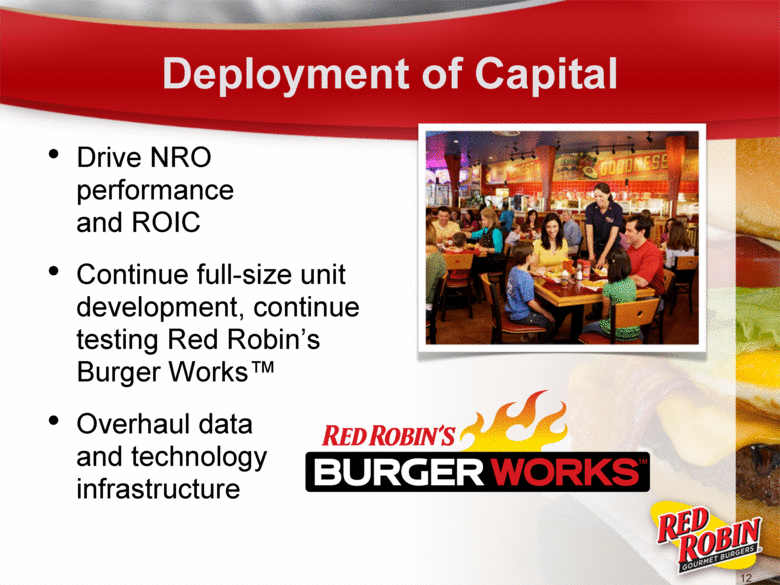
Deployment of Capital Drive NRO performance and ROIC Continue full-size unit development, continue testing Red Robin’s Burger Works™ Overhaul data and technology infrastructure 12 |
|
|
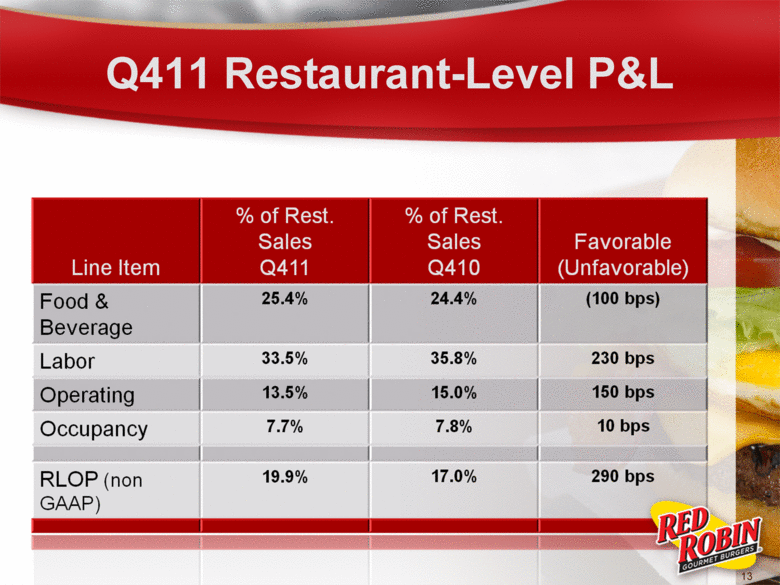
Q411 Restaurant-Level P&L 13 Line Item % of Rest. Sales Q411 % of Rest. Sales Q410 Favorable (Unfavorable) Food & Beverage 25.4% 24.4% (100 bps) Labor Operating 33.5% 35.8% 230 bps 13 5% 15 0% 150 bps Occupancy 7.7% 7.8% 10 bps RLOP (non GAAP) 19.9% 17.0% 290 bps |
|
|
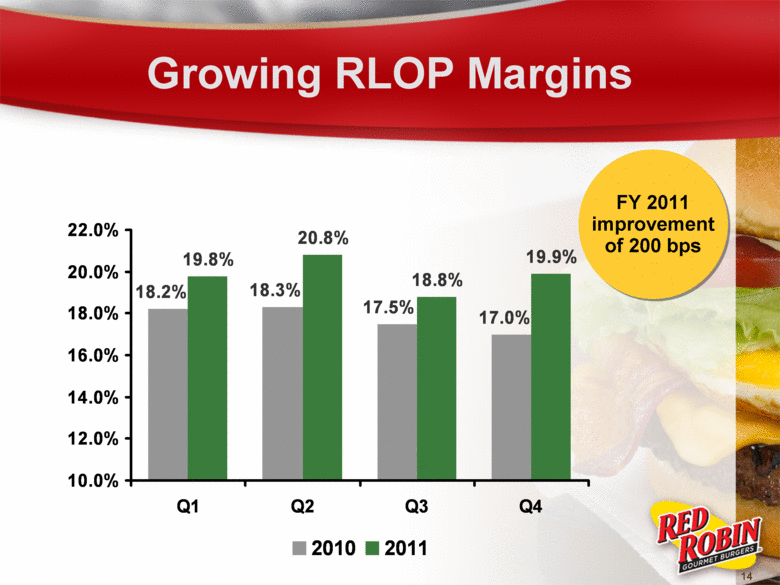
Growing RLOP Margins 14 FY 2011 improvement of 200 bps 19.8% 20.8% 18.8% 19.9% 17.0% 17.5% 18.3% 18.2% 10.0% 12.0% 14.0% 16.0% 18.0% 20.0% 22.0% Q1 Q2 Q3 Q4 2010 2011 |
|
|
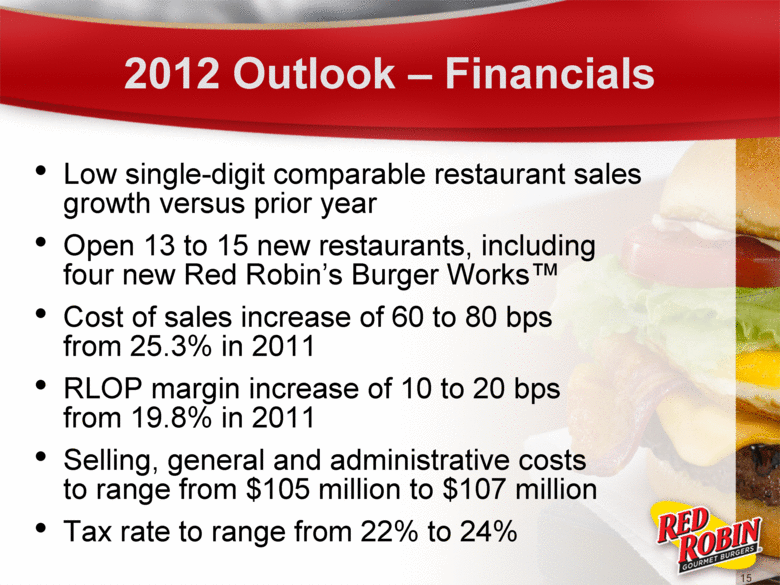
2012 Outlook – Financials Low single-digit comparable restaurant sales growth versus prior year Open 13 to 15 new restaurants, including four new Red Robin’s Burger Works™ Cost of sales increase of 60 to 80 bps from 25.3% in 2011 RLOP margin increase of 10 to 20 bps from 19.8% in 2011 Selling, general and administrative costs to range from $105 million to $107 million Tax rate to range from 22% to 24% 15 |
|
|
Advancing Our Brand Making major investments in new business systems Updating our menu and growing Red Royalty Expanding Red Robin’s Burger Works™ test Testing next generation restaurant prototype Building our pipeline of new restaurants Delivering a superior Guest experience |
|
|
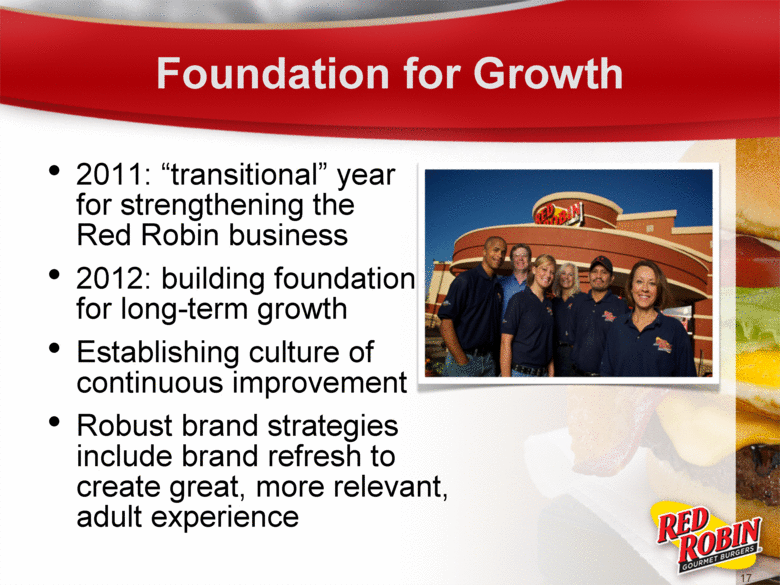
Foundation for Growth 2011: “transitional” year for strengthening the Red Robin business 2012: building foundation for long-term growth Establishing culture of continuous improvement Robust brand strategies include brand refresh to create great, more relevant, adult experience 17 |

