Attached files
| file | filename |
|---|---|
| 8-K - GARTNER INC | c68628_8k.htm |


Brian Shipman
GVP Investor Relations
Gartner

Forward Looking Statements
Statements contained in this presentation regarding the growth and prospects of the business, the Company’s projected 2011 financial results, long-term objectives and all other statements in this presentation other than recitation of historical facts are forward looking statements (as defined in the Private Securities Litigation Reform Act of 1995). Such forward looking statements involve known and unknown risks, uncertainties and other factors; consequently, actual results may differ materially from those expressed or implied thereby.
Factors that could cause actual results to differ materially include, but are not limited to, the ability to maintain and expand Gartner’s products and services; the ability to expand or retain Gartner’s customer base; the ability to grow or sustain revenue from individual customers; the ability to attract and retain a professional staff of research analysts and consultants upon whom Gartner is dependent; the ability to achieve and effectively manage growth, including the ability to integrate acquisitions and consummate acquisitions in the future; the ability to pay Gartner’s debt obligations; the ability to achieve continued customer renewals and achieve new contract value, backlog and deferred revenue growth in light of competitive pressures; the ability to carry out Gartner’s strategic initiatives and manage associated costs; the ability to successfully compete with existing competitors and potential new competitors; the ability to enforce our intellectual property rights; additional risks associated with international operations including foreign currency fluctuations; the impact of restructuring and other charges on Gartner’s businesses and operations; general economic conditions; risks associated with the credit worthiness and budget cuts of governments and agencies; and other risks listed from time to time in Gartner’s reports filed with the Securities and Exchange Commission, including Gartner’s most recent Annual Report on Form 10-K and Quarterly Reports on Form 10-Q.
The Company’s SEC filings can be found on Gartner’s website at investor.gartner.com and on the SEC’s website at www.sec.gov. Forward looking statements included herein speak only as of February 16, 2011 and the Company disclaims any obligation to revise or update such statements to reflect events or circumstances after this date or to reflect the occurrence of unanticipated events or circumstances.


Agenda
Business Overview Gene Hall
Research Peter Sondergaard
Events Alwyn Dawkins
Consulting Per Anders Waern
Break
Sales David Godfrey
Financial Overview Chris Lafond
Summary / Q&A Gene Hall and Chris Lafond


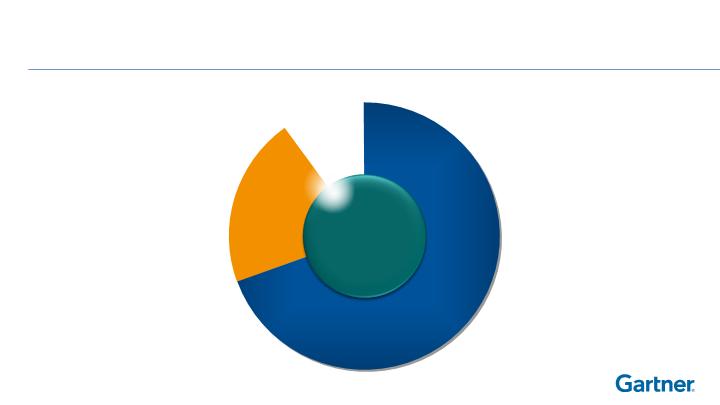
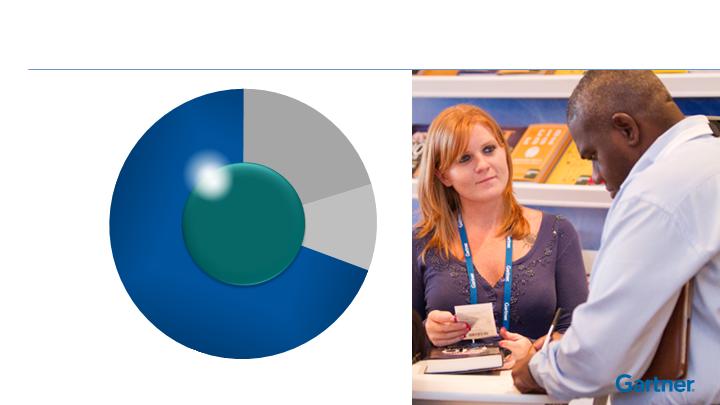
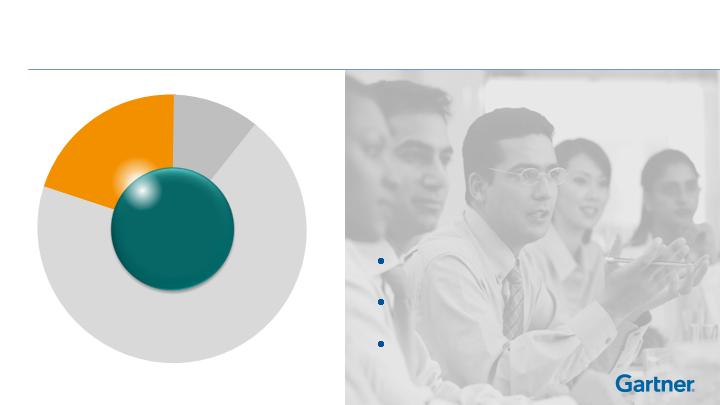
Extraordinary Research Insight Through
Three Business Segments
Extraordinary
Research
Insight

Note: Percentages based on midpoint of 2012 revenue guidance.
Gartner
Research
Business
70%
Extraordinary
Research
Insight
Extraordinary Research Insight Through
Three Business Segments
Note: Percentages based on midpoint of 2012 revenue guidance.
Gartner
Consulting
Business
20%
Gartner
Research
Business
70%
Extraordinary
Research
Insight
Extraordinary Research Insight Through
Three Business Segments

Note: Percentages based on midpoint of 2012 revenue guidance.
Gartner
Consulting
Business
20%
Gartner
Research
Business
70%
Gartner Events
Business
10%
Extraordinary
Research
Insight
Extraordinary Research Insight Through
Three Business Segments
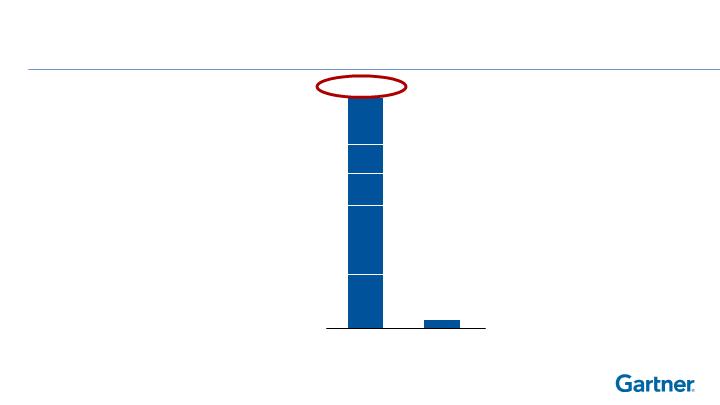
A Vast, Untapped Market Opportunity
Source: Gartner internal estimates.
$1.1 Billion**
* technology, professional services, telecommunications and investors
** 2011 ending contract value
$47 Billion
2012
12
18
5
4
8
Other*
Front-line IT
Professionals
Supply Chain
CIOs
IT Functional
Leaders

Winning Growth Strategy
Extraordinary
Research
Insight
Strong Sales
Capability
High-Value
Differentiated
Offerings
Performance-Driven Leadership Team
Continuous Improvement and Innovation
World-Class
Service
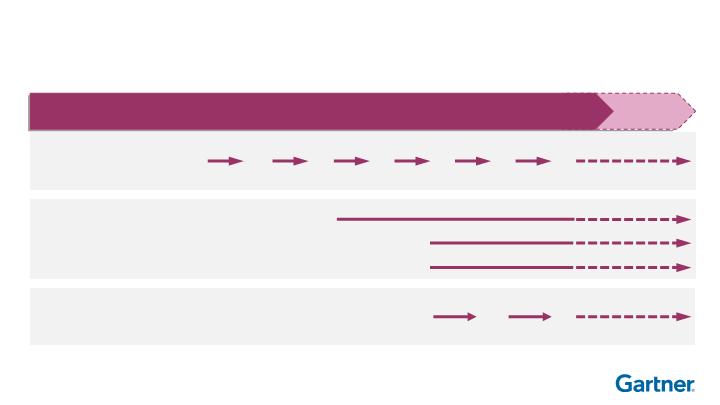
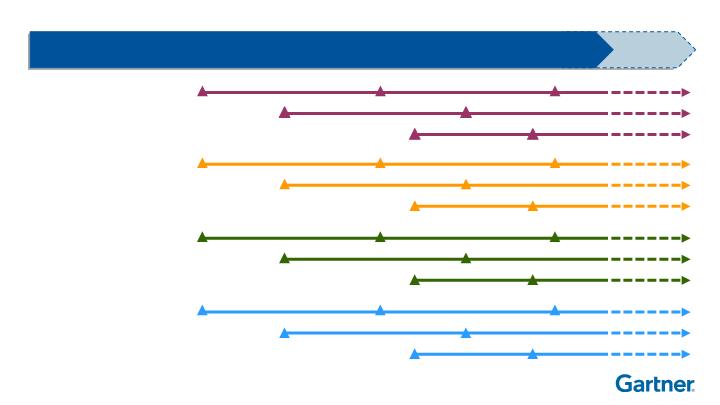
Extraordinary Research Insight
2005
Today
Focus on
Critical Topics
V2
V3
V4
V5
V6
V7
Expanded
Coverage Areas
Enterprise Architecture
Supply Chain
Tech Professionals
Analyst Time
Optimization
V1
V2
V3
2005
Today
Extraordinary
Research Insight
Strong Sales
Capability
High-Value,
Differentiated
Offerings
World Class
Service

Winning Growth Strategy
Extraordinary
Research
Insight
Strong Sales
Capability
High-Value
Differentiated
Offerings
Performance-Driven Leadership Team
Continuous Improvement and Innovation
World-Class
Service
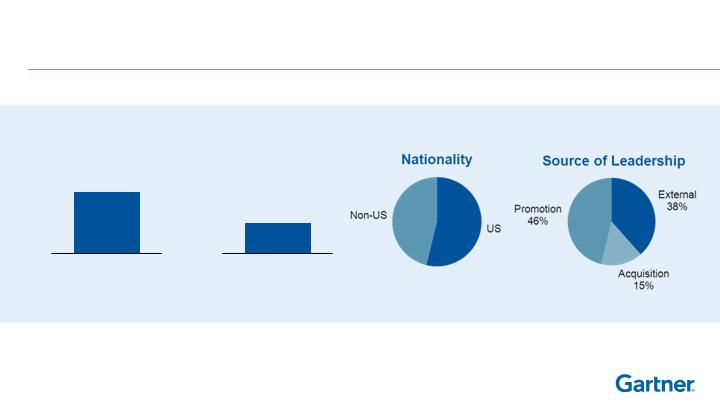
Performance Driven Leadership Team
Tenure
World-Class Talent
Global
6 years
Avg Tenure in Role
12 years
Avg Tenure at Gartner
Winning Growth Strategy
Extraordinary
Research
Insight
Strong Sales
Capability
High-Value
Differentiated
Offerings
Performance-Driven Leadership Team
Continuous Improvement and Innovation
World-Class
Service
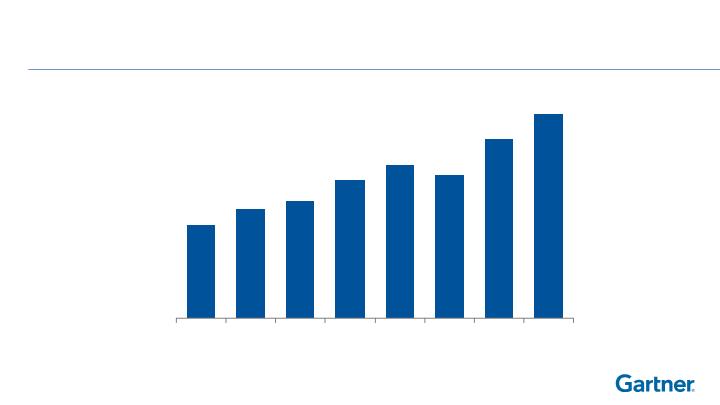
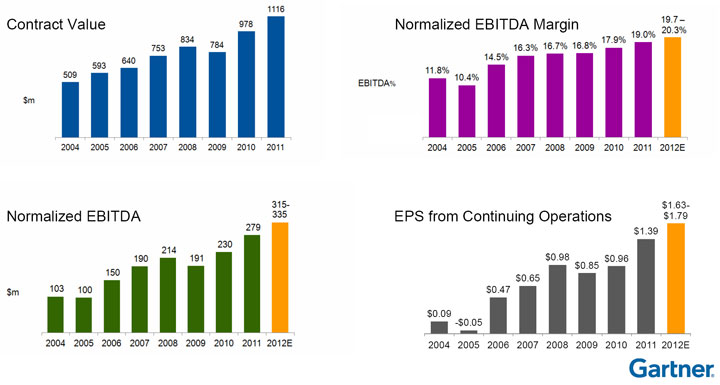
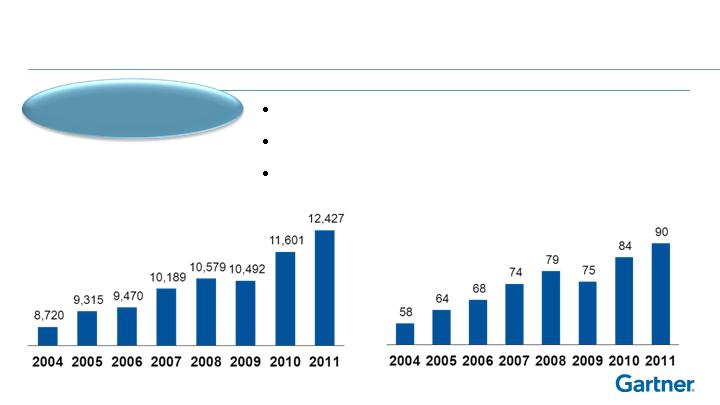
Contract Value
509
593
640
753
834
784
978
1116
2004
2005
2006
2007
2008
2009
2010
2011
$m
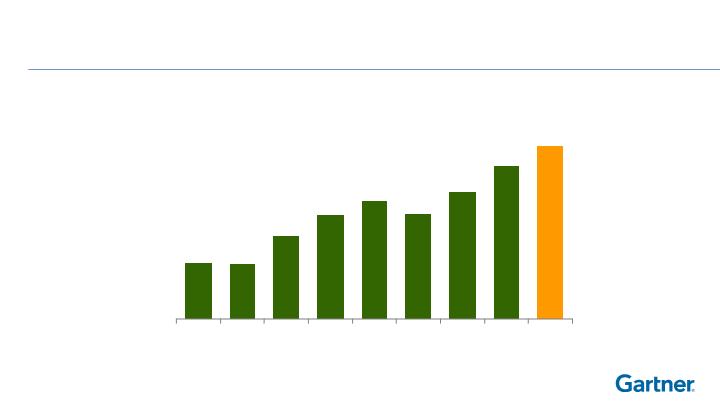
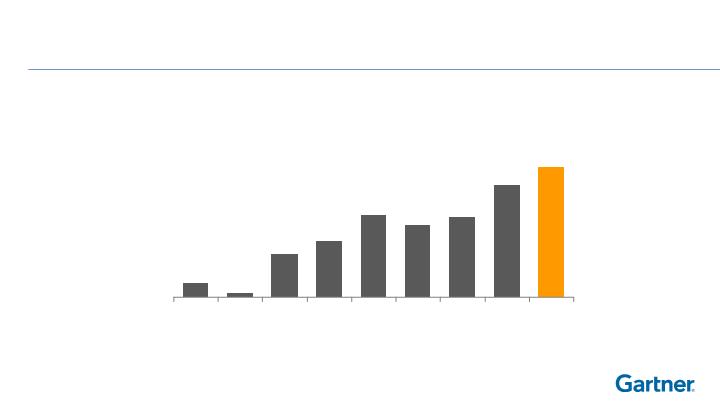
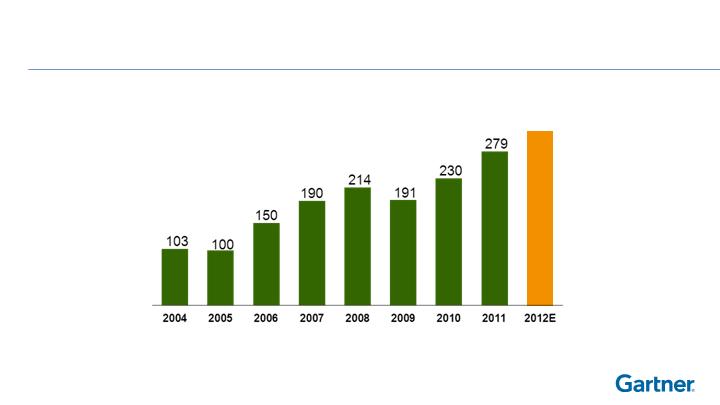
Normalized EBITDA
Restated to exclude results of Vision Events. See attached Glossary for a discussion of normalized EBITDA.
$m
103
100
150
190
214
191
230
279
315-
335
2004
2005
2006
2007
2008
2009
2010
2011
2012E
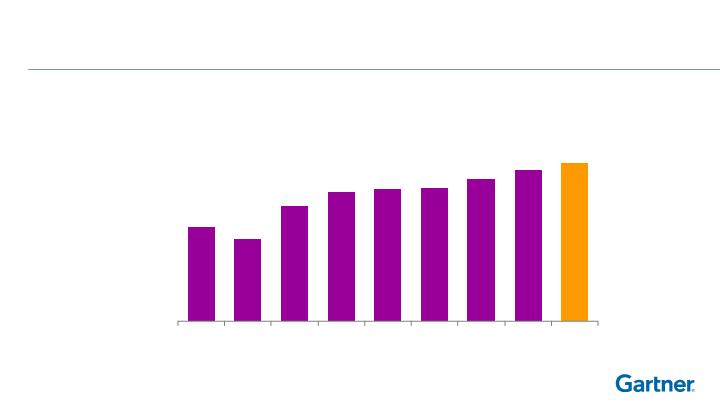
Normalized EBITDA Margin
Restated to exclude results of Vision Events. See attached Glossary for a discussion of normalized EBITDA.
19.7 –
20.3%
11.8%
10.4%
14.5%
16.3%
16.7%
16.8%
17.9%
19.0%
2004
2005
2006
2007
2008
2009
2010
2011
2012E
EBITDA
%
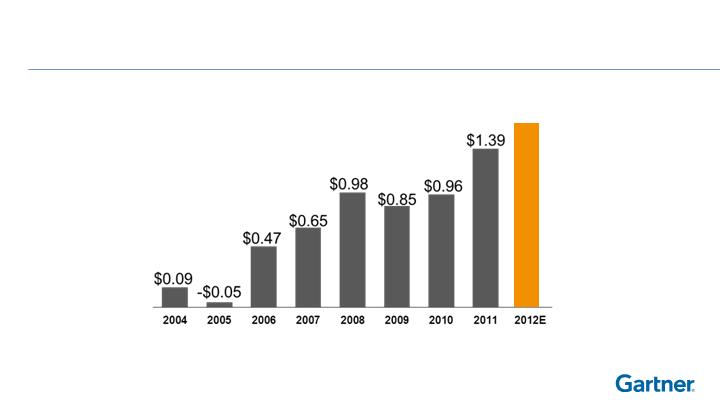
EPS from Continuing Operations
$0.09
-$0.05
$0.47
$0.65
$0.98
$0.85
$0.96
$1.39
$
1.63-
$1.79
2004
2005
2006
2007
2008
2009
2010
2011
2012E
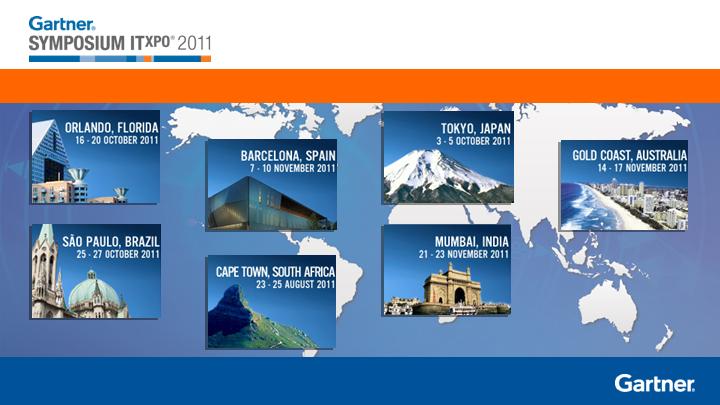
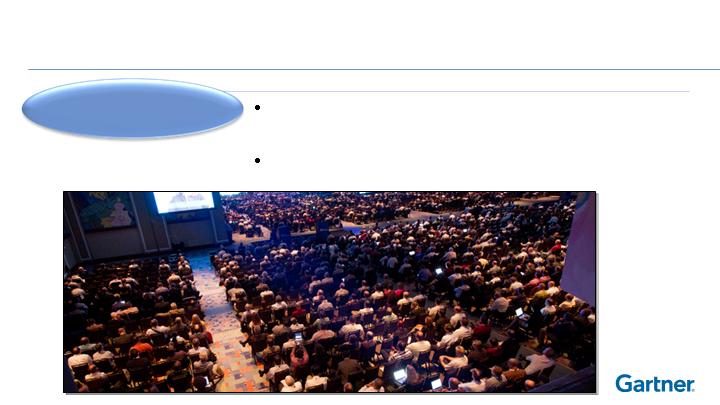
5,100 CIOs
The World’s Most Important Gathering of CIOs and Senior IT Executives

2012 Sales Kickoff

Why Invest in Gartner?
Long-term,
Double-Digit
Revenue, EPS &
CF Growth
Winning Strategy
Exceptional Business Model
Vast Market Opportunity
Strong Value Proposition


Senior Vice President
Research
Peter Sondergaard

Gartner Research
Winning Strategy
Strong Value Proposition
Vast Market Opportunity

The Next Age of Computing
INFORMATION
MOBILE
SOCIAL
CLOUD
NEXUS OF FORCES
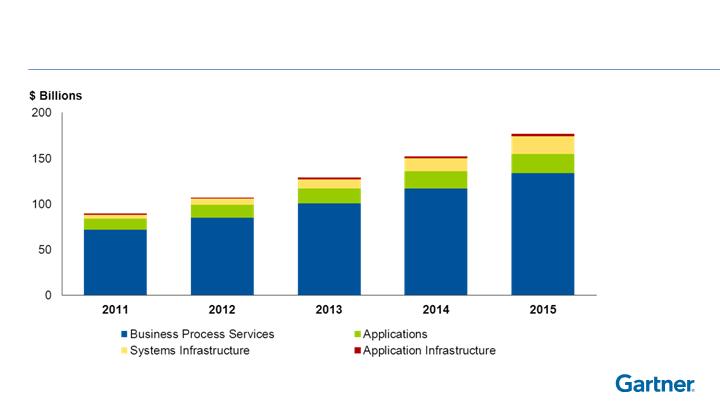
Public Cloud Growth
Source: Gartner Estimates (2Q11 Update)

The Next Age of Computing
INFORMATION
MOBILE
SOCIAL
CLOUD
NEXUS OF FORCES
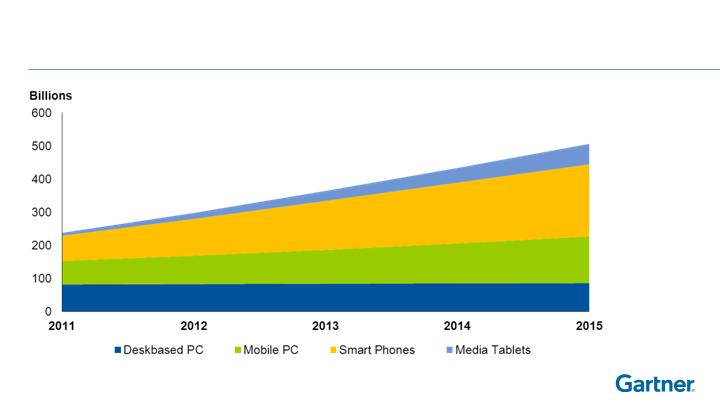
What’s Installed
Source: Gartner Estimates (2Q11 Update)
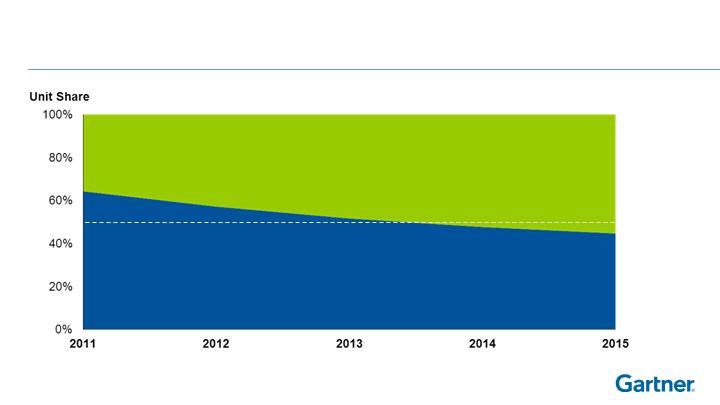
The Big Shift
Source: Gartner Estimates (2Q11 Update)
Mobile OS
PC OS
The Next Age of Computing
INFORMATION
MOBILE
SOCIAL
CLOUD
NEXUS OF FORCES

2012 Client Key Initiatives
Source: Gartner.com Data, January 2012
1 Cloud Computing
2 Mobile Enterprise Strategy
3 Enterprise Architecture
4 IT Strategic Planning
5 IT Governance
6 ITIL and Process Improvement
7 Data Center Modernization
8 IT Cost Optimization
9 Business Intelligence
10 Application Development
Rank Key Initiative
Rank Key Initiative
2006 Client Key Initiatives
Source: Gartner.com Data, January 2007
4 Application Development
5 ERP & Supply
Chain
Management
6 Mobile & Wireless
7 Customer Relationship
Management
8 Application Integration
and
Middleware
9 Outsourcing
10 Emerging Technologies
1 IT Strategic Planning
2 Security & Privacy
3 Business Intelligence
Rank Key Initiative
Rank Key Initiative

Gartner Research
Note: Percentages based on midpoint of 2012 revenue guidance.
Gartner
Research
Business
Gartner
Consulting
Business
Gartner Events
Business
20%
70%
Extraordinary
Research
Insight
10%
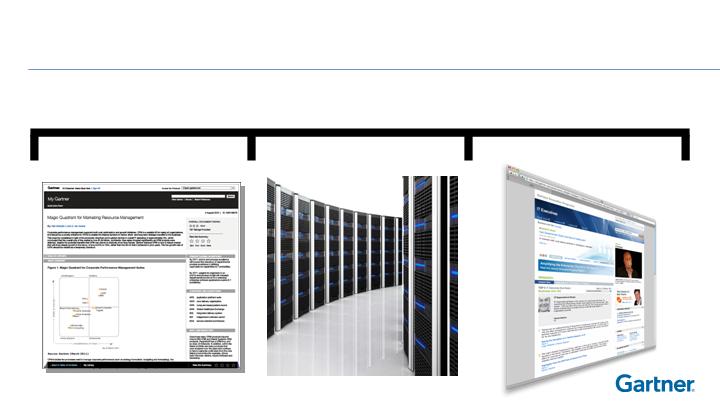
Gartner Research Model
The Research Process
People
Process
Proprietary Data
Packaging
Gartner Research Model
The People — Analysts
Subject Matter Experts
Over 810 analysts in 26 countries
Over 135 based in APAC,
over 190
based in Europe
Minimum 12 years of experience at
time of hire
60% have 20+ years of industry
experience
135
190
485
People
Process
Proprietary Data
Packaging
Gartner Research Model
The Research Process
Decision Makers
in 12,400 organizations
Academic
Institutions
Technology &
Service Providers
12,000 briefings
Investors
People
Process
Proprietary Data
Packaging
Gartner Research Model
The Research Process
People
Process
Proprietary Data
Packaging
Transparency
Objectivity
Collaboration
Quality
2 Mobile Enterprise Strategy
3 Enterprise Architecture
4 IT Strategic Planning
5 IT Governance
Rank Key Initiative
1 Cloud Computing
Gartner Research Model
The Research Process
People
Process
Proprietary Data
Packaging
Gartner Research Model
Proprietary Data and Analytics
42
Proprietary Data and Analytics
Over 2,300
contract
reviews
and almost
8,500 strategy
reviews
A terabyte of
continually
updated market
data
5,500 IT Cost
and Price
benchmarks
290,000
recorded
interactions
5.5 million
document page
views
4.5 million
end-user
searches per
year
People
Process
Proprietary Data
Packaging
8,600 documents annually including:
Magic Quadrants
Hype Cycles
Vendor Ratings
Written Actionable Advice
Gartner Research Model
Packaging and Presentation
People
Process
Proprietary Data
Packaging

Scalable structure and process to
handle 290,000 interactions
Phone access to analysts
Face-to-face interactions
Interactions
Gartner Research Model
Packaging and Presentation
People
Process
Proprietary Data
Packaging
Gartner Research
Highly differentiated insight
delivered primarily through
digital media subscriptions
Gartner Research Business
Gartner
Research
Business
Note: Percentages based on midpoint of 2012 revenue guidance.
70%
People
Process
Proprietary Data
Packaging

Gartner for IT Executives
Equips CIOs with the role-specific tools and
knowledge they need to deliver exceptional
business results for their organizations
Gartner Research
Vast Untapped Market Opportunity
$1.1 Billion**
Source: Gartner internal estimates
* technology, professional services, telecommunications
and investors
** 2011 ending contract value
$47 Billion
2012
Other*
Front-line IT
Professionals
Supply Chain
CIOs
IT Functional
Leaders
12
18
5
4
8
Gartner for IT Leaders
Provides IT leaders with just-in-time, role-
specific insight and advice from Gartner
analysts to drive success on critical initiatives
and IT purchases

Gartner Research
Vast Untapped Market Opportunity
$1.1 Billion**
Source: Gartner internal estimates
* technology, professional services, telecommunications
and investors
** 2011 ending contract value
$47 Billion
2012
Other*
Front-line IT
Professionals
Supply Chain
CIOs
IT Functional
Leaders
12
18
5
4
8
Gartner for Technical Professionals
Provides IT technical professionals with in-depth
advice to drive technology architecture decisions
and implementation strategy

Gartner for Supply Leaders
Provides Supply Chain leaders within different
industries advice and tools to optimize and drive
success on critical initiatives around their specific
value chain
Gartner Research
Vast Untapped Market Opportunity
$1.1 Billion**
Source: Gartner internal estimates
* technology, professional services, telecommunications
and investors
** 2011 ending contract value
$47 Billion
2012
Other*
Front-line IT
Professionals
Supply Chain
CIOs
IT Functional
Leaders
12
18
5
4
8
Gartner for Business Leaders
Provides business leaders in Technology and
Service providers with the tools and insight to
ensure they succeed in the marketplace
Continuous Product Innovation
Content
Technology Platform
Usability/interface

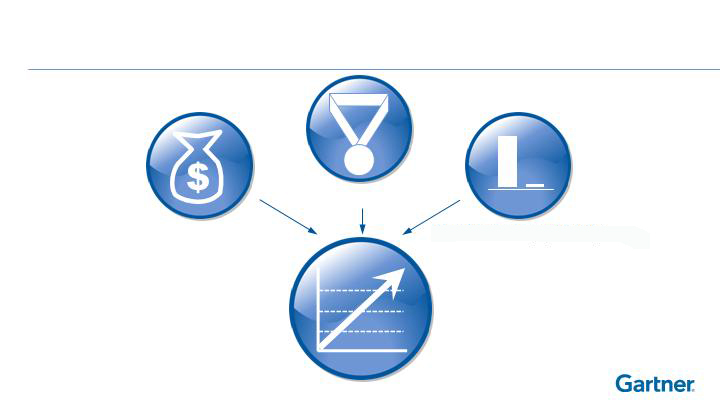
Strong Value Proposition
Right direction,
right away
Immediate
shortlists on key
initiatives
Contract reviews
Best-practice
budget benchmark
Cost avoidance
Global perspective
Best practice by
vertical industry
Strategic guidance
Making the right
decision
Personal
development
Increased credibility
Save Time
Save Money
Gain
Resources
Gain
Confidence
Gartner Research
Winning Strategy
Vast Market Opportunity
Strong Value Proposition


Senior Vice President
Gartner Events
Alwyn Dawkins

Gartner Events
Winning Strategy
Vast Market Opportunity
Strong Value Proposition
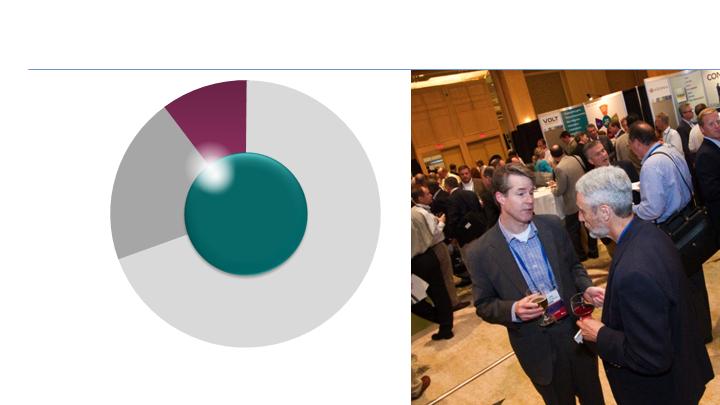
Gartner Events
Gartner
Events
Business
Differentiated live
events leveraging
research content
Gartner Events
Business
Note: Percentages based on midpoint of 2012 revenue guidance.
Extraordinary
Research
Insight
10%

Make every conference we produce the MUST
ATTEND
event for the communities we serve
Our mission:
Gartner Events
Business
Gartner Events
60 Events
6 Continents
42,800 Attendees
1,500 Exhibitors
World’s Leading IT Conference Producer
Extraordinary
Research
Insight
10%
10%
People
Process
Proprietary
Data
Gartner Events
Gartner Events
Business
Current
Relevant
Actionable
Note: Percentages based on midpoint of 2012 revenue guidance.
Attendee Value Proposition
Face-to-face Analyst interaction
Industry leaders
Unparalleled peer networking
Access to leading solution
providers
Actionable advice
Exhibitor Value Proposition
Face to face interaction
with high level attendees
Cost effective means to
generate leads
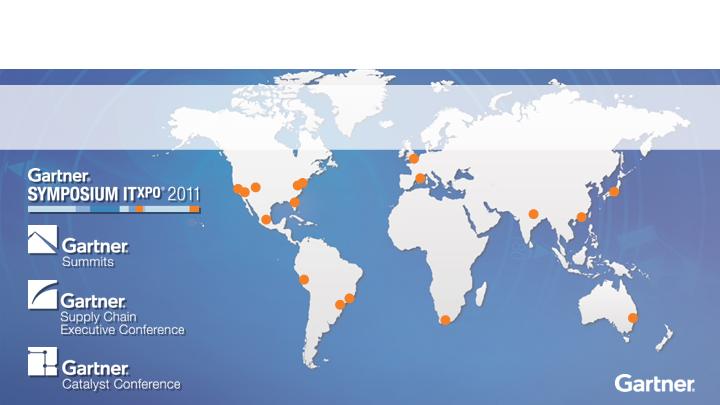
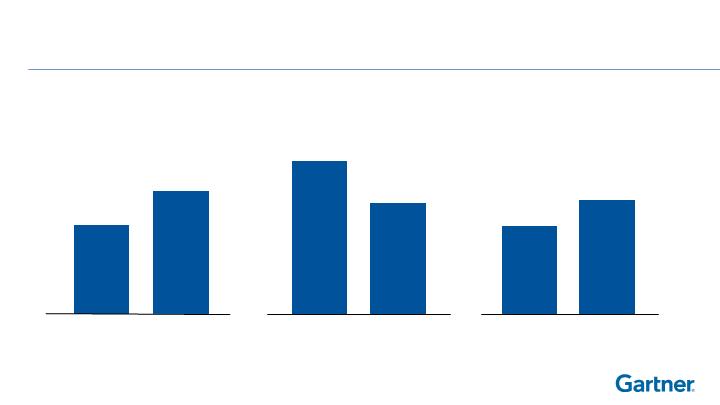
2011 Gartner Event Portfolio
60 strategic conferences
15% increase in global attendance

5,100 CIOs (up 18% YoY) and over 18,000 Attendees (up 16% YoY)
The World’s Most Important Gathering of CIOs and Senior IT Executives
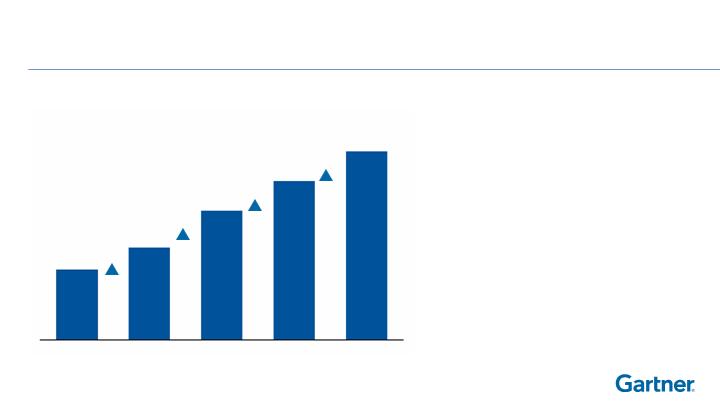
Symposium strategy driving
increased CIO attendance
5,100 plus CIOs
18% YOY increase
2007
2010
2008
2009
2011
+32%
+40%
+23%
+18%
1,900
2,500
3,500
4,300
5,100
Global Symposium CIO Attendance
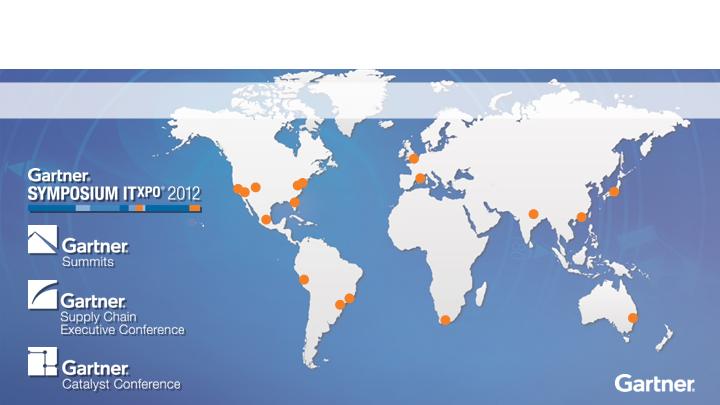
2012 Gartner Event Portfolio
63 strategic conferences

Gartner Events
Winning Strategy
Vast Market Opportunity
Strong Value Proposition

Senior Vice President
Gartner Consulting
Per Anders Waern

Gartner Consulting
Longer-term differentiated
engagements leveraging
Gartner research
Gartner
Consulting
Business
Note: Percentages based on midpoint of 2012 revenue guidance.
20%
Extraordinary
Research
Insight

Gartner Consulting
Winning Strategy
Vast Market Opportunity
Strong Value Proposition

Gartner Consulting
Note: Percentages based on midpoint of 2012 revenue guidance.
Core Consulting
Benchmarking Services
Contract Optimization
20%
Extraordinary
Research
Insight

Gartner Consulting
Note: Percentages based on midpoint of 2012 revenue guidance.
Independent and Objective
Powered by Gartner
Research
Proprietary Benchmark
Enabled
20%
Extraordinary
Research
Insight
Experienced Senior Practitioners
481 billable Consultants
$424K average annual
revenue per head
Powerful value proposition
for attracting top talent

Managing Partner
Trust-based relationships
Repeatable services
Gartner Consulting
Note: Percentages based on midpoint of 2012 revenue guidance.
Longer-term differentiated
engagements leveraging
Gartner research
50% cost savings
Mobility roadmap
Cloud strategy
20%
Extraordinary
Research
Insight

Contract Optimization

>$1.4B
in documented client savings
Gartner Consulting Contract Optimization

Gartner Consulting
Note: Percentages based on midpoint of 2012 revenue guidance.
Longer-term differentiated
engagements leveraging
Gartner research
20%
Extraordinary
Research
Insight
Gartner Consulting – Continuous Productivity
Improvements
Gross Contribution Margin
37%
34%
2011
2004
Note: 2004 Gross Contribution Margin re-stated to reflect the impact of equity compensation expense – impact is 1 pt.

Gartner Consulting
Winning Strategy
Strong Value Proposition
Vast Market Opportunity


Senior Vice President
Worldwide Sales
David Godfrey

Gartner
Note: Percentages based on midpoint of 2012 revenue guidance.
Gartner
Research
Business
Gartner
Consulting
Business
Gartner Events
Business
20%
70%
10%
Extraordinary
Research
Insight
Gartner Sales
Gartner Sales
1,268 quota-bearing
sales associates
186% growth since
2004
48% outside of United
States
Profile of a
Gartner Account
Executive
Highly motivated
Great sales DNA
Passionate
Goal oriented
Market Opportunity
2008
80,000
2012
108,000
Enterprise Opportunity

Market Opportunity
2008
19,000
2012
34,000
Covered Enterprises

Market Opportunity
2008
6,800
2012
8,100
Client Enterprises
18
5
8
$47 Billion
2012
Other*
Front-line IT
Professionals
Supply Chain
CIOs
IT Functional
Leaders
Total Market Opportunity
* technology, professional services, telecommunications and investors
Source: Gartner internal estimates
Other*
CIOs
IT Functional
Leaders
2008
$21 Billion
7
11
3
12
4
74,000
Total
108,000
Uncovered
Covered
34,000
# of Enterprises
12
18
5
4
8
$47 Billion
2012
Other*
Front-line IT
Professionals
Supply Chain
CIOs
IT Functional
Leaders
Prospects
Clients
25,900
8,100
Percent of Total
100%
69%
31%
24%
7%
$1.1 Billion**
Vast Market Opportunity For Research
* technology, professional services, telecommunications and investors
** 2011 ending contract value
Source: Gartner internal estimates
Research sold as subscriptions to individuals
IT Functional Leaders
IT Professionals
CIO
Role-based
Recurring revenue
Case Study: Growing the Account

Case Study: Growing the Account

Gartner Sales
Winning Strategy
Vast Market Opportunity
Strong Value Proposition
Sales Strategy to Capture Market Opportunity
Coverage
Capacity
Sales
Effectiveness
Sales Strategy to Capture Market Opportunity
Coverage
Capacity
Sales
Effectivenes
s
Sales Strategy to Capture Market Opportunity
Capacity
Sales
Effectivenes
s
Coverage
Sales Strategy to Capture Market Opportunity
Capacity
Coverage
Sales Effectiveness
Sales Strategy to Capture Market Opportunity
15 - 20% increased annual sales headcount
objective
Architected recruitment and training plan
Capacity

Sales Strategy to Capture Market Opportunity
15 - 20% increased annual sales headcount
objective
Architected recruitment and training plan
Capacity
Direct Quota Bearing Headcount

Gartner Sales: A great place to work
Gartner culture
Collaboration
Leading tools and
Best Practices
Access to the C-Level
Innovative products
Sales Strategy to Capture Market Opportunity
Focused channel approach
Matched to global opportunity
Emphasizing client intimacy
Coverage
Research Client Organizations
Average Contract Value
per Organization
$K
Sales Strategy to Capture Market Opportunity
Great Talent
World Class Training
Proprietary Tools and Best Practices
Sales
Effectiveness

Gartner Sales
Winning Strategy
Strong Value Proposition
Vast Market Opportunity


Gartner Chief Financial Officer
Chris Lafond

Consistent, Winning Growth Strategy
Extraordinary
Research
Insight
Strong Sales
Capability
High-Value
Differentiated
Offerings
Performance-Driven Leadership Team
Continuous Improvement and Innovation
World-Class
Service

Consistent, Winning Growth Strategy:
The Financial Plan We Set in 2005
Grow the Research business
Optimize the Events portfolio
Improve the profitability of the Consulting business
Leverage our G&A infrastructure
Drive shareholder value

Grow the Research Business
Contract Value
>100%
1,116
509
$M
2004
2011
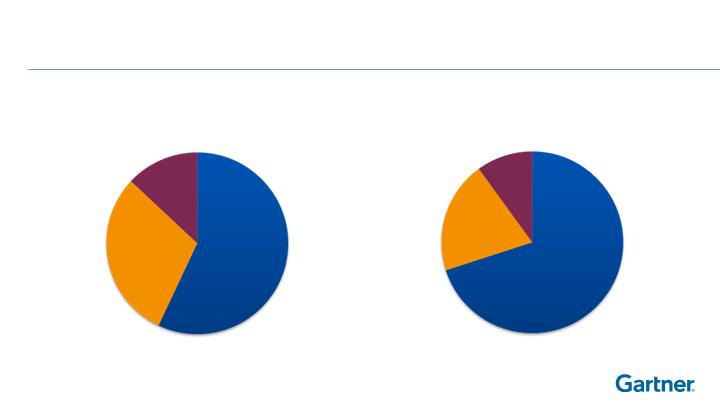
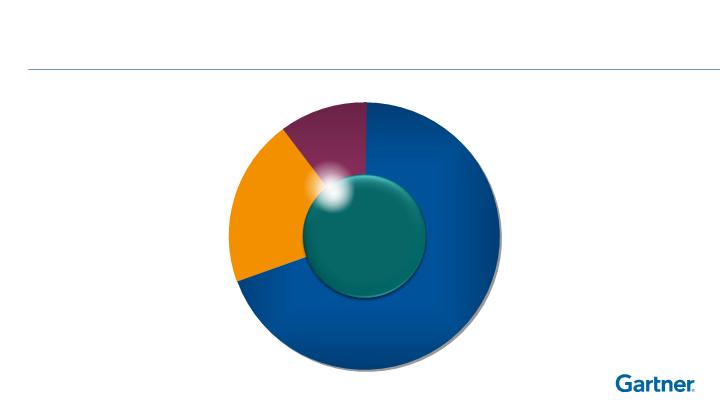
Consistent Growth Strategy:
Grow the Research Business
(a)
Based on midpoint of 2012 revenue guidance.
Events 13%
2004
Consulting
30%
Research 57%
Events 10%
2012 Estimate (a)
Consulting
20%
Research
70%
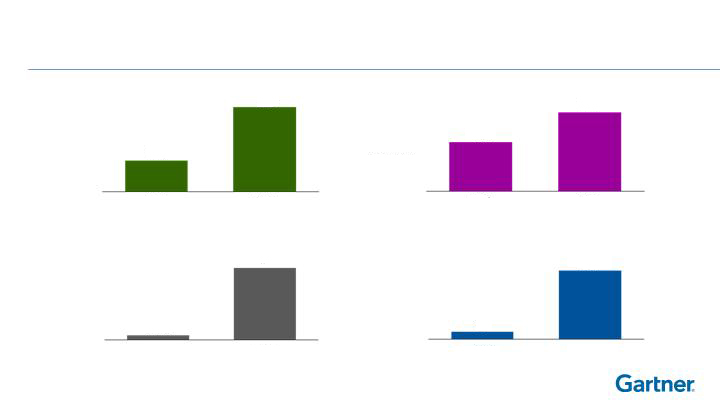
Optimize the Events Portfolio
# Events
+7%
2004
60
2011
56
Attendees
30,999
42,808
+38%
2004
2011
1,321
+16%
1,532
2004
2011
Exhibitors
Revenue ($M)
2004
$259
2011
$308
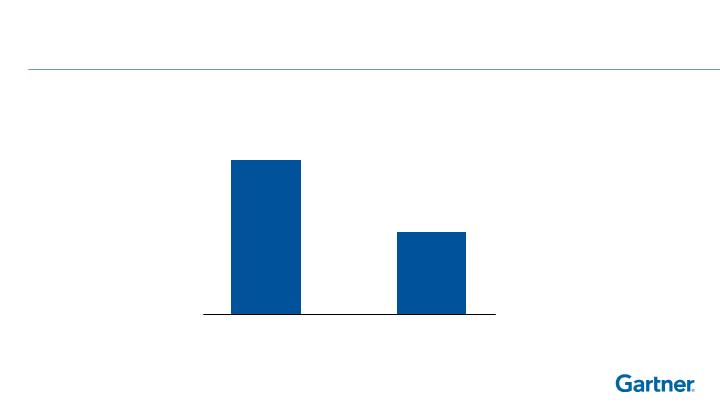
Headcount
2004
493
2011
481
Gross Contribution
Margin (%)
2004
34%
2011
37%
Improve Consulting Profitability
Leverage our G & A Infrastructure
2004
18% of
revenue
2011
15% of
revenue

Drive Shareholder Value
44 Million shares
repurchased
$963.5M returned
to shareholders
Shares Outstanding ($000’s)
2004
126,326
2011
98,846
-21%
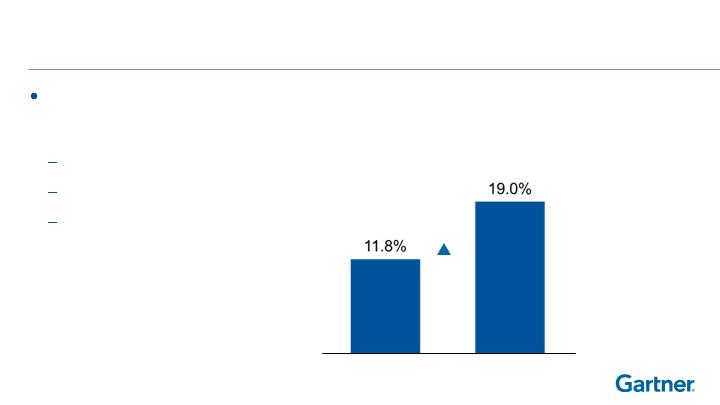
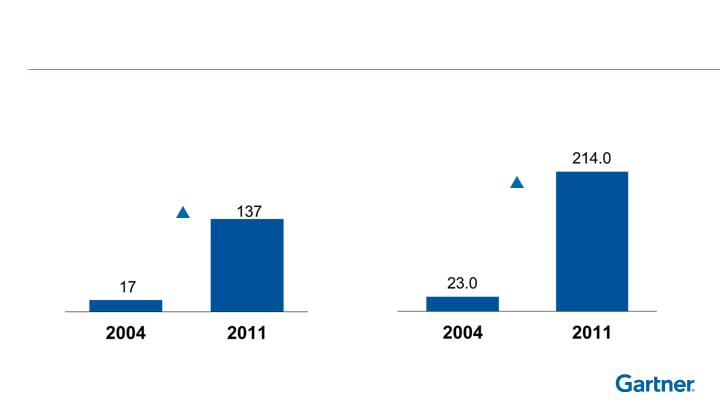
Consistent, Winning Growth Strategy:
CF & Earnings Track Record
Normalized EBITDA (a)
$ in millions
103
279
EBITDA%
2004
2011
11.8
19.0
2004
2011
Normalized EBITDA Margin (a)
EPS from Continuing Operations
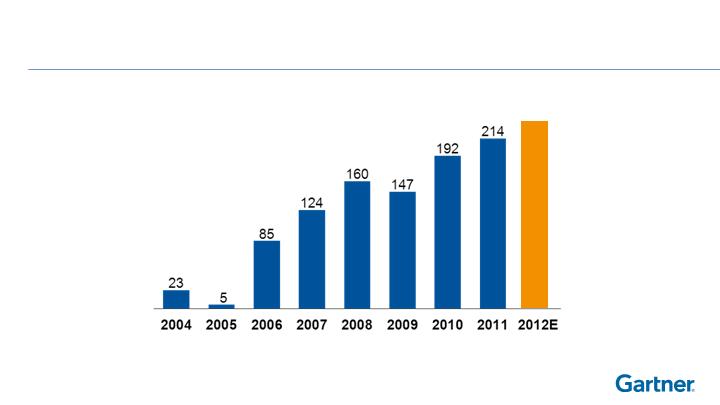
Free Cash Flow (a)
2004
$0.09
$1.39
2011
23
2004
214
2011
$ in millions
(a)
See the attached Glossary for the definition of Free Cash Flow, and cautionary statement regarding this non-GAAP
financial measure.

Why Invest in Gartner?
Long-term,
Double-Digit
Revenue, EPS &
CF Growth
Winning Strategy
Exceptional Business Model
Vast Market Opportunity
Strong Value Proposition
Value Proposition: We Deliver Our Extraordinary
Research Insight Through Three Business Segments
Note: Percentages based on midpoint of 2012 revenue guidance.
Gartner
Research
Business
Gartner
Consulting
Business
Gartner Events
Business
20%
70%
10%
Extraordinary
Research
Insight

Vast Market Opportunity For Research
Prospects
Clients
25,900
8,100
Percent of Total
100%
69%
31%
24%
7%
74,000
Total
108,000
Uncovered
Covered
34,000
# of Enterprises
$1.1 Billion**
* technology, professional services, telecommunications and investors
** 2011 ending contract value
Source: Gartner internal estimates
$47 Billion
2012
Other*
Front-line IT
Professionals
Supply Chain
CIOs
IT Functional
Leaders
8
4
5
18
12

Attractive and Predictable Business Model
Subscription-based business model
High renewal/retention rates–80% plus–attractive
level of recurring revenue
Negative working capital
High incremental margins
Strong balance sheet
High level of conversion from earnings into FCF
Attractive Business Model: Margin Expansion
High incremental gross contribution margin
long-term targets
Research—70%
Events—50%
Consulting—40%
Normalized EBITDA Margin
+720
BPS
2004
2011
Attractive Business Model: Strong Cash Flow
Leverage Conversion
(a)
See the attached Glossary for the definition of Free Cash Flow, and cautionary statement regarding this non-GAAP financial
measure.
Net Income
$ in millions
+706%
+830%
Free Cash Flow (a)
$ in millions

Long-Term Financial Objectives
Normalized EBITDA
margin improvement
50 – 150 bps per year
Total Revenue Growth
11 – 16%
Annual
Research
15 – 20%
Consulting
3 – 8%
Events
5 – 10%

Consistent Growth Strategy
(a)
Restated to exclude results of Vision Events.
(b)
See the attached Glossary for the definition of Normalized EBITDA, and cautionary statement regarding this non-GAAP financial measure
(c)
2012 Normalized EBITDA margin based upon mid-point of 2012 guidance
(d)
See Forward Looking Statement disclaimer on page 1 for factors that may affect our ability to achieve these results.
(e)
See the attached Glossary for the definition of Free Cash Flow, and cautionary statement regarding this non-GAAP financial measure
Total Revenue (a, d)
$ in millions
1,600-
1,650
Consistent Growth Strategy
(a)
Restated to exclude results of Vision Events.
(b)
See the attached Glossary for the definition of Normalized EBITDA, and cautionary statement regarding this non-GAAP financial measure
(c)
2012 Normalized EBITDA margin based upon mid-point of 2012 guidance
(d)
See Forward Looking Statement disclaimer on page 1 for factors that may affect our ability to achieve these results.
(e)
See the attached Glossary for the definition of Free Cash Flow, and cautionary statement regarding this non-GAAP financial measure
Normalized EBITDA (a, b, c, d)
315-
335
Consistent Growth Strategy
(a)
Restated to exclude results of Vision Events.
(b)
See the attached Glossary for the definition of Normalized EBITDA, and cautionary statement regarding this non-GAAP financial measure
(c)
2012 Normalized EBITDA margin based upon mid-point of 2012 guidance
(d)
See Forward Looking Statement disclaimer on page 1 for factors that may affect our ability to achieve these results.
(e)
See the attached Glossary for the definition of Free Cash Flow, and cautionary statement regarding this non-GAAP financial measure
EPS from Continuing Operations (d)
$1.63-
$1.79
Consistent Growth Strategy
(a)
Restated to exclude results of Vision Events.
(b)
See the attached Glossary for the definition of Normalized EBITDA, and cautionary statement regarding this non-GAAP financial measure
(c)
2012 Normalized EBITDA margin based upon mid-point of 2012 guidance
(d)
See Forward Looking Statement disclaimer on page 1 for factors that may affect our ability to achieve these results.
(e)
See the attached Glossary for the definition of Free Cash Flow, and cautionary statement regarding this non-GAAP financial measure
Free Cash Flow (a, d, e)
$ in millions
239-
257

Why Invest in Gartner?
Long-term,
Double-Digit
Revenue, EPS &
CF Growth
Winning Strategy
Exceptional Business Model
Vast Market Opportunity
8
Strong Value Proposition


Appendix

Projected 2012
Full Year Revenue and
EBITDA Outlook
($ in millions except per share data)
Research
$ 1,130
-
1,150
12%
-
14%
Consulting
310
-
330
1%
-
7%
Events
160
-
170
8%
-
14%
Total Revenue
$1,600
-
1,650
9%
-
12%
2012 Projection (1)
Reported
% change (1)
Normalized EBITDA (2)
$315
-
335
13%
-
20%
(1)
See Forward Looking Statement disclaimer on page 1 for factors that may affect our ability to
achieve these results.
(2)
See the attached Glossary for a discussion of Normalized EBITDA

Projected 2012
Earnings and Cash Flow
Outlook
($ in millions except per share data)
2012 Projection (3)
Reported
% change (1)
Diluted Income per share
$1.63
-
1.79
17%
-
29%
Operating Cash Flow (1)
$285
- 305
12%
-
19%
Capital Expenditures (1)
(46)
- (48)
Free Cash Flow (2)
239
- 257
12%
-
20%
(1)
Capital expenditures includes $16.0 million of estimated payments we will make for the renovation of our Stamford headquarters facility, which are contractually reimbursable
from the landlord. The accounting
impact of these renovation payments increases both cash flow from operations and capital expenditures (investing activities) by the same
amount and as a result has no net impact on Free Cash Flow.
(2)
See the attached Glossary for a discussion of Free Cash Flow.
(3)
See Forward Looking Statement disclaimer on page 1 for factors that may affect our ability to achieve these results.

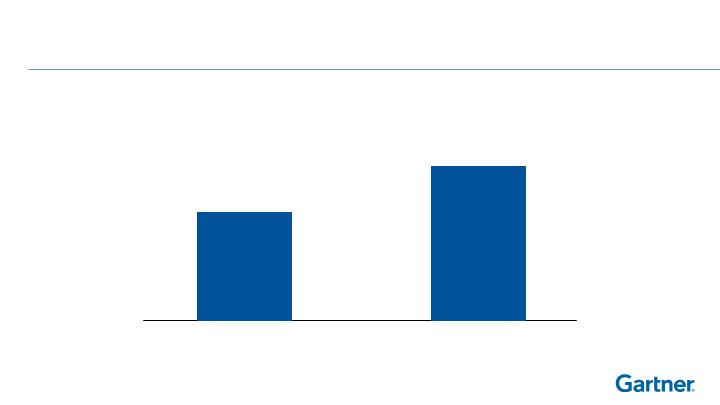
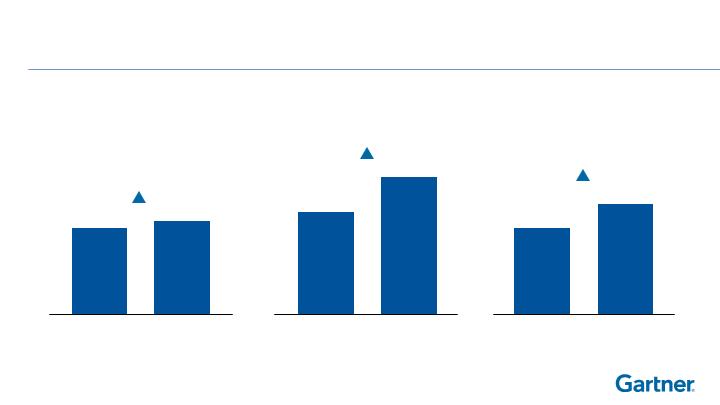
Projected 2012 Quarterly Phasing – Revenue
Research revenue driven by retention rates and timing of new
business
Balanced renewals with 26% expected in Q1
Fourth quarter historically the largest for new business
Events revenue recognized when conferences delivered
Symposium Series in Q4 drives phasing
12 events in Q1, 23 events in Q2, 13 events in Q3, and
15 events in Q4
Consulting revenue is seasonal
Q2 and Q4 slightly higher volume quarters
Q1 expected to be 23% of full year revenue
Note: See Forward Looking Statement disclaimer on page 1 for factors that may affect our
ability to achieve these results.

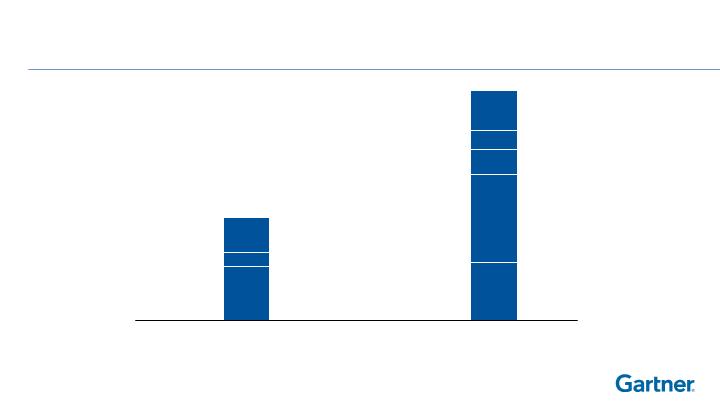
Projected 2012 Quarterly Phasing – Revenue
Research
Consulting
Events
Q1
Q2
Q3
Q4
24%
26%
25%
25%
22%
26%
24%
28%
11%
25%
11%
53%
Above based on midpoint of revenue guidance
Note: See Forward Looking Statement disclaimer on page 1 for factors that may affect our
ability to achieve these results.
Approximate estimated revenue phasing in 2012:

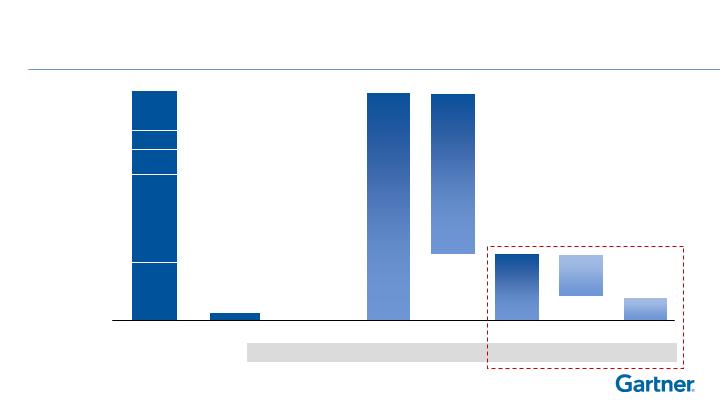
Projected 2012 Quarterly Phasing – Expense
Quarterly fluctuations in cost of services driven primarily by the
conference schedule in our Events business
Higher Research and Sales expenses in Q4 related to Symposia
and year-end sales support activities
G&A is less seasonal
Note: See Forward Looking Statement disclaimer on page 1 for factors that may affect our
ability to achieve these results.

Projected 2012 Sales, G&A and Other Expenses
Depreciation and amortization of $29 - 30 million
Interest expense of $10 – 11 million
Other income/expense of $2 – 3 million (primarily transaction FX
gains/losses)
Tax rate projected to be between 32 and 33%
Note: See Forward Looking Statement disclaimer on page 1 for factors
that may affect our ability to achieve these results.

Projected 2012 Quarterly Phasing – Earnings
Approximate income per share:
Q1
Q2
Q3
Q4
19%
36%
25%
20%
Above based on the midpoint of guidance
Based upon business conditions the Company may accelerate or
postpone expenses throughout the year which could shift earnings
between quarters
Note: See Forward Looking Statement disclaimer on page 1 for factors
that may affect our ability to achieve these results.
Why Invest in Gartner?
139
139
Long-term,
Double-Digit
Revenue, EPS &
CF Growth
Winning Strategy
Exceptional Business Model
Vast Market Opportunity
8
Strong Value Proposition
Glossary
140
Non-GAAP Financial Measures
Investors are cautioned that Normalized EBITDA and Free Cash Flow are not financial measures under generally accepted accounting principles. In addition, they should
not be construed as alternatives to any
other measures of performance determined in accordance with generally accepted accounting principles. These non-GAAP
financial measures are provided to enhance the user’s overall understanding of the Company’s current financial performance and the Company’s
prospects for the future.
Normalized EBITDA
Represents operating income excluding depreciation, accretion on obligations related to excess facilities, amortization, stock-based compensation expense, Acquisition
Adjustments and Other charges. We believe
Normalized EBITDA is an important measure of our recurring operations as it excludes items that may not be indicative of
our core operating results.
Reconciliation of Normalized EBITDA to GAAP
($ in millions)
2004
2005
2006
2007
2008
2009
2010
2011
Net income (loss)
$17
($2)
$58
$74
$104
$83
$96
$137
Interest expense, net
1
11
17
22
19
16
16
10
Other (income) expense, net
7
9
1
(3)
1
3
—
2
Discontinued operations (1)
(5)
(4)
(4)
(3)
(7)
—
—
—
Tax provision
16
7
26
40
48
33
38
65
Operating income (1)
$36
$20
$98
$129
$164
$134
$149
214
Normalizing adjustments:
Depreciation, accretion and amortization
31
36
34
28
28
28
36
32
META integration charges
—
15
1
—
—
—
—
—
Other charges
36
29
—
9
—
—
—
—
SFAS No. 123(R) stock compensation expense
—
—
17
24
21
26
33
33
Pre-acquisition deferred revenue fair value adjustments
—
4
—
Acquisition and Integration Charges (2)
3
8
—
Normalized EBITDA (1)
$103
$100
$150
$190
$213
$191
$230
$279
Glossary
141
Non-GAAP Financial Measures
Free Cash Flow: Represents cash provided by operating activities excluding cash charges related to the acquisitions of AMR Research and Burton
Group, which primarily consist of certain nonrecurring costs such
as severance and other exit costs (“Cash Acquisition and Integration Charges”), less
additions to property, equipment and leasehold improvements (“Capital Expenditures”). We believe
that Free Cash Flow is an important measure of
the recurring cash generated by the Company’s core operations that is available to be used to repurchase stock, repay debt obligations and invest in
future growth through new business development activities
or acquisitions.
Reconciliation of Free Cash Flow to GAAP
($ in millions)
2004
2005
2006
2007
2008
2009
2010
2011
Cash provided by operating activities
$48
$27
$106
$148
$184
$162
$205
$256
Cash Acquisition and Integration Charges
—
—
—
—
—
—
8
—
Capital Expenditures
(25)
(22)
(21)
(24)
(24)
(15)
(21)
(42)
Free Cash Flow
$23
$5
$85
124
$160
$147
$192
$214