Attached files
| file | filename |
|---|---|
| 8-K - FORM 8-K - ALLIANCE DATA SYSTEMS CORP | form_8k.htm |

©2012 ADS Alliance Data Systems, Inc.
Confidential and Proprietary
Alliance Data
Company Overview
NYSE: ADS
Company Overview
NYSE: ADS
First Quarter 2012

NYSE: ADS | 1Q2012
2
©2012 ADS Alliance Data Systems, Inc.
Confidential and Proprietary
Three Businesses. One Focus.
The largest and most comprehensive provider of
transaction-based marketing and loyalty solutions.
These solutions are delivered through three businesses:
transaction-based marketing and loyalty solutions.
These solutions are delivered through three businesses:
Designs and executes
ROI-based marketing
programs that deliver
measurable results
ROI-based marketing
programs that deliver
measurable results
Designs, delivers and
manages a suite of
loyalty marketing
programs and services to
profitably change
customer behavior
manages a suite of
loyalty marketing
programs and services to
profitably change
customer behavior
Drives sales for our
clients by providing
marketing driven
branded credit programs
that build customer
loyalty
clients by providing
marketing driven
branded credit programs
that build customer
loyalty
Private Label
Opportunity: $400+ Billion Addressable Market
Marketing spend is shifting from traditional mass marketing
to data-enabled, multi-channel direct marketing
to data-enabled, multi-channel direct marketing
The digital channel spend directed toward transaction-based, ROI solutions:
Strong double-digit growth market | Still less than 10% of $400+ billion prize
NYSE: ADS | 1Q2012
3
©2012 ADS Alliance Data Systems, Inc.
Confidential and Proprietary
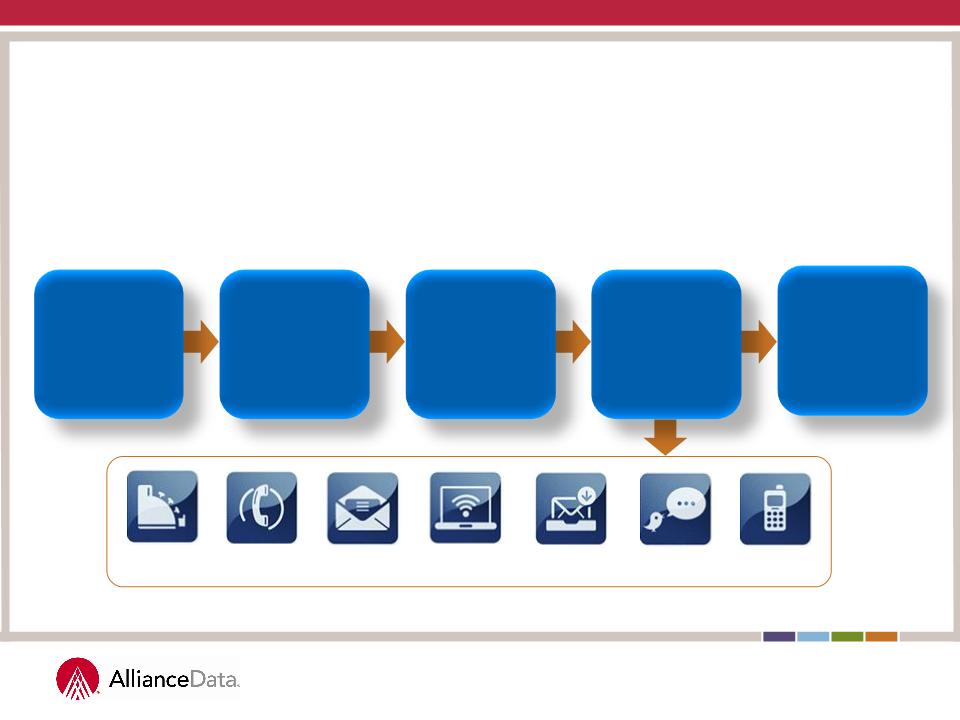
The Alliance Data End-to-End Solution
Strategy/
Creative
Analytics
and Insights
and Insights
Distribution
Data and
Database
LoyaltyOne | Epsilon | Private Label
Results and
Measurement
Measurement
Mobile
Direct Mail
In-store
Permission-
based Email
based Email
Social Media
On-line
Call Center

NYSE: ADS | 1Q2012
4
©2012 ADS Alliance Data Systems, Inc.
Confidential and Proprietary
Attractive Industry Trends
LoyaltyOne Epsilon Private Label
• Loyalty programs:
• Track high-frequency transactional
data …
data …
• to drive consumer insight…
• to improve the relevance of
marketing messages…
marketing messages…
• to create meaningful and
profitable results for retailers
profitable results for retailers
• LoyaltyOne AIR MILES Reward
Program has leading market position -
about 2/3rds of households
Program has leading market position -
about 2/3rds of households
Total Marketing Spend - Canada
Total Marketing Spend - US
Private Label Card Sales Volume
$22BN
+5%
$129BN
+6.6%
AdAge, 12/19/11
Nilson Report 2010
Reliability & Visibility
• Mix Shift on Marketing Spend:
• Away from traditional media
• To ROI-based digital marketing
• Overall marketing spend:
+3% CAGR through 2015
+3% CAGR through 2015
• But digital marketing spend:
+19% CAGR through 2015
+19% CAGR through 2015
• Epsilon provides end-to-end,
integrated, digital solutions
integrated, digital solutions
Innovation & Growth
• Total Credit Card Sales Volume of
$2.1 Trillion
$2.1 Trillion
• Private Label Cards represent
6.2% of total volume
6.2% of total volume
• Private Label Sales Growth
6.3% CAGR 2001 - 2010
6.3% CAGR 2001 - 2010
• ADS Private Label Sales Growth
9.5% CAGR 2001 - 2010
9.5% CAGR 2001 - 2010
• PL Cards enhance consumer
loyalty and marketing ROI
loyalty and marketing ROI
Retailer-Niche Leader
ZenithOptimedia
2011 Forecast
2011 Forecast

NYSE: ADS | 1Q2012
5
©2012 ADS Alliance Data Systems, Inc.
Confidential and Proprietary
ADS Operating Results
($MM, except per share data)
($MM, except per share data)

NYSE: ADS | 1Q2012
6
©2012 ADS Alliance Data Systems, Inc.
Confidential and Proprietary
* Shares covered by counterparty hedge agreements, which the Company has no obligation
to settle.
to settle.
ADS 2012 Guidance
($MM, except per share data)
($MM, except per share data)

NYSE: ADS | 1Q2012
7
©2012 ADS Alliance Data Systems, Inc.
Confidential and Proprietary
Safe Harbor Statement and Forward-Looking Statements
This presentation may contain forward-looking statements within the meaning of Section 27A of the Securities Act of 1933, as
amended, and Section 21E of the Securities Exchange Act of 1934, as amended. Such statements may use words such as
“anticipate,” “believe,” “estimate,” “expect,” “intend,” “predict,” “project” and similar expressions as they relate to us or our
management. When we make forward-looking statements, we are basing them on our management’s beliefs and assumptions,
using information currently available to us. Although we believe that the expectations reflected in the forward-looking statements
are reasonable, these forward-looking statements are subject to risks, uncertainties and assumptions, including the potential
effects of the Epsilon data theft incident, and those discussed in our filings with the Securities and Exchange Commission.
If one or more of these or other risks or uncertainties materialize, or if our underlying assumptions prove to be incorrect, actual
results may vary materially from what we projected. Any forward-looking statements contained in this presentation reflect our
current views with respect to future events and are subject to these and other risks, uncertainties and assumptions relating to our
operations, results of operations, growth strategy and liquidity. We have no intention, and disclaim any obligation, to update or
revise any forward-looking statements, whether as a result of new information, future results or otherwise.
“Safe Harbor” Statement under the Private Securities Litigation Reform Act of 1995: Statements in this presentation regarding
Alliance Data Systems Corporation’s business which are not historical facts are “forward-looking statements” that involve risks and
uncertainties. For a discussion of such risks and uncertainties, which could cause actual results to differ from those contained in
the forward-looking statements, see “Risk Factors” in the Company’s Annual Report on Form 10-K for the most recently ended
fiscal year. Risk factors may be updated in Item 1A in each of the Company’s Quarterly Reports on Form 10-Q for each quarterly
period subsequent to the Company’s most recent Form 10-K.

NYSE: ADS | 1Q2012
8
©2012 ADS Alliance Data Systems, Inc.
Confidential and Proprietary
Financial Measures
In addition to the results presented in accordance with generally accepted accounting principles, or GAAP, the Company
presents financial measures that are non-GAAP measures, such as constant currency financial measures, adjusted EBITDA,
adjusted EBITDA margin, adjusted EBITDA net of funding costs, core earnings and core earnings per diluted share (core EPS).
The Company believes that these non-GAAP financial measures, viewed in addition to and not in lieu of the Company’s
reported GAAP results, provide useful information to investors regarding the Company’s performance and overall results of
operations. These metrics are an integral part of the Company’s internal reporting to measure the performance of
reportable segments and the overall effectiveness of senior management. Reconciliations to comparable GAAP financial
measures are available in the accompanying schedules and on the Company’s website. The financial measures presented
are consistent with the Company’s historical financial reporting practices. Core earnings and core earnings per diluted share
represent performance measures and are not intended to represent liquidity measures. The non-GAAP financial measures
presented herein may not be comparable to similarly titled measures presented by other companies, and are not identical
to corresponding measures used in other various agreements or public filings.