Attached files
| file | filename |
|---|---|
| 8-K - FORM 8-K - POPULAR, INC. | d300404d8k.htm |
 Financial
Results Financial Results
Fourth Quarter 2011
Fourth Quarter 2011
Exhibit 99.1 |
 Forward Looking
Statements The
information
contained
in
this
presentation
includes
forward-looking
statements
within
the
meaning
of
the
Private
Securities
Litigation
Reform
Act
of
1995.
These
forward-looking
statements
are
based
on
management’s
current
expectations
and
involve
risks
and
uncertainties
that
may
cause
the
Company's
actual
results
to
differ
materially
from
any
future
results
expressed
or
implied
by
such
forward-looking
statements.
Factors
that
may
cause
such
a
difference
include,
but
are
not
limited
to
(i)
the
rate
of
growth
in
the
economy
and
employment
levels,
as
well
as
general
business
and
economic
conditions;
(ii)
changes
in
interest
rates,
as
well
as
the
magnitude
of
such
changes;
(iii)
the
fiscal
and
monetary
policies
of
the
federal
government
and
its
agencies;
(iv)
changes
in
federal
bank
regulatory
and
supervisory
policies,
including
required
levels
of
capital;
(v)
the
relative
strength
or
weakness
of
the
consumer
and
commercial
credit
sectors
and
of
the
real
estate
markets
in
Puerto
Rico
and
the
other
markets
in
which
borrowers
are
located;
(vi)
the
performance
of
the
stock
and
bond
markets;
(vii)
competition
in
the
financial
services
industry;
(viii)
possible
legislative,
tax
or
regulatory
changes;
(ix)
the
impact
of
the
Dodd-Frank
Act
on
our
businesses,
business
practice
and
cost
of
operations;
and
(x)
additional
Federal
Deposit
Insurance
Corporation
assessments.
Other
than
to
the
extent
required
by
applicable
law,
the
Company
undertakes
no
obligation
to
publicly
update
or
revise
any
forward-looking
statement.
Please
refer
to
our
Annual
Report
on
Form
10-K
for
the
year
ended
December
31,
2010
and
other
SEC
reports
for
a
discussion
of
those
factors
that
could
impact
our
future
results.
The
financial
information
included
in
this
presentation
for
the
quarter
ended
December
31,
2011
is
based
on
preliminary
unaudited
data
and
is
subject
to
change.
1 |
 2011
Highlights •
Net Income for the year amounted to $151 million
Strong NIM of 4.34%
Provision for loan losses down 43% from prior year
•
Net income of $3 million in Q4; fourth consecutive profitable quarter
Results include a one-time expense of $15.6 million due to employee retirement
window
Improved credit quality trends
–
Provision for non-covered loans fell $26.8 million to $123.9 million on
linked-quarter basis
–
PR commercial/construction NPL inflows declined 52% in Q4; credit review of the
portfolio was completed
–
Net charge offs of non-covered loans in Q4 were down 7% to $126 million
•
Ended the year with strong capital and well positioned for improved results in 2012
2 |
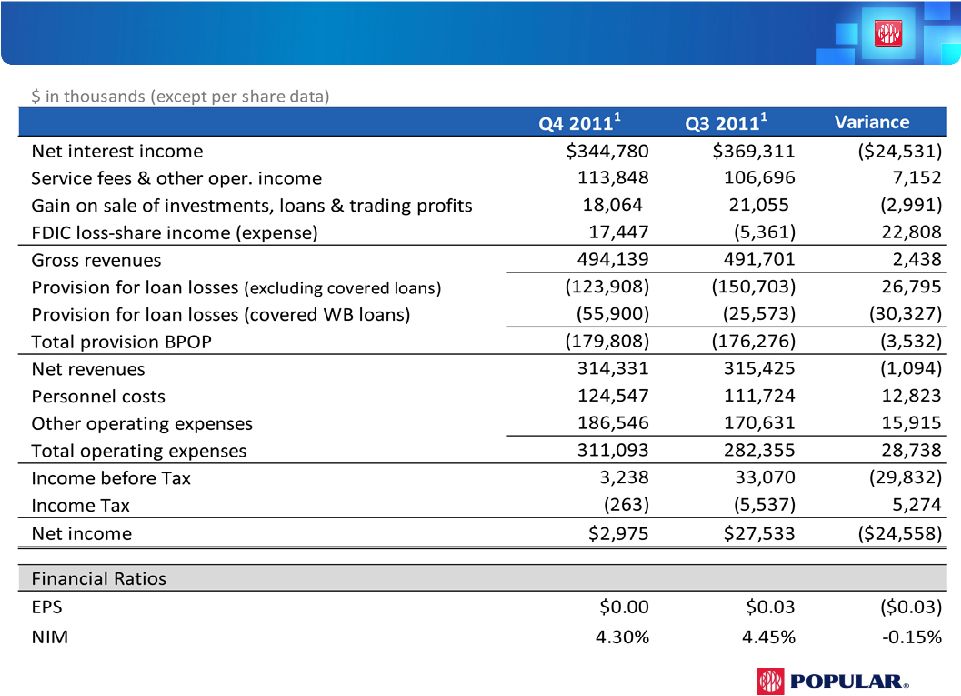 Financial
Results 3
¹
Unaudited |
 Q4 vs. Q3 2011
Adjusted Variances (in millions) 4
($In millions)
Q4 vs. Q3 variance as reported
(30)
$
Adjustments
Gain on sale of securites Q3
8
Gain on sale of securites Q4
3
Variance
5
Retirement window Q4
16
Adjusted negative variance
(9)
$
Covered loans
(17)
$
Mortgage loans
(8)
(25)
FDIC loss share increase:
Accretion of indemnification asset
2
ASC 310-20 and provision-mirror acct.
21
23
Other Income:
Serv charges & other fees
(3)
Gain on sale & indemnity reserves
2
Other operating income
10
9
43
Covered loans
(30)
US
(16)
(3)
Other Expenses
(13)
Detailed variances
(9)
$
Provision:
Provision BPPR - non-covered
Lower net interest income:
Explanation
Variance in pre-tax income |
 10.94%
14.52%
15.79%
7.99%
12.10%
15.97%
17.25%
8.62%
Tier 1 Common
Tier 1 Capital
Total Capital
Tangible Common Equity
Capital Ratios
5
1
See
the
earnings
press
release
for
reconciliation
of
Common
Stockholders
Equity
(GAAP)
to
Tier
1
Common
Equity (Non-GAAP).
2
Minimum Regulatory Requirements for Well Capitalized
Q3
2011
Q2
2011
Q3
2010
1
•
There is no specific plan at this time for TARP repayment nor any obligation to accelerate a
total or partial payment
•
Any repayment of TARP will be done in a manner that protects shareholder value and will be
subject to regulatory approval
•
As of year end, the unamortized TARP discount amounted to $466 million
•
Including the discount amortization, the effective cost of TARP capital in Q4 was 16% of the
accreting book value, or 7.8% of the par amount of $935 million
•
Interest expense for 2011: $72.5 million
coupon $46.8 million
discount amortization $25.7 million
•
Strong capital ratios
Q4
2010
Q4
2011
Q4
2010
Q4
2011
Q4
2011
Q4
2010
5%²
6%²
10%²
Q4
2011
Q4
2010 |
 6
Consolidated Credit Summary
•
NPAs
have
decreased
since
Q4
10
principally
driven
by
the
sale
of
non-performing
loans
•
NCOs
slightly
declined
in
the
fourth
quarter,
although
experiencing
variability
within
the
portfolios
•
Provision
for
loan
losses
for
2011
was
down
43%
vs
2010
•
Allowance
&
allowance
to
loans
coverage
ratio
remained
relatively
flat
Excluding covered loans
$ in millions
Q4 11
Q3 11
Q4 11 vs
Q3 11
Q4 10
Q4 11 vs
Q4 10
Loans Held to Maturity (HTM)
$20,602
$20,674
-0.35%
$20,728
-0.61%
Loans Held for Sale
363
369
-1.63%
894
-59.40%
Total Non Covered Loans
$20,965
$21,043
-0.37%
$21,622
-3.04%
Non-performing assets (inc OREO)
$2,173
$2,158
0.70%
$2,405
-9.65%
NPLs HTM to loans HTM
8.44%
8.38%
0.06%
7.58%
0.86%
Net charge-offs
$126
$135
-6.67%
$478
-73.64%
Net charge-offs to average loans HTM
2.46%
2.64%
-0.18%
8.82%
-6.36%
Provision for loan losses
$124
$151
-17.88%
$354
-64.97%
Provision to total loans HTM
2.41%
2.92%
-0.51%
6.83%
-4.42%
Provision for loan losses to net charge-offs
0.98x
1.11x
-0.13x
0.74x
0.24x
Allowance for loan losses
$690
$693
-0.43%
$793
-12.99%
Allowance for loan losses to loans (excl. LHFS)
3.35%
3.35%
0.00%
3.83%
-0.48%
Allowance for loan losses to NPLs HTM
39.73%
39.99%
-0.26%
50.46%
-10.73% |
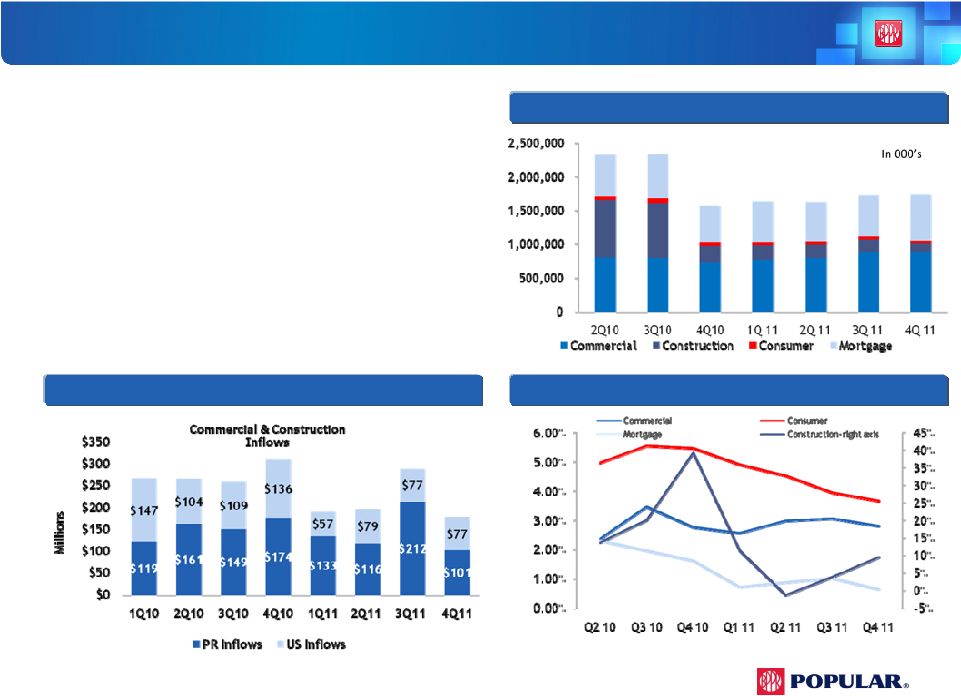 Non-Performing Loans-
Popular, Inc.
Commercial & Construction NPL Inflows
Credit Quality Overview-
•
NPLs increased by $6 million in Q4 driven by higher PR
mortgage offset by reductions in construction. The
increase in Q3 was $107 million.
•
NCO ratio for Q4 was 2.46% ($126 million) vs. 2.64%
($135 million) in Q3, driven by PR C&I and consumer
portfolio
•
Inflow of NPLs in the PR commercial & construction
portfolios are lower ($111 million) given completion of
the credit review
•
For the year total NPL inflows for the commercial &
construction portfolios are down 22%
7
Excludes Covered Loans & LHFS
Net Charge Offs-Popular, Inc. ¹
1
Excludes net charge-offs of $210 million in commercial and construction loans as
a result of charging-off collateral dependent loans more promptly in Q4
10. |
 2011
Highlights •
First year of operational profitability
since 2006
Further expanded strong margin
Reduced credit cost by 43% from
2010
Strengthened capital position
Executed on asset acquisitions
•
Improved credit profile
Completed NPL asset sales in PR
and US
Registered improvement in
credit trends in PR
Experienced substantial
improvement in US
Summary & Outlook
8
2012 Strategy
•
Further improve credit risk profile
•
Add low-risk assets
•
Expand efficiency efforts
•
Continue improvement at BPNA
Well positioned to improve results in 2012
•
2012 target range net income of $185
million to $200 million
Driven primarily by a reduction in
the provision expense |
 Appendix
 |
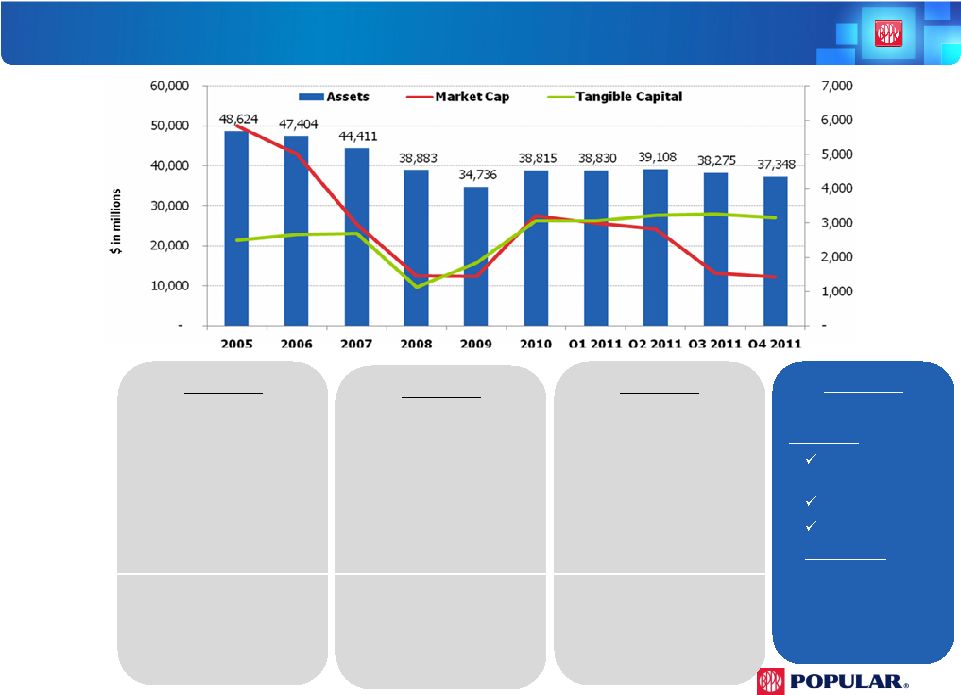 2005/2006
•
Aggressive diversification
consisting of Puerto Rico, the
U.S. and the Caribbean;
revenue diversification
through EVERTEC
•
Focused on growing U.S.
banking and mortgage
businesses (PFH & ELOAN )
2007/2008
•Reorganized
U.S. operation to exit high-risk businesses
•Shut
down U.S. consumer finance businesses (PFH &
ELOAN) & Texas region
•Acquisition
of P.R. Citibank retail business
2009/2010
•
Focused on ensuring
capital and BHC liquidity
adequacy and participating
in the P.R. banking
consolidation
•
Raised common equity,
completed EVERTEC sale &
Westernbank transaction
2005
2006
2007
2008
2009
2010
Net Income (Loss)
$541M
$358M
($64M)
($1,244M)
($574M)
$137M
Tier 1 Common
7.98%
7.73%
7.08%
3.19%
6.39%
10.95%
NPL/Loans
1 .77%
2.24%
2.75%
4.67%
9.60%
7.58% ¹
FTEs
13,210
12,508
12,303
10,587
9,407
8,277
Where We Are Coming From
10
Strategy
Financials
2011/2012
•
Focused on:
Puerto Rico
Credit risk profile
improvement
Efficiency
Asset acquisition
United States
•Repositioning
as community bank
•Continued
attention to asset quality and
efficiency
¹
Excludes covered loans |
  P.R. &
US Business 11
1
Excludes covered loans
$ in millions (Unaudited)
Q4 11
Q3 11
Variance
Q4 11
Q3 11
Variance
Net Interest Income
$299
$321
($22)
$73
$73
($0)
Non Interest Income
136
118
18
21
18
3
Gross Revenues
435
439
(4)
94
91
3
Provision (non-covered)
(88)
(131)
43
(36)
(20)
(16)
Provision (covered WB)
(56)
(26)
(30)
-
-
-
Provision for loan losses
(144)
(157)
13
(36)
(20)
(16)
Expenses
(253)
(221)
(32)
(60)
(61)
1
Tax (Expense) Benefit
(4)
(7)
3
(1)
(1)
(0)
Net Income (Loss)
$34
$54
($20)
($3)
$9
($12)
NPLs (HTM) ¹
$1,371
$1,337
$34
$367
$395
($28)
NPLs (HTM + HFS) ¹
1,620
1,597
23
380
395
(15)
Loan loss reserve
578
524
54
237
249
(12)
Assets
$28,423
$29,202
($779)
$8,581
$8,720
($139)
Loans (HTM)
19,159
19,210
(51)
5,762
5,946
(184)
Loans (HTM + HFS)
19,507
19,575
(68)
5,778
5,949
(171)
Deposits
21,850
21,727
123
6,168
6,292
(124)
NIM
4.97%
5.15%
-0.18%
3.68%
3.62%
0.06%
PR
US |
 Credit Ratings
Update •
Our senior unsecured ratings have been gradually improving
since 2010:
Moodys:
Ba1
Negative Outlook
S&P:
B+
Stable Outlook
Fitch:
B+
Positive Outlook
•
Feb, 2011: Fitch raised our senior unsecured rating by one
notch to B+
•
July, 2011: S&P raised our senior unsecured rating by one notch
to B+
•
As the P.R. economy stabilizes and our credit metrics improve,
we should see upward pressure on the ratings
12 |
 TARP Capital
Accounting Overview •
In 2009, we exchanged $935 million in perpetual preferred shares
we issued to the US Treasury in
2008, for perpetual trust-preferred securities (“Trups”) with the same terms and
conditions The coupon remained unchanged at 5%, stepping up to 9% in 12-2013
•
Under GAAP, the Trups were marked to market resulting in a gain of approximately $485.3
million million which was taken into retained earnings in 8-2009
the discount rate assumed for the valuation was 16%
the book value of the Trups was written down to approximately $416M million
The discount is being amortized throughout a 30-year period using the level-yield
method to result in an effective cost of 16% of book value
•
In 2011, the interest expense booked related to the Trups was $72.5 million:
Coupon payment of $46.8 million
Discount amortization of $25.7 million
The effective cost was 16% of the average book value, or 7.8% of
the par amount of $935 million
The outstanding discount as of 12-31-2011, was approximately $466 million
13 |
 Financial
Results Financial Results
Fourth Quarter 2011
Fourth Quarter 2011 |