Attached files
| file | filename |
|---|---|
| 8-K - FORM 8-K - AGILYSYS INC | d300482d8k.htm |
 February 2012
1
Exhibit 99.1
Company Overview |
 2
Forward-looking statements & non-GAAP financial
information
Forward-Looking Language This
Quarterly Report contains certain management expectations, which may constitute forward-looking information within the meaning of
Section 27A of the Securities Act of 1933, Section 21E of the Securities and Exchange Act of 1934, and
the Private Securities Reform Act of 1995. Forward-looking information speaks only as to
the date of this Quarterly Report and may be identified by use of words such as “may,”
“will,” “believes,” “anticipates,” “plans,”
“expects,” “estimates,” “projects,” “targets,” “forecasts,” “continues,” “seeks,” or the negative of those
terms or similar expressions. Many important factors could cause actual results to be materially
different from those in forward-looking information, including, without limitation,
competitive factors, disruption of supplies, changes in market conditions, pending or future claims or
litigation, or technology advances. No assurances can be provided as to the outcome of cost
reductions, expected benefits and outcomes from our recent ERP implementation, business
strategies, future financial results, unanticipated downturns to our relationships with
customers and macroeconomic demand for IT products and services, unanticipated difficulties
integrating acquisitions, new laws and government regulations, interest rate changes,
consequences related to the concentrated ownership of our outstanding shares by MAK Capital,
unanticipated deterioration in economic and financial conditions in the United States and around the world or the consequences
associated with the sale of the Company’s TSG business, and uncertainties regarding restructuring
actions and the relocation of the Company’s corporate headquarters. The Company does not
undertake to update or revise any forward-looking information, even if events make it clear
that any projected results, actions, or impact, express or implied, will not be realized.
Other potential risks and uncertainties that may cause actual results to be materially different from
those in forward-looking information are described in “Risk Factors,” which is
included in Part I, Item 1A of the Company’s Annual Report for the fiscal year ended March 31, 2011.
Use of Non-GAAP Financial Information To
supplement the unaudited condensed consolidated financial statements presented in accordance with U.S. GAAP in this presentation,
certain non-GAAP financial measures as defined by the SEC rules are used.
Management believes that such information can enhance investors' understanding of the Company's
ongoing operations. The non-GAAP measures included in this presentation have been
reconciled to the comparable GAAP measures within an accompanying table, shown on the last page
of this presentation. |
 Quick
Facts Summary
•
Leading developer and marketer of proprietary enterprise software, services and
solutions to the hospitality and retail industries
•
Two
reportable
businesses:
Hospitality
Solutions
Group
(“HSG”)
develops
and
markets
proprietary
software
for
hospitality
markets
and
Retail
Solutions
Group
(“RSG”)
is a system integrator of store front technology for retailers
Formed:
1963
Ticker symbol:
AGYS (NASDAQ)
Market capitalization:
~$175 million
Capital structure as of 12/31/11:
Debt-free
Fiscal
2011
sales
1
:
$201 million
Markets served as % of revenue:
94% North America
6% Asia and Europe
Employees:
800
Corporate HQ:
Solon, Ohio (relocating to Alpharetta, GA)
(1) March
31
st
fiscal
year:
excludes
TSG
which
was
divested
7/31/11
3
Agilysys: overview |
 FY
12 Initiatives •
Sold non-core asset
•
Restructured the business
•
New management team
•
Relocated corporate headquarters
•
Returned capital to shareholders
Expected Impact
•
Business performance improvement
•
Pursue highest quality revenue
•
Improve ROIC
•
Streamlined operations, software and
services management team
•
Reduced corporate costs, reposition
corporate closer to revenue generating
activities
•
Eliminating $14-$16m of expense,
realizing $16-$18m of restructuring
expense, primarily realized in FY12
•
Repurchased 1.6m shares,
approximately 7%
•
Permitting investors who choose to leave
the stock to exit
4
Focused Business Strategy |
 5
5
Business Emphasis
Investor Returns
•
Serve large end markets that use
technology as a value differentiator
•
Improve guest experience in hospitality
and retail through best-in-class products
and services
•
Maintain solution leadership through
market-focused product development
•
Deploy shareholder capital in pursuit of
highest value added activities
•
Exceed market rate growth with highest
quality revenue available
•
Peer-leading performance metrics
•
Price leadership
•
Most efficient provider
•
Capital allocation
•
Apply capital to highest margin
opportunities
•
R&D spend based on line of sight to return
on investment
•
Value creating M&A opportunities
Aligning business focus and investor returns
Deliver profitable growth, generating strong investment returns for shareholders |
 •
Hospitality customers can rely
on HSG to deliver:
•
Enterprise applications
•
Hardware enabling our complete
array of enterprise applications
•
Recurring services such as
software maintenance and
hosting or SaaS offerings
•
Implementation and training
services as well as help desk
support
6
Help Desk
Enterprise
Applications
Complementary
Offerings
Hardware
Hosting
(SaaS)
Training
Agilysys
Hospitality
Solutions
Agilysys Hospitality Solutions
Implementation
Software
Maintenance |
 Document
Management Central Reservation
Mobility
•
G360 capabilities
•
Buy/build capabilities
•
POS (IG Roam)
•
PMS (iPad enabled)
•
RSG (mPOS)
Property Management
Inventory & Procurement
Point of Sale
•
New product 1QFY13
•
SOA architecture
•
Lighter installation
services
7
Market Leading Products
Best in class point solutions for the markets we service |
 8
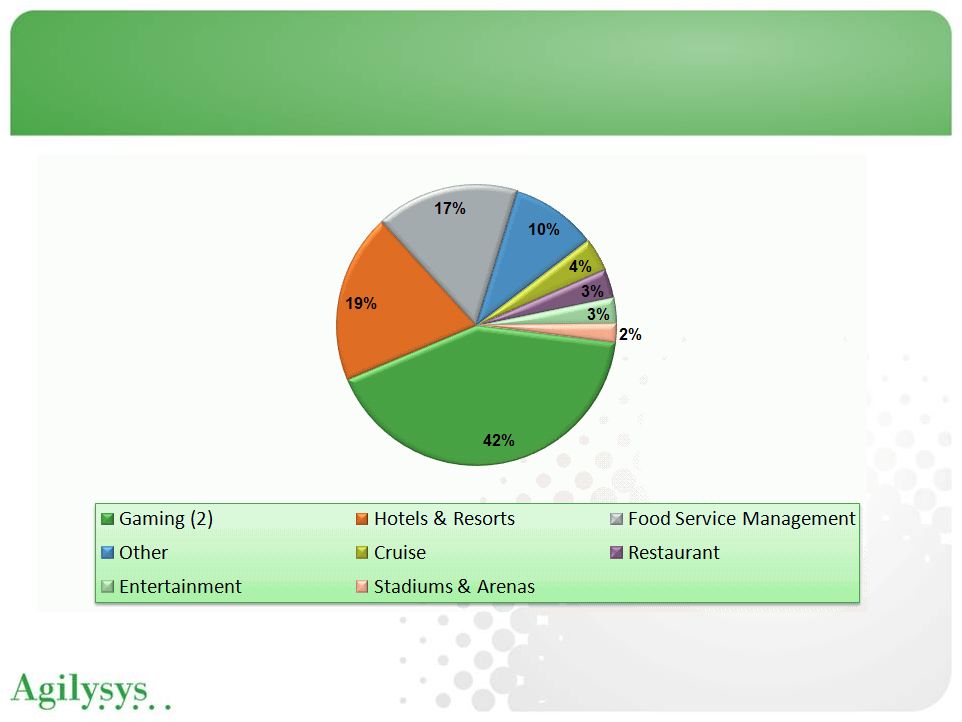
Notes:
1.
Based on Nine Months Ended 12/31/11
2.
Includes Commercial and Tribal Gaming
HSG Markets Served
1 |
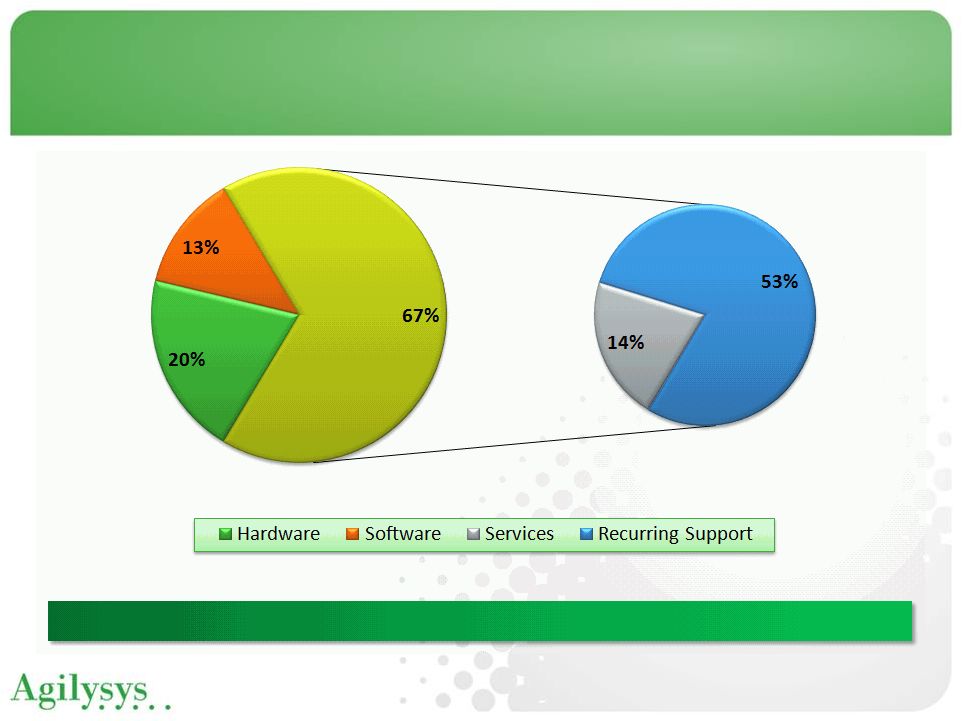 9
(1) TTM, Quarter ending 12/31/11
HSG Revenue Profile
Balanced revenue mix driven by proprietary software |
 •
Agilysys Retail Solutions provides:
•
Integration of end-to-end in-store technology solutions
•
Unparalleled expertise in POS and Mobility solutions
•
Personnel with an average of 18 years experience in the retail market
•
Agilysys Retail Solutions is:
•
Solution partner for IBM Retail Store Solutions receiving the IBM RSS
Excellence Award for 16 consecutive years (since the award’s inception)
•
Large Motorola Enterprise Mobility Solutions Partner and also one of
Motorola’s largest Enterprise Mobility Wireless (WLAN) Partners
•
Verifone Premier Partner
10
Agilysys Retail Solutions |
 •
Lifecycle management of
store-centric business
systems
•
Higher ROI and lower TCO
•
Servicing the needs of
smart consumers
•
Point-of-Sale
•
Customer Self-Service
•
Mobile Point-of-Service
•
Mobile Store Managers
•
Mobile Store Associates
11
Agilysys Retail Solutions
Agilysys
Retail
Services
Consulting
Software
Development
Project
Management
Integration
Implementation
Equipment
Disposal
Maintenance
24x7 Help
Desk |
 12
Note:
1.
Based on Nine Months Ended 12/31/11
RSG Markets Served
1 |
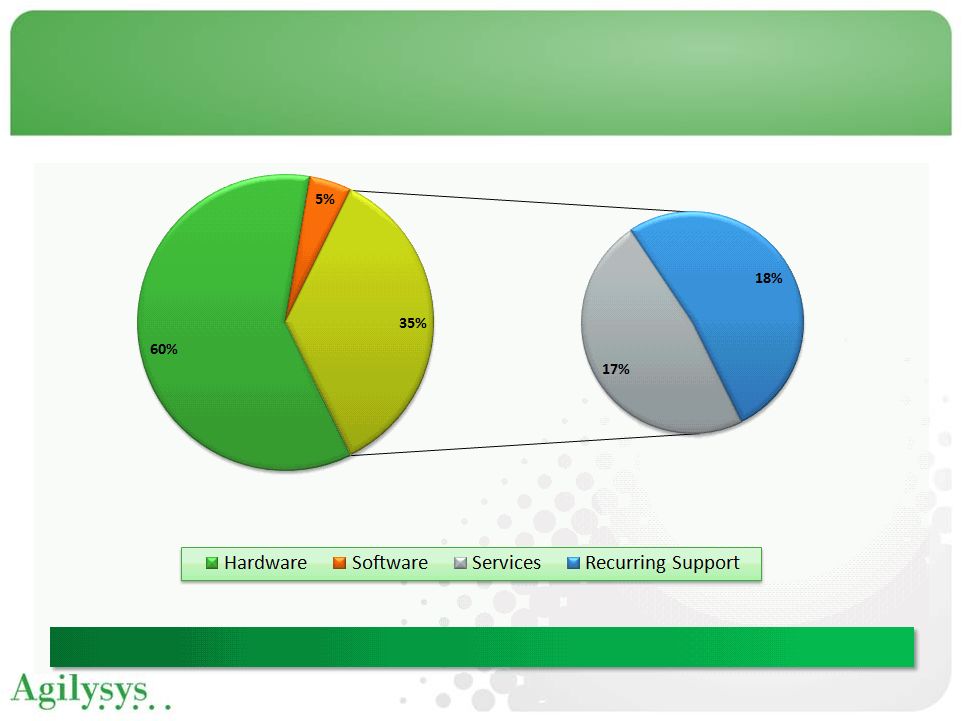 13
(1) TTM, Quarter ending 12/31/11
RSG Revenue Profile
Comprehensive proprietary services differentiates RSG from other system integrators |
 Market Opportunities
•
Large installed base with untapped capacity to
deliver multiple point solutions
•
Increase participation in new market segments
through focused investment
•
Deliver on market demand from their
investment in guest facing business systems
•
Enhanced guest experiences leading to
increased revenue opportunities
•
Intelligent reporting for improves decision making
•
Reduce operating expenses
•
Mobility-enabled solutions
•
No clear end-to-end hospitality solution
Key Initiatives
Software
•
•
•
•
•
Services
•
•
•
•
14
Market Opportunities and Key Initiatives
Pursue highest margin revenue opportunities in markets we service
Strengthen best in class portfolio
Increase investment in mobility enabled
solutions
Enterprise solutions through integrated
software assets
Customer and market driven technology
delivery (Above/On Premise, SaaS, Mobility)
Guest centric business intelligence & reporting
Develop/acquire higher margin solution
offerings
Extend mobility initiatives
Pursue higher margin service engagements
Expand specialty retail and franchise business |
 •
Invest in existing products and new products to increase software sales
•
Continue product development refresh to latest technologies
•
Mobility enabled solutions
•
Enterprise solutions through integrated software assets
•
Customer and market driven technology deliver (SaaS, Mobility)
•
Pursue highest margin revenue opportunities in markets we service
•
Increase penetration of new market opportunities in food service
management, cruise, specialty retail, franchised retailers and chain hotels
•
Partner for international expansion —
currently we derive less than 10% of
revenue from international customers
•
Pursue M&A opportunities in pursuit of technology and markets
•
Align current and future R&D spend with line of sight return on
investment 15
Earnings Growth Focus |
 16
Appendix |
 17
17
•
Prior period adjustments associated with fiscal
years prior to 2012, negatively impacted
current fiscal year results by reducing revenue
by $1.0 million and gross profit by $1.1 million
•
Adjusted revenue grew approximately 1.4%
year over year
•
Gross margins improved to approximately
38.1%
•
Adjusted EBITDA, excluding charges and one-
time items was a loss of $2.7 million compared
to a loss of $8.8 million in the previous year
•
Restructuring charges of $8.0 million primarily
relate to costs associated with relocating
headquarters to Atlanta and other cost-saving
initiatives
•
Other income in prior year includes gain on
company-owned life insurance policy
•
Income tax benefit in current year reflects
realized tax benefit from sale of TSG
•
Net loss per share narrowed to $0.26,
compared with $0.46 in the prior year
FY12 fiscal-to-date (FTD) review: consolidated
results
Statement of Operations ($Mil., except per-share)
FTD Year-over-Year Commentary
2011
2010
%
Net sales
$156.9
$155.7
0.7%
Cost of goods sold
$97.8
$99.9
(2.0%)
Gross profit
$59.0
$55.9
5.7%
37.6%
35.9%
SG&A (excl. depr. & amort.)
$63.6
$65.4
(2.8%)
Depreciation & amortization
$8.6
$6.5
32.3%
Asset impairment charge
$0.0
$0.1
(100.0%)
Restructuring charges
$8.0
$0.4
1859.1%
Operating loss
($21.2)
($16.5)
Other expense/(income), net
$0.3
($2.3)
Interest expense, net
$0.9
$0.8
Loss before income taxes
($22.4)
($15.0)
Income tax (benefit)/expense
($6.2)
$0.5
Loss from cont. ops.
($16.2)
($15.5)
Income from disc. ops., net of taxes
$10.4
$5.0
Net income/(loss)
($5.8)
($10.5)
Basic and diluted loss per share:
Net (loss) from continuing operations
($0.72)
($0.68)
Net income from discontinued operations
$0.46
$0.22
Net (loss) income
($0.26)
($0.46)
Adjusted EBITDA
($2.7)
($8.8)
(1.7%)
(5.6%)
Nine Months Ended
Dec 31 |
 18
18
Dec 31,
March 31,
(In thousands, except share data)
2011
2011
ASSETS
(Unaudited)
Current assets:
Cash and cash equivalents
$ 44,061
$ 70,559
Short-term investments - available for sale
39,994
-
Accounts receivable, net
30,055
31,926
Inventories, net
11,694
10,921
Deferred income taxes – current
17
-
Prepaid expenses
3,356
2,829
Income taxes receivable
1,460
1,403
Other current assets
8,524
6,344
Assets of discontinued operations – current
-
105,810
Total current assets
139,161
229,792
Goodwill
15,084
15,211
Intangible assets, net
21,611
22,535
Other non-current assets
3,781
11,709
Assets of discontinued operations – non-current
-
8,296
Property and equipment, net
19,136
24,855
Total assets
$ 198,773
$ 312,398
LIABILITIES AND SHAREHOLDERS’ EQUITY
Current liabilities:
Accounts payable
$ 20,603
$ 17,852
Deferred revenue
13,318
23,995
Accrued and other current liabilities
20,888
14,594
Income taxes payable
626
265
Deferred income taxes – current
-
77
Capital lease obligations – current
819
999
Liabilities of discontinued operations – current
-
89,005
Total current liabilities
56,254
146,787
Deferred income taxes – non-current
4,043
3,894
Capital lease obligations – non-current
499
907
Other non-current liabilities
6,133
11,972
Liabilities of discontinued operations – non-current
-
734
Shareholders’ equity:
Common shares, without par value, at $0.30 stated
value; authorized 80,000,000 shares; 31,606,831
issued; and 21,972,661 and 23,022,398 shares
outstanding at December 31, 2011 and March 31,
2011, respectively
9,482
9,482
Treasury shares (9,634,170 shares at December 31,
2011 and 8,584,433 at March 31, 2011)
(2,892)
(2,575)
Capital in excess of stated value
(15,378)
(5,421)
Retained earnings
140,854
146,659
Accumulated other comprehensive loss
(222)
(41)
Total shareholders’ equity
131,844
148,104
Total liabilities and shareholders’ equity
$ 198,773
$ 312,398
Balance Sheet as of 12/31/11 |
 19
19
2011
2010
2011
2010
Net loss from continuing operations
(5,774)
$
(2,290)
$
(16,208)
$
(15,498)
$
Plus:
Interest expense, net (a)
56
164
315
426
Income tax (benefit) expense
(1,353)
(2,947)
(6,209)
505
Depreciation and amortization
expense 3,764
2,463
10,003
7,669
Other expenses (income), net
22
(321)
293
(2,281)
Adjusted EBITDA (b)
(3,285)
$
(2,931)
$
(11,806)
$
(9,179)
$
Restructuring charges
3,238
3
7,954
406
Impact from revision to prior period financial
statements -
(140)
1,127
(79)
Asset impairment expense
-
-
-
59
Adjusted EBITDA excluding charges and
one-time items (47)
$
(3,068)
$
(2,725)
$
(8,793)
$
(a) Interest expense excludes amortization of deferred financing fees
totaling $0 and $131 for the three
months ended December 31, 2011 and 2010, respectively, and $568 and $393 for the nine months ended
December 31, 2011 and 2010,
respectively. (b) Non-GAAP financial measure
(In thousands)
Three Months Ended
December 31,
Nine Months Ended
December 31,
Reconciliation of loss from continuing operations to
adjusted EBITDA excluding charges |