Attached files
| file | filename |
|---|---|
| 8-K - USA TRUCK INC | form8k-02062012.htm |

USA Truck Announces Fourth Quarter Results
VAN BUREN, ARKANSAS February 6, 2012
USA Truck, Inc. (NASDAQ: USAK) today announced base revenue of $100.3 million for the quarter ended December 31, 2011, a decrease of 1.7% from $102.0 million for the same quarter of 2010. We incurred a net loss of $4.4 million, $0.42 per share, for the quarter ended December 31, 2011, compared to a net loss of $1.8 million, $0.17 per share, for the same quarter of 2010.
Base revenue increased 6.2% to $411.0 million for the twelve months ended December 31, 2011, from $386.9 million for the same period of 2010. We incurred a net loss of $10.8 million, $1.05 per share, for the twelve months ended December 31, 2011, compared to a net loss of $3.3 million, $0.32 per share, for the same period of 2010.
Cliff Beckham, President and CEO, made the following statements:
“During the fourth quarter, industry-wide freight volumes were solid on a seasonally adjusted basis. The ATA tonnage index increased 7.4% over the fourth quarter of 2010 and most U.S. economic indicators improved versus the third quarter of 2011. We believe industry-wide trucking capacity remained in relative balance with demand, as qualified truck drivers remain scarce and the average age of tractors in our industry continues to hold at record-high levels. According to the Cass Truckload Linehaul Index, freight rates increased compared with the fourth quarter of 2010.
“Consistent with that operating environment, revenue in our SCS operating segment doubled to $23.0 million and its operating income increased 167.7% to $1.6 million as we continue to integrate and cross-sell SCS services with our traditional Trucking services.
“Overall, however, our financial results are disappointing. Our cost control efforts in our Trucking segment were effective, but we simply did not make the necessary progress on load volume or pricing during the quarter. Nevertheless, we believe that improvements in our underlying operational performance will support higher freight volumes and rates, and that the economic environment entering 2012 affords us a sound foundation for gaining asset utilization and profitability.
“To review, our third quarter was marred by significant difficulties in implementing a new enterprise management software system. These difficulties caused a lack of visibility of freight in our system and numerous customer service disruptions. The service failures and lack of confidence in booking freight caused us to lose a percentage of our loads with many customers, often the most operationally demanding, highest paying loads. Compounding this situation, we phased out service on two major accounts, one due to the end of a project and one due to inadequate pricing. Although we did not expect to have this freight long-term, replacing approximately 6.2% of our loads in one quarter has depressed our utilization and our rate structure while we replace the freight. These problems and the resulting lower miles also accelerated turnover in our driver base.
“The first step in our action plan to address this situation was to increase our senior management's depth of operating experience in regional markets. In August, we hired a proven regional operator, David Hartline, to lead our Trucking segment as Chief Operating Officer. During the fourth quarter, we filled key positions in customer service, load planning and driver recruiting with highly experienced personnel from outside the Company. In addition, we consolidated the sales and operations reporting in our Trucking business and, in January, replaced our former head of marketing and sales. These personnel moves were important, and we believe they positioned us for better long-term execution in our markets. Under new sales and operations leadership, we introduced the next generation of our defined freight network that we call “Spider Web 2.0.” Spider Web 2.0 draws on the experience of Mr. Hartline's team to narrow our operational focus to less than 1,000 lanes, targeting specific regional markets in which to build freight density. Under a fresh philosophy and more effective methods introduced by new driver recruiting leadership, we have posted steady improvements in our unmanned tractor count.
“The second step in our plan was to improve critical operating metrics to re-establish our load base with customers and afford us momentum for increasing load volumes and rates. The key metrics we focused on initially were manned trucks, core customer on-time service, weekly load count, and load velocity. After several months of intense work in installing new operations and sales leadership teams and training our people on new processes and procedures, we are beginning to see signs of progress. The attached charts (Unmanned Tractors, On-Time Service and Load Velocity) record the sharp decline in operating performance we experienced during the third quarter, the flattening of most metrics during the fourth quarter, and an improvement in most metrics beginning in January.
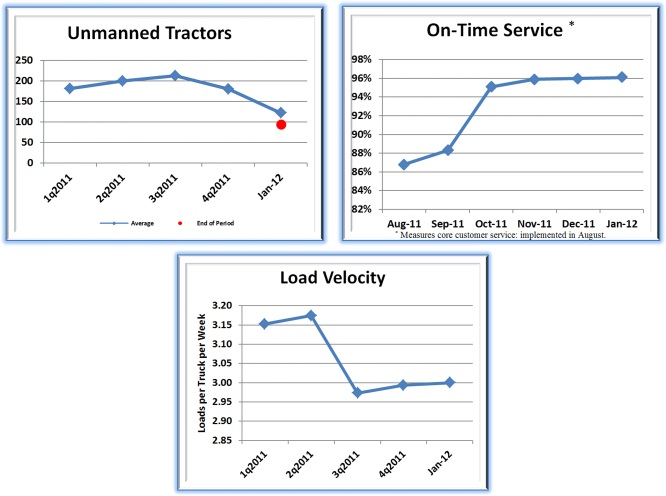
“As reflected in the charts, we are currently operating with more manned trucks, better customer service, more loads per week, and greater velocity than when we started this process in the third quarter. Improved discipline has contributed to a reduction in reportable accidents per million miles as well. And, the trend has continued as reportable accidents in January 2012 are less than they were during January 2011. We believe these metrics are important and will support improved operations. It is critical, however, that we continue to improve and convert a stronger operational base into more miles and higher rates from our customers.
“The third step in our plan was to identify cost-savings measures that could help us immediately offset some of the lower asset utilization we were experiencing. The cost control efforts we identified were effectively implemented during the fourth quarter. We expect an annual run-rate of $5.6 million in cost savings beginning in January, and we remain committed to controlling our costs and are looking for additional opportunities for 2012.
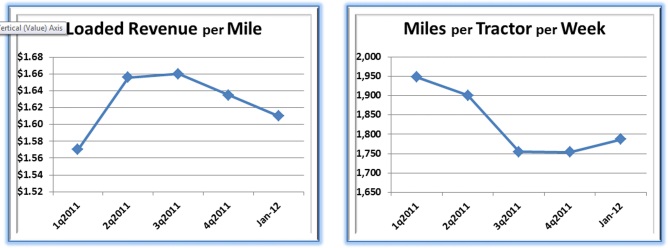
“To date, the operational gains have been offset, from a financial perspective, with higher non-revenue miles, pressure on freight rates associated with replacing lost loads and adding loads to offset the shortening length-of-haul. Tractor utilization (miles per tractor) has begun to turn positive sequentially in January, but we believe it will take until the second half of 2012 until we have sufficient freight to improve revenue per mile on a year-over-year basis. The attached charts (Miles per Tractor per Week and Loaded Revenue per Mile) reflect the incipient progress on tractor utilization and work to be done on revenue per mile.
“Looking ahead to 2012, we are cautiously optimistic. January miles and velocity (miles per tractor per week) have both improved over what we experienced during the second half of 2011, which is contrary to normal seasonality, and recent customer bid awards have netted us additional loads. We believe those additional loads will not only add much-needed volume to our network, but will also afford us the opportunity to prune less profitable freight currently in our system.
“In addition, we recently completed an in-depth analysis of our business and developed a detailed 2012 operating plan. This plan has specific goals and metrics as well as accountability in every department. The plan was thoroughly reviewed by our board of directors and an independent third party as part of its adoption. Based on specific programs we have in place, we expect additional, sequential improvements in customer service, safety, manned tractors, and fixed costs. Assuming achievement of these underlying fundamentals, moderate economic growth, and stable trucking capacity and fuel prices, we expect to improve our performance meaningfully in 2012 versus 2011.
“In order to help us accomplish this improved performance, we were fortunate to be able to add a new Director to our Board with skills and experience to complement those of our existing Directors. We appreciate his desire to join us in our efforts.
“Mr. Robert A. Peiser has broad-based executive, director and management experience with companies in transition in a variety of domestic and international industries including transportation, food and beverage, technology services, retailing, distribution and manufacturing. Mr. Peiser’s director experiences include both profit and not-for-profit companies and he has served in an advisory capacity to a private equity firm. Mr. Peiser holds an MBA degree in Finance and Management Control from Harvard University and a BA degree in Economics from the University of Pennsylvania. Mr. Peiser stated, “I welcome the opportunity to join USA Truck’s Board of Directors and look forward to assisting the Company’s management implement its strategy and achieve its long-term goals.”
Darron Ming, Executive Vice President and Chief Financial Officer of the Company, added the following statement concerning liquidity and capital resources:
“At December 31, 2011, we had $8.9 million available under our revolving credit agreement and $54.0 million available through equipment financing commitments. During the fourth quarter of 2011, we purchased 55 tractors while disposing of 185 tractors and 94 trailers, which resulted in a net capital expenditure of $0.6 million. We generated $12.5 million in free cash flow (cash flow from operations less cash used in investing activities) during the fourth quarter, which contributed toward an $8.7 million reduction in debt as compared to the third quarter. We expect our net capital expenditures in 2012 to total $55.0 million. At December 31, 2011, we were in compliance with all our debt covenants. And, in response to the current economic environment, we are currently in discussions with the Administrative Agent of our Credit Agreement in an effort to revise some of our debt covenants, which we believe will allow us more flexibility as we implement our action plan. We expect to have those revisions completed during the first quarter of 2012.”
The following table summarizes the results of operations information of USA Truck, Inc. (“Company”) for the three and twelve month periods indicated:
|
USA TRUCK, INC.
|
|||||||||||
|
CONSOLIDATED STATEMENTS OF OPERATIONS
|
|||||||||||
|
(UNAUDITED)
|
|||||||||||
|
(in thousands, except per share data)
|
|||||||||||
|
Three Months Ended
|
Twelve Months Ended
|
||||||||||
|
December 31,
|
December 31,
|
||||||||||
|
2011
|
2010
|
2011
|
2010
|
||||||||
|
Revenue:
|
|||||||||||
|
Trucking revenue (1)
|
$
|
81,000
|
$
|
91,904
|
$
|
343,941
|
$
|
351,965
|
|||
|
Strategic Capacity Solutions revenue
|
19,257
|
10,102
|
67,085
|
34,918
|
|||||||
|
Base revenue
|
100,257
|
102,006
|
411,026
|
386,883
|
|||||||
|
Fuel surcharge revenue
|
25,945
|
20,084
|
108,382
|
73,278
|
|||||||
|
Total revenue
|
126,202
|
122,090
|
519,408
|
460,161
|
|||||||
|
Operating expenses and costs:
|
|||||||||||
|
Salaries, wages and employee benefits
|
34,309
|
33,718
|
136,538
|
132,445
|
|||||||
|
Fuel and fuel taxes
|
32,740
|
31,055
|
137,195
|
114,915
|
|||||||
|
Purchased transportation
|
31,002
|
24,023
|
120,076
|
79,601
|
|||||||
|
Depreciation and amortization
|
11,772
|
12,508
|
49,263
|
49,754
|
|||||||
|
Operations and maintenance
|
10,236
|
10,154
|
42,179
|
36,086
|
|||||||
|
Insurance and claims
|
5,356
|
5,981
|
22,501
|
22,811
|
|||||||
|
Operating taxes and licenses
|
1,343
|
1,420
|
5,460
|
5,652
|
|||||||
|
Communications and utilities
|
1,258
|
979
|
4,395
|
3,948
|
|||||||
|
Gain on disposal of revenue equipment, net
|
(711)
|
(232)
|
(3,615)
|
(320)
|
|||||||
|
Other
|
4,716
|
4,246
|
18,065
|
15,177
|
|||||||
|
Total operating expenses and costs
|
132,021
|
123,852
|
532,057
|
460,069
|
|||||||
|
Operating (loss) income
|
(5,819)
|
(1,762)
|
(12,649)
|
92
|
|||||||
|
Other expenses (income):
|
|||||||||||
|
Interest expense
|
904
|
795
|
3,345
|
3,438
|
|||||||
|
Other, net
|
(41)
|
(145)
|
(252)
|
(45)
|
|||||||
|
Total other expenses, net
|
863
|
650
|
3,093
|
3,393
|
|||||||
|
Loss before income taxes
|
(6,682)
|
(2,412)
|
(15,742)
|
(3,301)
|
|||||||
|
Income tax (benefit) expense
|
(2,328)
|
(615)
|
(4,965)
|
7
|
|||||||
|
Net loss
|
$
|
(4,354)
|
$
|
(1,797)
|
$
|
(10,777)
|
$
|
(3,308)
|
|||
|
Net loss per share information:
|
|||||||||||
|
Average shares outstanding (Basic)
|
10,297
|
10,297
|
10,302
|
10,295
|
|||||||
|
Basic loss per share
|
$
|
(0.42)
|
$
|
(0.17)
|
$
|
(1.05)
|
$
|
(0.32)
|
|||
|
Average shares outstanding (Diluted)
|
10,297
|
10,297
|
10,302
|
10,295
|
|||||||
|
Diluted loss per share
|
$
|
(0.42)
|
$
|
(0.17)
|
$
|
(1.05)
|
$
|
(0.32)
|
|||
|
(1)
|
Includes Intermodal revenue.
|
7
| The following table presents key operating results and statistics: |
|
|
Three Months Ended
|
Twelve Months Ended
|
||||||||||||||
|
December 31,
|
December 31,
|
||||||||||||||
|
2011
|
2010
|
2011
|
2010
|
||||||||||||
|
Trucking:
|
|||||||||||||||
|
Operating loss (in thousands) (1)
|
$
|
(7,406)
|
$
|
(2,353)
|
$
|
(19,749)
|
$
|
(2,915)
|
|||||||
|
Operating ratio (2)
|
109.1
|
%
|
102.6
|
%
|
105.7
|
%
|
100.8
|
%
|
|||||||
|
Total miles (in thousands) (3)(6)
|
51,810
|
62,783
|
221,765
|
246,742
|
|||||||||||
|
Empty mile factor (6)
|
11.1
|
%
|
10.0
|
%
|
11.0
|
%
|
10.0
|
%
|
|||||||
|
Weighted average number of tractors (4)(6)
|
2,248
|
2,369
|
2,313
|
2,347
|
|||||||||||
|
Average miles per tractor per period (6)
|
23,047
|
26,502
|
95,878
|
105,131
|
|||||||||||
|
Average miles per tractor per week (6)
|
1,754
|
2,016
|
1,839
|
2,016
|
|||||||||||
|
Average miles per trip (6)
|
521
|
569
|
532
|
560
|
|||||||||||
|
Base Trucking revenue per tractor per week (6)
|
$
|
2,742
|
$
|
2,952
|
$
|
2,852
|
$
|
2,876
|
|||||||
|
Number of tractors at end of period (4)(6)
|
2,235
|
2,363
|
2,235
|
2,363
|
|||||||||||
|
Strategic Capacity Solutions:
|
|||||||||||||||
|
Operating income (in thousands) (1)
|
$
|
1,587
|
$
|
591
|
$
|
7,100
|
$
|
3,007
|
|||||||
|
Gross margin percentage (5)
|
14.1
|
%
|
12.8
|
%
|
15.1
|
%
|
14.3
|
%
|
|||||||
(1) Operating (loss) income is calculated by deducting total operating expenses from total revenues.
|
|
(2)
|
Operating ratio is calculated by dividing total operating expenses, net of fuel surcharge, by base revenue.
|
(3) Total miles include both loaded and empty miles.
|
|
(4)
|
Tractors include Company-operated tractors in service plus tractors operated by independent contractors.
|
|
|
(5)
|
Gross margin percentage is calculated by taking total base revenue, less purchased transportation expense net of fuel surcharge revenue and dividing that amount by total base revenue. This calculation includes intercompany revenues and expenses.
|
|
|
(6)
|
Excludes Intermodal drayage tractors.
|
The following table reflects the condensed financial position of the Company as of the dates indicated:
|
(in thousands)
|
|||||||||||
|
December 31,
|
December 31,
|
||||||||||
|
2011
|
2010
|
||||||||||
|
Assets
|
|||||||||||
|
Current assets:
|
|||||||||||
| Cash | $ | 2,659 | $ | 2,726 | |||||||
|
Receivables, net
|
56,941
|
47,983
|
|||||||||
|
Inventories
|
1,831
|
2,080
|
|||||||||
|
Prepaid expenses and other current assets
|
13,466
|
12,885
|
|||||||||
|
Total current assets
|
74,897
|
65,674
|
|||||||||
|
Property and equipment, at cost
|
419,561
|
423,115
|
|||||||||
|
Accumulated depreciation and amortization
|
(160,761)
|
(163,867)
|
|||||||||
|
Property and equipment, net
|
258,800
|
259,248
|
|||||||||
|
Note receivable
|
2,003
|
2,048
|
|||||||||
|
Other assets
|
491
|
415
|
|||||||||
|
Total assets
|
$
|
336,191
|
$
|
327,385
|
|||||||
|
Liabilities and Stockholders’ Equity
|
|||||||||||
|
Current liabilities:
|
|||||||||||
|
Bank drafts payable
|
$
|
5,044
|
$
|
4,233
|
|||||||
|
Trade accounts payable
|
21,691
|
16,691
|
|||||||||
|
Current portion of insurance and claims accruals
|
3,418
|
4,725
|
|||||||||
|
Accrued expenses
|
7,790
|
8,401
|
|||||||||
|
Note payable
|
1,370
|
1,009
|
|||||||||
|
Current maturities of long-term debt and capital leases
|
19,146
|
18,766
|
|||||||||
|
Deferred income taxes
|
1,693
|
1,094
|
|||||||||
|
Total current liabilities
|
60,152
|
54,919
|
|||||||||
|
Deferred gain
|
612
|
618
|
|||||||||
|
Long-term debt and capital leases, less current maturities
|
98,927
|
79,750
|
|||||||||
|
Deferred income taxes
|
45,193
|
50,782
|
|||||||||
|
Insurance and claims accruals, less current portion
|
4,335
|
3,608
|
|||||||||
|
Total stockholders’ equity
|
126,972
|
137,708
|
|||||||||
|
Total liabilities and stockholders’ equity
|
$
|
336,191
|
$
|
327,385
|
|||||||
|
Selected other financial information:
|
|||||||||||
|
(in thousands)
|
|||||||||||
|
Twelve Months Ended December 31,
|
|||||||||||
|
2011
|
2010
|
||||||||||
|
Net cash provided by operating activities
|
$
|
23,662
|
$
|
48,245
|
|||||||
|
Capital expenditures, net
|
42,614
|
39,693
|
|||||||||
This press release contains forward-looking statements within the meaning of Section 27A of the Securities Act of 1933, as amended and Section 21E of the Securities Exchange Act of 1934, as amended. These statements generally may be identified by their use of terms or phrases such as “expects,” “estimates,” “anticipates,” “projects,” “believes,” “plans,” “goals,” “intends,” “may,” “will,” “should,” “could,” “potential,” “continue,” “future,” and terms or phrases of similar substance. Forward-looking statements are based upon the current beliefs and expectations of our management and are inherently subject to risks and uncertainties, some of which cannot be predicted or quantified, which could cause future events and actual results to differ materially from those set forth in, contemplated by, or underlying the forward-looking statements. Accordingly, actual results may differ from those set forth in the forward-looking statements. Readers should review and consider the factors that may affect future results and other disclosures by the Company in its press releases, Annual Report on Form 10-K and other filings with the Securities and Exchange Commission. We disclaim any obligation to update or revise any forward-looking statements to reflect actual results or changes in the factors affecting the forward-looking information. In light of these risks and uncertainties, the forward-looking events and circumstances discussed in this press release might not occur.
All forward-looking statements attributable to us, or persons acting on our behalf, are expressly qualified in their entirety by this cautionary statement.
References to the “Company,” “we,” “us,” “our” and words of similar import refer to USA Truck, Inc. and its subsidiary.
USA Truck is a dry van truckload carrier transporting general commodities via our General Freight and Dedicated Freight service offerings. We transport commodities throughout the continental United States and into and out of portions of Canada. We also transport general commodities into and out of Mexico by allowing through-trailer service from our terminal in Laredo, Texas. Our Strategic Capacity Solutions operating segment provides customized transportation solutions using our technology and multiple modes of transportation including our assets and the assets of our partner carriers.
This press release and related information will be available to interested parties at our web site, http://www.usa-truck.com under the “News Releases” tab of the “Investors” menu.
-- --
Contact: CLIFF BECKHAM, President and Chief Executive Officer – (479) 471-2633 or DARRON MING, Executive Vice President and Chief Financial Officer – (479) 471-2672