Attached files
| file | filename |
|---|---|
| EX-23.1 - CONSENT OF PRICEWATERHOUSECOOPERS LLP - Northern Tier Energy LP | d246705dex231.htm |
| EX-23.2 - CONSENT OF PRICEWATERHOUSECOOPERS LLP - Northern Tier Energy LP | d246705dex232.htm |
| EX-10.11 - AMENDED AND RESTATED MANAGEMENT SERVICES AGREEMENT - Northern Tier Energy LP | d246705dex1011.htm |
Table of Contents
Index to Financial Statements
As filed with the Securities and Exchange Commission on February 10, 2012
Registration No. 333-178457
UNITED STATES
SECURITIES AND EXCHANGE COMMISSION
Washington, D.C. 20549
AMENDMENT NO. 1
TO
FORM S-1
REGISTRATION STATEMENT UNDER THE SECURITIES ACT OF 1933
Northern Tier Energy, Inc.
(Exact name of registrant as specified in its charter)
| Delaware | 2911 | 80-0763623 | ||
| (State or other jurisdiction of incorporation or organization) | (Primary Standard Industrial Classification Code Number) | (I.R.S. Employer Identification No.) |
38C Grove Street, Suite 100
Ridgefield, Connecticut 06877
(203) 244-6550
(Address, including zip code, and telephone number, including area code, of registrant’s principal executive offices)
Peter T. Gelfman
Vice President, General Counsel and Secretary
38C Grove Street, Suite 100
Ridgefield, Connecticut 06877
(203) 244-6550
(Name, address, including zip code, and telephone number, including area code, of agent for service)
Copies to:
| Douglas E. McWilliams Brenda K. Lenahan Vinson & Elkins L.L.P. 1001 Fannin, Suite 2500 Houston, Texas 77002-6760 (713) 758-2222 |
Michael J. Volkovitsch Cleary Gottlieb Steen & Hamilton LLP One Liberty Plaza New York, New York 10006 (212) 225-2000 |
Approximate date of commencement of proposed sale to the public: As soon as practicable after the effective date of this Registration Statement.
If any of the securities being registered on this Form are to be offered on a delayed or continuous basis pursuant to Rule 415 under the Securities Act of 1933 check the following box: ¨
If this Form is filed to register additional securities for an offering pursuant to Rule 462(b) under the Securities Act, please check the following box and list the Securities Act registration statement number of the earlier effective registration statement for the same offering. ¨
If this Form is a post-effective amendment filed pursuant to Rule 462(c) under the Securities Act, check the following box and list the Securities Act registration statement number of the earlier effective registration statement for the same offering. ¨
If this Form is a post-effective amendment filed pursuant to Rule 462(d) under the Securities Act, check the following box and list the Securities Act registration statement number of the earlier effective registration statement for the same offering. ¨
Indicate by check mark whether the registrant is a large accelerated filer, an accelerated filer, a non-accelerated filer, or a smaller reporting company. See the definitions of “large accelerated filer,” “accelerated filer” and “smaller reporting company” in Rule 12b-2 of the Exchange Act.
| Large accelerated filer ¨ | Accelerated filer ¨ | Non-accelerated filer x (Do not check if a smaller reporting company) |
Smaller reporting company ¨ |
The registrant hereby amends this Registration Statement on such date or dates as may be necessary to delay its effective date until the registrant shall file a further amendment which specifically states that this Registration Statement shall thereafter become effective in accordance with Section 8(a) of the Securities Act of 1933 or until this Registration Statement shall become effective on such date as the Securities and Exchange Commission, acting pursuant to said Section 8(a), may determine.
Table of Contents
Index to Financial Statements
The information in this prospectus is not complete and may be changed. We may not sell these securities until the registration statement filed with the Securities and Exchange Commission is effective. This prospectus is not an offer to sell these securities and we are not soliciting offers to buy these securities in any state where the offer or sale is not permitted.
Subject to Completion, Dated February 10, 2012
Shares

Northern Tier Energy, Inc.
CLASS A COMMON STOCK
This is an initial public offering of the Class A common stock of Northern Tier Energy, Inc.
Prior to this offering, there has been no public market for our Class A common stock. We anticipate that the initial public offering price of our Class A common stock will be between $ and $ per share. We intend to apply to list our Class A common stock on the New York Stock Exchange under the symbol “NTI.”
See “Risk Factors” on page 21 to read about factors you should consider before buying shares of the Class A common stock.
Neither the Securities and Exchange Commission nor any state securities regulators has approved or disapproved of these securities or passed upon the accuracy or adequacy of this prospectus. Any representation to the contrary is a criminal offense.
| Per Share | Total | |||||||
| Initial public offering price |
$ | $ | ||||||
| Underwriting discount |
$ | $ | ||||||
| Proceeds, before expenses, to Northern Tier Energy, Inc. |
$ | $ | ||||||
To the extent that the underwriters sell more than shares of Class A common stock, the underwriters have the option to purchase up to an additional shares of our Class A common stock at the initial public offering price less the underwriting discount.
The underwriters expect to deliver the shares against payment in New York, New York on or about , 2012.
| Goldman, Sachs & Co. | ||||||||||
| BofA Merrill Lynch | ||||||||||
| Deutsche Bank Securities | ||||||||||
| J.P. Morgan | ||||||||||
| Macquarie Capital | ||||||||||
Prospectus dated , 2012.
Table of Contents
Index to Financial Statements

|

|

Table of Contents
Index to Financial Statements
| 1 | ||||
| 21 | ||||
| 51 | ||||
| 53 | ||||
| 58 | ||||
| 59 | ||||
| 60 | ||||
| 61 | ||||
| Unaudited Pro Forma Condensed Consolidated Financial Information |
62 | |||
| Selected Historical and Unaudited Pro Forma Condensed Consolidated Financial Data |
72 | |||
| Management’s Discussion and Analysis of Financial Condition and Results of Operations |
74 | |||
| 117 | ||||
| 144 | ||||
| 151 | ||||
| 171 | ||||
| 179 | ||||
| 184 | ||||
| 188 | ||||
| 190 | ||||
| 194 | ||||
| 199 | ||||
| 199 | ||||
| 199 | ||||
| F-1 | ||||
| A-1 |
Through and including , 2012 (the 25th day after the date of this prospectus), all dealers effecting transactions in our Class A common stock, whether or not participating in this offering, may be required to deliver a prospectus. This requirement is in addition to the dealers’ obligation to deliver a prospectus when acting as an underwriter and with respect to an unsold allotment or subscription.
We have not authorized anyone to provide any information or to make any representations other than those contained in this prospectus or in any free writing prospectuses we have prepared. We take no responsibility for, and can provide no assurance as to the reliability of, any other information that others may give you. This prospectus is an offer to sell only the shares offered hereby, but only under circumstances and in jurisdictions where it is lawful to do so. The information contained in this prospectus is current only as of its date.
i
Table of Contents
Index to Financial Statements
Industry and Market Data
This prospectus includes industry data and forecasts that we obtained from industry publications and surveys, public filings and internal company sources. Industry publications and surveys and forecasts generally state that the information contained therein has been obtained from sources believed to be reliable, but there can be no assurance as to the accuracy or completeness of the included information. Statements as to our ranking, market position and market estimates are based on independent industry publications, government publications, third-party forecasts and management’s estimates and assumptions about our markets and our internal research. While we are not aware of any misstatements regarding our market, industry or similar data presented herein, such data involve risks and uncertainties and are subject to change based on various factors, including those discussed under the headings “Cautionary Statement Regarding Forward-Looking Statements” and “Risk Factors” in this prospectus.
This prospectus contains certain information regarding refinery complexity as measured by the Nelson Complexity Index, which is calculated on an annual basis by the Oil and Gas Journal. Certain data presented in this prospectus is from the Oil and Gas Journal Report dated January 1, 2010.
Trademarks and Trade Names
We own or have rights to various trademarks, service marks and trade names that we use in connection with the operation of our business. This prospectus may also contain trademarks, service marks and trade names of third parties, which are the property of their respective owners. Our use or display of third parties’ trademarks, service marks, trade names or products in this prospectus is not intended to, and does not imply a relationship with, or endorsement or sponsorship by us. Solely for convenience, the trademarks, service marks and trade names referred to in this prospectus may appear without the ®, TM or SM symbols, but such references are not intended to indicate, in any way, that we will not assert, to the fullest extent under applicable law, our rights or the right of the applicable licensor to these trademarks, service marks and trade names.
ii
Table of Contents
Index to Financial Statements
This summary highlights selected information contained elsewhere in this prospectus and is qualified in its entirety by the more detailed information and financial statements and notes thereto included elsewhere in this prospectus. Because it is abbreviated, this summary is not complete and does not contain all of the information that you should consider before investing in our Class A common stock. You should read the entire prospectus carefully before making an investment decision, including the information presented under the headings “Risk Factors,” “Cautionary Note Regarding Forward-Looking Statements,” “Organizational Structure” and “Management’s Discussion and Analysis of Financial Condition and Results of Operations” and the financial statements and the notes thereto included elsewhere in this prospectus. Unless otherwise indicated, the information presented in this prospectus assumes (i) an initial public offering price of $ per share, which represents the midpoint of the price range set forth on the cover of this prospectus, and (ii) that the underwriters’ option to purchase additional shares of our Class A common stock is not exercised. We have provided definitions for certain terms used in this prospectus in the “Glossary of Industry Terms Used in this Prospectus” beginning on page A-1 of this prospectus.
Unless the context otherwise requires, the terms “we,” “us,” “our,” “Successor” and “Company,” when used in the context of the period (i) prior to the completion of the transactions described in “Organizational Structure,” refer to Northern Tier Investors, LLC and its subsidiaries and (ii) after the completion of the transactions described in “Organizational Structure,” refer to Northern Tier Energy, Inc. and its subsidiaries. References to “ACON Refining” and “TPG Refining” refer to ACON Refining Partners, L.L.C. and its affiliates and TPG Refining, L.P. and its affiliates, respectively. References to “Marathon Oil” refer to Marathon Oil Corporation, references to “Marathon Petroleum” refer to Marathon Petroleum Corporation, a wholly owned subsidiary of Marathon Oil until June 30, 2011, and references to “Marathon” refer to Marathon Petroleum Company LP, an indirect, wholly owned subsidiary of Marathon Petroleum, and certain affiliates of Marathon Petroleum Company LP. References to the “Marathon Acquisition” refer to the acquisition by us of our St. Paul Park, Minnesota refinery, a 17% interest in the Minnesota Pipe Line Company, our convenience stores and related assets from Marathon, completed in December 2010. We refer to the assets acquired in the Marathon Acquisition as the “Marathon Assets.” The Marathon Acquisition is described in greater detail, including certain related transactions in “—Marathon Acquisition.”
Our Company
We are an independent downstream energy company with refining, retail and pipeline operations that serve the PADD II region of the United States. We operate our assets in two business segments: the refining business and the retail business. For the nine months ended September 30, 2011, we had total revenues of $3.2 billion, operating income of $347.1 million, a net loss of $264.4 million and Adjusted EBITDA of $364.2 million. For the year ended December 31, 2010, on a pro forma basis for the Marathon Acquisition, total revenues were $3.5 billion, operating income was $169.7 million, net earnings were $63.0 million and Adjusted EBITDA was $213.1 million. For a definition, and reconciliation, of Adjusted EBITDA to net (loss) earnings, see “—Summary Historical and Unaudited Pro Forma Condensed Consolidated Financial and Other Data.”
Refining Business
Our refining business primarily consists of a 74,000 barrels per calendar day (“bpd”) (84,500 barrels per stream day) refinery located in St. Paul Park, Minnesota. Our refinery has a Nelson complexity index of 11.5, which refers to the ability of a refinery to produce finished products based on
1
Table of Contents
Index to Financial Statements
its investment intensity and cost relative to other refineries. We are one of only two refineries in Minnesota and one of four refineries in the Upper Great Plains area within the PADD II region. Of the 27 operable refineries in the PADD II region, only three have a Nelson complexity index higher than ours. Our strategic location allows us direct access, primarily via the Minnesota Pipeline, to crude oils from Western Canada and North Dakota, as well as the ability to distribute our refined products throughout the midwestern United States. Our refinery produces a broad slate of refined products including gasoline, diesel, jet fuel and asphalt, which are then marketed to resellers and consumers primarily in the PADD II region. Approximately 79% and 78% of our total refinery production for the nine months ended September 30, 2011 and the year ended December 31, 2010, respectively, comprised higher value, light refined products, including gasoline and distillates.
We also own various storage and transportation assets, including a light products terminal, a heavy products terminal, storage tanks, rail loading/unloading facilities and a Mississippi river dock. Approximately 80% and 75% of our gasoline and diesel volumes for the nine months ended September 30, 2011 and the year ended December 31, 2010, respectively, were sold via our light products terminal to our company-operated and franchised SuperAmerica branded convenience stores, Marathon branded convenience stores and other resellers. We have a contract with Marathon to supply substantially all of the gasoline and diesel requirements for 90 independently owned and operated Marathon branded convenience stores.
Our refining business also includes our 17% interest in the Minnesota Pipe Line Company LLC (the “Minnesota Pipe Line Company”), which owns and operates the Minnesota Pipeline, a 455,000 bpd crude oil pipeline system that transports crude oil (primarily from Western Canada and North Dakota) for approximately 300 miles from the Enbridge pipeline hub at Clearbrook, Minnesota to our refinery. The Minnesota Pipeline has historically supplied the majority of the crude oil used and processed in our refinery.
Retail Business
As of September 30, 2011, our retail business operated 166 convenience stores under the SuperAmerica brand and also supported 67 franchised convenience stores, which are also operated under the SuperAmerica brand. These convenience stores are located primarily in Minnesota and Wisconsin and sell various grades of gasoline and diesel, tobacco products and immediately consumable items such as non-alcoholic beverages, beer, prepared food and a large variety of snacks and prepackaged items. Our refinery supplied substantially all of the gasoline and diesel sold in our company-operated and franchised convenience stores for the nine months ended September 30, 2011 and the year ended December 31, 2010.
We also own and operate SuperMom’s Bakery, which prepares and distributes baked goods and other prepared food items for sale in our company-operated and franchised convenience stores and other third party locations.
Refining Industry Overview
Crude oil refining is the process of separating the hydrocarbons present in crude oil for the purpose of converting them into marketable finished, or refined, petroleum products such as gasoline, diesel, jet fuel, asphalt and other products. Refining is primarily a margin-based business where both the feedstock (primarily crude oil) and the refined products are commodities with fluctuating prices. In order to increase profitability, it is important for a refinery to maximize the yields of high value finished products and to minimize the costs of feedstock and operating expenses.
2
Table of Contents
Index to Financial Statements
According to the Energy Information Administration (the “EIA”), as of January 1, 2011, there were 137 oil refineries operating in the United States, with the 15 smallest each having a refining capacity of 14,000 bpd or less, and the 10 largest having capacities ranging from 330,000 bpd to 560,640 bpd.
High capital costs, historical excess capacity and environmental regulatory requirements have limited the construction of new refineries in the United States over the past 30 years. According to the EIA, domestic operating refining capacity has increased approximately 5% between January 1982 and January 2011 from 16.1 million bpd to 16.9 million bpd. Much of this increase in capacity is generally the result of efficiency measures and moderate expansions at various refineries, known as “capacity creep,” but some significant expansions at existing refineries have occurred as well. During this same time period, more than 110 generally smaller and less efficient refineries that had limited access to a wide variety of crude oils or were unable to profitably process feedstock into a marketable product mix were closed.
According to the EIA, total demand for refined products in PADD II, which is the region in which we operate, has represented approximately 26% of total U.S. refined products demand from 2006 to 2010. Within PADD II, refined product production capacity is currently insufficient to meet demand. For example, according to the EIA, due to product supply shortfalls within PADD II, net receipts of gasoline, distillate and jet fuel/kerosene from domestic sources outside of PADD II comprised approximately 19%, 17% and 16%, respectively, of demand for these products. Refining capacity in the PADD II region has decreased approximately 3% between January 1982 and January 2011 from approximately 3.8 million bpd to approximately 3.6 million bpd, while more than 25 refineries in the PADD II region have ceased operations. The refined product volumes that are necessary to satisfy the demand in excess of PADD II production are primarily sourced from domestic refineries located outside of PADD II, specifically from the U.S. Gulf Coast.
Our Business Strategy
The primary components of our business strategy are:
| Ÿ | Focus on Optimizing Crude Oil Supply. We are focused on optimizing our crude oil purchases for our refining operations and minimizing our crude oil feedstock costs. Our strategic location and the refinery’s complexity allow us to receive and process a variety of light, heavy, sweet and sour crude oils from Western Canada and the United States, many of which have historically priced at a discount to the West Texas Intermediate crude oil (“NYMEX WTI”) price benchmark. |
| Ÿ | Maintain Significant Liquidity in Our Business. We rely on cash from operating activities, existing cash balances and our revolving credit facility as sources of liquidity to provide us with financial flexibility during periods of volatile commodity prices. We manage our operations prudently with a focus on maintaining ample liquidity to meet unforeseen capital needs. During December 2010, we entered into a five-year crude oil supply and logistics agreement with J.P. Morgan Commodities Canada Corporation (“JPM CCC”) to supply our refinery’s crude oil feedstock requirements, which helps reduce the amount of working capital required in our refinery operations. On a pro forma basis for this offering, as of September 30, 2011, we estimate that we would have had approximately $ million of available liquidity comprised of cash on hand and amounts available for borrowing under our $300 million revolving credit facility. Our actual available liquidity may vary from our estimated amount depending on several factors, including fluctuations in inventory and accounts receivable values as well as cash balances. |
3
Table of Contents
Index to Financial Statements
| Ÿ | Reduce Reliance on Wholesale Market by Growing Our Retail Business. We intend to emphasize the development and growth of our dedicated SuperAmerica branded retail business to which we supply transportation fuels directly from our refining operations. We expect our near-term growth to be driven by an expansion of our SuperAmerica franchise business. In the long term, we anticipate increasing the number of company-operated convenience stores in select areas. |
| Ÿ | Selectively Engage in Hedging Activities to Mitigate Gross Margin Volatility. We seek to mitigate the variability of commodity price exposure by selectively engaging in hedging strategies that are intended to protect our refining gross margins and operating cash flows. Our hedging policy establishes that we systematically evaluate the merits of entering into commodity derivatives contracts to hedge our crack spread risk with respect to a portion of our expected gasoline and diesel production on a rolling basis. Crack spread measures the difference between the price received from the sale of light products and the price paid for crude oil. For example, the 3:2:1 crack spread is a general industry standard that approximates the per barrel refining margin resulting from processing three barrels of crude oil to produce two barrels of gasoline and one barrel of distillates, which generally includes diesel, jet fuel or kerosene. Commodity derivatives contracts that we enter into are either exchange-traded contracts in the form of futures contracts or over-the-counter contracts in the form of commodity price swaps that reference benchmark indices. As of September 30, 2011, we hedged approximately 22 million barrels of future gasoline and distillate production under commodity derivatives contracts. |
| Ÿ | Selectively Consider Acquisition Opportunities. We intend to selectively consider strategic acquisitions within the refining and retail marketing industry. In selecting acquisitions within the refining industry, we will consider the following criteria: (i) performance through the refining cycle, (ii) advantageous access to crude oil supplies, (iii) attractive refined products market fundamentals and (iv) access to distribution and logistics infrastructure. In our existing areas of operation, we will seek acquisition opportunities that have the potential for operational efficiencies. We may also evaluate opportunities in the energy industry outside of our existing areas of operation and in new geographic regions to expand our operating footprint. |
Our Competitive Strengths
We have a number of competitive strengths that we believe will help us to successfully execute our business strategy:
| Ÿ | Strategically Located Refinery with Advantageous Access to Crude Oil Supply. Our refinery is located on approximately 170 acres along the Mississippi River in a strategically advantageous area within the PADD II region. The refinery has the ability to source a variety of crude oils, including heavy Canadian crude oils and light North Dakota crude oils, primarily via the Minnesota Pipeline. Our refinery also has access to crude oils from Cushing, Oklahoma, the U.S. Gulf Coast and other foreign markets. The ability to source and process multiple types of crude oil enables us to capitalize on changing market conditions and, we believe, increase our profitability. For the nine months ended September 30, 2011, 52% of the crude oil processed at the refinery was Canadian crude oil, with the remainder comprised of locally produced U.S. crude oils, mostly from the Bakken Shale in North Dakota. Historically, we have purchased our crude oil at a discount to NYMEX WTI as a result of our close proximity to plentiful sources of crude oil in Western Canada and North Dakota. Over the five years ended September 30, 2011, we realized an average discount of $1.95 per barrel of crude oil purchased for our refinery when compared to the average NYMEX WTI price per barrel over the same period. More recently, the increase of the discount at which a barrel of NYMEX WTI traded relative to a barrel of benchmark Brent crude oil (“Brent”) has allowed refineries, such as ours, that are |
4
Table of Contents
Index to Financial Statements
| capable of sourcing and utilizing crude oil that is priced more in line with NYMEX WTI, to realize relatively lower feedstock costs and benefit from the higher refined product prices resulting from higher Brent prices. |
| Ÿ | Attractive Regional Refined Products Supply/Demand Dynamics. In recent years, demand for refined products in the PADD II region has exceeded regional production, resulting in a need for imports from other regions, specifically from the U.S. Gulf Coast region. Our inland location means that foreign and coastal domestic refiners seeking to access our marketing area would incur additional transportation costs. Over the five years ended September 30, 2011, our refinery has realized an average price premium of $3.35 per barrel for its gasoline and distillates production relative to the prices used in calculating the U.S. Gulf Coast 3:2:1 crack spread and an average price premium of $1.86 per barrel relative to the benchmark PADD II Group 3 3:2:1 crack spread (the “Group 3 3:2:1 crack spread”), in each case assuming a comparable rate of two barrels of gasoline and one barrel of distillate (see footnote 4 in “—Summary Historical and Unaudited Pro Forma Condensed Consolidated Financial and Other Data”). |
| Ÿ | Substantial Refinery Operating Flexibility. Since 2006, approximately $213 million (including $194 million from January 2006 through November 2010 and $19 million from our inception date of August 10, 2010 through September 2011) has been invested in upgrades and capital projects to modernize the St. Paul Park refinery, improve its operating flexibility, increase its complexity and meet U.S. environmental, health and safety requirements, including revamping the gas oil hydrotreater in 2006 to allow for the production of ultra low sulfur diesel. As a result of these capital expenditures, we believe that we will be able to comply with known prospective fuel quality requirements without incurring significant capital costs or substantially increased operating costs. In addition, we have significant redundancies in our refining assets, which include two crude oil distillation and vacuum towers, two reformers, two sulfur recovery units and five hydrotreating units. These redundancies allow us to continue to receive and process crude oil and other feedstocks in the event a unit goes out of service and allows for increased maintenance flexibility as a redundant unit may be used without having to shut down the entire refinery in the case of a major unit turnaround. |
Our refinery has a Nelson complexity index of 11.5. Of the 27 operable refineries in the PADD II region, only three have a Nelson complexity index higher than ours. Our refinery’s complexity means we can process lower cost crude oils into higher value light refined products, including transportation fuels, such as gasoline and distillates. Gasoline and distillates comprised approximately 79% and 78% of our total refinery production for the nine months ended September 30, 2011 and the year ended December 31, 2010, respectively.
| Ÿ | Strong Refinery Operating and Safety Track Record. Our refinery has a strong operating and safety track record as evidenced by our high mechanical availability and low recordable incidents. This performance is due to, among other things, the periodic upgrades and maintenance performed at our refinery. We measure our safety track record primarily through the use of injury frequency rates as determined by the Occupational Safety and Health Administration (“OSHA”). Our refinery had an OSHA Recordable Rate of 0.35 and 0.40 during the nine months ended September 30, 2011 and the year ended December 31, 2010, respectively. |
| Ÿ | Integrated Refining and Retail Distribution Operations. Our business is an integrated refining operation with significant storage assets and a retail distribution network comprising, as of September 30, 2011, 166 company-operated and 67 franchised convenience stores, all of which are operated under the SuperAmerica brand. For the nine months ended September 30, 2011 and the year ended December 31, 2010, we sold approximately 80% and 75%, respectively, of our gasoline and diesel volumes via our eight-bay bottom-loading light products |
5
Table of Contents
Index to Financial Statements
| terminal located at the refinery, primarily to our retail distribution network and, to a lesser extent, other resellers. Our refinery supplied substantially all of the gasoline and diesel sold in our company-operated and franchised convenience stores during these periods. We also have a contract with Marathon to supply substantially all of the gasoline and diesel requirements of 90 independently owned and operated Marathon branded convenience stores. In addition, we also have (i) a seven-bay heavy products terminal located on the refinery property, (ii) rail facilities for shipping liquefied petroleum gases and asphalt and for receiving butane, isobutane, crude oil and ethanol and (iii) a barge dock on the Mississippi River used primarily for shipping vacuum residuals and slurry. |
| Ÿ | Experienced, Proven and Incentivized Management Team. Our management team is led by our Chief Executive Officer, Mario E. Rodriguez, formerly a managing director in the global energy investment banking division of Citigroup Global Markets, who has approximately 20 years of experience in the energy and finance industries. Our President and Chief Operating Officer, Hank Kuchta, has over 30 years of industry experience and was formerly President and Chief Operating Officer of Premcor Inc. Premcor operated four refineries in the United States with approximately 750,000 bpd of refining capacity at the time of its sale to Valero Energy Corporation in April 2005. Prior to Premcor, Mr. Kuchta served in various management positions at Phillips 66 Company, Tosco Corporation and Exxon Corporation. Our President of refinery operations, Greg Mullins, previously worked at Marathon for over 30 years and has extensive experience in all aspects of refinery operations and management as well as major project development and project management. Several members of our management team, including our President and Chief Operating Officer; our Vice President, Marketing; our Vice President, Supply; our Vice President, Human Resources; and our Vice President, Chief Information Officer, have experience working together as a management team at Premcor. In addition, our management team will have a significant ownership interest in us immediately following the completion of this offering, which we believe provides significant incentives to grow the value of our business for the benefit of all of our stockholders. |
Risk Factors
Investing in our Class A common stock involves risks that include the volatility of crude oil and other refinery feedstocks, competition and other material factors. For a discussion of these risks and other considerations that could negatively affect us, including risks related to this offering and our Class A common stock, see “Risk Factors” and “Cautionary Note Regarding Forward-Looking Statements.”
Marathon Acquisition
We commenced operations in December 2010 through the acquisition of our St. Paul Park, Minnesota refinery, a 17% interest in the Minnesota Pipe Line Company, our convenience stores and related assets from Marathon for $554 million, which included cash and the issuance to Marathon of $80 million of a noncontrolling preferred interest in one of our subsidiaries. In addition, we are required to pay Marathon additional contingent consideration, or earn-out payments, if our annual consolidated EBITDA, adjusted for certain agreed items (the “Agreement Adjusted EBITDA”), exceeds $165 million during any year in each of the eight years following the Marathon Acquisition. Under the terms of the agreement, we will be required to pay Marathon 40% of the amount by which the Agreement Adjusted EBITDA exceeds $165 million, subject to certain reductions, in any year in the eight years following the Marathon Acquisition. Total payments to Marathon under this agreement are not to exceed $125 million over the eight years following the Marathon Acquisition. Conversely, Marathon is required to
6
Table of Contents
Index to Financial Statements
pay us up to $30 million per year if the Agreement Adjusted EBITDA is below $145 million, subject to certain reductions, in either of the twelve-month periods ending November 30, 2011 and 2012. Any such payments made by Marathon will increase the maximum amount that we may be required to pay Marathon over the earn-out period as described above.
In connection with the Marathon Acquisition, certain additional transactions were consummated and we entered into certain agreements with respect to our operations, including the following:
| Ÿ | Senior Secured Notes. We issued $290 million of 10.5% senior secured notes due December 1, 2017. We pay interest on the senior secured notes on June 1 and December 1 of each year. The net proceeds from the sale of the senior secured notes were used to fund part of the Marathon Acquisition. See “Management’s Discussion and Analysis of Financial Condition and Results of Operations—Liquidity and Capital Resources—Description of Our Indebtedness—Senior Secured Notes.” |
| Ÿ | Asset-Based Revolving Credit Facility. We entered into a $300 million senior secured asset-based revolving credit facility, which is subject to a borrowing base. We did not draw on the revolving credit facility to fund the Marathon Acquisition, other than to the extent utilized through the issuance of letters of credit. The revolving credit facility is available through December 1, 2015. See “Management’s Discussion and Analysis of Financial Condition and Results of Operations—Liquidity and Capital Resources—Description of Our Indebtedness—Senior Secured Asset-Based Revolving Credit Facility.” |
| Ÿ | Sale-Leaseback Arrangement. Marathon sold certain real property interests, including the land underlying 135 of the SuperAmerica convenience stores associated with our retail business and SuperMom’s Bakery, to Realty Income Properties 3 LLC (“Realty Income”), a third party equity real estate investment trust. In connection with the closing of the Marathon Acquisition, Realty Income leased those properties to us on a long-term basis. |
| Ÿ | Crude Oil Inventory Purchase Agreement. JPM CCC purchased substantially all of the crude oil inventory associated with operations of the refinery directly from Marathon pursuant to an inventory purchase agreement with Marathon. |
| Ÿ | Crude Oil Supply and Logistics Agreement. We entered into a five-year crude oil supply and logistics agreement with JPM CCC that expires December 2015. JPM CCC assists us in the purchase of the crude oil requirements of our refinery and provides transportation and other logistical services for delivery of the crude oil to our storage tanks at Cottage Grove, Minnesota, which are approximately two miles from our refinery. We pay the price of the crude oil (determined as of the closing price one day subsequent to the delivery date) plus certain agreed fees and expenses. We believe this crude oil supply and logistics agreement significantly reduces our need to maintain crude oil inventories and allows us to take title to and price our crude oil at the refinery, as opposed to the crude oil origination point, reducing the time we are exposed to market fluctuations before the finished product output is sold. For more information, see “Business—Crude Oil Supply.” |
| Ÿ | Transition Services Agreement. Marathon agreed to provide us with administrative and support services pursuant to a transition services agreement, including finance and accounting, human resources and information systems services, as well as support services in connection with our transition from being a part of Marathon’s systems and infrastructure to having our own systems and infrastructure. We ended a substantial portion of the Marathon transition services in October 2011. For more information, see “Certain Relationships and Related Person Transactions—Transactions with Marathon.” |
7
Table of Contents
Index to Financial Statements
Organization
Northern Tier Energy, Inc. was incorporated on October 21, 2011 pursuant to the laws of the State of Delaware to become a holding company for Northern Tier Investors, LLC (“NTI LLC”). Following this offering, Northern Tier Energy, Inc.’s sole material asset will be an equity interest in NTI LLC. Northern Tier Energy, Inc., as sole managing member of NTI LLC, will operate and control all of the business and affairs and consolidate the financial results of NTI LLC and its subsidiaries. The financial statements of Northern Tier Energy, Inc. have not been presented elsewhere in this prospectus as it is a newly incorporated entity, has had no business transactions or activities to date and has no (or nominal) assets or liabilities.
Prior to this offering, NTI LLC was a wholly owned subsidiary of Northern Tier Investors, L.P. (“NTI LP”). NTI LP and NTI LLC were organized by ACON Refining and TPG Refining to act as holding companies of the companies that own and operate the business and assets acquired in the Marathon Acquisition. As described below and in “Organizational Structure,” NTI LP will merge into NTI LLC, pursuant to which we anticipate that the general partner interest in NTI LP will be canceled in exchange for $1,000, and all of the classes of limited partner interests in NTI LP, currently held by its existing owners, including ACON Refining, TPG Refining and entities controlled by certain members of our management (which we collectively refer to in this prospectus as the “Existing Owners”), will be converted into a single new class of units in NTI LLC that we refer to in this prospectus as “NTI LLC Units.” In connection with these transactions, a portion of the NTI LLC Units held by certain Existing Owners will be exchanged with Northern Tier Energy, Inc. (the “Existing Owner Exchange”) for shares of Northern Tier Energy, Inc. Class A common stock, cash and rights to payments under a tax receivable agreement Northern Tier Energy, Inc. will enter into upon the closing of this offering (the “Tax Receivable Agreement”) with the Existing Owners, including ACON Refining and TPG Refining.
The Tax Receivable Agreement generally provides for the payment by Northern Tier Energy, Inc. of 85% of the cash savings, if any, in U.S. federal, state and local income tax or franchise tax that Northern Tier Energy, Inc. actually realizes (or is deemed to realize in certain circumstances) in periods after this offering as a result of (i) the increase in tax basis in NTI LLC’s assets that arose from the Marathon Acquisition, (ii) the basis increase resulting from the distribution of offering proceeds to the Existing Owners, (iii) the basis increases resulting from the exchanges of NTI LLC Units (along with the corresponding shares of Class B common stock) for shares of Northern Tier Energy, Inc. Class A common stock, (iv) additional deductions allocated to Northern Tier Energy, Inc. pursuant to Section 704(c) of the Internal Revenue Code of 1986, as amended (the “Code”), to reflect the difference between the fair market value and the adjusted tax basis of NTI LLC’s assets as of the closing of this offering, (v) imputed interest deemed to be paid by Northern Tier Energy, Inc. as a result of, and additional tax basis arising from, payments under the Tax Receivable Agreement, and (vi) any net operating losses available to Northern Tier Energy, Inc. as a result of the Existing Owner Exchange. Northern Tier Energy, Inc. will retain the benefit of the remaining 15% of these cash savings. See “Certain Relationships and Related Person Transactions—Tax Receivable Agreement.”
Northern Tier Energy, Inc. will contribute a portion of the proceeds from this offering, as well as a noncontrolling preferred interest in a subsidiary of NTI LLC that Northern Tier Energy, Inc. will purchase with a portion of the proceeds from this offering, to NTI LLC in exchange for NTI LLC Units. Of the cash received by NTI LLC from Northern Tier Energy, Inc., $ million will be distributed by NTI LLC to the Existing Owners and the remainder will be used for general corporate purposes. See “Use of Proceeds.” After giving effect to these transactions and the Existing Owner Exchange, Northern Tier Energy, Inc. will own an approximate % (or % if the underwriters’ option to purchase additional shares is exercised in full) interest in NTI LLC. Following completion of this offering, the
8
Table of Contents
Index to Financial Statements
remaining % (or % if the underwriters’ option to purchase additional shares is exercised in full) interest in NTI LLC will be owned by the Existing Owners.
In connection with these transactions, the Existing Owners will be issued one share of Northern Tier Energy, Inc. Class B common stock for each NTI LLC Unit that they hold. The Class B common stock will not have any economic rights, but it will entitle its holders to vote together with the Class A common stock as a single class on all matters presented to Northern Tier Energy, Inc. stockholders for their vote. Under the terms of the amended and restated limited liability company agreement of NTI LLC (the “LLC Agreement”), holders of NTI LLC Units will have the right to exchange NTI LLC Units (together with a corresponding number of shares of Class B common stock) for shares of Northern Tier Energy, Inc. Class A common stock on a one-for-one basis, subject to customary conversion rate adjustments for stock splits, stock dividends and reclassifications.
9
Table of Contents
Index to Financial Statements
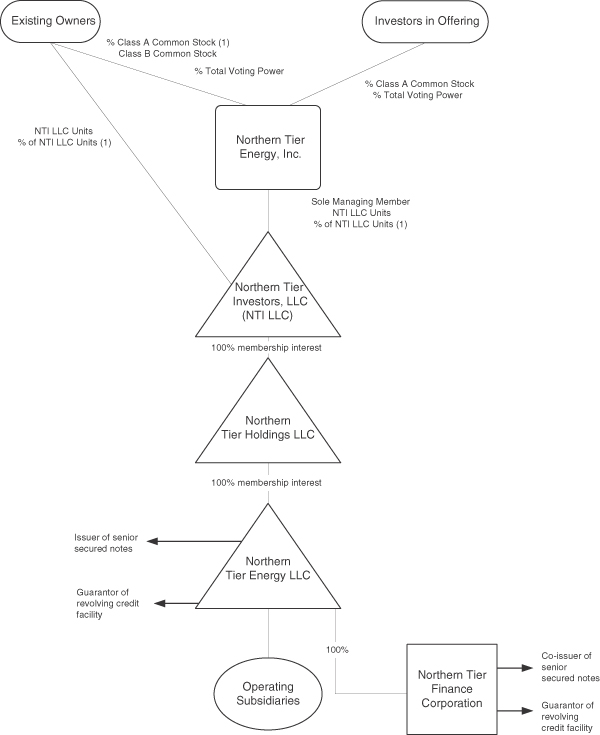
The diagram below depicts Northern Tier Energy, Inc.’s organizational structure immediately following this offering assuming that the underwriters’ option to purchase additional shares is not exercised.
10
Table of Contents
Index to Financial Statements
| (1) | Based on an assumed initial public offering price equal to the midpoint of the price range set forth on the cover of this prospectus. Immediately following the offering, the Existing Owners will have an aggregate economic interest in Northern Tier Energy, Inc. and NTI LLC equal to %. However, the portion of such percentage that constitutes NTI LLC Units or Class A common stock will depend on the initial public offering price. As discussed under “Organizational Structure,” the allocation of NTI LLC Units among the Existing Owners will be determined pursuant to the distribution provisions of the existing amended and restated limited partnership agreement of NTI LP based upon the liquidation value of NTI LP, which will be implied by the initial public offering price of the shares of Class A common stock in this offering. A deviation in the initial public offering price from the assumed initial public offering price will impact the allocation of equity interests among the Existing Owners, including those who intend to exchange their NTI LLC Units for our Class A common stock in connection with this offering. Accordingly, any such deviation in the initial public offering price will impact the number of NTI LLC Units and shares of Class A common stock and Class B common stock held by the Existing Owners. For example, an offering price of $ per share would result in the Existing Owners owning % of the NTI LLC Units, shares of Class A common stock and shares of Class B common stock. Likewise, an offering price of $ per share would result in the Existing Owners owning % of the NTI LLC Units, shares of Class A common stock and shares Class B common stock. |
Our Relationship with ACON Refining and TPG Refining
Following this offering, ACON Refining and TPG Refining will own NTI LLC Units and Class A common stock and Class B common stock of Northern Tier Energy, Inc., which in the aggregate will represent approximately % of the economic interests in, and % of the voting power of, Northern Tier Energy, Inc. (approximately % and %, respectively, if the underwriters’ option to purchase additional shares is exercised in full), based on an assumed initial offering price equal to the midpoint of the price range set forth on the cover of this prospectus.
ACON Investments, L.L.C., an affiliate of ACON Refining, and other of its affiliates (“ACON Investments”) manage private equity funds and special purpose investment partnerships. ACON Investments has executed investments in upstream and midstream oil and gas companies as well as in energy infrastructure and energy services. TPG Capital, L.P., an affiliate of TPG Refining (“TPG Capital”), is a leading private investment firm with $48 billion of assets under management. TPG Capital has extensive global experience with investments in the energy sector. We believe we will benefit from ACON Investments’ and TPG Capital’s collective experience in the energy industry.
General Corporate Information
Northern Tier Energy, Inc. was recently incorporated pursuant to the laws of the State of Delaware to become a holding company for NTI LLC. NTI LLC was formed as a Delaware limited liability company on August 10, 2010.
Our principal executive offices are located at 38C Grove Street, Suite 100, Ridgefield, Connecticut 06877 and our telephone number at that address is (203) 244-6550. Our website is located at www.ntenergy.com. We expect to make our periodic reports and other information filed with or furnished to the Securities and Exchange Commission (“SEC”), available free of charge through our website as soon as reasonably practicable after those reports and other information are electronically filed with or furnished to the SEC. Information on our website or any other website is not incorporated by reference herein and does not constitute a part of this prospectus.
11
Table of Contents
Index to Financial Statements
The Offering
| Class A common stock offered by us |
shares. | |
| Option to purchase additional shares |
We have granted the underwriters a 30-day option to purchase up to an aggregate of additional shares of our Class A common stock. | |
| Class A common stock to be outstanding after the offering |
shares ( shares if the underwriters’ option to purchase additional shares is exercised in full). If all outstanding NTI LLC Units held by the Existing Owners were exchanged (along with a corresponding number of shares of our Class B common stock) for newly-issued shares of Class A common stock on a one-for-one basis, shares would be outstanding ( shares if the underwriters’ option to purchase additional shares is exercised in full). | |
| Class B common stock outstanding after giving effect to this offering |
shares, or one share for each NTI LLC Unit held by the Existing Owners immediately following this offering. Shares of our Class B common stock have voting but no economic rights. When an NTI LLC Unit is exchanged for a share of Class A common stock, a share of Class B common stock held by such exchanging member will be cancelled. | |
| Voting power of Class A common stock after giving effect to this offering |
% (or 100% if all outstanding NTI LLC Units held by the Existing Owners were exchanged (along with a corresponding number of shares of our Class B common stock) for newly-issued shares of Class A common stock on a one-for-one basis). | |
| Voting power of Class B common stock after giving effect to this offering |
% (or 0% if all outstanding NTI LLC Units held by the Existing Owners were exchanged (along with a corresponding number of shares of our Class B common stock) for newly-issued shares of Class A common stock on a one-for-one basis). | |
| Use of proceeds |
We expect to receive approximately $ million of net proceeds from the sale of the Class A common stock offered by us, based upon the assumed initial public offering price of $ per share (the midpoint of the price range set forth on the cover page of this prospectus), after deducting underwriting discounts and commissions of $ million (or $ million if the underwriters exercise in full their option to purchase additional shares of Class A common | |
12
Table of Contents
Index to Financial Statements
| stock) and estimated offering expenses of $ million. Each $1.00 increase (decrease) in the public offering price would increase (decrease) our net proceeds by approximately $ million (assuming no exercise of the underwriters’ option to purchase additional shares).
We intend to use $ million of the net proceeds to purchase a noncontrolling preferred interest in one of our subsidiaries from Marathon.
We intend to pay $ million of the net proceeds to certain of the Existing Owners pursuant to the Existing Owner Exchange.
We intend to contribute the remaining $ million of the net proceeds, as well as the noncontrolling preferred interest in one of our subsidiaries that we will purchase from Marathon, to NTI LLC in exchange for NTI LLC Units. NTI LLC will distribute $ million to the Existing Owners and will retain $ million for general corporate purposes. | ||
| Voting rights |
Each share of our Class A common stock entitles its holder to one vote on all matters to be voted on by stockholders generally.
Each share of our Class B common stock entitles its holder to one vote on all matters to be voted on by stockholders generally.
Holders of our Class A common stock and Class B common stock vote together as a single class on all matters presented to our stockholders for their vote or approval, except as otherwise required by applicable law. See “Description of Capital Stock.” | |
| Dividend policy |
We do not anticipate paying any cash dividends on our Class A common stock. See “Dividend Policy.” | |
| Exchange rights of holders of NTI LLC Units |
Under the LLC Agreement, holders of NTI LLC Units may exchange their NTI LLC Units (along with a corresponding number of shares of our Class B common stock) for shares of our Class A common stock on a one-for-one basis, subject to customary conversion rate adjustments for stock splits, stock dividends and reclassifications. | |
| Risk factors |
You should carefully read and consider the information set forth under “Risk Factors” and all other information set forth in this prospectus before deciding to invest in our Class A common stock. | |
| Listing and trading symbol |
We intend to apply to list our Class A common stock on the New York Stock Exchange under the symbol “NTI.” | |
13
Table of Contents
Index to Financial Statements
Summary Historical and Unaudited Pro Forma Condensed Consolidated Financial and Other Data
The following tables present certain summary historical and unaudited pro forma condensed consolidated financial and other data. The combined financial statements for the years ended December 31, 2008 and 2009, the eleven months ended November 30, 2010 and the nine months ended September 30, 2010 represent a carve-out financial statement presentation of several operating units of Marathon, which we refer to as “Predecessor.” For more information on the carve-out presentation, see “Management’s Discussion and Analysis of Financial Condition and Results of Operations—Predecessor Carve-Out Financial Statements” and our financial statements and the notes thereto included elsewhere in this prospectus. The historical combined financial data for periods prior to December 1, 2010 presented below do not reflect the consummation of the Marathon Acquisition and the transactions related thereto or our capital structure following the Marathon Acquisition and the transactions related thereto. NTI LLC was formed on August 10, 2010 and entered into certain agreements with Marathon on October 6, 2010 to acquire the Marathon Assets. At the closing of the Marathon Acquisition on December 1, 2010, NTI LLC acquired the Marathon Assets. NTI LLC had no operating activities between its inception date and the closing date of the Marathon Acquisition, although it incurred various transaction and formation costs which have been included in the period August 10, 2010 (inception date) through December 31, 2010 (the “2010 Successor Period”).
The summary historical financial data as of December 31, 2009 and 2010, for the years ended December 31, 2008 and 2009, for the eleven months ended November 30, 2010 and for the 2010 Successor Period are derived from audited financial statements and the notes thereto included elsewhere in this prospectus. The summary historical combined balance sheet data as of December 31, 2008 and November 30, 2010 were derived from audited financial statements and the notes thereto that are not included in this prospectus.
The summary historical financial data as of September 30, 2011 and for the nine months ended September 30, 2010 and 2011 are derived from unaudited financial statements and the notes thereto included elsewhere in this prospectus. The summary historical combined balance sheet data as of September 30, 2010 was derived from unaudited financial statements and the notes thereto that are not included in this prospectus. The unaudited financial statements have been prepared on a basis consistent with the audited financial statements. In our opinion, such unaudited financial statements reflect all adjustments, consisting only of normal and recurring adjustments, necessary for a fair statement of the results for those periods. The results of operations for the interim periods are not necessarily indicative of the results to be expected for the full fiscal year.
The historical financial and other data presented below are not necessarily indicative of the results to be expected for any future period.
The summary unaudited pro forma condensed consolidated statements of operations data and other data presented below for the year ended December 31, 2010 and for the nine months ended September 30, 2010 give effect only to the Marathon Acquisition and the transactions related thereto as if they had occurred on January 1, 2010. The pro forma adjustments are based upon available information and certain assumptions that we believe are reasonable. There have been no pro forma adjustments made to the summary unaudited pro forma condensed consolidated financial data presented below to give effect to the reorganization and offering transactions described in “Organizational Structure.” The summary unaudited pro forma condensed consolidated financial data are for informational purposes only and do not purport to represent what our results actually would
14
Table of Contents
Index to Financial Statements
have been if the relevant transactions had occurred at any date, and such data do not purport to project our results for any future period or any future date. See “Unaudited Pro Forma Condensed Consolidated Financial Information” for a complete description of the adjustments and assumptions underlying the summary unaudited pro forma financial data.
You should read the tables along with “Risk Factors,” “Use of Proceeds,” “Capitalization,” “Selected Historical and Unaudited Pro Forma Condensed Consolidated Financial Data,” “Management’s Discussion and Analysis of Financial Condition and Results of Operations,” “Business” and our financial statements and the notes thereto included elsewhere in this prospectus.
| Predecessor | Successor | Pro Forma Marathon Acquisition |
Predecessor | Pro Forma Marathon Acquisition |
Successor | |||||||||||||||||||||||||||||||||
| Year Ended December 31, |
Eleven Months Ended November 30, 2010 |
August 10, 2010 (inception date) – December 31, 2010 |
Year Ended December 31, 2010 |
Nine Months Ended September 30, 2010 |
Nine Months Ended September 30, 2010 |
Nine Months Ended September 30, 2011 |
||||||||||||||||||||||||||||||||
| 2008 | 2009 | |||||||||||||||||||||||||||||||||||||
| (Dollars in millions, except per barrel/gallon data) | ||||||||||||||||||||||||||||||||||||||
| Consolidated and combined statements of operations data: |
||||||||||||||||||||||||||||||||||||||
| Total revenue |
$ | 4,122.4 | $ | 2,940.5 | $ | 3,195.2 | $ | 344.9 | $ | 3,540.1 | $ | 2,582.3 | $ | 2,582.3 | $ | 3,192.0 | ||||||||||||||||||||||
| Costs, expenses and other: |
||||||||||||||||||||||||||||||||||||||
| Cost of sales |
3,659.0 | 2,507.9 | 2,697.9 | 307.5 | 3,005.4 | 2,193.8 | 2,193.8 | 2,573.8 | ||||||||||||||||||||||||||||||
| Direct operating expenses |
252.7 | 238.3 | 227.0 | 21.4 | 265.1 | 183.4 | 197.1 | 194.8 | ||||||||||||||||||||||||||||||
| Turnaround and related expenses |
3.7 | 0.6 | 9.5 | – | 9.5 | 8.2 | 8.2 | 22.5 | ||||||||||||||||||||||||||||||
| Depreciation and amortization |
39.2 | 40.2 | 37.3 | 2.2 | 29.5 | 30.0 | 22.5 | 22.3 | ||||||||||||||||||||||||||||||
| Selling, general and administrative expenses |
67.7 | 64.7 | 59.6 | 6.4 | 66.0 | 47.0 | 47.0 | 65.4 | ||||||||||||||||||||||||||||||
| Formation costs |
– | – | – | 24.3 | – | – | – | 6.1 | ||||||||||||||||||||||||||||||
| Contingent consideration income |
– | – | – | – | – | – | – | (37.6 | ) | |||||||||||||||||||||||||||||
| Other (income) expense, net |
1.2 | (1.1 | ) | (5.4 | ) | 0.1 | (5.1 | ) | (4.3 | ) | (4.1 | ) | (2.4 | ) | ||||||||||||||||||||||||
|
|
|
|
|
|
|
|
|
|
|
|
|
|
|
|
|
|||||||||||||||||||||||
| Operating income (loss) |
$ | 98.9 | $ | 89.9 | $ | 169.3 | $ | (17.0 | ) | $ | 169.7 | $ | 124.2 | $ | 117.8 | $ | 347.1 | |||||||||||||||||||||
| Realized losses from derivative activities |
– | – | – | – | – | – | – | (246.4 | ) | |||||||||||||||||||||||||||||
| Unrealized losses from derivative activities |
– | – | (40.9 | ) | (27.1 | ) | (68.0 | ) | – | – | (334.5 | ) | ||||||||||||||||||||||||||
| Bargain purchase gain |
– | – | – | 51.4 | – | – | – | – | ||||||||||||||||||||||||||||||
| Interest expense |
(0.5 | ) | (0.4 | ) | (0.3 | ) | (3.2 | ) | (38.7 | ) | (0.2 | ) | (29.1 | ) | (30.6 | ) | ||||||||||||||||||||||
|
|
|
|
|
|
|
|
|
|
|
|
|
|
|
|
|
|||||||||||||||||||||||
| Earnings (loss) before income taxes |
98.4 | 89.5 | 128.1 | 4.1 | 63.0 | 124.0 | 88.7 | (264.4 | ) | |||||||||||||||||||||||||||||
| Income tax provision |
(39.8 | ) | (34.8 | ) | (67.1 | ) | – | – | (49.2 | ) | – | – | ||||||||||||||||||||||||||
|
|
|
|
|
|
|
|
|
|
|
|
|
|
|
|
|
|||||||||||||||||||||||
| Net earnings (loss) |
$ | 58.6 | $ | 54.7 | $ | 61.0 | $ | 4.1 | $ | 63.0 | $ | 74.8 | $ | 88.7 | $ | (264.4 | ) | |||||||||||||||||||||
| Less: net earnings attributable to noncontrolling preferred interest |
– | – | – | 0.6 | 7.2 | – | 5.4 | 5.5 | ||||||||||||||||||||||||||||||
|
|
|
|
|
|
|
|
|
|
|
|
|
|
|
|
|
|||||||||||||||||||||||
| Net earnings (loss) available to members |
$ | 58.6 | $ | 54.7 | $ | 61.0 | $ | 3.5 | $ | 55.8 | $ | 74.8 | $ | 83.3 | $ | (269.9 | ) | |||||||||||||||||||||
|
|
|
|
|
|
|
|
|
|
|
|
|
|
|
|
|
|||||||||||||||||||||||
15
Table of Contents
Index to Financial Statements
| Predecessor | Successor | Pro Forma Marathon Acquisition |
Predecessor | Pro Forma Marathon Acquisition |
Successor | |||||||||||||||||||||||||||||||||
| Year Ended December 31, |
Eleven Months Ended November 30, 2010 |
August 10, 2010 (inception date) – December 31, 2010 |
Year Ended December 31, 2010 |
Nine Months Ended September 30, 2010 |
Nine Months Ended September 30, 2010 |
Nine Months Ended September 30, 2011 |
||||||||||||||||||||||||||||||||
| 2008 | 2009 | |||||||||||||||||||||||||||||||||||||
| (Dollars in millions, except per barrel/gallon data) | ||||||||||||||||||||||||||||||||||||||
| Consolidated and combined statements of cash flow data: |
||||||||||||||||||||||||||||||||||||||
| Net cash provided by (used in): |
||||||||||||||||||||||||||||||||||||||
| Operating activities |
$ | 47.1 | $ | 129.4 | $ | 145.4 | $ | (18.5 | ) | $ | 73.5 | $ | 194.3 | |||||||||||||||||||||||||
| Investing activities |
(84.6 | ) | (25.0 | ) | (29.3 | ) | (363.3 | ) | (21.1 | ) | (140.2 | ) | ||||||||||||||||||||||||||
| Financing activities |
34.5 | (103.9 | ) | (115.4 | ) | 456.1 | (52.3 | ) | (1.5 | ) | ||||||||||||||||||||||||||||
| Capital expenditures |
(45.0 | ) | (29.0 | ) | (29.8 | ) | (2.5 | ) | (21.6 | ) | (27.4 | ) | ||||||||||||||||||||||||||
| Consolidated and combined balance sheets data (at period end): |
||||||||||||||||||||||||||||||||||||||
| Cash and cash equivalents |
$ | 5.5 | $ | 6.0 | $ | 6.7 | $ | 74.3 | $ | 6.1 | $ | 126.9 | ||||||||||||||||||||||||||
| Total assets |
708.2 | 710.1 | 717.8 | 932.1 | 696.1 | 992.5 | ||||||||||||||||||||||||||||||||
| Total long-term debt |
– | – | – | 314.5 | – | 314.5 | ||||||||||||||||||||||||||||||||
| Total liabilities |
292.7 | 343.9 | 405.4 | 647.9 | 306.8 | 973.1 | ||||||||||||||||||||||||||||||||
| Total noncontrolling preferred interest in subsidiary |
– | – | – | 80.6 | – | 86.1 | ||||||||||||||||||||||||||||||||
| Total equity (deficit) (1) |
$ | 415.5 | $ | 366.2 | $ | 312.4 | $ | 203.6 | $ | 389.3 | $ | (66.7 | ) | |||||||||||||||||||||||||
| Other data: |
||||||||||||||||||||||||||||||||||||||
| Adjusted EBITDA (2) |
$ | 145.3 | $ | 135.2 | $ | 220.1 | $ | 9.9 | $ | 213.1 | $ | 165.5 | $ | 151.6 | $ | 364.2 | ||||||||||||||||||||||
| Refinery segment data: |
||||||||||||||||||||||||||||||||||||||
| Refinery feedstocks (bpd): |
||||||||||||||||||||||||||||||||||||||
| Light and intermediate crude |
61,637 | 59,112 | 55,402 | 59,872 | 55,002 | 54,914 | ||||||||||||||||||||||||||||||||
| Heavy crude |
11,169 | 15,427 | 18,693 | 14,777 | 18,379 | 21,915 | ||||||||||||||||||||||||||||||||
| Other feedstocks/ blendstocks |
7,986 | 7,024 | 5,971 | 6,487 | 5,865 | 3,865 | ||||||||||||||||||||||||||||||||
|
|
|
|
|
|
|
|
|
|
|
|
|
|||||||||||||||||||||||||||
| Total throughput |
80,792 | 81,563 | 80,066 | 81,136 | 79,246 | 80,694 | ||||||||||||||||||||||||||||||||
|
|
|
|
|
|
|
|
|
|
|
|
|
|||||||||||||||||||||||||||
| Refinery product yields (bpd): |
||||||||||||||||||||||||||||||||||||||
| Gasoline |
41,140 | 42,674 | 41,080 | 42,485 | 40,798 | 40,238 | ||||||||||||||||||||||||||||||||
| Distillates |
24,264 | 22,876 | 22,201 | 26,258 | 21,409 | 23,851 | ||||||||||||||||||||||||||||||||
| Asphalt |
6,499 | 7,688 | 9,532 | 9,099 | 9,313 | 11,169 | ||||||||||||||||||||||||||||||||
| Other |
9,622 | 8,888 | 8,145 | 4,011 | 8,523 | 5,915 | ||||||||||||||||||||||||||||||||
|
|
|
|
|
|
|
|
|
|
|
|
|
|||||||||||||||||||||||||||
| Total production |
81,525 | 82,126 | 80,958 | 81,853 | 80,043 | 81,173 | ||||||||||||||||||||||||||||||||
|
|
|
|
|
|
|
|
|
|
|
|
|
|||||||||||||||||||||||||||
16
Table of Contents
Index to Financial Statements
| Predecessor | Successor | Pro Forma Marathon Acquisition |
Predecessor | Pro Forma Marathon Acquisition |
Successor | |||||||||||||||||||||||||||||
| Year Ended December 31, |
Eleven Months Ended November 30, 2010 |
August 10, 2010 (inception date) – December 31, 2010 |
Year Ended December 31, 2010 |
Nine Months Ended September 30, 2010 |
Nine Months Ended September 30, 2010 |
Nine Months Ended September 30, 2011 |
||||||||||||||||||||||||||||
| 2008 | 2009 | |||||||||||||||||||||||||||||||||
| (Dollars in millions, except per barrel/gallon data) | ||||||||||||||||||||||||||||||||||
| Refinery gross product margin per barrel of throughput(3) |
$ | 10.22 | $ | 9.36 | $ | 12.86 | $ | 9.94 | $ | 12.22 | $ | 22.31 | ||||||||||||||||||||||
| SPP Refinery 3:2:1 crack spread (per barrel) (4) |
$ | 13.75 | $ | 10.35 | $ | 15.12 | $ | 13.85 | $ | 15.06 | $ | 30.53 | ||||||||||||||||||||||
| Group 3 3:2:1 crack spread (per barrel) (4) |
$ | 10.92 | $ | 7.94 | $ | 9.34 | $ | 9.88 | $ | 9.53 | $ | 26.90 | ||||||||||||||||||||||
| Retail segment data: |
||||||||||||||||||||||||||||||||||
| Gallons sold (in millions) |
340.6 | 335.7 | 316.0 | 29.1 | 259.0 | 245.8 | ||||||||||||||||||||||||||||
| Retail fuel margin per gallon (for company-operated stores) (5) |
$ | 0.17 | $ | 0.14 | $ | 0.17 | $ | 0.16 | $ | 0.16 | $ | 0.20 | ||||||||||||||||||||||
| (1) | Total equity for the Predecessor represents a net balance reflecting Marathon’s investment and the effect of participation in Marathon’s centralized cash management programs. All cash receipts were remitted to, and all cash disbursements were funded by, Marathon. Other transactions affecting the net investment include general, administrative and overhead costs incurred by Marathon that were allocated to the Predecessor. There are no terms of settlement or interest charges associated with the net investment balance. |
| (2) | EBITDA is defined as net (loss) earnings before interest expense (income), income taxes and depreciation and amortization. Adjusted EBITDA is defined as EBITDA before turnaround and related expenses, stock-based compensation expense, gains (losses) from derivative activities, contingent consideration, formation costs, bargain purchase gain and adjustments to reflect proportionate EBITDA from the Minnesota Pipeline operations. We believe Adjusted EBITDA is an important measure of operating performance and provides useful information to investors because it highlights trends in our business that may not otherwise be apparent when relying solely on GAAP measures and because it eliminates items that have less bearing on our operating performance. |
| Adjusted EBITDA, as presented herein, is a supplemental measure of our performance that is not required by, or presented in accordance with, GAAP. We use non-GAAP financial measures as supplements to our GAAP results in order to provide a more complete understanding of the factors and trends affecting our business. Adjusted EBITDA is a measure of operating performance that is not defined by GAAP and should not be considered a substitute for net (loss) earnings as determined in accordance with GAAP. |
| Set forth below is additional detail as to how we use Adjusted EBITDA as a measure of operating performance, as well as a discussion of the limitations of Adjusted EBITDA as an analytical tool. |
| Operating Performance. Management uses Adjusted EBITDA in a number of ways to assess our combined financial and operating performance, and we believe this measure is helpful to management and investors in identifying trends in our performance. We use Adjusted EBITDA as a measure of our combined operating performance exclusive of income and expenses that relate to the financing, derivative activities, income taxes and capital investments of the business, adjusted to reflect EBITDA from the Minnesota Pipeline operations. In addition, Adjusted EBITDA helps management identify controllable expenses and make decisions designed to help us meet our current financial goals and optimize our financial performance. Accordingly, we believe this metric measures our financial performance based on operational factors that management can impact in the short-term, namely the cost structure and expenses of the organization. |
| Limitations. Other companies, including other companies in our industry, may calculate Adjusted EBITDA differently than we do, limiting its usefulness as a comparative measure. Adjusted EBITDA also has limitations as an analytical tool and should not be considered in isolation or as a substitute for analysis of our results as reported under GAAP. Some of these limitations include that Adjusted EBITDA: |
| • | does not reflect our cash expenditures, or future requirements, for capital expenditures or contractual commitments; |
| • | does not reflect changes in, or cash requirements for, our working capital needs; |
| • | does not reflect our interest expense, or the cash requirements necessary to service interest or principal payments, on our debt; |
| • | does not reflect the equity income in our Minnesota Pipe Line Company investment, but includes 17% of the calculated EBITDA of Minnesota Pipe Line Company; |
| • | does not reflect realized and unrealized gains and losses from hedging activities; |
| • | does not reflect certain other non-cash income and expenses; and |
| • | excludes income taxes that may represent a reduction in available cash. |
17
Table of Contents
Index to Financial Statements
| The following table shows the reconciliation of net (loss) earnings, the most directly comparable GAAP measure, to EBITDA and Adjusted EBITDA for the years ended December 31, 2008 and 2009, for the eleven months ended November 30, 2010, for the 2010 Successor Period, for the nine months ended September 30, 2010 and 2011, and pro forma for the Marathon Acquisition for the year ended December 31, 2010 and the nine months ended September 30, 2010: |
| Predecessor | Successor | Pro Forma Marathon Acquisition |
Predecessor | Pro Forma Marathon Acquisition |
Successor | |||||||||||||||||||||||||||||||||
| Year Ended December 31, |
Eleven Months Ended November 30, 2010 |
August 10, 2010 (inception date) - December 31, 2010 |
Year Ended December 31, 2010 |
Nine Months Ended September 30, 2010 |
Nine Months Ended September 30, 2010 |
Nine Months Ended September 30, 2011 |
||||||||||||||||||||||||||||||||
| 2008 | 2009 | |||||||||||||||||||||||||||||||||||||
| (In millions) | ||||||||||||||||||||||||||||||||||||||
| Net (loss) earnings |
$ | 58.6 | $ | 54.7 | $ | 61.0 | $ | 4.1 | $ | 63.0 | $ | 74.8 | $ | 88.7 | $ | (264.4 | ) | |||||||||||||||||||||
| Adjustments: |
||||||||||||||||||||||||||||||||||||||
| Interest expense |
0.5 | 0.4 | 0.3 | 3.2 | 38.7 | 0.2 | 29.1 | 30.6 | ||||||||||||||||||||||||||||||
| Depreciation and amortization |
39.2 | 40.2 | 37.3 | 2.2 | 29.5 | 30.0 | 22.5 | 22.3 | ||||||||||||||||||||||||||||||
| Income tax provision |
39.8 | 34.8 | 67.1 | — | — | 49.2 | — | — | ||||||||||||||||||||||||||||||
|
|
|
|
|
|
|
|
|
|
|
|
|
|
|
|
|
|||||||||||||||||||||||
| EBITDA subtotal |
138.1 | 130.1 | 165.7 | 9.5 | 131.2 | 154.2 | 140.3 | (211.5 | ) | |||||||||||||||||||||||||||||
| Minnesota Pipe Line Company proportionate EBITDA |
3.2 | 4.2 | 3.7 | 0.3 | 4.0 | 2.9 | 2.9 | 2.7 | ||||||||||||||||||||||||||||||
| Turnaround and related expenses |
3.7 | 0.6 | 9.5 | — | 9.5 | 8.2 | 8.2 | 22.5 | ||||||||||||||||||||||||||||||
| Stock-based compensation expense |
0.3 | 0.3 | 0.3 | 0.1 | 0.4 | 0.2 | 0.2 | 1.1 | ||||||||||||||||||||||||||||||
| Unrealized losses on derivative activities |
— | — | 40.9 | 27.1 | 68.0 | — | — | 334.5 | ||||||||||||||||||||||||||||||
| Contingent consideration income |
— | — | — | — | — | — | — | (37.6 | ) | |||||||||||||||||||||||||||||
| Formation costs |
— | — | — | 24.3 | — | — | — | 6.1 | ||||||||||||||||||||||||||||||
| Bargain purchase gain |
— | — | — | (51.4 | ) | — | — | — | — | |||||||||||||||||||||||||||||
| Realized losses on derivative activities |
— | — | — | — | — | — | — | 246.4 | ||||||||||||||||||||||||||||||
|
|
|
|
|
|
|
|
|
|
|
|
|
|
|
|
|
|||||||||||||||||||||||
| Adjusted EBITDA |
$ | 145.3 | $ | 135.2 | $ | 220.1 | $ | 9.9 | $ | 213.1 | $ | 165.5 | $ | 151.6 | $ | 364.2 | ||||||||||||||||||||||
|
|
|
|
|
|
|
|
|
|
|
|
|
|
|
|
|
|||||||||||||||||||||||
| (3) | Refinery gross product margin per barrel of throughput is a per barrel measurement calculated by subtracting refinery costs of sales from total refinery revenues and dividing the difference by the total throughput for the respective periods presented. Refinery gross product margin per barrel of throughput is a non-GAAP performance measure that we believe is important to investors in evaluating our refinery performance as a general indication of the amount above our cost of products that we are able to sell refined products. Each of the components used in this calculation (revenues and cost of sales) can be reconciled directly to our statements of operations. Our calculation of refinery gross product margin per barrel of throughput may differ from similar calculations of other companies in our industry, thereby limiting its usefulness as a comparative measure. |
18
Table of Contents
Index to Financial Statements
| The following table shows the reconciliation of refining gross product margin per barrel of throughput for the years ended December 31, 2008 and 2009, for the eleven months ended November 30, 2010, for the 2010 Successor Period and for the nine months ended September 30, 2010 and 2011: |
| Predecessor | Successor | Pro Forma Marathon Acquisition |
Predecessor | Pro Forma Marathon Acquisition |
Successor | |||||||||||||||||||||||||||||
| Year Ended December 31, |
Eleven Months Ended November 30, 2010 |
August 10, 2010 (inception date)— December 31, 2010 |
Year Ended December 31, 2010 |
Nine Months Ended September 30, 2010 |
Nine Months Ended September 30, 2010 |
Nine Months Ended September 30, 2011 |
||||||||||||||||||||||||||||
| 2008 | 2009 | |||||||||||||||||||||||||||||||||
| (In millions except per gallon data) | ||||||||||||||||||||||||||||||||||
| Refinery revenue |
$ | 3,719.2 | $ | 2,530.7 | $ | 2,799.8 | $ | 312.2 | $ | 2,260.2 | $ | 2,857.7 | ||||||||||||||||||||||
| Refinery costs of sales |
3,417.1 | 2,252.1 | 2,455.9 | 287.2 | 1,995.8 | 2,366.3 | ||||||||||||||||||||||||||||
|
|
|
|
|
|
|
|
|
|
|
|
|
|||||||||||||||||||||||
| Refinery gross product margin |
$ | 302.1 | $ | 278.6 | $ | 343.9 | $ | 25.0 | $ | 264.4 | $ | 491.4 | ||||||||||||||||||||||
|
|
|
|
|
|
|
|
|
|
|
|
|
|||||||||||||||||||||||
| Throughput (barrels) |
29.6 | 29.8 | 26.8 | 2.5 | 21.6 | 22.0 | ||||||||||||||||||||||||||||
|
|
|
|
|
|
|
|
|
|
|
|
|
|||||||||||||||||||||||
| Refinery gross product margin per barrel of throughput |
$ | 10.22 | $ | 9.36 | $ | 12.86 | $ | 9.94 | $ | 12.22 | $ | 22.31 | ||||||||||||||||||||||
|
|
|
|
|
|
|
|
|
|
|
|
|
|||||||||||||||||||||||
| (4) | We use the Group 3 3:2:1 crack spread as a benchmark for our refinery. The Group 3 3:2:1 crack spread is expressed in dollars per barrel and is a proxy for the per barrel margin that a sweet crude oil refinery would earn assuming it produced and sold at PADD II Group 3 prices the benchmark production of two barrels of gasoline and one barrel of ultra low sulfur diesel for every three barrels of light, sweet crude oil input. For more information about the Group 3 3:2:1 crack spread see “Management’s Discussion and Analysis of Financial Condition and Results of Operations—Major Influences on Results of Operations.” |
| Our SPP Refinery 3:2:1 crack spread is derived using a similar methodology as the Group 3 3:2:1 crack spread and is calculated by taking the sum of (i) two times our weighted average per barrel price received for our gasoline products plus (ii) our average per barrel price received for distillate, divided by three; then subtracting from that sum our weighted average cost of crude oil supply per barrel. The SPP Refinery 3:2:1 crack spread is not a full representation of our realized refinery gross product margin because the Group 3 3:2:1 crack spread is composed only of gasoline and distillate, whereas our refinery gross product margin is calculated using all of our refined products including asphalt and other lower margin products. |
| (5) | Retail fuel margin per gallon is calculated by dividing retail fuel gross margin by the fuel gallons sold at company-operated stores. Retail fuel gross margin is a non-GAAP performance measure that we believe is important to investors in evaluating our retail performance. Our calculation of retail fuel gross margin may differ from similar calculations of other companies in our industry, thereby limiting its usefulness as a comparative measure. |
19
Table of Contents
Index to Financial Statements
| The following table shows the reconciliation of retail fuel gross margin and merchandise margin to retail segment operating income for the years ended December 31, 2008 and 2009, for the eleven months ended November 30, 2010, for the 2010 Successor Period and for the nine months ended September 30, 2010 and 2011: |
| Predecessor | Successor | Pro Forma Marathon Acquisition |
Predecessor | Pro Forma Marathon Acquisition |
Successor | |||||||||||||||||||||||||||||
| Year Ended December 31, |
Eleven Months Ended November 30, 2010 |
August
10, 2010 (inception date) December 31, 2010 |
Year Ended December 31, 2010 |
Nine Months Ended September 30, 2010 |
Nine Months Ended September 30, 2010 |
Nine Months Ended September 30, 2011 |
||||||||||||||||||||||||||||
| 2008 | 2009 | |||||||||||||||||||||||||||||||||
| Retail gross margin: |
||||||||||||||||||||||||||||||||||
| Fuel margin |
$ | 58.7 | $ | 47.1 | $ | 54.3 | $ | 4.7 | $ | 42.1 | $ | 49.0 | ||||||||||||||||||||||
| Merchandise margin |
102.6 | 106.9 | 99.1 | 7.8 | 82.0 | 77.8 | ||||||||||||||||||||||||||||
|
|
|
|
|
|
|
|
|
|
|
|
|
|||||||||||||||||||||||
| Retail gross margin |
161.3 | 154.0 | 153.4 | 12.5 | 124.1 | 126.8 | ||||||||||||||||||||||||||||
| Expenses: |
||||||||||||||||||||||||||||||||||
| Direct operating expenses |
105.2 | 100.0 | 94.9 | 10.2 | 76.9 | 98.4 | ||||||||||||||||||||||||||||
| Depreciation and amortization |
14.8 | 14.2 | 12.4 | 0.5 | 10.1 | 6.0 | ||||||||||||||||||||||||||||
| Selling, general and administrative |
20.1 | 20.5 | 19.6 | 1.3 | 15.8 | 12.8 | ||||||||||||||||||||||||||||
|
|
|
|
|
|
|
|
|
|
|
|
|
|||||||||||||||||||||||
| Retail segment operating income |
$ | 21.2 | $ | 19.3 | $ | 26.5 | $ | 0.5 | $ | 21.3 | $ | 9.6 | ||||||||||||||||||||||
|
|
|
|
|
|
|
|
|
|
|
|
|
|||||||||||||||||||||||
20
Table of Contents
Index to Financial Statements
Investing in our Class A common stock involves a high degree of risk. You should carefully consider the risks described below together with the other information set forth in this prospectus before making an investment decision. Our business, financial condition or results of operations could be materially adversely affected by the occurrence of any of the following risks. Additionally, the trading price of our Class A common stock could decline due to the occurrence of any of these risks, and you may lose all or part of your investment. The risks discussed below are not the only risks we face. We may experience additional risks and uncertainties not currently known to us, or as a result of developments occurring in the future. Conditions that we currently deem to be immaterial may also materially and adversely affect our business, financial condition, cash flows and results of operations.
Risks Related to Our Business and Industry
General Business and Industry Risks
Our arrangements with Marathon expose us to Marathon related credit and performance risk.
We have a contract with Marathon under which we will continue to supply substantially all of the gasoline and diesel requirements for the 90 independently owned and operated Marathon branded stores in our marketing area. In addition, the acquisition agreements entered into in connection with the Marathon Acquisition include a margin support component that requires Marathon to pay us up to $30 million in cash to the extent that certain financial metrics are not achieved in either of the twelve-month periods ending November 30, 2011 and 2012, resulting in up to a maximum of $60 million potentially being payable to us. In addition, Marathon has indemnification obligations to us pursuant to the agreements entered into in connection with the Marathon Acquisition. Marathon’s indemnification obligation resulting from any breach of representations and warranties generally are limited by an indemnification deductible of $25 million and an indemnification ceiling of $100 million and are guaranteed by Marathon Petroleum.
Marathon Petroleum has guaranteed the performance of all of Marathon’s obligations under all of the acquisition agreements entered into in connection with the Marathon Acquisition, including the obligations discussed above. Nevertheless, relying on Marathon’s ability to honor its margin support obligations, fuel requirements purchase obligations and indemnity obligations, and on Marathon Petroleum’s ability to honor its guaranty obligations, will expose us to Marathon’s and Marathon Petroleum’s respective credit and business risks. In addition, there can be no assurance that claims resulting from any breach of Marathon’s representations and warranties under the acquisition agreements entered into in connection with the Marathon Acquisition will not exceed the $100 million indemnification ceiling. Moreover, selling products to Marathon under the supply contract and relying on Marathon’s ability to honor its margin support obligations can expose us to Marathon’s credit and general business risks. An adverse change in Marathon’s or Marathon Petroleum’s business, results of operations or financial condition could adversely affect their respective ability to perform each of these obligations, which could consequently have a material adverse effect on our business, results of operations or liquidity.
Our historical financial statements may not be indicative of future performance.
The historical financial statements for periods prior to December 1, 2010 presented in this prospectus reflect carve-out financial statements of several operating units of Marathon, which, except for certain assets that were not acquired (e.g., cash other than in-store cash at our convenience stores and receivables and assets sold to third parties) and certain liabilities (e.g., accounts payable, payroll and benefits payable and deferred taxes) that were not assumed in connection with the Marathon Acquisition, represent the assets and liabilities that were transferred to us upon the closing of the Marathon Acquisition.
21
Table of Contents
Index to Financial Statements
We now own the assets and operate them as a standalone business. Prior to the closing of the Marathon Acquisition, we had no history of operating these assets, and they were never operated as a standalone business, thus the historical results presented in the financial statements for the periods prior to the Marathon Acquisition are not necessarily comparable to our financial statements following the Marathon Acquisition or indicative of the results for any future period. Additionally, we entered into certain arrangements at the closing of the Marathon Acquisition, including our crude oil supply and logistics agreement with JPM CCC and a lease arrangement with Realty Income, that resulted in our working capital needs and operating costs varying from those affecting the assets that we acquired from Marathon. The pre-Marathon Acquisition historical financial information reflects intercompany allocations of expenses which may not be indicative of the actual expenses that would have been incurred had the combined businesses been operating as a company independent from Marathon for the periods presented. In addition, our results of operations for periods subsequent to the closing of this offering may not be comparable to our results of operations for periods prior to the closing of this offering as a result of certain transactions undertaken in connection with this offering and the reorganization described in “Organizational Structure.” See “Management’s Discussion and Analysis of Financial Condition and Results of Operations—Comparability of Historical Results” for a discussion of factors that affect comparability. As a result, it is difficult to evaluate our historical results of operations to assess our future prospects and viability.
Our liquidity may be adversely affected by a reduction in third party credit.
We rely on third party credit for approximately 50% of our crude oil and other feedstock purchases. We purchase the remaining crude oil and other feedstocks via a crude oil intermediation agreement with JPM CCC, which provides logistical and administrative support to us for both the crude oil we source from them as well as the crude oil we source from our suppliers. We pay for domestic crude oil purchases on the 20th of the month following the month of delivery and for Canadian crude oil purchases on the 25th of the month following the month of delivery. If our suppliers who sell crude oil and other feedstocks to us on trade credit were to reduce or eliminate our credit lines, we would be required to fund our purchases through our revolving credit facility or our crude oil supply and logistics agreement with JPM CCC, which would have a negative impact on liquidity.
We may have capital needs for which our internally generated cash flows and other sources of liquidity may not be adequate.
If we cannot generate sufficient cash flows or otherwise secure sufficient liquidity to support our short-term and long-term capital requirements, we may not be able to meet our payment obligations under the agreements entered into in connection with the Marathon Acquisition or our future debt obligations, comply with certain deadlines related to environmental regulations and standards or pursue our business strategies, any of which could have a material adverse effect on our results of operations or liquidity. We have substantial short-term capital needs and may have substantial long-term capital needs. Our short-term working capital needs are primarily related to financing our refined product inventory. Our long-term needs for cash include those to support ongoing capital expenditures for equipment maintenance and upgrades during turnarounds at our refinery and to complete our routine and normally scheduled maintenance, regulatory and security expenditures. In addition, from time to time, we are required to spend significant amounts for repairs when one or more processing units experiences temporary shutdowns. We continue to utilize significant capital to upgrade equipment, improve facilities, and reduce operational, safety and environmental risks. We may incur substantial compliance costs in connection with any new environmental, health and safety regulations. Additionally, we may be required to pay up to $125 million to Marathon in contingent consideration for the Marathon Acquisition over the next seven years. Our liquidity will affect our ability to satisfy any of these needs.
22
Table of Contents
Index to Financial Statements
Competition from companies having greater financial and other resources than we do could materially and adversely affect our business and results of operations.
Our refining operations compete with domestic refiners and marketers in the PADD II region of the United States, as well as with domestic refiners in other PADD regions and foreign refiners that import products into the United States. In addition, we compete with producers and marketers in other industries that supply alternative forms of energy and fuels to satisfy the requirements of our industrial, commercial and individual customers. Certain of our competitors have larger, more complex refineries, and may be able to realize lower per-barrel costs or higher margins per barrel of throughput. Several of our principal competitors are integrated national or international oil companies that are larger and have substantially greater resources than we do and have access to proprietary sources of controlled crude oil production. Unlike these competitors, we obtain substantially all of our feedstocks from unaffiliated sources. Because of their integrated operations and larger capitalization, these companies may be more flexible in responding to volatile industry or market conditions, such as shortages of crude oil supply and other feedstocks or intense price fluctuations.
Newer or upgraded refineries will often be more efficient than our refinery, which may put us at a competitive disadvantage. While we have taken significant measures to maintain and upgrade units in our refinery by installing new equipment and repairing equipment to improve our operations, these actions involve significant uncertainties, since upgraded equipment may not perform at expected throughput levels, the yield and product quality of new equipment may differ from design specifications and modifications may be needed to correct equipment that does not perform as expected. Any of these risks associated with new equipment, redesigned older equipment or repaired equipment could lead to lower revenues or higher costs or otherwise have an adverse effect on future results of operations and financial condition. Over time, our refinery may become obsolete, or be unable to compete, because of the construction of new, more efficient facilities by our competitors.
Our retail operations compete with numerous convenience stores, gasoline service stations, supermarket chains, drug stores, fast food operations and other retail outlets. Increasingly, national high-volume grocery and dry-goods retailers are entering the gasoline retailing business. Many of these competitors are substantially larger than we are. Because of their diversity, integration of operations and greater resources, these companies may be better able to withstand volatile market conditions or levels of low or no profitability. In addition, these retailers may use promotional pricing or discounts, both at the pump and in the store, to encourage in-store merchandise sales. These activities by our competitors could adversely affect our profit margins. Additionally, our convenience stores could lose market share, relating to both gasoline and merchandise, to these and other retailers, which could adversely affect our business, results of operations and cash flows. Our convenience stores compete in large part based on their ability to offer convenience to customers. Consequently, changes in traffic patterns and the type, number and location of competing stores could result in the loss of customers and reduced sales and profitability at affected stores.
Difficult conditions resulting from the ongoing U.S. and worldwide financial and credit crisis, and potential further deteriorating conditions in the United States and globally, may materially adversely affect our business, results of operations and financial condition.
Continual volatility and disruption in worldwide capital and credit markets and potential further deteriorating conditions in the United States and globally could affect our revenues and earnings negatively and could have a material adverse effect on our business, results of operations and financial condition. We are indirectly exposed to risks faced by our suppliers, customers and other business partners. The impact on these constituencies of the risks posed by continued economic turmoil have included, or can include, interruptions or delays in the performance by counterparties to our contracts, reductions and delays in customer purchases, delays in or the inability of customers to obtain financing to purchase our products and the inability of customers to pay for our products. All of these events may significantly adversely impact our business, results of operations and financial condition.
23
Table of Contents
Index to Financial Statements
The geographic concentration of our refinery and retail assets creates a significant exposure to the risks of the local economy and other local adverse conditions. The location of our refinery also creates the risk of significantly increased transportation costs should the supply/demand balance shift in our region such that regional supply exceeds regional demand for refined products.
As our refinery and a significant number of our stores are located in Minnesota, Wisconsin and South Dakota, we primarily market our refined and retail products in a single, relatively limited geographic area. As a result, we are more susceptible to regional economic conditions than the operations of more geographically diversified competitors, and any unforeseen events or circumstances that affect our operating area could also materially adversely affect our revenues and profitability. These factors include, among other things, changes in the economy, weather conditions, demographics and population.
Should the supply/demand balance shift in our region as a result of changes in the local economy discussed above, an increase in refining capacity or other reasons, resulting in supply in the PADD II region exceeding demand, we would have to deliver refined products to customers outside of the region and thus incur considerably higher transportation costs, resulting in lower refining margins, if any. Changes in market conditions could have a material adverse effect on our business, financial condition and results of operations.
Our operating results are seasonal and generally lower in the first and fourth quarters of the year for our refining business and in the first quarter of the year for our retail business. We depend on favorable weather conditions in the spring and summer months.
Demand for gasoline is generally higher during the summer months than during the winter months due to seasonal increases in highway traffic. Decreased demand during the winter months can lead to lower gasoline prices. As a result, our operating results of our refining business for the first and fourth calendar quarters are generally lower than those for the second and third calendar quarters of each year.
Seasonal fluctuations in traffic also affect sales of motor fuels and merchandise in our retail fuel and convenience stores. As a result, our operating results of our retail business are generally lower for the first quarter of the year. Weather conditions in our operating area also have a significant effect on our retail operating results. Customers are more likely to purchase higher profit margin items at our retail fuel and convenience stores, such as fast foods, fountain drinks and other beverages and more gasoline during the spring and summer months, thereby typically generating higher revenues and gross margins for us in these periods. Unfavorable weather conditions during these months and a resulting lack of the expected seasonal upswings in traffic and sales could have a material adverse effect on our business, financial condition and results of operations.
Weather conditions and natural disasters could materially and adversely affect our business and operating results.
The effects of weather conditions and natural disasters can lead to volatility in the costs and availability of energy and raw materials or negatively impact our operations or those of our customers and suppliers, which could have a significant adverse effect on our business and results of operations.
24
Table of Contents
Index to Financial Statements
We may not be able to successfully execute our strategy of growth within the refining and retail industry through acquisitions.
A component of our growth strategy is to selectively consider strategic acquisitions within the refining industry and retail market based on performance through the refining cycle, advantageous access to crude oil supplies, attractive refined products market fundamentals and access to distribution and logistics infrastructure. Our ability to do so will be dependent upon a number of factors, including our ability to identify acceptable acquisition candidates, consummate acquisitions on favorable terms, successfully integrate acquired assets and obtain financing to fund acquisitions and to support our growth and many other factors beyond our control. Risks associated with acquisitions include those relating to:
| Ÿ | diversion of management time and attention from our existing business; |
| Ÿ | challenges in managing the increased scope, geographic diversity and complexity of operations; |
| Ÿ | difficulties in integrating the financial, technological and management standards, processes, procedures and controls of an acquired business with those of our existing operations; |
| Ÿ | liability for known or unknown environmental conditions or other contingent liabilities not covered by indemnification or insurance; |
| Ÿ | greater than anticipated expenditures required for compliance with environmental, safety or other regulatory standards or for investments to improve operating results; |
| Ÿ | our inability to offer competitive terms to our franchisees to grow our franchise business; |
| Ÿ | difficulties in achieving anticipated operational improvements; and |
| Ÿ | incurrence of additional indebtedness to finance acquisitions or capital expenditures relating to acquired assets. |
We may not be successful in acquiring additional assets, and any acquisitions that we do consummate may not produce the anticipated benefits or may have adverse effects on our business and operating results.
Our business may suffer if any of our key senior executives or other key employees discontinues employment with us. Furthermore, a shortage of skilled labor or disruptions in our labor force may make it difficult for us to maintain labor productivity.
Our future success depends to a large extent on the services of our senior executives and other key employees and on our continuing ability to recruit, train and retain highly qualified employees in all areas of our operations, including accounting, business operations, finance and other key back-office and mid-office personnel. Furthermore, our operations require skilled and experienced employees with proficiency in multiple tasks. The competition for these employees is intense, and the loss of these executives or employees could harm our business. If any of these executives or other key personnel resign or become unable to continue in their present roles and are not adequately replaced, our business could be materially adversely affected. We do not maintain, nor do we plan to obtain, any insurance against the loss of any of these individuals.
Our operations could be disrupted if our information systems fail, causing increased expenses and loss of sales.
Our business is highly dependent on financial, accounting and other data processing systems and other communications and information systems, including our enterprise resource planning tools. We process a large number of transactions on a daily basis and rely upon the proper functioning of computer systems. If a key system were to fail or experience unscheduled downtime for any reason,
25
Table of Contents
Index to Financial Statements
even if only for a short period, our operations and financial results could be affected adversely. Our systems could also be damaged or interrupted by a security breach, fire, flood, power loss, telecommunications failure or similar event. Our formal disaster recovery plan may not prevent delays or other complications that could arise from an information systems failure. Further, our business interruption insurance may not compensate us adequately for losses that may occur.
During the fourth quarter of 2011, we transitioned from the finance and accounting information services provided by Marathon pursuant to a transition services agreement to our own stand-alone systems. While the initial transition occurred without significant issues, there can be no assurance that our new systems will continue to be effective.
We may incur significant liability under, or costs and capital expenditures to comply with, environmental, health and safety regulations, which are complex and change frequently.
Our refinery, pipelines and retail operations are subject to federal, state and local laws regulating, among other things, the generation, storage, handling, use and transportation of petroleum and hazardous substances, the emission and discharge of materials into the environment, waste management, characteristics and composition of gasoline and diesel and other matters otherwise relating to the protection of the environment. Our operations are also subject to various laws and regulations relating to occupational health and safety. Compliance with the complex array of federal, state and local laws relating to the protection of the environment, health and safety is difficult and likely will require us to make significant expenditures. Moreover, our business is inherently subject to accidental spills, discharges or other releases of petroleum or hazardous substances into the environment including at neighboring areas or third party storage, treatment or disposal facilities. For example, we have performed remediation of known soil and groundwater contamination beneath certain of our retail locations primarily as a result of leaking underground storage tanks, and we will continue to perform remediation of this known contamination until the appropriate regulatory standards have been achieved. Certain environmental laws impose joint and several liability without regard to fault or the legality of the original conduct in connection with the investigation and cleanup of such spills, discharges or releases. As such, we may be required to pay more than our fair share of such investigation or cleanup. We may not be able to operate in compliance with all applicable environmental, health and safety laws, regulations and permits at all times. Violations of applicable legal or regulatory requirements could result in substantial fines, criminal sanctions, permit revocations, injunctions and/or facility shutdowns. We may also be required to make significant capital expenditures or incur increased operating costs to achieve compliance with applicable standards.
We cannot predict what additional environmental, health and safety legislation or regulations will be enacted or become effective in the future or how existing or future laws or regulations will be administered or interpreted with respect to our operations. Many of these laws and regulations are becoming increasingly stringent, and the cost of compliance with these requirements can be expected to increase over time. Expenditures or costs for environmental, health and safety compliance could have a material adverse effect on our results of operations, financial condition and profitability.
We could incur significant costs in cleaning up contamination at our refinery, terminal and convenience stores.
Our refinery site has been used for refining activities for many years. Petroleum hydrocarbons and various substances have been released on or under our refinery site. Marathon performed remediation of known soil and groundwater contamination beneath the refinery for many years, and we will continue to perform remediation of this known contamination until the appropriate regulatory standards have been achieved. These remediation efforts are being overseen by the Minnesota Pollution Control Agency (“MPCA”) pursuant to a remediation settlement agreement entered into by
26
Table of Contents
Index to Financial Statements
Marathon and MPCA in 2007. Releases of petroleum hydrocarbons have also occurred at several of our convenience stores, and we have performed and will continue to perform remediation of this known contamination until the applicable regulatory standards are met. Costs for such remediation activities are often unpredictable, and there can be no assurance that the future costs will not be material. It is possible that we may identify additional contamination in the future, which could result in additional remediation obligations and expenses.
We are subject to strict laws and regulations regarding employee and business process safety, and failure to comply with these laws and regulations could have a material adverse effect on our results of operations and financial condition.
We are subject to the requirements of OSHA and comparable state statutes that regulate the protection of the health and safety of workers. In addition, OSHA requires that we maintain information about hazardous materials used or produced in our operations and that we provide this information to employees, state and local governmental authorities, and local residents. Failure to comply with OSHA requirements, including general industry standards, process safety standards and control of occupational exposure to regulated substances, could subject us to significant fines or cause us to spend significant amounts on compliance, which could have a material adverse effect on our results of operations, financial condition and the cash flows of the business.
Compliance with and changes in tax laws could adversely affect our performance.
We are subject to extensive tax liabilities, including federal, state and transactional taxes such as excise, sales/use, payroll, franchise, withholding and ad valorem taxes. New tax laws and regulations and changes in existing tax laws and regulations are continuously being enacted or proposed that could result in increased expenditures for tax liabilities in the future. Certain of these liabilities are subject to periodic audits by the respective taxing authority, which could increase our tax liabilities. Subsequent changes to our tax liabilities as a result of these audits may also subject us to interest and penalties.
Our insurance policies may be inadequate or expensive.
Our insurance coverage does not cover all potential losses, costs or liabilities. We could suffer losses for uninsurable or uninsured risks or in amounts in excess of our existing insurance coverage. Our ability to obtain and maintain adequate insurance may be affected by conditions in the insurance market over which we have no control. In addition, if we experience insurable events, our annual premiums could increase further or insurance may not be available at all or if it is available, on restrictive coverage items. The occurrence of an event that is not fully covered by insurance or the loss of insurance coverage could have a material adverse effect on our business, financial condition, and results of operations.
Our level of indebtedness may increase and reduce our financial flexibility.
In the future, we may incur significant indebtedness in order to make future acquisitions or to develop our properties. Our level of indebtedness could affect our operations in several ways, including the following:
| Ÿ | a significant portion of our cash flows could be used to service our indebtedness; |
| Ÿ | a high level of debt would increase our vulnerability to general adverse economic and industry conditions; |
| Ÿ | the covenants contained in the agreements governing our outstanding indebtedness will limit our ability to borrow additional funds, dispose of assets, pay dividends and make certain investments; |
27
Table of Contents
Index to Financial Statements
| Ÿ | a high level of debt may place us at a competitive disadvantage compared to our competitors that are less leveraged and therefore, may be able to take advantage of opportunities that our indebtedness would prevent us from pursuing; |
| Ÿ | our debt covenants may also affect our flexibility in planning for, and reacting to, changes in the economy and in our industry; |
| Ÿ | a high level of debt may make it more likely that a reduction in our borrowing base following a periodic redetermination could require us to repay a portion of our then-outstanding bank borrowings; and |
| Ÿ | a high level of debt may impair our ability to obtain additional financing in the future for working capital, capital expenditures, acquisitions, general corporate or other purposes. |
A high level of indebtedness increases the risk that we may default on our debt obligations. Our ability to meet our debt obligations and to reduce our level of indebtedness depends on our future performance. General economic conditions and financial, business and other factors affect our operations and our future performance. Many of these factors are beyond our control. We may not be able to generate sufficient cash flows to pay the interest on our debt, and future working capital, borrowings or equity financing may not be available to pay or refinance such debt. Factors that will affect our ability to raise cash through an offering of our capital stock or a refinancing of our debt include financial market conditions, the value of our assets and our performance at the time we need capital.
In addition, our bank borrowing base is subject to periodic redeterminations. We could be forced to repay a portion of our bank borrowings due to redeterminations of our borrowing base. If we are forced to do so, we may not have sufficient funds to make such repayments. If we do not have sufficient funds and are otherwise unable to negotiate renewals of our borrowings or arrange new financing, we may have to sell significant assets. Any such sale could have a material adverse effect on our business and financial results.
Increased costs of capital could adversely affect our business.
Our business and operating results can be harmed by factors such as the availability, terms and cost of capital, increases in interest rates or a reduction in credit rating. Changes in any one or more of these factors could cause our cost of doing business to increase, limit our access to capital, limit our ability to pursue acquisition opportunities, reduce our cash flows and place us at a competitive disadvantage. Recent and continuing disruptions and volatility in the global financial markets may lead to an increase in interest rates or a contraction in credit availability impacting our ability to finance our operations. We require continued access to capital. A significant reduction in the availability of credit could materially and adversely affect our ability to achieve our planned growth and operating results.
Our revolving credit facility contains certain covenants that may inhibit our ability to make certain investments, incur certain additional indebtedness and engage in certain other transactions, which could adversely affect our ability to meet our future goals.
Our revolving credit facility includes certain covenants that, among other things, restrict us or our subsidiaries from:
| Ÿ | making certain loans and investments; |
| Ÿ | incurring certain additional indebtedness or prepaying certain debt; |
| Ÿ | granting liens, other than liens created pursuant to the revolving credit facility and certain permitted liens; |
28
Table of Contents
Index to Financial Statements
| Ÿ | entering into certain mergers, consolidations and sales of all or a substantial part of our business or properties; |
| Ÿ | disposing of certain assets (other than production sold in the ordinary course of business); |
| Ÿ | declaring dividends; |
| Ÿ | deviating from certain financial ratios, such as leverage ratios; and |
| Ÿ | modifying certain material agreements and organizational documents relating to, or changing the business we conduct. |
In addition, we are further subject to limitations on our ability to engage in actions other than those of a holding company.
All of these restrictive covenants may limit our ability to expand or pursue our business strategies. Our ability to comply with these and other provisions of our revolving credit facility may be impacted by changes in economic or business conditions, results of operations or events beyond our control. The breach of any of these covenants could result in a default under our revolving credit facility, in which case, depending on the actions taken by the lenders thereunder or their successors or assignees, such lenders could elect to declare all amounts borrowed under our revolving credit facility, together with accrued interest, to be due and payable. If we were unable to repay such borrowings or interest, our lenders could proceed against their collateral. If any such indebtedness under our revolving credit facility were to be accelerated, our assets may not be sufficient to repay in full such indebtedness.
Risks Primarily Related to Our Refining Business
The price volatility of crude oil, other feedstocks, refined products and fuel and utility services may have a material adverse effect on our earnings, profitability, cash flows and liquidity.
Our refining and retail earnings, profitability, cash flows and liquidity from operations depend primarily on the margin above operating expenses (including the cost of refinery feedstocks, such as crude oil and natural gas liquids that are processed and blended into refined products) at which we are able to sell refined products. Refining is primarily a margin-based business and, to increase profitability, it is important to maximize the yields of high value finished products while minimizing the costs of feedstock and operating expenses. When the margin between refined product prices and crude oil and other feedstock costs contracts, our earnings, profitability and cash flows are negatively affected. Refining margins historically have been volatile, and are likely to continue to be volatile, as a result of a variety of factors, including fluctuations in the prices of crude oil, other feedstocks, refined products and fuel and utility services. For example, from January 2005 to December 2011, the price for NYMEX WTI crude oil fluctuated between $33.87 and $145.29 per barrel, while the price for U.S. Gulf Coast conventional gasoline fluctuated between $ 33.52 per barrel and $204.67 per barrel. While an increase or decrease in the price of crude oil may result in a similar increase or decrease in prices for refined products, there may be a time lag in the realization of the similar increase or decrease in prices for refined products. The effect of changes in crude oil prices on our refining margins therefore depends in part on how quickly and how fully refined product prices adjust to reflect these changes.
In addition, the nature of our business requires us to maintain substantial refined product inventories. Because refined products are commodities, we have no control over the changing market value of these inventories. Our refined product inventory is valued at the lower of cost or market value under the last-in, first-out (“LIFO”), inventory valuation methodology. If the market value of our refined product inventory were to decline to an amount less than our LIFO cost, we would record a write-down of inventory and a non-cash charge to cost of sales.
29
Table of Contents
Index to Financial Statements
Prices of crude oil, other feedstocks and refined products depend on numerous factors beyond our control, including the supply of and demand for crude oil, other feedstocks, gasoline, diesel, asphalt and other refined products. Such supply and demand are affected by, among other things:
| Ÿ | changes in global and local economic conditions; |
| Ÿ | domestic and foreign demand for fuel products, especially in the United States, China and India; |
| Ÿ | worldwide political conditions, particularly in significant oil producing regions such as the Middle East, West Africa and Latin America; |
| Ÿ | the level of foreign and domestic production of crude oil and refined products and the volume of crude oil, feedstock and refined products imported into the United States; |
| Ÿ | availability of and access to transportation infrastructure; |
| Ÿ | utilization rates of United States refineries; |
| Ÿ | the ability of the members of the Organization of Petroleum Exporting Countries (“OPEC”) to affect oil prices and maintain production controls; |
| Ÿ | development and marketing of alternative and competing fuels; |
| Ÿ | commodities speculation; |
| Ÿ | natural disasters (such as hurricanes and tornadoes), accidents, interruptions in transportation, inclement weather or other events that can cause unscheduled shutdowns or otherwise adversely affect our refineries; |
| Ÿ | federal and state government regulations and taxes; and |
| Ÿ | local factors, including market conditions, weather conditions and the level of operations of other refineries and pipelines in our markets. |
Our direct operating expense structure also impacts our profitability. Our major direct operating expenses include employee and contract labor, maintenance and energy costs. Our predominant variable direct operating cost is energy, which is comprised primarily of fuel and other utility services. The volatility in costs of fuel, principally natural gas, and other utility services, principally electricity, used by our refinery and other operations affect our operating costs. Fuel and utility prices have been, and will continue to be, affected by factors outside our control, such as supply and demand for fuel and utility services in both local and regional markets. Natural gas prices have historically been volatile and, typically, electricity prices fluctuate with natural gas prices. Future increases in fuel and utility prices may have a negative effect on our earnings, profitability and cash flows. Fuel and other utility services costs constituted approximately 13.1% and 13.7% of our total direct operating expenses included in cost of revenues for the nine months ended September 30, 2011 and the year ended December 31, 2010, respectively.
Volatility in refined product prices also affects our borrowing base under our revolving credit facility. A decline in prices of our refined products reduces the value of our refined product inventory collateral, which, in turn, may reduce the amount available for us to borrow under our revolving credit facility.
Our profitability is affected by crude oil differentials, which may fluctuate substantially.
Our profitability is affected by crude oil differentials, which may fluctuate substantially. Refined product prices have been more correlated to Brent prices since 2010 than to NYMEX WTI, the traditional U.S. crude oil benchmark, as the discount to which a barrel of NYMEX WTI traded relative to
30
Table of Contents
Index to Financial Statements
a barrel of Brent widened. The widening differential in the spring and summer of 2011 between Brent and NYMEX WTI may be attributed to several factors, including geopolitical events in the Middle East, the suspension of crude oil exports from Libya and limited pipeline and other infrastructure to transport crude oil from Cushing, Oklahoma, where NYMEX WTI is settled, to alternative markets. Between December 1, 2010 and September 30, 2011, the discount at which a barrel of NYMEX WTI traded relative to a barrel of Brent increased from $2.12 to $23.56. The widening of this price differential benefited refineries, such as ours, that are capable of sourcing and utilizing crude oil that is priced more in line with NYMEX WTI. These refineries not only realized relatively lower feedstock costs but also were able to sell refined products at prices that had been pushed upward by higher Brent prices. Conversely, the recent narrowing of the discount to which NYMEX WTI trades relative to Brent (to $8.79 as of December 31, 2011) has adversely affected the prices at which we sell our refined products relative to our cost of crude oil, and therefore has caused a reduction in our refining margins relative to the margins we experienced in the second and third quarter of 2011. Further narrowing of the differential may have a material adverse effect on our business and results of operation.
The dangers inherent in our operations could cause disruptions and could expose us to potentially significant losses, costs or liabilities and reduce our liquidity. We are particularly vulnerable to disruptions in our operations because all of our refining operations are conducted at a single facility.
Our operations are subject to significant hazards and risks inherent in refining operations and in transporting and storing crude oil, intermediate products and refined products. These hazards and risks include, but are not limited to, natural disasters, fires, explosions, pipeline ruptures and spills, third party interference and mechanical failure of equipment at our facilities, any of which could result in production and distribution difficulties and disruptions, pollution (such as oil spills, etc.), personal injury or wrongful death claims and other damage to our properties and the property of others. For example, in December 2007, a fuel oil tank roof caught on fire at our refinery when an operator was attempting to thaw a level gauge. The tank’s roof was destroyed and the operator was fatally injured during the fire.
There is also risk of mechanical failure and equipment shutdowns both in the normal course of operations and following unforeseen events. In such situations, undamaged refinery processing units may be dependent on, or interact with, damaged process units and, accordingly, are also subject to being shut down.
Because all of our refining operations are conducted at a single refinery, any of such events at our refinery could significantly disrupt our production and distribution of refined products, including the supply of our refined products to our convenience stores, which receive substantially all of their supply of gasoline and diesel from the refinery. Any disruption in our ability to supply our convenience stores would increase the cost of purchasing refined products for our retail business. Any sustained disruption would have a material adverse effect on our business, financial condition, results of operations and cash flows.
We are subject to interruptions of supply and distribution as a result of our reliance on pipelines for transportation of crude oil, blendstocks and refined products.
Our refinery receives most of its crude oil and delivers a portion of its refined products through pipelines. The Minnesota Pipeline system is our primary supply route for crude oil and has supplied substantially all of the crude oil used at our refinery. We also distribute a portion of our transportation fuels through pipelines owned and operated by Magellan Pipeline Company, L.P. (“Magellan”), including the Aranco Pipeline, which Magellan leases from us. We could experience an interruption of supply or delivery, or an increased cost of receiving crude oil and delivering refined products to market, if the ability of these pipelines to transport crude oil, blendstocks or refined products is disrupted
31
Table of Contents
Index to Financial Statements
because of accidents, weather interruptions, governmental regulation, terrorism, other third party action or any of the types of events described in the preceding risk factor. For example, there was a leak in 2006 prior to the completion of the expansion of the Minnesota Pipeline and the refinery was temporarily shut off from any receipts from the Minnesota Pipeline other than crude oil that was already in the tanks at Cottage Grove, Minnesota. At that time, the only alternative to receive crude oil was the Wood River Pipeline, a pipeline extending from Wood River, Illinois to a connection with the Minnesota Pipeline near Pine Bend, Minnesota, which had limited capacity to meet the refinery’s needs. While the refinery can receive crude oil deliveries from the Wood River Pipeline if the Minnesota Pipeline system experiences another disruption, this would result in an increase in the cost of crude oil and therefore lower refining margins.
In addition, due to the common carrier regulatory obligation applicable to interstate oil pipelines, capacity must be prorated among shippers in an equitable manner in accordance with the tariff then in effect in the event there are nominations in excess of capacity. Therefore, nominations by new shippers or increased nominations by existing shippers may reduce the capacity available to us. Any prolonged interruption in the operation or curtailment of available capacity of the pipelines that we rely upon for transportation of crude oil and refined products could have a material adverse effect on our business, financial condition, results of operations and cash flows.
We must make substantial capital expenditures on our operating facilities to maintain their reliability and efficiency. If we are unable to complete capital projects at their expected costs and/or in a timely manner, or if the market conditions assumed in our project economics deteriorate, our financial condition, results of operations or cash flows could be materially and adversely affected.
Delays or cost increases related to the engineering, procurement and construction of new facilities (or improvements and repairs to our existing facilities and equipment) could have a material adverse effect on our business, financial condition or results of operations. Such delays or cost increases may arise as a result of unpredictable factors in the marketplace, many of which are beyond our control, including:
| Ÿ | denial or delay in issuing regulatory approvals and/or permits; |
| Ÿ | unplanned increases in the cost of construction materials or labor; |
| Ÿ | disruptions in transportation of modular components and/or construction materials; |
| Ÿ | severe adverse weather conditions, natural disasters or other events (such as equipment malfunctions, explosions, fires or spills) affecting our facilities, or those of our vendors and suppliers; |
| Ÿ | shortages of sufficiently skilled labor, or labor disagreements resulting in unplanned work stoppages; |
| Ÿ | market-related increases in a project’s debt or equity financing costs; and/or |
| Ÿ | nonperformance or force majeure by, or disputes with, our vendors, suppliers, contractors or sub-contractors. |
Our refinery consists of many processing units, a number of which have been in operation for many years. Equipment, even if properly maintained, may require significant capital expenditures and expenses to keep it operating at optimum efficiency. For example, as part of installing safety instrumentation systems throughout the refinery to improve operational and safety performance, approximately $17.5 million was spent from 2006 through September 2011, and we have budgeted for additional related expenditures through 2013 to complete the instrumentation project. One or more of the units may require unscheduled downtime for unanticipated maintenance or repairs that may be
32
Table of Contents
Index to Financial Statements
more frequent than our scheduled turnarounds for such units. Scheduled and unscheduled maintenance could reduce our revenues during the period of time that the units are not operating.
Any one or more of these occurrences could have a significant impact on our business. If we were unable to make up the delays or to recover the related costs, or if market conditions change, it could materially and adversely affect our financial position, results of operations or cash flows.
A portion of our workforce is unionized, and we may face labor disruptions that would interfere with our operations.
Approximately 170 of our employees associated with the operations of our refining business are covered by a collective bargaining agreement that expires in December 2013. In addition, 20 of our employees associated with the operations of our retail business are covered by a collective bargaining agreement that expires in August 2012. We may not be able to renegotiate our collective bargaining agreements on satisfactory terms or at all when such agreements expire. A failure to do so may increase our costs associated with our workforce. Other employees of ours who are not presently represented by a union may become so represented in the future as well. In 2006, the unionized refinery employees conducted a strike when Marathon sought to revise certain working terms and conditions. Another work stoppage resulting from, among other things, a dispute over a term or condition of a collective bargaining agreement that covers employees who work at our refinery or in our retail business, could cause disruptions in our business and negatively impact our profitability.
Product liability claims and litigation could adversely affect our business and results of operations.
Product liability is a significant commercial risk. Substantial damage awards have been made in certain jurisdictions against manufacturers and resellers based upon claims for injuries caused by the use of or exposure to various products. Failure of our products to meet required specifications could result in product liability claims from our shippers and customers arising from contaminated or off-specification commingled pipelines and storage tanks and/or defective quality fuels. There can be no assurance that product liability claims against us would not have a material adverse effect on our business or results of operations.
Laws and regulations restricting emissions of greenhouse gases could force us to incur increased capital and operating costs and could have a material adverse effect on our results of operations and financial condition.
In December 2009, the U.S. Environmental Protection Agency (“EPA”) determined that emissions of carbon dioxide, methane and other “greenhouse gases” (“GHGs”) endanger public health and the environment because emissions of such gases are, according to the EPA, contributing to warming of the earth’s atmosphere and other climatic changes. Based on these findings, the EPA has begun adopting and implementing regulations to restrict emissions of GHGs under existing provisions of the federal Clean Air Act (“CAA”). The EPA recently adopted two sets of rules regulating GHG emissions under the CAA, one of which requires a reduction in emissions of GHGs from motor vehicles and the other of which regulates emissions of GHGs from certain large stationary sources, both of which were effective January 2, 2011. The EPA’s rules relating to emissions of GHGs from large stationary sources of emissions are currently subject to a number of legal challenges, but the federal courts have thus far declined to issue any injunctions to prevent the EPA from implementing or requiring state environmental agencies to implement the rules. The EPA has also adopted rules requiring the reporting of GHG emissions from specified large GHG emission sources in the United States, including petroleum refineries, on an annual basis, beginning in 2011 for emissions occurring after January 1, 2010.
33
Table of Contents
Index to Financial Statements
In addition, the U.S. Congress has from time to time considered adopting legislation to reduce emissions of GHGs, and almost one-half of the states have already taken legal measures to reduce emissions of GHGs primarily through the planned development of GHG emission inventories and/or regional GHG cap and trade programs. These cap and trade programs generally work by requiring major sources of emissions, such as electric power plants, or major producers of fuels, such as refineries and gas processing plants, to acquire and on an annual basis surrender emission allowances. The number of allowances available for purchase is reduced over time in an effort to achieve the overall GHG emission reduction goal. Minnesota is a participant in the Midwest Regional GHG Reduction Accord, a non-binding resolution that could lead to the creation of a regional GHG cap-and-trade program if the Minnesota legislature and the legislatures of other participating states enact implementing legislation.
The adoption of legislation or regulatory programs to reduce emissions of GHGs could require us to incur increased operating costs, such as costs to purchase and operate emissions control systems, to acquire emissions allowances or comply with new regulatory or reporting requirements. Any such legislation or regulatory programs could also increase the cost of consuming, and thereby reduce demand for, the refined products that we produce. Consequently, legislation and regulatory programs to reduce emissions of GHGs could have an adverse effect on our business, financial condition and results of operations.
In addition, some scientists have concluded that increasing concentrations of GHGs in the Earth’s atmosphere may produce climate changes that have significant physical effects, such as increased frequency and severity of storms, droughts, floods and other climatic events. If any such events were to occur, they could have an adverse effect on our business, financial condition and results of operations.
Renewable fuels mandates may reduce demand for the petroleum fuels we produce, which could have a material adverse effect on our results of operation and financial condition.
Pursuant to the Energy Policy Act of 2005 and the Energy Independence and Security Act of 2007, the EPA has issued Renewable Fuels Standards (“RFS”) implementing mandates to blend renewable fuels into the petroleum fuels produced and sold in the United States. Under RFS, the volume of renewable fuels that obligated refineries like us must blend into their finished petroleum fuels increases annually over time until 2022. We currently purchase renewable identification number credits (“RINS”) for some fuel categories on the open market, as well as waiver credits for cellulosic biofuels from the EPA, in order to comply with the RFS. In the future, we may be required to purchase additional RINS on the open market and waiver credits from the EPA to comply with the RFS. We cannot currently predict the future prices of RINS or waiver credits, but the costs to obtain the necessary number of RINS and waiver credits could be material. Additionally, Minnesota law currently requires that all diesel sold in the state for use in internal combustion engines must contain at least 5% biodiesel. Under this statute, if certain preconditions are met, the minimum biodiesel content in diesel sold in the state will increase to 10% beginning on May 1, 2012, and to 20% beginning on May 1, 2015. Minnesota law also currently requires, with limited exceptions, that all gasoline sold or offered for sale in the state must contain the maximum amount of ethanol allowed under federal law for use in all gasoline-powered motor vehicles. On October 13, 2010, the EPA raised the maximum amount of ethanol allowed under federal law from 10% to 15% for cars and light trucks manufactured since 2007, and on January 21, 2011, EPA extended the maximum allowable ethanol content of 15% to apply to cars and light trucks manufactured since 2001. The maximum amount allowed under federal law currently remains at 10% ethanol for all other vehicles. Existing laws and regulations could change, and the minimum volumes of renewable fuels that must be blended with refined petroleum fuels may increase. Because we do not produce renewable fuels, increasing the volume of renewable fuels that must be blended into our products displaces an increasing volume of our refinery’s product pool, potentially resulting in lower earnings and profitability.
34
Table of Contents
Index to Financial Statements
Our pipeline interests are subject to federal and/or state rate regulation, which could reduce our profitability.
Our transportation activities are subject to regulation by multiple governmental agencies, and compliance with such regulation increases our cost of doing business and affects our profitability. Additional proposals and proceedings that affect the oil industry are regularly considered by Congress, the states, the Federal Energy Regulatory Commission (“FERC”) and the courts. We cannot predict when or whether any such proposals may become effective or what impact such proposals may have. Projected expenditures related to the Minnesota Pipeline reflect the recurring costs resulting from compliance with these regulations, and these costs may increase due to future acquisitions, changes in regulation, changes in use, ongoing expenditures to maintain reliability and efficiency or discovery of existing but unknown compliance issues. In addition, if the current lease with Magellan of the Aranco Pipeline were terminated and we were to operate the Aranco Pipeline or, if the Cottage Grove pipelines were required to comply with these regulations, we would incur similar costs.
The Minnesota Pipeline is a common carrier pipeline providing interstate transportation service, which is subject to regulation by FERC under the Interstate Commerce Act (“ICA”). The ICA requires that tariff rates for interstate petroleum pipelines transportation service be just and reasonable and that the rates and terms of service of such pipelines not be unduly discriminatory or unduly preferential. The tariff rates are generally set by the board of managers of the Minnesota Pipe Line Company, which we do not control. Because we currently do not operate the Minnesota Pipeline or control the board of managers of the Minnesota Pipe Line Company, we do not control how the Minnesota Pipeline’s tariff is applied, including the tariff provisions governing the allocation of capacity, or control of decision-making with respect to tariff changes for the pipeline.
FERC can investigate the pipeline’s rates and certain terms of service on its own initiative. In addition, shippers may file with FERC protests against new tariff rates and/or terms and conditions of service or complaints against existing tariff rates and/or terms and conditions of services. Under certain circumstances, FERC could limit the Minnesota Pipe Line Company’s ability to set rates based on its costs, or could order the Minnesota Pipe Line Company to reduce its rates and could require the payment of reparations to complaining shippers for up to two years prior to the complaint or refunds to all shippers in the context of a protest proceeding. If it found the Minnesota Pipeline’s rates or terms of service to be contrary to statutory requirements, FERC could impose conditions it considers appropriate and/or impose penalties. Further, FERC could declare pipeline-related facilities to be common carrier facilities and require that common carrier access be provided or otherwise alter the terms of service and/or rates of such facilities, to the extent applicable. Rate regulation or a successful challenge to the rates the Minnesota Pipeline charges could adversely affect its financial position, cash flows, or results of operations and, thus, our financial position, cash flows or results of operations. Conversely, reduced rates on the Minnesota Pipeline would reduce the rates for transportation of crude oil into our refinery.
FERC currently allows petroleum pipelines to change their rates within prescribed ceiling levels that are tied to an inflation index. The Minnesota Pipeline currently bases its rates on the indexing methodology. If the Minnesota Pipeline were to attempt to increase rates beyond the maximum allowed by the indexing methodology, it would be required to file a cost-of-service justification, obtain approval from an unaffiliated party that intends to ship on the pipeline (with respect to initial rates for any new service), obtain approval from all current shippers (i.e., settlement), or obtain prior approval to file market-based rates. FERC’s indexing methodology is subject to review every five years. In an order issued in December 2010, FERC announced that, effective July 1, 2011, the index would equal the change in the producer price index for finished goods plus 2.65 percent (previously, the index was equal to the change in the producer price index for finished goods plus 1.3 percent). This index is to be in effect through July 2016. If the changes in the index are not large enough to fully reflect actual increases to our costs, our financial condition could be adversely affected. If the index results in a rate
35
Table of Contents
Index to Financial Statements
increase that is substantially in excess of the pipeline’s actual cost increases, or it results in a rate decrease that is substantially less than the pipeline’s actual cost decrease, the rates may be protested, and, if successful, result in the lowering of the pipeline’s rates. FERC’s rate-making methodologies may limit the pipeline’s ability to set rates based on our true costs and may delay or limit the use of rates that reflect increased costs of providing transportation service.
If we were to operate the Aranco Pipeline to provide transportation of crude oil or petroleum products in interstate commerce, we would expect to also be regulated by FERC as an interstate oil pipeline and the Aranco Pipeline would be subject to the same regulatory risks discussed above.
Terrorist attacks and other acts of violence or war may affect the market for our common stock, the industry in which we conduct our operations and our profitability.
Terrorist attacks may harm our business results of operations. We cannot provide assurance that there will not be further terrorist attacks against the U.S. or U.S. businesses. Such attacks or armed conflicts may directly impact our refinery, properties or the securities markets in general. More generally, any of these events could cause consumer confidence and spending to decrease or result in increased volatility in the U.S. and worldwide financial markets and economy. Adverse economic conditions could harm the demand for our products or the securities markets in general, which could harm our operating results and revenues.
While we have insurance that provides some coverage against terrorist attacks, such insurance has become increasingly expensive and difficult to obtain. As a result, insurance providers may not continue to offer this coverage to us on terms that we consider affordable, or at all.
Some of our operations are conducted with partners, which may decrease our ability to manage risks associated with those operations.
We sometimes enter into arrangements to conduct certain business operations, such as pipeline transportation, with partners in order to share risks associated with those operations. However, these arrangements may also decrease our ability to manage risks and costs associated with those operations, particularly where we are not the operator. We could have limited influence over and control of the behaviors and performance of these operations. This could affect our operational performance, financial position and reputation.
We own 17% of the outstanding common interests of the Minnesota Pipe Line Company and 17% of the outstanding preferred shares of MPL Investments, Inc. which owns 100% of the preferred units of the Minnesota Pipe Line Company. The Minnesota Pipe Line Company owns the Minnesota Pipeline, a crude oil pipeline system in Minnesota that transports crude oil to the Twin Cities area and which consistently supplies most of our crude oil input. The remaining interests in the Minnesota Pipe Line Company are held by a subsidiary of Koch Industries, Inc., which operates the system and is an affiliate of the only other refinery owner in Minnesota, with a 74.16% interest, and TROF Inc. with an 8.84% interest. For more information about the economic effect of our investments in the Minnesota Pipe Line Company and MPL Investments, see “Management’s Discussion and Analysis of Financial Condition and Results of Operations—Critical Accounting Policies and Estimates” and “—Results of Operations.” Because of our limited investment in the Minnesota Pipe Line Company and MPL Investments, we do not have significant influence over or control of the performance of the Minnesota Pipe Line Company’s operations or the impact it could have on our operational performance, financial position and reputation.
36
Table of Contents
Index to Financial Statements
If we are required to obtain our crude oil supply without the benefit of the crude oil supply and logistics agreement with JPM CCC or similar agreement, our exposure to the risks associated with volatile crude oil prices may increase.
Our supply and logistics agreement with JPM CCC allows us to price all crude oil processed at the refinery one day after it is received at the plant. This arrangement minimizes the amount of in-transit inventory and reduces our exposure to fluctuations in crude oil prices. In excess of 90% of the crude oil delivered at the refinery is handled through our agreement with JPM CCC independent of whether crude oil is sourced from our suppliers or from JPM CCC directly. If we were required to obtain our crude oil supply without the benefit of the crude oil supply and logistics agreement or similar agreement, our exposure to crude oil pricing risks may increase as the number of days between when we pay for the crude oil and when the crude oil is delivered to us increases. Such increased exposure could negatively impact our liquidity position due to our increased working capital needs as a result of the increase in the value of crude oil inventory we would have to carry on our balance sheet.
Our suppliers source a substantial amount of our crude oil from the Bakken Shale of North Dakota and may experience interruptions of supply from that region.
Our suppliers source a substantial amount of our crude oil from the Bakken Shale of North Dakota. As a result, we may be disproportionately exposed to the impact of delays or interruptions of supply from that region caused by transportation capacity constraints, curtailment of production, unavailability of equipment, facilities, personnel or services, significant governmental regulation, natural disasters, adverse weather conditions, plant closures for scheduled maintenance or interruption of transportation of oil or natural gas produced from the wells in that area.
Our commodity derivative contracts may limit our potential gains, exacerbate potential losses and involve other risks.
We enter into commodity derivatives contracts to hedge our crack spread risk with respect to a portion of our expected gasoline and diesel production. We enter into these hedging arrangements with the intent to secure a minimum fixed cash flow stream on the volume of products hedged during the hedge term and to protect against volatility in commodity prices. However, our hedging arrangements may fail to fully achieve these objectives for a variety of reasons, including our failure to have adequate hedging contracts, if any, in effect at any particular time and the failure of our hedging arrangements to produce the anticipated results. We may not be able to procure adequate hedging arrangements due to a variety of factors. Moreover, while intended to reduce the adverse effects of fluctuations in crude oil and refined product prices, such transactions may limit our ability to benefit from favorable changes in margins. In addition, our hedging activities may expose us to the risk of financial loss in certain circumstances, including instances in which:
| Ÿ | the volumes of our actual use of crude oil or production of the applicable refined products is less than the volumes subject to the hedging arrangement; |
| Ÿ | accidents, interruptions in feedstock transportation, inclement weather or other events cause unscheduled shutdowns or otherwise adversely affect our refinery, or those of our suppliers or customers; |
| Ÿ | the counterparties to our futures contracts fail to perform under the contracts; or |
| Ÿ | a sudden, unexpected event materially impacts the commodity or crack spread subject to the hedging arrangement. |
As a result, the effectiveness of our hedging strategy could have a material adverse impact on our financial results. See “Management’s Discussion and Analysis of Financial Condition and Results of Operations—Quantitative and Qualitative Disclosure About Market Risk.”
37
Table of Contents
Index to Financial Statements
In addition, these hedging activities involve basis risk. Basis risk in a hedging arrangement occurs when the price of the commodity we hedge is more or less variable than the index upon which the hedged commodity is based, thereby making the hedge less effective. For example, a NYMEX index used for hedging certain volumes of crude oil or refined products may have more or less variability than the cost or price for such crude oil or refined products. We do not expect to hedge the basis risk inherent in our derivatives contracts.
Our commodity derivative activities could result in period-to-period earnings volatility.
We do not apply hedge accounting to our commodity derivative contracts and, as a result, unrealized gains and losses are charged to our earnings based on the increase or decrease in the market value of the unsettled position. These gains and losses are reflected in our income statement in periods that differ from when the underlying hedged items (i.e., gross margins) are reflected in our income statement. Such derivative gains or losses in earnings may produce significant period-to-period earnings volatility that is not necessarily reflective of our underlying operational performance.
Derivatives regulation included in current financial reform legislation could impede our ability to manage business and financial risks by restricting our use of derivative instruments as hedges against fluctuating commodity prices.
The U.S. Congress adopted the Dodd-Frank Wall Street Reform and Consumer Protection Act in 2010. This comprehensive financial reform legislation establishes federal oversight and regulation of the over-the-counter derivatives market and entities, such as us, that participate in that market. The new legislation was signed into law by the President on July 21, 2010 and requires the Commodity Futures Trading Commission (“CFTC”) and the SEC to promulgate rules and regulations implementing the new legislation within 360 days from the date of enactment. In December 2011, the CFTC extended temporary exemptive relief from the deadline for certain regulations applicable to swaps until no later than July 16, 2012. The CFTC has proposed regulations to set position limits for certain futures and option contracts in the major energy markets and to establish minimum capital requirements, although it is not possible at this time to predict whether or when the CFTC will adopt those rules or include comparable provisions in its rulemaking under the Dodd-Frank Act. The Dodd-Frank Act may also require compliance with margin requirements and with certain clearing and trade-execution requirements in connection with certain derivative activities, although the application of those provisions is uncertain at this time. The legislation may also require the counterparties to our commodity derivative contracts to spinoff some of their derivatives activities to a separate entity, which may not be as creditworthy as the current counterparty, or cause the entity to comply with the capital requirements, which could result in increased costs to counterparties such as us.
The new legislation and any new regulations could significantly increase the cost of some commodity derivative contracts (including through requirements to post collateral, which could adversely affect our available liquidity), materially alter the terms of some commodity derivative contracts, reduce the availability of some derivatives to protect against risks we encounter, reduce our ability to monetize or restructure our existing commodity derivative contracts and potentially increase our exposure to less creditworthy counterparties. If we reduce our use of derivatives as a result of the new legislation and regulations, our results of operations may become more volatile and our cash flows may be less predictable, which could adversely affect our ability to plan for and fund capital expenditures. Increased volatility may make us less attractive to certain types of investors. Finally, the Dodd-Frank Act was intended, in part, to reduce the volatility of oil and natural gas prices, which some legislators attributed to speculative trading in derivatives and commodity instruments related to oil and natural gas. If the new legislation and regulations result in lower commodity prices, our revenues could be adversely affected. Any of these consequences could adversely affect our business, financial condition and results of operations.
38
Table of Contents
Index to Financial Statements
Risks Primarily Related to Our Retail Business
Our retail business depends on one principal supplier for a substantial portion of its merchandise inventory. A change of merchandise suppliers, a disruption in merchandise supply, a significant change in our relationship with our principal merchandise supplier or material changes in the payment terms or availability of trade credit provided by our merchandise suppliers could have a material adverse effect on our retail business and results of operations or liquidity.
Eby-Brown Company (“Eby-Brown”) is a wholesale grocer that has been the primary supplier of general merchandise, including most tobacco and grocery items, for all our retail stores since 1993. For each of the nine months ended September 30, 2011 and the year ended December 31, 2010, our retail business purchased approximately 80% of its convenience store inside merchandise requirements from Eby-Brown. Our retail business also purchases a variety of merchandise, including soda, beer, bread, dairy products, ice cream and snack foods, directly from a number of manufacturers and their wholesalers. A change of merchandise suppliers, a disruption in merchandise supply or a significant change in our relationship with Eby-Brown could have a material adverse effect on our retail business and results of operations. In addition, our retail business is impacted by the availability of trade credit to fund merchandise purchases. Any material changes in the payments terms, including payment discounts, or availability of trade credit provided by our merchandise suppliers could adversely affect our liquidity or results of operations.
If the locations of our current convenience stores become unattractive to customers and attractive alternative locations are not available for a reasonable price, then our ability to maintain and grow our retail business will be adversely affected.
We believe that the success of any retail store depends in substantial part on its location. There can be no assurance that the locations of our retail stores will continue to be attractive to customers as demographic patterns change. Neighborhood or economic conditions where retail stores are located could decline in the future, resulting in potentially reduced sales in these locations. If we cannot obtain desirable locations at reasonable prices, our ability to maintain and grow our retail business could be adversely affected, which could have an adverse effect on our business, financial condition or results of operations.
The growth of our retail business depends in part on our ability to open and profitably operate new convenience stores and to successfully integrate acquired sites and businesses in the future.
We may not be able to open new convenience stores and any new stores we open may be unprofitable. Additionally, acquiring sites and businesses in the future involves risks that could cause our actual growth or operating results to be lower than expected. If these events were to occur, each would have a material adverse impact on our financial results. There are several factors that could affect our ability to open and profitably operate new stores or to successfully integrate acquired sites and businesses. These factors include:
| Ÿ | competition in targeted market areas; |
| Ÿ | difficulties during the acquisition process in discovering certain liabilities of the businesses that we acquire; |
| Ÿ | the inability to identify and acquire suitable sites or to negotiate acceptable leases for such sites; |
| Ÿ | difficulties associated with the growth of our financial controls, information systems, management resources and human resources needed to support our future growth; |
39
Table of Contents
Index to Financial Statements
| Ÿ | difficulties with hiring, training and retaining skilled personnel, including store managers; |
| Ÿ | difficulties in adapting distribution and other operational and management systems to an expanded network of stores; |
| Ÿ | the potential inability to obtain adequate financing to fund our expansion; |
| Ÿ | limitations on investments contained in our revolving credit facility and other debt instruments; |
| Ÿ | difficulties in obtaining governmental and other third-party consents, permits and licenses needed to operate additional stores; |
| Ÿ | difficulties in obtaining any cost savings and financial improvements anticipated from future acquired stores or their integration; and |
| Ÿ | challenges associated with the consummation and integration of any future acquisition. |
Our retail store franchisees are independent business operators that could take actions that harm our brand, reputation or goodwill, which could adversely affect our business, results of operations, financial condition or cash flows.
Our retail store franchisees are independent business operators, not employees, and, as such, we cannot control their operations. These franchisees could hire and fail to train unqualified sales associates and other employees, or operate the franchised retail stores in a manner inconsistent with our operating standards. If our retail store franchisees provide diminished quality of service to customers, or if they engage or are accused of engaging in unlawful or tortious acts, such as sexual harassment or discriminatory practices in violation of applicable laws, then our brand, reputation or goodwill could be harmed, which could have an adverse effect on our business, results of operations, financial condition or cash flows.
Additionally, as independent business operators, our retail store franchisees could occasionally disagree with us or with our strategies regarding our retail business or with our interpretation of the rights and obligations set forth under our retail franchise agreement. This could lead to disputes with our retail store franchisees, which we expect to occur from time to time in the future as we continue to offer and sell retail store franchises. To the extent we have such disputes, the attention of our management and our retail store franchisees could be diverted, which could have an adverse effect on our business, results of operations, financial condition or cash flows.
Credit and debit card data loss, litigation and/or liability could significantly harm our reputation and adversely impact our business.
In connection with credit and debit card sales at our retail stores, we transmit confidential credit and debit card information securely over public networks. Third parties may have the technology or know-how to breach the security of this customer information, and our security measures may not effectively prohibit others from obtaining improper access to this information. If a person is able to circumvent our security measures, he or she could destroy or steal valuable information or disrupt our operations. Any security breach could expose us to risks of data loss, litigation and liability and could seriously disrupt our operations and any resulting negative publicity could significantly harm our reputation.
Our failure or inability to enforce our current and future trademarks and trade names could adversely affect our efforts to establish brand equity and expand our retail franchising business.
Our ability to successfully expand our retail franchising business will depend on our ability to establish brand equity through the use of our current and future trademarks, service marks, trade dress
40
Table of Contents
Index to Financial Statements
and other proprietary intellectual property, including our name and logos. Some or all of these intellectual property rights may not be enforceable, even if registered, against any prior users of similar intellectual property or our competitors who seek to use similar intellectual property in areas where we operate or intend to conduct operations. If we fail to enforce any of our intellectual property rights, then we may be unable to capitalize on our efforts to establish brand equity.
We could encounter claims from prior users of similar intellectual property in areas where we operate or intend to conduct operations, which could result in additional expenditures and divert our management’s time and attention from our operations. Conversely, competing businesses, including any of our former retail store franchisees, could infringe on our intellectual property, which would necessarily require us to defend our intellectual property possibly at a significant cost to us.
Our retail business is vulnerable to changes in consumer preferences, economic conditions and other trends and factors that could harm our business, results of operations, financial condition or cash flows.
Our retail business is affected by consumer preferences, national, regional and local economic conditions, demographic trends and consumer confidence in the economy. Factors such as traffic patterns, weather conditions, local demographics and the number and locations of competing retail service stations and convenience stores also affect the performance of our retail stores. In addition, we cannot ensure that our retail customers will continue to frequent our retail stores or that we will be able to find new retail store franchisees or encourage our existing retail store franchisees to grow their franchised business or renew their franchise rights. Adverse changes in any of these trends or factors could reduce our retail customer traffic or sales, or impose limits on our pricing, which could adversely affect our business, results of operations, financial condition or cash flows.
We face the risk of litigation in connection with our retail operations.
We are from time to time the subject of complaints or litigation from our consumers alleging illness, injury or other health or operational concerns. Adverse publicity resulting from these allegations may materially adversely affect us and our brand, regardless of whether the allegations are valid or whether we are liable. In addition, employee claims against us based on, among other things, discrimination, harassment or wrongful termination, or labor code violations may divert financial and management resources that would otherwise be used to benefit our future performance. There is also a risk of litigation from our franchisees. We have been subject to a variety of these and other claims from time to time and a significant increase in the number of these claims or the number that are successful could materially adversely affect our business, prospects, financial condition, operating results or cash flows.
Failure of our retail business to comply with state and local laws regulating the sale of alcohol and tobacco products could result in the loss of necessary licenses and the imposition of fines and penalties on us, which could have a material adverse effect on our business, liquidity and results of operations.
State and local laws regulate the sale of alcohol and tobacco products. In certain areas where our stores are located, state or local laws limit the hours of operation for the sale of alcohol, or prohibit the sale of alcohol, and permit the sale of alcohol and tobacco products only to persons older than a certain age. State and local regulatory agencies have the authority to approve, revoke, suspend or deny applications for, and renewals of, permits and licenses relating to the sale of alcohol and tobacco products and to issue fines to stores for the improper sale of alcohol and tobacco products. Most jurisdictions, in their permit and license applications, require an applicant to disclose past denials, suspensions, or revocations of permits or licenses relating to the sale of alcohol and tobacco products
41
Table of Contents
Index to Financial Statements
in any jurisdiction. Thus, if we experience a denial, suspension, or revocation in one jurisdiction, then it could have an adverse affect on our ability to obtain permits and licenses relating to the sale of alcohol and tobacco products in other jurisdictions. In addition, the failure of our retail business to comply with state and local laws regulating the sale of alcohol and tobacco products could result in the loss of necessary licenses and the imposition of fines and penalties on us. Such a loss or imposition could have a material adverse effect on our business, liquidity and results of operations.
Risks Related to Our Organizational Structure
We are a holding company and our sole material asset after completion of this offering will be our equity interest in NTI LLC, and we are accordingly dependent upon distributions from NTI LLC to pay taxes, make payments under the Tax Receivable Agreement, and pay dividends.
We will be a holding company and will have no material assets other than our equity interest in NTI LLC. See “Organizational Structure.” We have no independent means of generating revenue. We intend to cause NTI LLC to make distributions to its unitholders, including us, in an amount sufficient to cover all applicable taxes at assumed tax rates, payments under the Tax Receivable Agreement we intend to enter into with certain of the Existing Owners and dividends, if any, declared by us, but are limited in our ability to cause NTI LLC and its subsidiaries to make these and other distributions to us due to the terms of their outstanding indebtedness. To the extent that we need funds and NTI LLC or its subsidiaries is restricted from making such distributions under applicable law or regulation or under the terms of their financing arrangements, or is otherwise unable to provide such funds, it could materially adversely affect our liquidity and financial condition.
ACON Refining and TPG Refining hold a majority of the combined voting power of our Class A and Class B common stock.
Immediately following this offering, ACON Refining and TPG Refining will hold approximately % of the combined voting power of our Class A and Class B common stock (or % if the underwriters exercise their option to purchase additional shares in full). Accordingly, ACON Refining and TPG Refining will have the ability to elect all of the members of our board of directors, and thereby to control our management and affairs. In addition, they will be able to determine the outcome of all matters requiring stockholder approval, including mergers and other material transactions, and will be able to cause or prevent a change in the composition of our board of directors or a change in control of our company that could deprive our stockholders of an opportunity to receive a premium for their Class A common stock as part of a sale of our company. So long as ACON Refining and TPG Refining continue to own a significant amount of the outstanding shares of our common stock, even if such amount is less than 50%, they will continue to be able to strongly influence all matters requiring stockholder approval, regardless of whether or not other stockholders believe that the transaction is in their own best interests.
Pursuant to a registration rights and shareholders’ agreement entered into by the Existing Owners and us, ACON Refining and TPG Refining, each has the right to participate in certain dispositions of our capital stock by the other party. ACON Refining and TPG Refining are also restricted for certain periods of time from transferring Class A and Class B common stock without the consent of the other party. Furthermore, each of ACON Refining and TPG Refining has the right to elect directors to our board of directors so long as it beneficially owns % or more of the outstanding common stock and one director so long as it owns % or more of the common stock. The agreement also provides that as long as we remain a “controlled company” under the rules of the NYSE, ACON Refining and TPG Refining will be entitled to designate up to two additional independent directors. See “Certain Relationships and Related Person Transactions—Registration Rights and Shareholders’ Agreement.” As our largest stockholders, ACON Refining and TPG Refining
42
Table of Contents
Index to Financial Statements
together are able to exercise significant control over all matters requiring stockholder approval, including the election of directors, amendment of our certificate of incorporation and approval of significant corporate transactions and have significant control over our management and policies. The interests of these stockholders may not be consistent with the interests of other stockholders. The existence of significant stockholders may also have the effect of deterring hostile takeovers, delaying or preventing changes in control or changes in management, or limiting the ability of our other stockholders to approve transactions that they may deem to be in the best interests of our company. In addition, our certificate of incorporation provides that the provisions of Section 203 of the Delaware General Corporation Law (“DGCL”), which relate to business combinations with interested stockholders, do not apply to us.
The Existing Owners, including ACON Refining, TPG Refining and certain members of our management, may have interests that conflict with holders of shares of our Class A common stock.
Immediately following this offering, the Existing Owners will own % of the NTI LLC Units. Because they hold a portion of their ownership interest in our business through NTI LLC, rather than through the public company, the Existing Owners may have conflicting interests with holders of shares of our Class A common stock. For example, the Existing Owners may have different tax positions from us which could influence their decisions regarding whether and when to cause us to dispose of assets, whether and when to cause us to incur new or refinance existing indebtedness, especially in light of the existence of the Tax Receivable Agreement that we intend to enter into in connection with this offering. In addition, the structuring of future transactions may take into consideration ACON Refining’s and TPG Refining’s tax or other considerations even where no similar benefit would accrue to us. See “Certain Relationships and Related Person Transactions—Tax Receivable Agreement.”
Furthermore, conflicts of interest could arise in the future between us, on the one hand, and ACON Refining and TPG Refining, including their portfolio companies, on the other hand, concerning among other things, potential competitive business activities or business opportunities. Each of ACON Refining’s and TPG Refining’s existing and future portfolio companies which they control may compete with us for investment or business opportunities. These conflicts of interest may not be resolved in our favor.
Because of our relationship with ACON Refining and TPG Refining, we have also renounced our interest in certain business opportunities. See “Risks Relating to the Offering and our Class A Common Stock—Our certificate of incorporation contains a provision renouncing our interest and expectancy in certain corporate opportunities, which could adversely affect our business or prospects.”
We will be required to pay the Existing Owners, including ACON Refining and TPG Refining, for certain tax benefits we may claim arising in connection with the Marathon Acquisition and this offering and related transactions, and the amounts we may pay could be significant.
We intend to enter into the Tax Receivable Agreement with the Existing Owners, including ACON Refining and TPG Refining. This agreement generally provides for the payment by us of 85% of the amount of cash savings, if any, in U.S. federal, state and local income tax or franchise tax that we actually realize (or are deemed to realize in certain circumstances) in periods after this offering as a result of (i) the increase in tax basis in NTI LLC’s assets that arose from the Marathon Acquisition, (ii) the basis increase resulting from the distribution of offering proceeds to the Existing Owners, (iii) the basis increases resulting from the exchanges of NTI LLC Units (along with the corresponding shares of our Class B common stock) for shares of our Class A common stock, (iv) additional deductions allocated to us pursuant to Section 704(c) of the Code, to reflect the difference between the fair market value and the adjusted tax basis of NTI LLC’s assets as of the date of this offering, (v) imputed interest
43
Table of Contents
Index to Financial Statements
deemed to be paid by us as a result of, and additional tax basis arising from, payments under the Tax Receivable Agreement, and (vi) any net operating losses available to us as a result of the Existing Owner Exchange. In addition, the Tax Receivable Agreement will provide for interest earned from the due date (without extensions) of the corresponding tax return to the date of payment specified by the Tax Receivable Agreement.
The payment obligations under the Tax Receivable Agreement are our obligations and are not obligations of NTI LLC. For purposes of the Tax Receivable Agreement, cash savings in tax generally are calculated by comparing our actual income tax liability to the amount we would have been required to pay had we not been able to utilize any of the tax benefits subject to the Tax Receivable Agreement. In order to calculate the amount we would have been required to pay, we will need to determine the tax basis in certain assets in effect prior to the Marathon Acquisition. This determination will be made in our sole judgment based on information received from Marathon in connection with the Marathon Acquisition and consistent with NTI LLC’s current tax reporting. This information will not be subject to verification by any third party, and there thus can be no assurance that the historic tax basis as determined by us will be accurate and that payments by us under the Tax Receivable Agreement will not exceed 85% of the cash savings that we actually realize. The term of the Tax Receivable Agreement will commence upon the completion of this offering and will continue until all such tax benefits have been utilized or expired, unless we exercise our right to terminate the Tax Receivable Agreement.
Estimating the amount of payments that may be made under the Tax Receivable Agreement is by its nature imprecise, insofar as the calculation of amounts payable depends on a variety of factors. The actual increase in tax basis, as well as the amount and timing of any payments under the Tax Receivable Agreement, will vary depending upon a number of factors, including the timing of exchanges, the price of shares of our Class A common stock at the time of the exchange, the extent to which such exchanges are taxable, the amount and timing of the taxable income we realize in the future and the tax rate then applicable, our use of loss carryovers and the portion of our payments under the Tax Receivable Agreement constituting imputed interest or depreciable or amortizable basis. We expect that the payments that we will be required to make under the Tax Receivable Agreement will be substantial. Assuming no material changes in the relevant tax law and that we earn sufficient taxable income to realize all tax benefits that are subject to the Tax Receivable Agreement, we expect that future payments under the Tax Receivable Agreement associated with (i) the existing tax basis in NTI LLC’s assets that arose from the Marathon Acquisition, (ii) the basis increase resulting from the distribution of offering proceeds to the Existing Owners, (iii) additional deductions allocated to us pursuant to Section 704(c) of the Code to reflect the difference between the fair market value and the adjusted tax basis of NTI LLC’s assets as of the date of this offering and (iv) the use of any net operating losses available to us as a result of the Existing Owner Exchange will aggregate $ million and will range from approximately $ million to $ million per year over the next 15 years. The foregoing numbers are merely estimates and the actual payments could differ materially. Furthermore, these amounts reflect only the cash savings attributable to current tax attributes resulting from the four items described above. It is possible that future transactions or events could increase or decrease the actual tax benefits realized and the corresponding Tax Receivable Agreement payments. Future payments to the Existing Owners in respect of subsequent exchanges of NTI LLC Units would be in addition to these amounts and are expected to be substantial. There may be a substantial negative impact on our liquidity if, as a result of timing discrepancies or otherwise, (i) the payments under the Tax Receivable Agreement exceed the actual benefits we realize in respect of the tax attributes subject to the Tax Receivable Agreement and/or (ii) distributions to us by NTI LLC are not sufficient to permit us to make payments under the Tax Receivable Agreement subsequent to the payment of our taxes and other obligations. The payments under the Tax Receivable Agreement will not be conditioned upon a holder of rights under a Tax Receivable Agreement having a continued ownership interest in either NTI LLC or us.
44
Table of Contents
Index to Financial Statements
See “Certain Relationships and Related Person Transactions—Tax Receivable Agreement.”
In certain cases, payments under the Tax Receivable Agreement to the Existing Owners, including ACON Refining and TPG Refining, may be accelerated and/or significantly exceed the actual benefits, if any, we realize in respect of the tax attributes subject to the Tax Receivable Agreement.
The Tax Receivable Agreement provides that upon certain mergers or other changes of control, obligations under the Tax Receivable Agreement (with respect to all NTI LLC Units, whether or not such units have been exchanged or acquired before or after such transaction) will continue based on certain assumptions, including that we would have sufficient taxable income to fully utilize the deductions arising from the increased tax basis and other benefits subject to the Tax Receivable Agreement. As a result, we could be required to make payments under the Tax Receivable Agreement that are greater than the specified percentage of the actual benefits, if any, we realize in respect of the tax attributes subject to the Tax Receivable Agreement. If we elect to terminate the Tax Receivable Agreement early, we would be required to make an immediate payment equal to the present value of the anticipated future tax benefits subject to the Tax Receivable Agreement (based upon certain assumptions and deemed events set forth in the Tax Receivable Agreement, including the assumption that we have sufficient taxable income to fully utilize such benefits and that any NTI LLC units that the Existing Owners or their transferees own on the termination date are deemed to be exchanged on the termination date). Any early termination payment may be made significantly in advance of the actual realization, if any, of such future benefits. In these situations, our obligations under the Tax Receivable Agreement could have a substantial negative impact on our liquidity and could have the effect of delaying, deferring or preventing certain mergers, asset sales, other forms of business combinations or other changes of control. For example, if the Tax Receivable Agreement were terminated immediately after this offering, the estimated termination payment would be approximately $ (calculated using a discount rate equal to ). The foregoing number is merely an estimate and the actual payment could differ materially. There can be no assurance that we will be able to finance our obligations under the Tax Receivable Agreement.
Payments under the Tax Receivable Agreement will be based on the tax reporting positions that we will determine. Although we are not aware of any issue that would cause the Internal Revenue Service (the “IRS”) to challenge a tax basis increase or other benefits arising under the Tax Receivable Agreement, the holders of rights under the Tax Receivable Agreement will not reimburse us for any payments previously made under the Tax Receivable Agreement if such basis increases or other benefits are subsequently disallowed, except that excess payments made to any such holder will be netted against payments otherwise to be made, if any, to such holder after our determination of such excess. As a result, in such circumstances, we could make payments that are greater than our actual cash tax savings, if any, and may not be able to recoup those payments, which could adversely affect our liquidity.
Risks Relating to the Offering and our Class A Common Stock
The initial public offering price of our Class A common stock may not be indicative of the market price of our Class A common stock after this offering. In addition, an active, liquid and orderly trading market for our Class A common stock may not develop or be maintained and our stock price may be volatile.
Prior to this offering, our Class A common stock was not traded on any market. An active, liquid and orderly trading market for our Class A common stock may not develop or be maintained after this offering. Active, liquid and orderly trading markets usually result in less price volatility and more efficiency in carrying out investors’ purchase and sale orders. The market price of our Class A common stock could vary significantly as a result of a number of factors, some of which are beyond our control. In the event of a drop in the market price of our Class A common stock, you could lose a substantial
45
Table of Contents
Index to Financial Statements
part or all of your investment in our Class A common stock. The initial public offering price will be negotiated between us and representatives of the underwriters, based on numerous factors which we discuss in the “Underwriting” section of this prospectus, and may not be indicative of the market price of our Class A common stock after this offering. Consequently, you may not be able to sell shares of our Class A common stock at prices equal to or greater than the price paid by you in this offering.
The following factors could affect our stock price:
| Ÿ | our operating and financial performance; |
| Ÿ | quarterly variations in the rate of growth of our financial indicators, such as net (loss) earnings per share, net earnings and revenues; |
| Ÿ | strategic actions by our competitors; |
| Ÿ | changes in revenue or earnings estimates, or changes in recommendations or withdrawal of research coverage, by equity research analysts; |
| Ÿ | speculation in the press or investment community; |
| Ÿ | sales of our Class A common stock by us or other stockholders, or the perception that such sales may occur; |
| Ÿ | changes in accounting principles; |
| Ÿ | additions or departures of key management personnel; |
| Ÿ | actions by our stockholders; |
| Ÿ | general market conditions, including fluctuations in commodity prices; and |
| Ÿ | domestic and international economic, legal and regulatory factors unrelated to our performance. |
The stock markets in general have experienced extreme volatility that has often been unrelated to the operating performance of particular companies. These broad market fluctuations may adversely affect the trading price of our Class A common stock. Securities class action litigation has often been instituted against companies following periods of volatility in the overall market and in the market price of a company’s securities. Such litigation, if instituted against us, could result in very substantial costs, divert our management’s attention and resources and harm our business, operating results and financial condition.
Investors in this offering will experience immediate and substantial dilution of $ per share.
Based on an assumed initial public offering price of $ per share, purchasers of our Class A common stock in this offering will experience an immediate and substantial dilution of $ per share in the as adjusted net tangible book value per share of Class A common stock from the initial public offering price, and our as adjusted net tangible book value as of September 30, 2011 after giving effect to this offering would be $ per share. This dilution is due in large part to the Existing Owners having paid substantially less than the initial public offering price when they purchased their interests in NTI LP. In addition, if the underwriters exercise their option to purchase additional shares from us, investors in this offering will experience additional dilution. See “Dilution” for additional information.
We have broad discretion in the use of our net proceeds from this offering and may not use them effectively.
Our management will have broad discretion in the application of the net proceeds from this offering and could spend the proceeds in ways that do not improve our operating results or enhance
46
Table of Contents
Index to Financial Statements
the value of our Class A common stock. Our stockholders may not agree with the manner in which our management chooses to allocate and spend the net proceeds. The failure by our management to apply these funds effectively could result in financial losses that could have a material adverse effect on our business and cause the price of our Class A common stock to decline. Pending their use, we may invest our net proceeds from this offering in a manner that does not produce income or that loses value. See “Use of Proceeds.”
We will incur increased legal, accounting, and other costs as a result of being a public company.
As a public company, we will need to comply with new laws, regulations and requirements of the SEC and the NYSE and certain provisions of the Sarbanes-Oxley Act of 2002, with which we are not required to comply as a private company. Complying with these laws, regulations and requirements will occupy a significant amount of time of our board of directors and management and will significantly increase our costs and expenses.
In addition, we also expect that being a public company subject to these rules and regulations will require us to accept less director and officer liability insurance coverage than we desire or to incur substantial costs to obtain coverage. These factors could also make it more difficult for us to attract and retain qualified persons to serve on our board of directors or as qualified executive officers.
Our new stand-alone finance and accounting information systems may fail to operate effectively or as intended, which could adversely affect the reliability of our financial statements.
Pursuant to a transition services agreement, Marathon agreed to provide us with, among other things, administrative and support services, including finance and accounting and information system services, for up to 18 months following the closing of the Marathon Acquisition to allow us time to build the infrastructure required to operate these functions independently. During the fourth quarter of 2011, we transitioned the finance and accounting information system services to our own stand-alone information systems. The transition was completed without significant issues. The audit of our 2011 financial statements will be the first opportunity our independent auditors will have to audit the financial information generated by our new stand-alone systems. It is possible that we will discover material shortcomings in our new stand-alone finance and accounting information systems, including those that may represent significant deficiencies or material weaknesses in our internal control over financial reporting, that are not currently known to us. Any such defects could adversely affect the reliability of our financial statements.
If, after this offering, we are unable to satisfy the requirements of Section 404 of the Sarbanes-Oxley Act, or our internal control over financial reporting are not effective, the reliability of our financial statements may be questioned, and our share price may suffer.
Section 404 of the Sarbanes-Oxley Act requires any company subject to the reporting requirements of the U.S. securities laws to perform a comprehensive evaluation of its and its subsidiaries’ internal controls. To comply with these requirements, we will be required to document and test our internal control procedures, our management will be required to assess and issue a report concerning our internal control over financial reporting, and, under the Sarbanes-Oxley Act, our independent auditors will be required to issue an opinion on management’s assessment and the effectiveness of our internal control over financial reporting. Our compliance with Section 404 of the Sarbanes-Oxley Act will first be reported on in connection with the filing of our second Annual Report on Form 10-K. The rules governing the standards that must be met for management to assess our internal control over financial reporting are complex and require significant documentation, testing and
47
Table of Contents
Index to Financial Statements
possible remediation. During the course of its testing, our management may identify material weaknesses, which may not be remedied in time to meet the deadline imposed by the SEC rules implementing Section 404. If our management cannot favorably assess the effectiveness of our internal control over financial reporting, or our auditors identify material weaknesses in our internal control, investor confidence in our financial results may weaken, and the price of shares of our Class A common stock may suffer.
We do not intend to pay, and we are currently restricted from paying, dividends on our Class A common stock and, consequently, your only opportunity to achieve a return on your investment is if the price of our Class A common stock appreciates.
We do not anticipate declaring or paying any cash dividends to holders of our Class A common stock in the foreseeable future. We currently intend to retain future earnings, if any, to finance the expansion of our business. Our future dividend policy is within the discretion of our board of directors and will depend upon then-existing conditions, including our results of operations and financial condition, capital requirements, business prospects, statutory and contractual restrictions on our ability to pay dividends, including restrictions contained in our revolving credit facility, and other factors our board of directors may deem relevant. Consequently, your only opportunity to achieve a return on your investment in us will be if you sell your Class A common stock at a price greater than you paid for it. There is no guarantee that the price of our Class A common stock that will prevail in the market will ever exceed the price that you pay in this offering.
Our share price may decline because of the ability of ACON Refining, TPG Refining and others to sell our Class A common stock.
Sales of substantial amounts of our Class A common stock after this offering, or the possibility of those sales, could adversely affect the market price of our Class A common stock and impede our ability to raise capital through the issuance of equity securities. See “Shares Eligible for Future Sale.”
The shares of our Class A common stock sold in this offering will be freely tradable without restriction in the United States, except for any shares acquired by an affiliate of our company, which can be sold under Rule 144 under the Securities Act of 1933, as amended (the “Securities Act”), subject to various volume and other limitations. Subject to limited exceptions, we, our executive officers and directors, and ACON Refining and TPG Refining have agreed not to sell, dispose of, or hedge any shares of our Class A common stock or any securities convertible into, or exchangeable for, our Class A common stock for 180 days after the date of this prospectus without the prior written consent of the underwriters, who may waive this restriction at any time without public notice. After the expiration of the 180-day lock-up period, our executive officers, directors, and ACON Refining and TPG Refining could dispose of all or any part of their shares of our Class A common stock through a public offering, sales under Rule 144, or another transaction.
In addition, subject to certain limitations and exceptions, pursuant to the terms of the LLC Agreement holders of NTI LLC Units may exchange NTI LLC Units for shares of our Class A common stock on a one-for-one basis, subject to customary conversion rate adjustments for stock splits, stock dividends and reclassifications. Upon consummation of this offering, the Existing Owners will beneficially own approximately NTI LLC Units, all of which will be exchangeable for shares of our Class A common stock. The shares of Class A common stock we issue upon such exchanges would be “restricted securities” as defined in Rule 144 of the Securities Act. However, we will enter into one or more registration rights agreements with the Existing Owners that will require us to register under the Securities Act these shares of Class A common stock. See “Shares Eligible for Future” and “Certain Relationships and Related Person Transactions—Registration Rights and Shareholders’ Agreement.”
48
Table of Contents
Index to Financial Statements
In the future, we may also issue additional Class A common stock for a number of reasons, including to finance our operations and business strategy, to adjust our ratio of debt to equity, or to provide incentives pursuant to certain executive compensation arrangements. Such future issuances of equity securities, or the expectation that they will occur, could cause the market price for our Class A common stock to decline. The price of our Class A common stock also could be affected by hedging or arbitrage trading activity that may exist or develop involving our Class A common stock. Any sale by the Existing Owners or us of shares of our Class A common stock in the public market, or the perception that sales could occur, could adversely affect prevailing market prices for our Class A common stock.
Delaware law and some provisions of our organizational documents make a takeover of our company more difficult.
Provisions of our certificate of incorporation and bylaws may have the effect of delaying, deferring or preventing a change in control of our company. A change of control could be proposed in the form of a tender offer or takeover proposal that might result in a premium over the market price for our Class A common stock. In addition, these provisions could make it more difficult to bring about a change in the composition of our board of directors, which could result in entrenchment of current management. For example, our certificate of incorporation and bylaws will:
| Ÿ | permit us to establish a classified board of directors so that not all members of our board of directors are elected at one time; |
| Ÿ | require that the number of directors be determined, and any vacancy or new board seat be filled, only by the board; |
| Ÿ | not permit stockholders to act by written consent (except for ACON Refining and TPG Refining, as long as either owns at least 50% of our outstanding common stock); |
| Ÿ | not permit stockholders to call a special meeting (except for ACON Refining and TPG Refining, as long as either owns at least 50% of our outstanding common stock); |
| Ÿ | permit the bylaws to be amended by a majority of the board without shareholder approval, and require that a bylaw amendment proposed by stockholders be approved by 66 2/3% of all outstanding shares; |
| Ÿ | establish advance notice requirements for nominations for elections to our board of directors or for proposing matters that can be acted upon by stockholders at stockholder meetings; and |
| Ÿ | authorize the issuance of undesignated preferred stock, or “blank check” preferred stock, by our board of directors without shareholder approval. |
These and other provisions of our organizational documents and Delaware law may have the effect of delaying, deferring or preventing changes of control or changes in management of our company, even if such transactions or changes would have significant benefits for our stockholders. As a result, these provisions could limit the price some investors might be willing to pay in the future for shares of our Class A common stock.
Our certificate of incorporation contains a provision renouncing our interest and expectancy in certain corporate opportunities, which could adversely affect our business or prospects.
Our certificate of incorporation provides that, to the fullest extent permitted by applicable law, we renounce any interest or expectancy in, or in being offered an opportunity to participate in, any business opportunity that may be from time to time presented to ACON Refining, TPG Refining, or their respective affiliates or any of their respective officers, directors, agents, shareholders, members, partners, affiliates and subsidiaries (other than us and our subsidiaries) or business opportunities that
49
Table of Contents
Index to Financial Statements
such parties participate in or desire to participate in, even if the opportunity is one that we might reasonably have pursued or had the ability or desire to pursue if granted the opportunity to do so, and no such person shall be liable to us for breach of any fiduciary or other duty, as a director or officer or controlling stockholder or otherwise, by reason of the fact that such person pursues or acquires any such business opportunity, directs any such business opportunity to another person or fails to present any such business opportunity, or information regarding any such business opportunity, to us unless, in the case of any such person who is our director or officer, any such business opportunity is expressly offered to such director or officer solely in his or her capacity as our director or officer.
As a result, ACON Refining, TPG Refining or their affiliates may become aware, from time to time, of certain business opportunities, such as acquisition opportunities, and may direct such opportunities to other businesses in which they have invested, in which case we may not become aware of or otherwise have the ability to pursue such opportunity. Further, such businesses may choose to compete with us for these opportunities. As a result, our renouncing our interest and expectancy in any business opportunity that may be from time to time presented to ACON Refining, TPG Refining, and their affiliates could adversely impact our business or prospects if attractive business opportunities are procured by such parties for their own benefit rather than for ours.
We will be a “controlled company” within the meaning of the NYSE rules and, as a result, will qualify for and will rely on exemptions from certain corporate governance requirements.
Upon completion of this offering we will be a “controlled company” within the meaning of the NYSE corporate governance standards. Under the NYSE rules, a company of which more than 50% of the voting power is held by a person or group of persons acting together is a “controlled company” and may elect not to comply with certain NYSE corporate governance requirements, including the requirements that:
| Ÿ | a majority of the board of directors consist of independent directors; |
| Ÿ | the nominating and corporate governance committee be composed entirely of independent directors with a written charter addressing the committee’s purpose and responsibilities; |
| Ÿ | the compensation committee be composed entirely of independent directors with a written charter addressing the committee’s purpose and responsibilities; and |
| Ÿ | there be an annual performance evaluation of the nominating and corporate governance and compensation committees. |
Following this offering, we intend to elect to be treated as a controlled company and utilize these exemptions, including the exemption for a board of directors composed of a majority of independent directors. In addition, although we will have adopted charters for our audit, nominating and corporate governance and compensation committees and intend to conduct annual performance evaluations for these committees, none of these committees will be composed entirely of independent directors immediately following the completion of this offering. We will rely on the phase-in rules of the SEC and the NYSE with respect to the independence of our audit committee. These rules permit us to have an audit committee that has one member that is independent by the date that our Class A common stock first trades on the NYSE, a majority of members that are independent within 90 days of the effectiveness of the registration statement of which this prospectus forms a part (the “effective date”) and all members that are independent within one year of the effective date. Accordingly, you may not have the same protections afforded to stockholders of companies that are subject to all of the NYSE corporate governance requirements.
50
Table of Contents
Index to Financial Statements
CAUTIONARY NOTE REGARDING FORWARD-LOOKING STATEMENTS
This prospectus includes “forward-looking statements.” The words “believe,” “expect,” “anticipate,” “plan,” “intend,” “foresee,” “should,” “would,” “could,” “attempt,” “appears,” “forecast,” “outlook,” “estimate,” “project,” “potential,” “may,” “will,” “are likely” or other similar expressions are intended to identify forward-looking statements, which are generally not historical in nature. These forward-looking statements are based on our current expectations and beliefs concerning future developments and their potential effect on us. While management believes that these forward-looking statements are reasonable as and when made, there can be no assurance that future developments affecting us will be those that we anticipate and any and all of our forward-looking statements in this prospectus may turn out to be inaccurate.
Forward-looking statements appear in a number of places in this prospectus, including “Prospectus Summary,” “Risk Factors,” “Management’s Discussion and Analysis of Financial Conditions and Results of Operations” and “Business,” and include statements with respect to, among other things:
| Ÿ | our business strategy and prospects; |
| Ÿ | technology; |
| Ÿ | our cash flows and liquidity; |
| Ÿ | our financial strategy, budget, projections and operating results; |
| Ÿ | the amount, nature and timing of capital expenditures; |
| Ÿ | the availability and terms of capital; |
| Ÿ | competition and government regulations; |
| Ÿ | general economic conditions and trends in the refining industry; |
| Ÿ | effectiveness of our risk management activities; |
| Ÿ | our environmental liabilities; |
| Ÿ | our counterparty credit risk; |
| Ÿ | governmental regulation and taxation of the refining industry; and |
| Ÿ | developments in oil-producing and natural gas-producing countries. |
Our forward-looking statements involve significant risks and uncertainties (some of which are beyond our control) and assumptions that could cause actual results to differ materially from our historical experience and our present expectations or projections. Important factors that could cause actual results to differ materially from those in the forward-looking statements include, but are not limited to, those summarized below:
| Ÿ | the overall demand for specialty hydrocarbon products, fuels and other refined products; |
| Ÿ | our ability to produce products and fuels that meet our customers’ unique and precise specifications; |
| Ÿ | the impact of fluctuations and rapid increases or decreases in crude oil, refined products, fuel and utility services prices and crack spreads, including the impact of these factors on our liquidity; |
| Ÿ | fluctuations in refinery capacity; |
| Ÿ | accidents or other unscheduled shutdowns affecting our refineries, machinery, or equipment, or those of our suppliers or customers; |
51
Table of Contents
Index to Financial Statements
| Ÿ | changes in the cost or availability of transportation for feedstocks and refined products; |
| Ÿ | the results of our hedging and other risk management activities; |
| Ÿ | our ability to comply with covenants contained in our debt instruments; |
| Ÿ | labor relations; |
| Ÿ | relationships with our partners and franchisees; |
| Ÿ | successful integration and future performance of acquired assets, businesses or third-party product supply and processing relationships; |
| Ÿ | our access to capital to fund expansions, acquisitions and our working capital needs and our ability to obtain debt or equity financing on satisfactory terms; |
| Ÿ | currently unknown liabilities in connection with the Marathon Acquisition; |
| Ÿ | environmental liabilities or events that are not covered by an indemnity, insurance or existing reserves; |
| Ÿ | dependence on one principal supplier for merchandise; |
| Ÿ | maintenance of our credit ratings and ability to receive open credit lines from our suppliers; |
| Ÿ | the effects of competition; |
| Ÿ | continued creditworthiness of, and performance by, counterparties; |
| Ÿ | the impact of current and future laws, rulings and governmental regulations, including guidance related to the Dodd-Frank Wall Street Reform and Consumer Protection Act; |
| Ÿ | shortages or cost increases of power supplies, natural gas, materials or labor; |
| Ÿ | weather interference with business operations; |
| Ÿ | seasonal trends in the industries in which we operate; |
| Ÿ | fluctuations in the debt markets; |
| Ÿ | potential product liability claims and other litigation; |
| Ÿ | accidents or other unscheduled shutdowns or disruptions; and |
| Ÿ | changes in economic conditions, generally, and in the markets we serve, consumer behavior, and travel and tourism trends. |
These factors are not necessarily all of the important factors that could cause actual results to differ materially from those expressed in any of our forward-looking statements. Other unknown or unpredictable factors also could have material adverse effects on our future results. Our future results will depend upon various other risks and uncertainties, including those described elsewhere in this prospectus under the heading, “Risk Factors.” Readers are cautioned not to place undue reliance on forward-looking statements, which speak only as of the date hereof. We undertake no obligation to update or revise any forward-looking statements after the date they are made, whether as a result of new information, future events or otherwise. All forward-looking statements attributable to us are qualified in their entirety by this cautionary statement.
52
Table of Contents
Index to Financial Statements
The diagram below depicts our organizational structure immediately following this offering assuming that the underwriters’ option to purchase additional shares is not exercised.
53
Table of Contents
Index to Financial Statements
| (1) | Based on an assumed initial public offering price equal to the midpoint of the price range set forth on the cover of this prospectus. Immediately following the offering, the Existing Owners will have an aggregate economic interest in Northern Tier Energy, Inc. and NTI LLC equal to %. However, the portion of such percentage that constitutes NTI LLC Units or Class A common stock will depend on the initial public offering price. As discussed below, the allocation of NTI LLC Units among the Existing Owners will be determined pursuant to the distribution provisions of the existing amended and restated limited partnership agreement of NTI LP based upon the liquidation value of NTI LP, which will be implied by the initial public offering price of the shares of Class A common stock in this offering. A deviation in the initial public offering price from the assumed initial public offering price will impact the allocation of equity interests to the Existing Owners, including those who intend to exchange their NTI LLC Units for our Class A common stock in connection with this offering. Accordingly, any such deviation in the initial public offering price will impact the number of NTI LLC Units and shares of Class A common stock and Class B Common Stock held by the Existing Owners. For example, an offering price of $ per share would result in the Existing Owners owning % of the NTI LLC Units, shares of Class A common stock and shares of Class B common stock. Likewise, an offering price of $ per share would result in the Existing Owners owning % of the NTI LLC Units, shares of Class A common stock and shares of Class B common stock. |
Reorganization Transactions
NTI LP and NTI LLC were organized by ACON Refining and TPG Refining to act as holding companies of the operating companies that own and operate the business and assets acquired in the Marathon Acquisition. Immediately prior to this offering, NTI LP will merge into NTI LLC. In connection with such merger, the LLC Agreement will be amended and restated to, among other things, designate the NTI LLC Units as a single new class of units in NTI LLC that are exchangeable for shares of Class A common stock, as described below, and to designate Northern Tier Energy, Inc. as the sole managing member of NTI LLC.
Currently, the capital structure of NTI LP consists of a general partner interest and certain classes of limited partner interests, each of which has different capital accounts and different aggregate distribution thresholds above which its holders share in future distributions. Pursuant to the merger of NTI LP into NTI LLC, we anticipate that the general partner interest in NTI LP will be canceled in exchange for $1,000, and all of the classes of limited partner interests in NTI LP, currently held by the Existing Owners, will be converted into a single class of units, the NTI LLC Units. The allocation of NTI LLC Units among the Existing Owners will be determined pursuant to the distribution provisions of the existing amended and restated limited partnership agreement of NTI LP based upon the liquidation value of NTI LP, which will be implied by the initial public offering price of the shares of Class A common stock sold in this offering.
Interests in certain of the Existing Owners held by certain members of management subject to vesting requirements will remain subject to such vesting requirements following this offering. See “Compensation Discussion and Analysis—Components of Executive Compensation—Long-Term Equity-Based Incentives.”
Under the terms of the LLC Agreement, holders of NTI LLC Units will have the right to exchange NTI LLC Units (together with a corresponding number of shares of Class B common stock) for shares of Class A common stock on a one-for-one basis, subject to customary conversion rate adjustments for stock splits, stock dividends and reclassifications.
54
Table of Contents
Index to Financial Statements
Incorporation of Northern Tier Energy, Inc.
Northern Tier Energy, Inc. was incorporated as a Delaware corporation on October 21, 2011. Prior to this offering Northern Tier Energy, Inc. has not engaged in any business or other activities except in connection with its formation. Following this offering, Northern Tier Energy, Inc. will be a holding company and its sole material asset will be an equity interest in NTI LLC. Northern Tier Energy, Inc., as sole managing member of NTI LLC, will operate and control all of the business and affairs of NTI LLC and consolidate the financial results of NTI LLC and its subsidiaries.
The certificate of incorporation of Northern Tier Energy, Inc. authorizes two classes of common stock, Class A common stock and Class B common stock, each having the terms described in “Description of Capital Stock.” Each share of Class B common stock has no economic rights but entitles its holder to one vote on all matters to be voted on by stockholders generally. Holders of our Class A common stock and Class B common stock will vote together as a single class on all matters presented to our stockholders for their vote or approval, except as otherwise required by applicable law.
At the time of this offering, Northern Tier Energy, Inc. will issue and contribute to NTI LLC a number of shares of Class B common stock equal to the number of outstanding NTI LLC Units (other than those units held by us). NTI LLC will then distribute to each Existing Owner a number of shares of Class B common stock equal to the number of NTI LLC Units held by such Existing Owner.
Offering Transactions
At the time of this offering, in addition to the contribution of Class B common stock described above, Northern Tier Energy, Inc. will contribute a portion of the net proceeds of this offering, as well as a noncontrolling preferred interest in a subsidiary of NTI LLC that it will purchase from Marathon with a portion of the proceeds from this offering to NTI LLC, in exchange for NTI LLC Units. If the underwriters’ option to purchase additional shares is exercised in full, Northern Tier Energy, Inc. will purchase from NTI LLC additional NTI LLC Units at a purchase price per unit equal to the initial public offering price per share of Class A common stock in this offering less any underwriting discounts and commissions.
Of the cash received by NTI LLC from Northern Tier Energy, Inc., $ million will be distributed by NTI LLC to the Existing Owners and the remainder will be used as described in “Use of Proceeds.” Northern Tier Energy, Inc. will be treated for U.S. federal income tax purposes as having used the distributed portion of the proceeds of this offering to directly purchase NTI LLC Units from the Existing Owners.
At the time of this offering, certain of the Existing Owners will exchange approximately NTI LLC Units for approximately shares of Class A common stock and for an aggregate of $ million in cash pursuant to the Existing Owner Exchange. In addition, pursuant to the terms of the LLC Agreement, the Existing Owners have the right to exchange their NTI LLC Units (together with a corresponding number of shares of Class B common stock) for shares of Class A common stock on a one-for-one basis. Furthermore, we intend to enter into the Tax Receivable Agreement with the Existing Owners. See “Certain Relationships and Related Person Transactions—Tax Receivable Agreement.”
In connection with its acquisition of NTI LLC Units as part of this offering, Northern Tier Energy, Inc. will become the sole managing member of NTI LLC and, through NTI LLC and its subsidiaries, operate our business. Accordingly, although Northern Tier Energy, Inc. will initially have a minority economic interest in NTI LLC, Northern Tier Energy, Inc. will have 100% of the voting power in, and control the management of, NTI LLC.
55
Table of Contents
Index to Financial Statements
As a result of the transactions described above:
| Ÿ | the investors in this offering will collectively own shares of our Class A common stock (or shares of Class A common stock if the underwriters exercise in full their option to purchase additional shares of Class A common stock), and Northern Tier Energy, Inc. will hold approximately NTI LLC Units (or approximately NTI LLC Units if the underwriters exercise in full their option to purchase additional shares of Class A common stock); |
| Ÿ | Existing Owners will hold NTI LLC Units (and a corresponding number of shares of Class B common stock) and shares of Class A common stock; |
| Ÿ | the investors in this offering will collectively have % of the voting power in Northern Tier Energy, Inc. (or % if the underwriters exercise in full their option to purchase additional shares of Class A common stock); |
| Ÿ | Existing Owners, through their holdings of our Class A and Class B common stock, will have % of the voting power in Northern Tier Energy, Inc. (or % if the underwriters exercise in full their option to purchase additional shares of Class A common stock); and |
| Ÿ | the NTI LLC Units held by the Existing Owners (together with a corresponding number of shares of our Class B common stock) may be exchanged for shares of our Class A common stock on a one-for-one basis. |
Holding Company Structure
Following this offering, Northern Tier Energy, Inc. will be a holding company, and its sole material asset will be an equity interest in NTI LLC. As the sole managing member of NTI LLC, Northern Tier Energy, Inc. will operate and control all of the business and affairs of NTI LLC and will consolidate the financial results of NTI LLC and its subsidiaries. The ownership interest of the Existing Owners in NTI LLC will be reflected as a non-controlling interest in Northern Tier Energy, Inc.’s consolidated financial statements.
Our post-offering organizational structure will allow the Existing Owners to retain their equity ownership in NTI LLC, an entity that is classified as a partnership for U.S. federal income tax purposes, in the form of NTI LLC Units. Investors in this offering will, by contrast, hold their equity ownership in Northern Tier Energy, Inc., a Delaware corporation that is a domestic corporation for U.S. federal income tax purposes, in the form of shares of Class A common stock. We believe that the Existing Owners generally find it advantageous to hold their equity interests in an entity that is not taxable as a corporation for U.S. federal income tax purposes. The Existing Owners, like Northern Tier Energy, Inc., will incur U.S. federal, state and local income taxes on their proportionate share of any taxable income of NTI LLC.
Pursuant to the LLC Agreement, and subject to the discussion in the following paragraph, Northern Tier Energy, Inc. has the right to determine when distributions will be made to the holders of NTI LLC Units and the amount of any such distributions. If Northern Tier Energy, Inc. authorizes a distribution, such distribution will be made to the holders of NTI LLC Units on a pro rata basis in accordance with their respective percentage ownership of NTI LLC Units.
The holders of NTI LLC Units, including Northern Tier Energy, Inc., will incur U.S. federal, state and local income taxes on their proportionate share of any taxable income of NTI LLC. Net profits and net losses of NTI LLC will generally be allocated to its members (including Northern Tier Energy, Inc.) on a pro rata basis in accordance with their respective percentage ownership of NTI LLC Units. The LLC Agreement will provide for cash distributions to the holders of NTI LLC Units if Northern Tier Energy, Inc. determines that the taxable income of NTI LLC will give rise to taxable income for such
56
Table of Contents
Index to Financial Statements
holders. In accordance with the LLC Agreement, Northern Tier Energy, Inc. intends to cause NTI LLC to make cash distributions to the holders of NTI LLC Units for purposes of funding their tax obligations in respect of the income of NTI LLC that is allocated to them. Generally, these tax distributions will be computed based on Northern Tier Energy, Inc.’s estimate of the taxable income of NTI LLC allocable to such holder of NTI LLC Units multiplied by an assumed tax rate equal to the highest effective marginal combined U.S. federal, state and local income tax rate prescribed for an individual or corporate resident in New York, New York (taking into account the nondeductibility of certain expenses and the character of Northern Tier Energy, Inc.’s income).
See “Certain Relationships and Related Person Transactions—Limited Liability Company Agreement—NTI LLC.”
57
Table of Contents
Index to Financial Statements
We expect to receive net proceeds of approximately $ million from the sale of the Class A common stock offered by us, assuming an initial public offering price of $ per share (the midpoint of the price range set forth on the cover page of this prospectus) and after deducting underwriting discounts and commissions of approximately $ million and estimated offering expenses of approximately $ million. If the underwriters’ option to purchase additional shares is exercised in full, we estimate that the net proceeds to us will be approximately $ million. An increase or decrease in the initial public offering price of $1.00 per share of Class A common stock would cause the net proceeds that we will receive from the offering, after deducting underwriting discounts and commissions and estimated offering expenses, to increase or decrease by approximately $ million (assuming no exercise of the option to purchase additional shares by the underwriters).
We intend to use $ million of the net proceeds to purchase a noncontrolling preferred interest in one of our subsidiaries owned by Marathon.
We intend to pay $ million of the net proceeds to certain of the Existing Owners pursuant to the Existing Owner Exchange.
We intend to contribute the remaining $ million of the net proceeds, as well as the noncontrolling preferred interest in one of our subsidiaries that we will purchase from Marathon, to NTI LLC in exchange for NTI LLC Units. NTI LLC will distribute $ million to the Existing Owners and will retain $ million for general corporate purposes. We will have broad discretion as to the application of the proceeds to be used for general corporate purposes. Prior to the application, such proceeds may be held in cash or invested in short-term securities or investments. See “Organizational Structure—Offering Transactions” and “Principal Stockholders” for information regarding the proceeds from this offering that will be paid to our directors and executive officers.
58
Table of Contents
Index to Financial Statements
We do not anticipate declaring or paying any cash dividends to holders of our Class A common stock in the foreseeable future. We currently intend to retain future earnings, if any, to finance the expansion of our business. Our future dividend policy is within the discretion of our board of directors and will depend upon then-existing conditions, including our results of operations and financial condition, capital requirements, business prospects, statutory and contractual restrictions on our ability to pay dividends, including restrictions contained in our revolving credit facility, and other factors our board of directors may deem relevant.
59
Table of Contents
Index to Financial Statements
The following table sets forth cash and cash equivalents and capitalization as of September 30, 2011,
| Ÿ | on an actual basis for NTI LLC; and |
| Ÿ | on a pro forma basis for Northern Tier Energy, Inc. after giving effect to the reorganization and this offering and the application of the net proceeds as set forth under “Use of Proceeds.” |
You should read the following table in conjunction with “Organizational Structure,” “Use of Proceeds,” “Unaudited Pro Forma Condensed Consolidated Financial Information,” “Management’s Discussion and Analysis of Financial Condition and Results of Operations” and our financial statements and related notes thereto appearing elsewhere in this prospectus.
| As of September 30, 2011 |
||||||||
| NTI LLC | Northern Tier Energy, Inc. |
|||||||
| Actual | Pro Forma | |||||||
| (in millions) | ||||||||
| Cash and cash equivalents(1) |
$ | 126.9 | $ | |||||
|
|
|
|
|
|||||
| Long-term debt, including current maturities: |
||||||||
| Senior secured notes |
$ | 290.0 | $ | |||||
| Revolving credit facility(2) |
— | |||||||
| Lease financing obligation(3) |
24.5 | |||||||
|
|
|
|
|
|||||
| Total long-term debt |
314.5 | |||||||
|
|
|
|
|
|||||
| Noncontrolling preferred interest in subsidiary |
86.1 | |||||||
| Member’s interest / stockholders’ equity: |
||||||||
| Member’s interest (deficit) |
(66.7) | — | ||||||
| Class A common stock, $0.01 par value; no shares authorized, issued and outstanding (actual); shares authorized and shares issued and outstanding (pro forma) |
— | |||||||
| Class B common stock, $0.01 par value; no shares authorized, issued and outstanding (actual); shares authorized and shares issued and outstanding (pro forma) |
— | |||||||
| Additional paid-in capital |
— | |||||||
| Retained earnings (accumulated loss) |
— | |||||||
|
|
|
|
|
|||||
| Total member’s interest (deficit) / stockholders’ equity (deficit) |
(66.7) | |||||||
|
|
|
|
|
|||||
| Total capitalization |
$ | 333.9 | $ | |||||
|
|
|
|
|
|||||
| (1) | As of February 9, 2012, cash and cash equivalents were $115 million. |
| (2) | As of February 9, 2012, we had no borrowings outstanding under our revolving credit facility, and had $62 million in outstanding letters of credit. |
| (3) | Relates to specific properties that did not qualify for operating lease treatment under the sale leaseback of 135 SuperAmerica convenience stores with Realty Income, a third party equity real estate investment trust. |
60
Table of Contents
Index to Financial Statements
If you invest in our Class A common stock in this offering, you will experience immediate and substantial dilution in the net tangible book value per share of the Class A common stock for accounting purposes. Our net tangible book value as of September 30, 2011, after giving pro forma effect to the transactions described under “Organizational Structure,” was approximately $ million, or $ per share of Class A common stock. Pro forma net tangible book value per share is determined by dividing our pro forma net tangible book value (tangible assets less total liabilities) by the total number of outstanding shares of Class A common stock that will be outstanding immediately prior to the closing of this offering and after reflecting our corporate reorganization. After giving effect to the issuance by us of the shares in this offering and further assuming the receipt of the estimated net proceeds (after deducting estimated underwriting discounts and commissions and expenses of this offering), our adjusted pro forma net tangible book value as of September 30, 2011 would have been approximately $ million, or $ per share. This represents an immediate increase in the net tangible book value of $ per share to our existing stockholders and an immediate dilution (i.e., the difference between the offering price and the adjusted pro forma net tangible book value after this offering) to new investors purchasing shares in this offering of $ per share. The following table illustrates the per share dilution to new investors purchasing shares in this offering (assuming the underwriters’ option to purchase additional shares is not exercised in full):
| Assumed initial public offering price per share |
$ | |||||||
| Pro forma net tangible book value per share as of September 30, 2011 (after giving effect to our corporate reorganization) |
$ | |||||||
| Increase per share attributable to new investors in this offering |
||||||||
|
|
|
|||||||
| As adjusted pro forma net tangible book value per share after giving effect to our corporate reorganization and this offering |
||||||||
|
|
|
|||||||
| Dilution in pro forma net tangible book value per share to new investors in this offering |
$ | |||||||
|
|
|
The following table summarizes, on a pro forma basis as of September 30, 2011, the total number of shares of Class A common stock owned by existing stockholders and to be owned by new investors, the total consideration paid, and the average price per share paid by our existing stockholders and to be paid by new investors in this offering at $ , the midpoint of the range of the initial public offering prices set forth on the cover page of this prospectus, calculated before deduction of estimated underwriting discounts and commissions (assuming the underwriters’ option to purchase additional shares is not exercised in full):
| Shares Acquired | Total Consideration | Average Price Per Share |
||||||||||||||||
| Number | Percent | Amount | Percent | |||||||||||||||
| Existing stockholders |
% | $ | % | $ | ||||||||||||||
| New investors |
% | % | ||||||||||||||||
|
|
|
|
|
|
|
|
|
|
||||||||||
| Total |
% | $ | % | $ | ||||||||||||||
|
|
|
|
|
|
|
|
|
|
||||||||||
61
Table of Contents
Index to Financial Statements
UNAUDITED PRO FORMA CONDENSED CONSOLIDATED FINANCIAL INFORMATION
The following unaudited pro forma condensed consolidated financial information has been derived by applying pro forma adjustments to historical audited and unaudited financial statements and the notes included thereto, included elsewhere in this prospectus. The unaudited pro forma condensed consolidated financial information should be read in conjunction with the financial statements and related notes and other financial information appearing elsewhere in this prospectus, including under “Prospectus Summary—Summary Historical and Unaudited Pro Forma Condensed Consolidated Financial and Other Data,” “Management’s Discussion and Analysis of Financial Condition and Results of Operations,” “Organizational Structure” and “Use of Proceeds.”
The unaudited pro forma condensed consolidated balance sheet as of September 30, 2011 and the unaudited pro forma condensed consolidated statements of operations for the year ended December 31, 2010 and the nine months ended September 30, 2011 and 2010 give effect to the following adjustments relating to our reorganization, this offering and the use of the proceeds from this offering (the “Offering Adjustments”), as if they had occurred on September 30, 2011 for the unaudited pro forma condensed consolidated balance sheet and January 1, 2010 for the unaudited pro forma condensed consolidated statements of operations:
| Ÿ | the reorganization transactions described in “Organizational Structure—Reorganization Transactions;” |
| Ÿ | the issuance of shares of Class A common stock and shares of Class B common stock to the Existing Owners, based on an assumed initial offering price of $ per share; |
| Ÿ | the establishment of the Tax Receivable Agreement with the Existing Owners; and |
| Ÿ | the sale of shares of Class A common stock in this offering and the use of proceeds from this offering, as described in “Use of Proceeds.” |
The unaudited pro forma condensed consolidated financial information presented assumes no exercise by the underwriters of the option to purchase up to additional shares of Class A common stock from us and that the shares of Class A common stock to be sold in this offering are sold at $ per share, which is the midpoint of the price range indicated on the front cover of this prospectus.
The unaudited pro forma condensed consolidated statements of operations for the year ended December 31, 2010 and the nine months ended September 30, 2011 and 2010 also give effect to the following adjustments associated with the Marathon Acquisition and corresponding financing (the “Marathon Acquisition Adjustments”) as if they had occurred on January 1, 2010:
| Ÿ | the Marathon Acquisition; |
| Ÿ | the financing of the Marathon Acquisition, including the issuance of the 10.5% senior secured notes, as described in “Prospectus Summary—Marathon Acquisition;” |
| Ÿ | the sale by Marathon of certain real property interests, including the land underlying 135 of the SuperAmerica convenience stores associated with our retail business and SuperMom’s Bakery, to Realty Income and the lease of those properties to us on a long-term basis; and |
| Ÿ | the change in depreciation and amortization expense associated with the change in carrying value of the tangible and intangible assets acquired as part of the Marathon Acquisition. |
The Marathon Acquisition was accounted for using the acquisition method of accounting in accordance with the FASB Accounting Standards Codification (“ASC”) Topic 805, “Business
62
Table of Contents
Index to Financial Statements
Combinations,” and, accordingly, resulted in the recognition of assets acquired and liabilities assumed at their respective fair values as of the closing date of the Marathon Acquisition. The audited and unaudited historical financial information includes the allocation of purchase price, based upon management’s estimates of the fair values of assets acquired and liabilities assumed, based on available information and assumptions which we believe to be reasonable as of the closing date of the Marathon Acquisition which, among other things, led us to conclude that the Marathon Acquisition gave rise to a bargain purchase for accounting purposes.
The pro forma adjustments and their underlying assumptions are described in the accompanying notes, which should be read in conjunction with the unaudited pro forma condensed consolidated financial information. The unaudited pro forma condensed consolidated balance sheet gives effect to adjustments that (i) are directly attributable to this offering and (ii) are factually supportable regardless of whether they have a continuing impact on us or are non-recurring. The unaudited pro forma condensed consolidated statements of operations give effect to adjustments that are (i) directly attributable to this offering and the Marathon Acquisition, (ii) are factually supportable and (iii) are expected to have a continuing impact on us. The unaudited pro forma condensed consolidated financial information does not purport to represent what our results of operations or financial condition would have been had this offering and the Marathon Acquisition actually occurred on the dates indicated, and it does not purport to project our results of operations or financial condition for any future period or any future date.
The unaudited pro forma condensed consolidated statements of operations data have been adjusted for non-recurring charges or gains that were recorded in connection with the Marathon Acquisition. These estimated non-recurring items include estimated direct expenses incurred in connection with the Marathon Acquisition and a bargain purchase gain associated with the excess of the fair value of net assets acquired over total purchase consideration (see note (f) to the unaudited pro forma condensed consolidated statements of operations). During October 2010, Marathon entered into derivatives contracts at our request hedging a portion of our estimated gasoline and distillate production for 2011 and 2012, and contributed these contracts to us at the closing of the Marathon Acquisition. The changes in fair value for these derivative contracts are reflected in the unaudited historical statement of operations from the date in which they were entered. The unaudited pro forma condensed consolidated statements of operations have not been adjusted to reflect these derivative contracts for the period from January 1, 2010 through the date they were entered into, as the amounts are not factually supportable.
Our historical financial information for the period prior to the Marathon Acquisition has been prepared on a combined basis using historical results of operations and bases of assets and liabilities acquired from Marathon and do not necessarily reflect what their results of operations or financial position would have been had the business been operated independently from Marathon during the periods presented, including as a result of changes in operations that resulted from the separation of the businesses from Marathon. The historical financial information for the periods prior to the Marathon Acquisition date reflects intercompany allocations of expenses which may not be indicative of the actual expenses that would have been incurred had the combined business been operating as a company independent from Marathon for the periods presented. In addition, the historical financial statements for the period prior to the Marathon Acquisition may not be comparable to our financial statements following consummation of the Marathon Acquisition. See “Management’s Discussion and Analysis of Financial Condition and Results of Operations—Comparability of Historical Results.”
See “Organizational Structure” to see how certain aspects of the offering transactions would be affected by an initial public offering price that is different from the assumed price or if the underwriters’ option to purchase additional shares of Class A common stock is exercised in full.
63
Table of Contents
Index to Financial Statements
Northern Tier Energy, Inc.
Unaudited Pro Forma Condensed Consolidated Balance Sheet
September 30, 2011
(in millions)
| NTI LLC Historical(a) |
Offering Adjustments |
Pro Forma Northern Tier Energy, Inc. |
||||||||||
| ASSETS |
||||||||||||
| CURRENT ASSETS |
||||||||||||
| Cash and cash equivalents |
$ | 126.9 | $ | (b) | $ | |||||||
| Receivables, less allowance for doubtful accounts |
103.3 | |||||||||||
| Inventories |
152.8 | |||||||||||
| Deferred income taxes |
— | (c) | ||||||||||
| Other current assets |
42.5 | |||||||||||
|
|
|
|
|
|
|
|||||||
| Total current assets |
425.5 | |||||||||||
| NONCURRENT ASSETS |
||||||||||||
| Equity method investment |
90.5 | |||||||||||
| Property, plant and equipment, net |
391.8 | |||||||||||
| Intangible assets, net |
35.4 | |||||||||||
| Other assets |
49.3 | |||||||||||
|
|
|
|
|
|
|
|||||||
| Total Assets |
$ | 992.5 | $ | $ | ||||||||
|
|
|
|
|
|
|
|||||||
| LIABILITIES, PREFERRED INTEREST AND EQUITY |
||||||||||||
| CURRENT LIABILITIES |
||||||||||||
| Accounts payable |
$ | 181.5 | $ | $ | ||||||||
| Amounts payable under Tax Receivable Agreement |
— | (d) | ||||||||||
| Accrued liabilities |
29.0 | |||||||||||
| Derivative liability |
346.2 | |||||||||||
|
|
|
|
|
|
|
|||||||
| Total current liabilities |
556.7 | |||||||||||
| NONCURRENT LIABILITIES |
||||||||||||
| Long-term debt |
290.0 | |||||||||||
| Deferred income taxes |
— | (c) | ||||||||||
| Lease financing obligation |
24.5 | |||||||||||
| Derivative liability |
56.5 | |||||||||||
| Amounts payable under Tax Receivable Agreement - net of current portion |
— | (d) | ||||||||||
| Other liabilities |
45.4 | |||||||||||
|
|
|
|
|
|
|
|||||||
| Total liabilities |
973.1 | |||||||||||
|
|
|
|
|
|
|
|||||||
| Commitments and contingencies |
||||||||||||
| Noncontrolling preferred interest in subsidiary |
86.1 | (e) | ||||||||||
| EQUITY |
||||||||||||
| Common Stock / Additional paid in capital |
— | (f) | ||||||||||
| Member’s interest |
(66.7 | ) | (g) | |||||||||
|
|
|
|
|
|
|
|||||||
| Total equity attributable to controlling interest |
(66.7 | ) | ||||||||||
|
|
|
|
|
|
|
|||||||
| Noncontrolling interest in NTI LLC |
— | (h) | ||||||||||
|
|
|
|
|
|
|
|||||||
| Total Liabilities, Noncontrolling Interest and Equity |
$ | 992.5 | $ | $ | ||||||||
|
|
|
|
|
|
|
|||||||
See Notes to Unaudited Pro Forma Condensed Consolidated Balance Sheet
64
Table of Contents
Index to Financial Statements
Northern Tier Energy, Inc.
Notes to Unaudited Pro Forma Condensed Consolidated Balance Sheet
| (a) | Represents the historical unaudited balance sheet for NTI LLC as of September 30, 2011. |
| (b) | Represents the net adjustment to cash and cash equivalents primarily related to the sources and uses of proceeds of this offering, calculated as follows: |
| (in millions) | ||||
| Proceeds from this offering |
$ | |||
| Use of proceeds |
||||
|
|
|
|||
| Net adjustment to cash and cash equivalents |
$ | |||
|
|
|
|||
| (c) | Represents the net adjustments to deferred income taxes, calculated as follows: |
| (In millions) | ||||
| Adjustment associated with the change in tax paying status(i) |
$ | |||
| Adjustments associated with the Tax Receivable Agreement(ii) |
||||
| Adjustment associated with the redemption of the noncontrolling preferred interest(iii) |
||||
|
|
|
|||
| Net Adjustment to Deferred income taxes—Asset |
$ | |||
|
|
|
|||
| Adjustment associated with the change in tax paying status(i) |
$ | |||
| Adjustments associated with the Tax Receivable Agreement(ii) |
||||
| Adjustment associated with the redemption of the noncontrolling preferred interest(iii) |
||||
|
|
|
|||
| Net Adjustment to Deferred income taxes—Liability |
$ | |||
|
|
|
|||
| (i) | Adjustment related to Northern Tier Energy, Inc. becoming subject to U.S. federal, state and local income taxes with respect to its allocable share of any taxable income of NTI LLC and taxed at the prevailing corporate tax rates after the closing of this offering. |
| (ii) | Adjustments to record tax assets and liabilities associated with the Tax Receivable Agreement. See footnote (d) for further discussions related to the Tax Receivable Agreement. |
| (iii) | Adjustment to reflect the deferred tax impact of the redemption of the noncontrolling preferred interest. |
| (d) | Represents an adjustment to record assets and liabilities associated with the Tax Receivable Agreement. Pursuant to the Tax Receivable Agreement, we generally will be required to pay certain of the Existing Owners 85% of the applicable cash savings, if any, in U.S. federal, state and local income tax or franchise tax that we actually realize as a result of (i) the increase in tax basis in NTI LLC’s assets that arose from the Marathon Acquisition, (ii) the basis increase resulting from the distribution of offering proceeds to the Existing Owners, (iii) the basis increases resulting from the exchanges of NTI LLC Units (along with the corresponding shares of our Class B common stock) for shares of our Class A common stock, (iv) additional deductions allocated to us pursuant to Section 704(c) of the Code, to reflect the difference between the fair market value and the adjusted tax basis of NTI LLC’s assets as of the date of this offering, (v) imputed interest deemed to be paid by us as a result of, and additional tax basis arising from, payments under the Tax Receivable Agreement, and (vi) any net operating losses available to us as a result of the Existing Owner Exchange. We will record 85% of the estimated tax benefit as an increase to amounts payable under the Tax Receivable Agreement, as a liability. |
65
Table of Contents
Index to Financial Statements
| (e) | Represents the adjustment to eliminate the noncontrolling preferred interest as part of the uses of proceeds from the offering. |
| (f) | Reflects the net adjustments to common stock and additional paid in capital, calculated as follows: |
| (In millions) | ||||
| Proceeds from this offering(i) |
$ | |||
| Equity reclass(ii) |
||||
|
|
|
|||
| Net Adjustment to Capital—Additional paid in capital |
$ | |||
|
|
|
|||
| (i) | Adjustment to reflect the transaction proceeds from the sale of Class A common stock in connection with this offering, and |
| (ii) | Adjustment to reflect the reclassification of equity to common stock. |
| (g) | Reflects the net adjustment to Member’s interest, calculated as follows: |
| (In millions) | ||||
| Proceeds from this offering(i) |
$ | |||
| Equity reclass(ii) |
||||
|
|
|
|||
| Net Adjustment to Capital—Additional paid in capital |
$ | |||
|
|
|
|||
| (i) | Adjustment to reflect the impacts of the Tax Receivable Agreement. |
| (ii) | Adjustment to reflect the reclassification of equity to common stock. |
| (h) | Represents the net adjustment to noncontrolling interest in NTI LLC. |
66
Table of Contents
Index to Financial Statements
Northern Tier Energy, Inc.
Unaudited Pro Forma Condensed Consolidated Statement of Operations
For the Nine Months Ended September 30, 2011
(in millions)
| NTI LLC Historical(a) |
Marathon Acquisition Adjustments |
Pro Forma Marathon Acquisition |
Offering Adjustments |
Pro Forma Northern Tier Energy, Inc. |
||||||||||||||||||||||||
| REVENUE |
$ | 3,192.0 | $ | — | $ | 3,192.0 | $ | $ | ||||||||||||||||||||
| COSTS, EXPENSES AND OTHER |
||||||||||||||||||||||||||||
| Costs of sales |
2,573.8 | — | 2,573.8 | |||||||||||||||||||||||||
| Direct operating expenses |
194.8 | — | 194.8 | |||||||||||||||||||||||||
| Turnaround and related expenses |
22.5 | — | 22.5 | |||||||||||||||||||||||||
| Depreciation and amortization |
22.3 | — | 22.3 | |||||||||||||||||||||||||
| Selling, general and administrative |
65.4 | — | 65.4 | |||||||||||||||||||||||||
| Formation costs |
6.1 | (6.1 | ) | (d | ) | — | ||||||||||||||||||||||
| Contingent consideration income |
(37.6 | ) | — | (37.6 | ) | |||||||||||||||||||||||
| Other (income) expense, net |
(2.4 | ) | — | (2.4 | ) | |||||||||||||||||||||||
|
|
|
|
|
|
|
|
|
|
|
|||||||||||||||||||
| OPERATING INCOME |
$ | 347.1 | $ | 6.1 | $ | 353.2 | $ | $ | ||||||||||||||||||||
| Realized losses from derivative activities |
(246.4 | ) | — | (246.4 | ) | |||||||||||||||||||||||
| Unrealized losses from derivative activities |
(334.5 | ) | — | (334.5 | ) | |||||||||||||||||||||||
| Interest expense |
(30.6 | ) | — | (30.6 | ) | |||||||||||||||||||||||
|
|
|
|
|
|
|
|
|
|
|
|||||||||||||||||||
| EARNINGS (LOSS) BEFORE INCOME TAXES |
$ | (264.4 | ) | $ | 6.1 | $ | (258.3 | ) | $ | $ | ||||||||||||||||||
| Income tax (provision) benefit |
— | — | — | (i | ) | |||||||||||||||||||||||
|
|
|
|
|
|
|
|
|
|
|
|
|
|||||||||||||||||
| NET (LOSS) EARNINGS |
$ | (264.4 | ) | $ | 6.1 | $ | (258.3 | ) | $ | $ | ||||||||||||||||||
|
|
|
|
|
|
|
|
|
|
|
|||||||||||||||||||
| NET (LOSS) EARNINGS ATTRIBUTABLE TO NONCONTROLLING INTEREST |
5.5 | — | 5.5 | (j | ) | |||||||||||||||||||||||
|
|
|
|
|
|
|
|
|
|
|
|||||||||||||||||||
| NET (LOSS) EARNINGS ATTRIBUTABLE TO CONTROLLING INTEREST |
$ | (269.9 | ) | $ | 6.1 | $ | (263.8 | ) | $ | $ | ||||||||||||||||||
|
|
|
|
|
|
|
|
|
|
|
|||||||||||||||||||
| NET (LOSS) EARNINGS PER SHARE |
||||||||||||||||||||||||||||
| Basic |
||||||||||||||||||||||||||||
|
|
|
|
|
|||||||||||||||||||||||||
| Diluted |
||||||||||||||||||||||||||||
|
|
|
|
|
|||||||||||||||||||||||||
| WEIGHTED AVERAGE SHARES OUTSTANDING |
||||||||||||||||||||||||||||
| Basic |
||||||||||||||||||||||||||||
|
|
|
|
|
|||||||||||||||||||||||||
| Diluted |
||||||||||||||||||||||||||||
|
|
|
|
|
|||||||||||||||||||||||||
See Notes to Unaudited Pro Forma Condensed Consolidated Statements of Operations
67
Table of Contents
Index to Financial Statements
Northern Tier Energy, Inc.
Unaudited Pro Forma Condensed Consolidated Statement of Operations
For The Nine Months Ended September 30, 2010
(in millions, except per share data)
| Predecessor Historical(a) |
Marathon Acquisition Adjustments |
Pro Forma Marathon Acquisition |
Offering Adjustments |
Pro Forma Northern Tier Energy, Inc. |
||||||||||||||||||||||||
| REVENUE |
$ | 2,582.3 | $ | — | $ | 2,582.3 | $ | $ | ||||||||||||||||||||
| COSTS, EXPENSES AND OTHER |
||||||||||||||||||||||||||||
| Costs of sales |
2,193.8 | — | 2,193.8 | |||||||||||||||||||||||||
| Direct operating expenses |
183.4 | 13.7 | (b | ) | 197.1 | |||||||||||||||||||||||
| Turnaround and related expenses |
8.2 | — | 8.2 | |||||||||||||||||||||||||
| Depreciation and amortization |
30.0 | (7.5 | ) | (c | ) | 22.5 | ||||||||||||||||||||||
| Selling, general and administrative |
47.0 | — | 47.0 | |||||||||||||||||||||||||
| Formation costs |
— | — | — | |||||||||||||||||||||||||
| Contingent consideration income |
— | — | — | |||||||||||||||||||||||||
| Other (income) expense, net |
(4.3 | ) | 0.2 | (e | ) | (4.1 | ) | |||||||||||||||||||||
|
|
|
|
|
|
|
|
|
|
|
|||||||||||||||||||
| OPERATING INCOME |
$ | 124.2 | $ | (6.4 | ) | $ | 117.8 | $ | $ | |||||||||||||||||||
| Realized losses from derivative activities |
— | — | — | |||||||||||||||||||||||||
| Unrealized losses from derivative activities |
— | — | — | |||||||||||||||||||||||||
| Interest expense |
(0.2 | ) | (28.9 | ) | (g | ) | (29.1 | ) | ||||||||||||||||||||
|
|
|
|
|
|
|
|
|
|
|
|||||||||||||||||||
| EARNINGS (LOSS) BEFORE INCOME TAXES |
$ | 124.0 | $ | (35.3 | ) | $ | 88.7 | $ | $ | |||||||||||||||||||
| Income tax (provision) benefit |
(49.2 | ) | 49.2 | (h | ) | — | (i | ) | ||||||||||||||||||||
|
|
|
|
|
|
|
|
|
|
|
|||||||||||||||||||
| NET EARNINGS |
$ | 74.8 | $ | 13.9 | $ | 88.7 | $ | $ | ||||||||||||||||||||
|
|
|
|
|
|
|
|
|
|
|
|||||||||||||||||||
| NET EARNINGS ATTRIBUTABLE TO NONCONTROLLING INTEREST |
— | 5.4 | (j | ) | 5.4 | (j | ) | |||||||||||||||||||||
|
|
|
|
|
|
|
|
|
|
|
|||||||||||||||||||
| NET EARNINGS ATTRIBUTABLE TO CONTROLLING INTEREST |
$ | 74.8 | $ | 8.5 | $ | 83.3 | $ | $ | ||||||||||||||||||||
|
|
|
|
|
|
|
|
|
|
|
|||||||||||||||||||
| NET EARNINGS PER SHARE |
||||||||||||||||||||||||||||
| Basic |
||||||||||||||||||||||||||||
|
|
|
|
|
|||||||||||||||||||||||||
| Diluted |
||||||||||||||||||||||||||||
|
|
|
|
|
|||||||||||||||||||||||||
| WEIGHTED AVERAGE SHARES OUTSTANDING |
||||||||||||||||||||||||||||
| Basic |
||||||||||||||||||||||||||||
|
|
|
|
|
|||||||||||||||||||||||||
| Diluted |
||||||||||||||||||||||||||||
|
|
|
|
|
|||||||||||||||||||||||||
See Notes to Unaudited Pro Forma Condensed Consolidated Statements of Operations
68
Table of Contents
Index to Financial Statements
Northern Tier Energy, Inc.
Unaudited Pro Forma Condensed Consolidated Statement of Operations
For The Year Ended December 31, 2010
(in millions, except per share data)
| Predecessor | Successor | |||||||||||||||||||||||||||||||||||
| Eleven Months Ended November 30, 2010 |
August
10, 2010 (inception date) through December 31, 2010 |
Year Ended December 31, 2010 |
Marathon Acquisition Adjustments |
Pro Forma Marathon Acquisition |
Offering Adjustments |
Pro Forma Northern Tier Energy, Inc. |
||||||||||||||||||||||||||||||
| REVENUE |
$ | 3,195.2 | $ | 344.9 | $ | 3,540.1 | $ | — | $ | 3,540.1 | $ | $ | ||||||||||||||||||||||||
| COSTS, EXPENSES AND OTHER |
||||||||||||||||||||||||||||||||||||
| Costs of sales |
2,697.9 | 307.5 | 3,005.4 | — | 3,005.4 | |||||||||||||||||||||||||||||||
| Direct operating expenses |
227.0 | 21.4 | 248.4 | 16.7 | (b | ) | 265.1 | |||||||||||||||||||||||||||||
| Turnaround and related expenses |
9.5 | — | 9.5 | — | 9.5 | |||||||||||||||||||||||||||||||
| Depreciation and amortization |
37.3 | 2.2 | 39.5 | (10.0 | ) | (c | ) | 29.5 | ||||||||||||||||||||||||||||
| Selling, general and administrative |
59.6 | 6.4 | 66.0 | — | 66.0 | |||||||||||||||||||||||||||||||
| Formation costs |
— | 24.3 | 24.3 | (24.3 | ) | (d | ) | — | ||||||||||||||||||||||||||||
| Other (income) expense, net |
(5.4 | ) | 0.1 | (5.3 | ) | 0.2 | (e | ) | (5.1 | ) | ||||||||||||||||||||||||||
|
|
|
|
|
|
|
|
|
|
|
|
|
|
|
|||||||||||||||||||||||
| OPERATING (LOSS) INCOME |
$ | 169.3 | $ | (17.0 | ) | $ | 152.3 | $ | 17.4 | $ | 169.7 | $ | $ | |||||||||||||||||||||||
| Unrealized losses from derivative activities |
(40.9 | ) | (27.1 | ) | (68.0 | ) | (68.0 | ) | ||||||||||||||||||||||||||||
| Bargain purchase gain |
— | 51.4 | 51.4 | (51.4 | ) | (f | ) | — | ||||||||||||||||||||||||||||
| Interest expense |
(0.3 | ) | (3.2 | ) | (3.5 | ) | (35.2 | ) | (g | ) | (38.7 | ) | ||||||||||||||||||||||||
|
|
|
|
|
|
|
|
|
|
|
|
|
|
|
|||||||||||||||||||||||
| EARNINGS (LOSS) BEFORE INCOME TAXES |
$ | 128.1 | $ | 4.1 | $ | 132.2 | $ | (69.2 | ) | $ | 63.0 | $ | $ | |||||||||||||||||||||||
| Income tax (provision) benefit |
(67.1 | ) | — | (67.1 | ) | 67.1 | (h | ) | — |
|
(i |
) |
||||||||||||||||||||||||
|
|
|
|
|
|
|
|
|
|
|
|
|
|
|
|||||||||||||||||||||||
| NET (LOSS) EARNINGS |
$ | 61.0 | $ | 4.1 | $ | 65.1 | $ | (2.1 | ) | $ | 63.0 | $ | $ | |||||||||||||||||||||||
|
|
|
|
|
|
|
|
|
|
|
|
|
|
|
|||||||||||||||||||||||
| NET (LOSS) EARNINGS ATTRIBUTABLE TO NONCONTROLLING INTEREST |
— | 0.6 | 0.6 | 6.6 | (j | ) | 7.2 | (j | ) | |||||||||||||||||||||||||||
|
|
|
|
|
|
|
|
|
|
|
|
|
|
|
|||||||||||||||||||||||
| NET (LOSS) EARNINGS ATTRIBUTABLE TO CONTROLLING INTEREST |
$ | 61.0 | $ | 3.5 | $ | 64.5 | $ | (8.7 | ) | $ | 55.8 | $ | $ | |||||||||||||||||||||||
|
|
|
|
|
|
|
|
|
|
|
|
|
|
|
|||||||||||||||||||||||
| NET EARNINGS PER SHARE |
||||||||||||||||||||||||||||||||||||
| Basic |
||||||||||||||||||||||||||||||||||||
|
|
|
|
|
|||||||||||||||||||||||||||||||||
| Diluted |
||||||||||||||||||||||||||||||||||||
|
|
|
|
|
|||||||||||||||||||||||||||||||||
| WEIGHTED AVERAGE SHARES OUTSTANDING |
||||||||||||||||||||||||||||||||||||
| Basic |
||||||||||||||||||||||||||||||||||||
|
|
|
|
|
|||||||||||||||||||||||||||||||||
| Diluted |
||||||||||||||||||||||||||||||||||||
|
|
|
|
|
|||||||||||||||||||||||||||||||||
See Notes to Unaudited Pro Forma Condensed Consolidated Statements of Operations.
69
Table of Contents
Index to Financial Statements
Northern Tier Energy, Inc.
Notes to Unaudited Pro Forma Condensed Consolidated Statements of Operations
| (a) | Reflects the unaudited historical statements of operations for the nine months ended September 30, 2011 and 2010. The historical statement of operations for the nine months ended September 30, 2010 includes the results of operations for the Predecessor. |
| Reflects the statement of operations for the year ended December 31, 2010, which includes Predecessor financial information for the eleven months ended November 30, 2010 combined with NTI LLC financial information for August 10, 2010 (inception date) through December 31, 2010. NTI LLC had no operating activities between August 10, 2010 (inception date) and December 1, 2010 (the closing date of the Marathon Acquisition), although it incurred various transaction and formation costs which have been included in the period August 10, 2010 (inception date) through December 31, 2010. |
| (b) | At the closing of the Marathon Acquisition, Marathon received approximately $247.6 million in proceeds through a sale to Realty Income, a third party equity real estate investment trust, of the real property interests associated with Marathon’s 135 owned SuperAmerica convenience stores and SuperMom’s Bakery. In connection with the closing of the Marathon Acquisition, Realty Income now leases those properties to us on a long-term basis. We applied “sale leaseback” accounting to the majority of this arrangement and, accordingly, the real estate assets are no longer reflected in our balance sheet and the leaseback is accounted for as an operating lease. This adjustment reflects the operating lease expense related to the sale-leaseback arrangement. |
| (c) | Reflects the net adjustment to depreciation and amortization, calculated as follows: |
| Year Ended December 31, 2010 |
Nine Months Ended September 30, 2010 |
|||||||
| (in millions) | ||||||||
| Total increase due to step up in assets |
$ | 4.4 | $ | 3.3 | ||||
| Less historical depreciation attributable to sale-leaseback arrangement |
(8.2 | ) | (6.2) | |||||
| Less adjustment due to change in life on Marathon Assets |
(6.2 | ) | (4.6) | |||||
|
|
|
|
|
|||||
| Net adjustment to depreciation and amortization |
$ | (10.0 | ) | $ | (7.5) | |||
|
|
|
|
|
|||||
| (d) | Reflects an adjustment to reverse non-recurring formation costs incurred for the Marathon Acquisition during the year ended December 31, 2010 and nine months ended September 30, 2011 that cannot be capitalized under US GAAP. |
| (e) | Represents an adjustment to other income, net related to the purchase price allocated to our equity method investment in MPL Investments which resulted in an increase to the value of our equity method investment of $13.7 million. As this increased value is amortized over the estimated life of the underlying assets of our equity method investee (estimated to be 17 years), income from the equity method investment is reduced on a pro forma basis in the amount of $0.2 million for both the year ended December 31, 2010 and the nine months ended September 30, 2010. |
| Year Ended December 31, 2010 |
Nine Months Ended September 30, 2010 |
|||||||
| (in millions) | ||||||||
| Increase in value |
$ | 7.2 | $ | 7.2 | ||||
| Estimated life (months) |
360 | 360 | ||||||
| Months elapsed during period |
11 | 9 | ||||||
|
|
|
|
|
|||||
| Net adjustment to Other (income) expense, net |
$ | 0.2 | $ | 0.2 | ||||
|
|
|
|
|
|||||
70
Table of Contents
Index to Financial Statements
| (f) | Reflects an adjustment to remove the bargain purchase gain recorded as a result of the Marathon Acquisition, as this is non-recurring in nature and directly attributable to the Marathon Acquisition. |
| (g) | Reflects the net adjustments to interest and other financial income, calculated as follows: |
| Year Ended December 31, 2010 |
Nine Months Ended September 30, 2010 |
|||||||
| (in millions) | ||||||||
| Interest expense on our $290.0 million senior secured notes (i) |
$ | (30.5 | ) | $ | (22.8 | ) | ||
| Interest expense on revolving line of credit (ii) |
(1.9 | ) | (1.4 | ) | ||||
| Amortization of debt issuance costs related to our $290.0 million senior secured notes and the revolving credit facility (iii) |
(4.4 | ) | (3.3 | ) | ||||
| Interest expense on our lease financing obligations (iv) |
(1.9 | ) | (1.6 | ) | ||||
|
|
|
|
|
|||||
| Pro forma additional interest expense |
$ | (38.7 | ) | $ | (29.1 | ) | ||
| Historical interest expense |
3.5 | 0.2 | ||||||
|
|
|
|
|
|||||
| Net adjustment to interest expense |
$ | (35.2 | ) | $ | (28.9 | ) | ||
|
|
|
|
|
|||||
| (i) | Adjustment to pro forma cash interest expense based upon an actual interest rate of 10.5% for the senior secured notes offered in December 2010. 1/8% change in assumed interest rates would change pro forma interest expense by $0.4 million for the year ended December 31, 2010 and $0.2 million for the nine months ended September 30, 2010. |
| (ii) | Adjustment for commitment fees of 0.625% on a $300.0 million undrawn balance under the revolving credit facility. |
| (iii) | Adjustment for non-cash interest expense related to estimated capitalized debt issuance costs that are being amortized over the term of the related debt instrument (weighted average term of 5.8 years). |
| (iv) | Adjustment for the portion of rent expense classified as interest expense. |
| (h) | Following the closing of the Marathon Acquisition, we were taxed as a partnership and, accordingly, the pro forma adjustment eliminates historical income tax expense. |
| (i) | Represents the net adjustment to income tax (provision) benefit, calculated as follows: |
| Year Ended December 31, 2010 |
Nine Months Ended September 30, 2010 |
Nine Months Ended September 30, 2011 |
||||||||||
| (in millions) | ||||||||||||
| Tax impact of pro forma adjustments (i) |
$ | $ | $ | |||||||||
| Tax impact of conversion to C corporation (ii) |
||||||||||||
|
|
|
|
|
|
|
|||||||
| Net adjustment to income tax provision |
$ | $ | $ | |||||||||
|
|
|
|
|
|
|
|||||||
| (i) | Adjustment for the tax impact of the Marathon Acquisition. |
| (ii) | Adjustment related to the reorganization transactions described in “Organizational Structure—Reorganization Transactions”, whereby we will become a tax paying corporation. |
| (j) | Reflects an adjustment for the effects of the Existing Owner’s noncontrolling interest in NTI LLC’s net earnings. |
71
Table of Contents
Index to Financial Statements
SELECTED HISTORICAL AND UNAUDITED PRO FORMA CONDENSED CONSOLIDATED FINANCIAL DATA
The following tables present certain selected historical and unaudited pro forma condensed consolidated financial data. The combined financial statements as of and for the years ended December 31, 2006, 2007, 2008 and 2009, the eleven months ended November 30, 2010 and the nine months ended September 30, 2010 represent a carve-out financial statement presentation of several operating units of Marathon, which we refer to as “Predecessor.” For more information on the carve-out presentation, see “Management’s Discussion and Analysis of Financial Condition and Results of Operations—Predecessor Carve-Out Financial Statements” and our financial statements and the notes thereto included elsewhere in this prospectus. The historical financial data for periods prior to December 1, 2010 presented below do not reflect the consummation of the Marathon Acquisition and the transactions related thereto or our capital structure following the Marathon Acquisition and the transactions related thereto. NTI LLC was formed on August 10, 2010 and entered into certain agreements with Marathon on October 6, 2010 to acquire the Marathon Assets. At the closing of the Marathon Acquisition on December 1, 2010, NTI LLC acquired the Marathon Assets. NTI LLC had no operating activities between its August 10, 2010 inception date and the closing date of the Marathon Acquisition, although it incurred various transaction and formation costs which have been included in the 2010 Successor Period.
You should read these tables along with “Risk Factors,” “Use of Proceeds,” “Capitalization,” “Management’s Discussion and Analysis of Financial Condition and Results of Operations—Predecessor Carve-Out Financial Statements,” “Business” and financial statements and the notes thereto, included elsewhere in this prospectus.
The selected historical financial data as of December 31, 2009 and 2010 and for the years ended December 31, 2008 and 2009, the period from January 1, 2010 through November 30, 2010 and the 2010 Successor Period are derived from audited financial statements and the notes thereto included elsewhere in this prospectus. The selected historical combined financial data as of December 31, 2008, 2007 and November 30, 2010 and for the years ended December 31, 2006, 2007 and 2008 are derived from audited financial statements and the notes thereto not included in this prospectus.
The selected historical financial data as of September 30, 2011 and for the nine months ended September 30, 2011 and 2010 are derived from unaudited financial statements and the notes thereto included elsewhere in this prospectus. The selected historical combined balance sheet data as of September 30, 2010 was derived from unaudited financial statements and the notes thereto which are not included elsewhere in this prospectus.
The historical financial and other data presented below are not necessarily indicative of the results to be expected for any future period.
The selected unaudited pro forma condensed consolidated statement of operations data and other data presented below for the year ended December 31, 2010 and for the nine months ended
September 30, 2010 give effect only to the Marathon Acquisition and the transactions related thereto as if they had occurred on January 1, 2010. The pro forma adjustments are based upon available information and certain assumptions that we believe are reasonable. There have been no pro forma adjustments made to the selected unaudited pro forma condensed consolidated financial data presented below to give effect to the reorganization and offering transactions described in “Organizational Structure.” The selected unaudited pro forma financial data are for informational purposes only and do not purport to represent what our results actually would have been if the relevant transactions had occurred on any date, and such data does not purport to project our results for any future period or any future date. See “Unaudited Pro Forma Condensed Consolidated Financial Information” for a complete description of the adjustments and assumptions underlying the selected unaudited pro forma financial data as well as additional pro forma financial data.
72
Table of Contents
Index to Financial Statements
| Predecessor | Successor | Pro Forma Marathon Acquisition |
Predecessor | Pro Forma Marathon Acquisition |
Successor | |||||||||||||||||||||||||||||||||||||||||
| Year Ended December 31, | Eleven Months Ended November 30, 2010 |
August 10, 2010 (inception date) – December 31, 2010 |
Year Ended December 31, 2010 |
Nine Months Ended September 30, 2010 |
Nine Months Ended September 30, 2010 |
Nine Months Ended September 30, 2011 |
||||||||||||||||||||||||||||||||||||||||
| 2006 | 2007 | 2008 | 2009 | |||||||||||||||||||||||||||||||||||||||||||
| (In millions) | ||||||||||||||||||||||||||||||||||||||||||||||
| Consolidated and Combined statements of operations data: |
||||||||||||||||||||||||||||||||||||||||||||||
| Total revenue |
$ | 3,270.4 | $ | 3,522.8 | $ | 4,122.4 | $ | 2,940.5 | $ | 3,195.2 | $ | 344.9 | $ | 3,540.1 | $ | 2,582.3 | $ | 2,582.3 | $ | 3,192.0 | ||||||||||||||||||||||||||
| Costs and expenses: |
||||||||||||||||||||||||||||||||||||||||||||||
| Costs of sales |
2,646.6 | 2,820.0 | 3,659.0 | 2,507.9 | 2,697.9 | 307.5 | 3,005.4 | 2,193.8 | 2,193.8 | 2,573.8 | ||||||||||||||||||||||||||||||||||||
| Direct operating expenses |
240.5 | 249.0 | 252.7 | 238.3 | 227.0 | 21.4 | 265.1 | 183.4 | 197.1 | 194.8 | ||||||||||||||||||||||||||||||||||||
| Turnaround and related expenses |
12.0 | 32.6 | 3.7 | 0.6 | 9.5 | – | 9.5 | 8.2 | 8.2 | 22.5 | ||||||||||||||||||||||||||||||||||||
| Depreciation and amortization |
33.1 | 33.7 | 39.2 | 40.2 | 37.3 | 2.2 | 29.5 | 30.0 | 22.5 | 22.3 | ||||||||||||||||||||||||||||||||||||
| Selling, general and administrative expenses |
59.8 | 61.7 | 67.7 | 64.7 | 59.6 | 6.4 | 66.0 | 47.0 | 47.0 | 65.4 | ||||||||||||||||||||||||||||||||||||
| Formation costs |
– | – | – | – | – | 24.3 | – | – | – | 6.1 | ||||||||||||||||||||||||||||||||||||
| Contingent consideration income |
– | – | – | – | – | – | – | – | – | (37.6 | ) | |||||||||||||||||||||||||||||||||||
| Other (income) expense, net |
(11.1 | ) | 0.7 | 1.2 | (1.1 | ) | (5.4 | ) | 0.1 | (5.1 | ) | (4.3 | ) | (4.1 | ) | (2.4 | ) | |||||||||||||||||||||||||||||
|
|
|
|
|
|
|
|
|
|
|
|
|
|
|
|
|
|
|
|
|
|||||||||||||||||||||||||||
| Operating income (loss) |
289.5 | 325.1 | 98.9 | 89.9 | 169.3 | (17.0 | ) | 169.7 | 124.2 | 117.8 | 347.1 | |||||||||||||||||||||||||||||||||||
| Realized losses from derivative activities |
– | – | – | – | – | – | – | – | – | (246.4 | ) | |||||||||||||||||||||||||||||||||||
| Unrealized losses from derivative activities |
– | – | – | – | (40.9 | ) | (27.1 | ) | (68.0 | ) | – | – | (334.5 | ) | ||||||||||||||||||||||||||||||||
| Bargain purchase gain |
– | – | – | – | – | 51.4 | – | – | – | – | ||||||||||||||||||||||||||||||||||||
| Interest expense |
(0.7 | ) | 0.2 | (0.5 | ) | (0.4 | ) | (0.3 | ) | (3.2 | ) | (38.7 | ) | (0.2 | ) | (29.1 | ) | (30.6 | ) | |||||||||||||||||||||||||||
|
|
|
|
|
|
|
|
|
|
|
|
|
|
|
|
|
|
|
|
|
|||||||||||||||||||||||||||
| Earnings (loss) before income taxes |
288.8 | 325.3 | 98.4 | 89.5 | 128.1 | 4.1 | 63.0 | 124.0 | 88.7 | (264.4 | ) | |||||||||||||||||||||||||||||||||||
| Income tax provision |
(116.5 | ) | (129.9 | ) | (39.8 | ) | (34.8 | ) | (67.1 | ) | – | – | (49.2 | ) | – | – | ||||||||||||||||||||||||||||||
|
|
|
|
|
|
|
|
|
|
|
|
|
|
|
|
|
|
|
|
|
|||||||||||||||||||||||||||
| Net earnings (loss) |
172.3 | 195.4 | 58.6 | 54.7 | 61.0 | 4.1 | 63.0 | 74.8 | 88.7 | (264.4 | ) | |||||||||||||||||||||||||||||||||||
| Less: net earnings attributable to noncontrolling preferred interest |
– | – | – | – | – | 0.6 | 7.2 | – | 5.4 | 5.5 | ||||||||||||||||||||||||||||||||||||
|
|
|
|
|
|
|
|
|
|
|
|
|
|
|
|
|
|
|
|
|
|||||||||||||||||||||||||||
| Net earnings (loss) available to members |
$ | 172.3 | $ | 195.4 | $ | 58.6 | $ | 54.7 | $ | 61.0 | $ | 3.5 | $ | 55.8 | $ | 74.8 | $ | 83.3 | $ | (269.9 | ) | |||||||||||||||||||||||||
|
|
|
|
|
|
|
|
|
|
|
|
|
|
|
|
|
|
|
|
|
|||||||||||||||||||||||||||
| Consolidated and combined statements of cash flow data: |
||||||||||||||||||||||||||||||||||||||||||||||
| Net cash provided by (used in): |
||||||||||||||||||||||||||||||||||||||||||||||
| Operating activities |
$ | 205.3 | $ | 282.7 | $ | 47.1 | $ | 129.4 | $ | 145.4 | $ | (18.5 | ) | $ | 73.5 | $ | 194.3 | |||||||||||||||||||||||||||||
| Investing activities |
(25.1 | ) | (111.0 | ) | (84.6 | ) | (25.0 | ) | (29.3 | ) | (363.3 | ) | (21.1 | ) | (140.2 | ) | ||||||||||||||||||||||||||||||
| Financing activities |
(179.2 | ) | (171.7 | ) | 34.5 | (103.9 | ) | (115.4 | ) | 456.1 | (52.3 | ) | (1.5 | ) | ||||||||||||||||||||||||||||||||
| Capital expenditures |
(50.5 | ) | (75.8 | ) | (45.0 | ) | (29.0 | ) | (29.8 | ) | (2.5 | ) | (21.6 | ) | (27.4 | ) | ||||||||||||||||||||||||||||||
| Consolidated and combined balance sheets data (at period end): |
||||||||||||||||||||||||||||||||||||||||||||||
| Cash and cash equivalents |
$ | 8.5 | $ | 8.5 | $ | 5.5 | $ | 6.0 | $ | 6.7 | $ | 74.3 | $ | 6.1 | $ | 126.9 | ||||||||||||||||||||||||||||||
| Total assets |
629.1 | 737.3 | 708.2 | 710.1 | 717.8 | 932.1 | 696.1 | 992.5 | ||||||||||||||||||||||||||||||||||||||
| Total long-term debt |
– | – | – | – | – | 314.5 | — | 314.5 | ||||||||||||||||||||||||||||||||||||||
| Total liabilities |
330.6 | 415.1 | 292.7 | 343.9 | 405.4 | 647.9 | 306.8 | 973.1 | ||||||||||||||||||||||||||||||||||||||
| Total noncontrolling preferred interest in subsidiary |
– | – | – | – | – | 80.6 | — | 86.1 | ||||||||||||||||||||||||||||||||||||||
| Total equity (deficit) |
$ | 298.5 | $ | 322.2 | $ | 415.5 | $ | 366.2 | $ | 312.4 | $ | 203.6 | $ | 389.3 | $ | (66.7 | ) | |||||||||||||||||||||||||||||
73
Table of Contents
Index to Financial Statements
MANAGEMENT’S DISCUSSION AND ANALYSIS OF
FINANCIAL CONDITION AND RESULTS OF OPERATIONS
The following discussion and analysis of our financial condition and results of operations should be read in conjunction with our financial statements and related notes included elsewhere in this prospectus. The following discussion contains “forward-looking statements” that reflect our future plans, estimates, beliefs and expected performance. Our actual results may differ materially from those currently anticipated and expressed in such forward-looking statements as a result of a number of factors, including those we discuss under “Risk Factors” elsewhere in this prospectus. We caution that assumptions, expectations, projections, intentions or beliefs about future events may, and often do, vary from actual results and the differences can be material. See “Cautionary Note Regarding Forward-Looking Statements.”
Overview
We are an independent downstream energy company with refining, retail and pipeline operations that serve the PADD II region of the United States. We operate our assets in two business segments: the refining business and the retail business. For the nine months ended September 30, 2011, we had total revenues of $3.2 billion, operating income of $347.1 million, a net loss of $264.4 million and Adjusted EBITDA of $364.2 million. For the year ended December 31, 2010, on a pro forma basis for the Marathon Acquisition total revenues were $3.5 billion, operating income was $169.7 million, net earnings were $63.0 million and Adjusted EBITDA was $213.1 million. For a definition, and reconciliation, of Adjusted EBITDA to net (loss) earnings, see “Prospectus Summary—Summary Historical and Unaudited Pro Forma Condensed Consolidated Financial and Other Data.”
Refining Business
Our refining business primarily consists of a 74,000 bpd (84,500 barrels per stream day) refinery located in St. Paul Park, Minnesota. Our refinery has a Nelson complexity index of 11.5, which refers to the number, type and capacity of processing units at the refinery. We are one of only two refineries in Minnesota and one of four refineries in the Upper Great Plains area within the PADD II region. Of the 27 operable refineries in the PADD II region, only three have a Nelson complexity index higher than ours. The PADD II region covers the following states: Illinois, Indiana, Iowa, Kansas, Kentucky, Michigan, Minnesota, Missouri, Nebraska, North Dakota, South Dakota, Ohio, Oklahoma, Tennessee and Wisconsin. Our strategic location allows us direct access, primarily via the Minnesota Pipeline, crude oils from Western Canada and North Dakota, as well as the ability to distribute our refined products throughout the midwestern United States. Our refinery produces a broad slate of refined products including gasoline, diesel, jet fuel and asphalt, which are then marketed to resellers and consumers primarily in the PADD II region. Approximately 79% and 78% of our total refinery production for the nine months ended September 30, 2011 and the year ended December 31, 2010, respectively, comprised higher value, light refined products, including gasoline and distillates. Our refinery crude capacity utilization rates have ranged from approximately 80% to approximately 88% over the last five years.
We also own various storage and transportation assets, including a light products terminal, a heavy products terminal, storage tanks, rail loading/unloading facilities and a Mississippi river dock. Approximately 80% and 75% of our gasoline and diesel volumes for the nine months ended September 30, 2011 and the year ended December 31, 2010, respectively, were sold via our light products terminal located at the refinery to our company-operated and franchised SuperAmerica branded convenience stores, Marathon branded convenience stores and other resellers. We have a contract with Marathon to supply substantially all of the gasoline and diesel requirements for 90 independently owned and operated Marathon branded convenience stores.
74
Table of Contents
Index to Financial Statements
Our refining business also includes our 17% interest in the Minnesota Pipe Line Company, which owns and operates the Minnesota Pipeline, a 455,000 bpd crude oil pipeline system that transports crude oil (primarily from Western Canada and North Dakota) for approximately 300 miles from the Enbridge pipeline hub at Clearbrook, Minnesota to our refinery. The Minnesota Pipeline has historically supplied the majority of the crude oil used and processed in our refinery.
Retail Business
As of September 30, 2011, our retail business operated 166 convenience stores under the SuperAmerica brand and also supported 67 franchised convenience stores, which are also operated under the SuperAmerica brand. These convenience stores are located primarily in Minnesota and Wisconsin and sell various grades of gasoline and diesel, tobacco products and immediately consumable items such as non-alcoholic beverages, beer, prepared food and a large variety of snacks and prepackaged items. Our refinery supplied substantially all of the gasoline and diesel sold in our company-operated and franchised convenience stores for the nine months ended September 30, 2011 and the year ended December 31, 2010.
We also own and operate SuperMom’s Bakery, which prepares and distributes baked goods and other prepared food items for sale in our company-operated and franchised convenience stores and other third party locations.
Outlook
Transportation fuels demand in the Upper Great Plains of the PADD II region currently exceeds supply from local refineries. Therefore, demand is fulfilled by products that are imported into the region mostly via pipeline from other parts of the Midwest, the Rocky Mountains and the U.S. Gulf Coast. Overall refined product demand declined in 2008 as a result of prevailing economic conditions and began to improve in the first quarter of 2010. While there continues to be a significant global macroeconomic risk that may affect the pace of growth in the United States, we have experienced improved overall product demand in our geographic area of operations relative to prior years.
Our operating performance has benefited from the widening of the price relationship between the traditional crude oil pricing benchmark, NYMEX WTI, and the international waterborne crude oil pricing benchmark, Brent. We purchase crude oil which is priced based off NYMEX WTI. Refined products prices are set by global markets and are typically priced off Brent. Therefore, we have enjoyed a benefit during the nine months ended September 30, 2011 from the widening of the price differential between our cost of crude oil and the price of the products we sell. The widening differential may have been attributable to several factors, including geopolitical events in the Middle East, the suspension of crude oil exports from Libya, and limited pipeline and other infrastructure to transport crude oil from Cushing, Oklahoma, where NYMEX WTI is settled, to alternative markets. More recently, during the last quarter of 2011, the discount to which NYMEX WTI trades relative to Brent has narrowed due to a number of factors, including recently announced changes in the pipeline infrastructure serving Cushing, Oklahoma. The narrowing of this margin will affect the prices at which we sell our refined products relative to our cost of crude oil and can therefore cause a reduction in our refining margins. Please see “Risk Factors—Risks Primarily Related to our Refining Business— Our profitability is affected by crude oil differentials, which may fluctuate substantially.”
75
Table of Contents
Index to Financial Statements
Predecessor Carve-Out Financial Statements
As described in the financial statements and notes thereto included elsewhere in this prospectus, this prospectus includes financial statements for the years ended December 31, 2008 and 2009, the eleven months ended November 30, 2010 and the nine months ended September 30, 2010 for the St. Paul Park Refinery and Retail Marketing Business, representing a carve-out financial statement presentation of several operating units of Marathon (the “Predecessor Financial Statements”). All significant intercompany accounts and transactions have been eliminated in the Predecessor Financial Statements.
The Predecessor Financial Statements were prepared to reflect the way we have operated our business subsequent to the Marathon Acquisition, which is in two segments: the refining segment and the retail segment. Except for certain assets that were not acquired (e.g., cash other than in-store cash at our convenience stores, receivables and assets sold to third parties pursuant to a sale-leaseback arrangement between us, Speedway SuperAmerica LLC, an affiliate of Marathon, and Realty Income, a third party equity real estate investment trust, and a crude oil supply and logistics purchase agreement with JPM CCC) and certain liabilities (e.g., accounts payable, payroll and benefits payable and deferred taxes) that were not assumed in connection with the Marathon Acquisition, the Predecessor Financial Statements represent the Marathon Assets. In addition, the Predecessor Financial Statements include allocations of selling, general and administrative costs and other overhead costs of Marathon Oil and its affiliates that are attributable to the operations of the Marathon Assets. We believe the assumptions, allocations and methodologies underlying the Predecessor Financial Statements are reasonable. However, the Predecessor Financial Statements do not include all of the actual expenses that would have been incurred had the Marathon Assets been operated on a stand-alone basis during the periods presented and do not reflect the Marathon Assets combined results of operations, financial position and cash flows had it been operated on a stand-alone basis during the periods presented.
Comparability of Historical Results
Marathon Acquisition and Related Transactions
We commenced operations in December 2010 through the acquisition of our St. Paul Park, Minnesota refinery, a 17% interest in the Minnesota Pipe Line Company and in MPL Investments, our convenience stores and related assets from Marathon for $554 million, which included cash and the issuance to Marathon of $80 million of a noncontrolling preferred interest in one of our subsidiaries.
Prior to the Marathon Acquisition, the business was operated as several operating units of Marathon, and participated in Marathon’s centralized cash management programs. All cash receipts were remitted to and all cash disbursements were funded by Marathon. Following the Marathon Acquisition, we operate as a stand-alone company and our results of operations may not be comparable to the historical results of operations for the periods presented, primarily for the reasons described below:
| Ÿ | The Marathon Acquisition agreements provide for contingent consideration, or earn-out payments, that could result in additional payments of up to a total of $125 million by us to Marathon over the eight years following the Marathon Acquisition. Specifically, we will be required to pay Marathon 40% of the amount by which the Agreement Adjusted EBITDA exceeds $165 million during any one-year period, subject to certain reductions, in the eight years following the Marathon Acquisition. |
76
Table of Contents
Index to Financial Statements
| Ÿ | The Marathon Acquisition agreements also include a margin support component that requires Marathon to pay to us up to $30 million per year in cash to the extent the Agreement Adjusted EBITDA is below $145 million, subject to certain reductions, in either of the twelve-month periods ending November 30, 2011 or 2012, resulting in up to a maximum of $60 million potentially being payable to us. Any margin support paid by Marathon will increase the maximum earn-out amount payable by us dollar for dollar. |
| Ÿ | In connection with the Marathon Acquisition, certain additional transactions were consummated, and we entered into certain agreements with respect to our operations, including the following |
| • | Senior Secured Notes. We issued $290 million of 10.5% senior secured notes due December 1, 2017. We pay interest on the senior secured notes on June 1 and December 1 of each year. The net proceeds from the sale of the senior secured notes were used to fund part of the Marathon Acquisition. See “—Liquidity and Capital Resources—Description of Our Indebtedness—Senior Secured Notes.” |
| • | Asset-Based Revolving Credit Facility. We entered into a $300 million senior secured asset-based revolving credit facility, which is subject to a borrowing base. We did not draw on the revolving credit facility to fund the Marathon Acquisition, other than to the extent utilized through the issuance of letters of credit. The revolving credit facility is available through December 1, 2015. See “—Liquidity and Capital Resources—Description of Our Indebtedness—Senior Secured Asset-Based Revolving Credit Facility.” |
| • | Sale-Leaseback Arrangement. Marathon sold certain real property interests, including the land underlying 135 of the SuperAmerica convenience stores associated with our retail business and SuperMom’s Bakery, to Realty Income, a third party equity real estate investment trust. In connection with the closing of the Marathon Acquisition, Realty Income leased those properties to us on a long-term basis. |
| • | Crude Oil Inventory Purchase Agreement. JPM CCC purchased substantially all of the crude oil inventory associated with operations of the refinery directly from Marathon pursuant to an inventory purchase agreement with Marathon. |
| • | Crude Oil Supply and Logistics Agreement. We entered into a five-year crude oil supply and logistics agreement with JPM CCC that expires December 2015. JPM CCC assists us in the purchase of the crude oil requirements of our refinery and provides transportation and other logistical services for delivery of the crude oil to our storage tanks at Cottage Grove, Minnesota, which are approximately two miles from our refinery. We pay the price of the crude oil (determined as of the closing price one day subsequent to the delivery date) plus certain agreed fees and expenses. We believe this crude oil supply and logistics agreement significantly reduces our need to maintain crude oil inventories and allows us to take title to and price our crude oil at the refinery, as opposed to the crude oil origination point, reducing the time we are exposed to market fluctuations before the finished product output is sold. For more information, see “Business—Crude Oil Supply.” |
| • | Transition Services Agreement. Marathon agreed to provide us with administrative and support services pursuant to a transition services agreement, including finance and accounting, human resources and information systems services, as well as support services in connection with our transition from being a part of Marathon’s systems and infrastructure to having our own systems and infrastructure. We ended a substantial portion of the Marathon transition services in October 2011. For more information, see “Certain Relationships and Related Person Transactions—Transactions with Marathon.” |
77
Table of Contents
Index to Financial Statements
| Ÿ | The Marathon Acquisition has been accounted for under the purchase method of accounting for business combinations which requires that the assets acquired and liabilities assumed be adjusted to their estimated fair value at the date of the acquisition. This treatment changed the accounting basis for the assets acquired and liabilities assumed from Marathon as of December 1, 2010. |
| Ÿ | In October 2010, at our request, Marathon Petroleum initiated a crack spread derivative strategy to mitigate refining margin risk on a portion of the business’s 2011 and 2012 projected refinery production. In connection with the Marathon Acquisition, we assumed all corresponding rights and obligations for derivative instruments executed pursuant to this strategy. We incurred $246.4 million of realized and $334.5 million of unrealized losses for the nine months ended September 30, 2011 related to these derivative activities. |
This Offering and Reorganization
Our results of operations for periods subsequent to the closing of this offering may not be comparable to our results of operations for periods prior to the closing of this offering as a result of certain aspects of this offering and the reorganization as described in “Organizational Structure,” including the following:
| Ÿ | NTI LLC has historically not been subject to U.S. federal and certain state income taxes. After consummation of this offering, Northern Tier Energy, Inc. will become subject to U.S. federal, state and local income tax with respect to its allocable share of any taxable income of NTI LLC and taxed at the prevailing corporate tax rates. |
| Ÿ | Pursuant to the Tax Receivable Agreement, we generally will be required to pay certain of the Existing Owners 85% of the applicable cash savings, if any, in U.S. federal and state income tax that we actually realize as a result of (i) the increase in tax basis in NTI LLC’s assets that arose from the Marathon Acquisition, (ii) the basis increase resulting from the distribution of offering proceeds to the Existing Owners, (iii) the basis increases resulting from the exchanges of NTI LLC Units (along with the corresponding shares of our Class B common stock) for shares of our Class A common stock, (iv) additional deductions allocated to us pursuant to Section 704(c) of the Code, to reflect the difference between the fair market value and the adjusted tax basis of NTI LLC’s assets as of the date of this offering, (v) imputed interest deemed to be paid by us as a result of, and additional tax basis arising from, payments under the Tax Receivable Agreement, and (vi) any net operating losses available to us as a result of the Existing Owner Exchange. In addition, the Tax Receivable Agreement will provide for interest earned from the due date (without extensions) of the corresponding tax return to the date of payment specified by the Tax Receivable Agreement. We will record 85% of the estimated tax benefit as an increase to amounts payable under the Tax Receivable Agreement as a liability. See “Certain Relationships and Related Person Transactions—Tax Receivable Agreement.” |
| Ÿ | We expect that our general and administrative expenses will increase as a result of this offering. Specifically, we will incur certain expenses related to being a publicly traded company, including Securities Exchange Act of 1934, as amended (the “Exchange Act”) reporting expenses; expenses associated with Sarbanes-Oxley Act compliance; expenses associated with listing on the NYSE; independent auditors fees, legal fees, investor relations expenses, registrar and transfer agent fees, director and officer liability insurance costs; and director compensation. |
78
Table of Contents
Index to Financial Statements
Major Influences on Results of Operations
Refining
Our earnings and cash flows from our refining business segment are primarily affected by the relationship between refined product prices and the prices for crude oil and other feedstocks. Refining is primarily a margin-based business, and in order to increase profitability, it is important for the refinery to maximize the yields of high value finished products and to minimize the costs of feedstock and operating expenses. Feedstocks are petroleum products, such as crude oil and natural gas liquids that are processed and blended into refined products. The cost to acquire feedstocks and the price for which refined products are ultimately sold depend on several factors, many of which are beyond our control, including the supply of, and demand for, crude oil, gasoline and other refined products, which depend on changes in domestic and foreign economies, weather conditions, domestic and foreign political affairs, production levels, availability of and access to transportation infrastructure, the availability of imports, the marketing of competitive fuel, and the extent of government regulation, among other factors.
Feedstock and refined product prices are also affected by other factors, such as product pipeline capacity, local market conditions and the operating levels of competing refineries. Crude oil costs and the prices of refined products have historically been subject to wide fluctuations. An expansion or upgrade of our competitors’ facilities, price volatility, international political and economic developments and other factors beyond our control are likely to continue to play an important role in refining industry economics. These factors can impact, among other things, the level of inventories in the market, resulting in price volatility and a negative impact on product margins. Moreover, the refining industry typically experiences seasonal fluctuations in demand for refined products, such as increases in the demand for gasoline during the summer driving season and for home heating oil during the winter, primarily in the Northeast. In addition to current market conditions, there are long-term factors that may impact the demand for refined products. These factors include mandated renewable fuels standards, proposed climate change laws and regulations, and increased mileage standards for vehicles.
In order to assess our operating performance, we compare our refinery gross product margin against an industry refining margin benchmark. The industry refining margin benchmark we use is referred to as Group 3 3:2:1 crack spread, which is calculated by assuming that three barrels of benchmark light sweet crude oil is converted into two barrels of reformulated gasoline and one barrel of ultra low sulfur diesel. Because we calculate the benchmark refining margin using the market value of PADD II Group 3 conventional gasoline and ultra low sulfur diesel against the market value of NYMEX WTI, we refer to the benchmark as the Group 3 3:2:1 crack spread. The Group 3 3:2:1 crack spread is expressed in dollars per barrel and is a proxy for the per barrel margin that a sweet crude oil refinery would earn assuming it produced and sold at PADD II Group 3 prices the benchmark production of gasoline and ultra low sulfur diesel.
Our direct operating expense structure is also important to our profitability. Major direct operating expenses include employee and contract labor, maintenance and energy. Our predominant variable direct operating cost is energy, which is comprised primarily of fuel and other utility services. The costs of fuel, principally natural gas, and other utility services, principally electricity, used by our refinery and other operations have historically been volatile.
Consistent, safe and reliable operations at our refinery are key to our financial performance and results of operations. Unplanned downtime at our refinery may result in lost margin opportunity, increased maintenance expense and a temporary increase in working capital investment and related inventory position. We seek to mitigate the financial impact of planned downtime, such as major turnaround maintenance, through a diligent planning process that takes into account the margin
79
Table of Contents
Index to Financial Statements
environment, the availability of resources to perform needed maintenance, contractual commitments, feedstock logistics and other factors. Periodically, we have planned maintenance turnarounds at our refineries, which are expensed as incurred. The refinery generally undergoes a major facility turnaround every five to six years, and the last full plant turnaround was completed in 2007. The length of the turnaround is contingent upon the scope of work to be completed. A major turnaround of either of the two main refinery units (fluid catalytic cracking unit and Alkylation unit) generally takes two to four weeks to complete, and is planned and accomplished in a manner that allows for reduced production during maintenance instead of a complete shutdown. We completed a partial turnaround in April 2011, principally to replace a catalyst in the distillate and gas oil hydrotreaters, and to conduct basic maintenance on the No. 1 crude unit. The next major turnaround is scheduled for 2013.
Because petroleum feedstocks and products are essentially commodities, we have no control over the changing market. Therefore, the lower the target inventory we are able to maintain, the lesser is the impact of commodity price volatility on our petroleum product inventory position. Our inventory of crude oil and refined products is valued at the lower of cost or market value under the LIFO cost flow assumption. For periods in which the market price declines below our LIFO cost basis, we are subject to significant fluctuations in the recorded value of our inventory and related cost of products sold. We experienced LIFO liquidations during 2008 based upon permanent decreased levels in our inventories. These LIFO liquidations resulted in decreased cost of sales and increased income from operations of $6.6 million in 2008. LIFO liquidations did not occur in 2009, in the eleven months ended November 30, 2010 or in the nine months ended September 30, 2011.
At the closing of the Marathon Acquisition, we entered into a five-year crude oil supply and logistics agreement with JPM CCC pursuant to which JPM CCC assists us in the purchase of the crude oil requirements of our refinery and provides transportation and other logistical services for delivery of the crude oil to our storage tanks in Cottage Grove, Minnesota. We pay JPM CCC the price of the crude oil (determined as of one day subsequent to the date of delivery) plus certain agreed fees and expenses. We believe this crude oil supply and logistics agreement significantly reduces our crude inventories and allows us to take title to and price our crude oil at the refinery, as opposed to the crude oil origination point, reducing the time we are exposed to market fluctuations before the finished product output is sold.
In addition, we may hedge up to half of our expected gasoline and distillate production over a one-to-two year period, on a rolling basis, with the objective of reducing the volatility of our cash flows. At the closing of the Marathon Acquisition, we entered into an agreement with J. Aron & Company that governs all cash-settled commodity transactions that we enter into with J. Aron & Company for the purpose of managing our risk with respect to the crack spread created by the purchase of crude oil for future delivery and the sale of refined products, including gasoline, diesel, jet fuel and heating fuel, for future delivery. We entered into an amendment to the agreement with J. Aron & Company in November 2011 to permit us to enter into additional hedging transactions with a different counterparty should we elect to do so. In addition, we have entered into similar agreements with other counterparties and, as market conditions permit, we have the capacity to hedge our crack spread risk with respect to significant percentages of the refinery’s projected monthly production of some or all of these refined products. Consistent with that policy, as of September 30, 2011, we had hedged approximately 22 million barrels of future gasoline and diesel production.
Our refining business experiences seasonal effects. Demand for gasoline is generally higher during the summer months than during the winter months due to seasonal increases in highway traffic. Decreased demand during the winter months can lower gasoline prices. As a result, our operating results of our refining business for the first and fourth calendar quarters are generally lower than those for the second and third calendar quarters of each year.
80
Table of Contents
Index to Financial Statements
Retail
Our earnings and cash flows from our retail business segment are primarily affected by the sales volumes and margins of gasoline and diesel sold, and by the sales and margins of merchandise sold at our convenience stores. Seasonal fluctuations in traffic also affect sales of motor fuels and merchandise in our convenience stores. As a result, the operating results of our retail segment are generally lower for the first quarter of the year. Weather conditions in our operating area also have a significant effect on our retail operating results. Customers are more likely to purchase higher profit margin items at our convenience stores, such as fast foods, fountain drinks and other beverages and more gasoline during the spring and summer months, thereby typically generating higher revenues and gross margins for us in these periods. Margins for transportation fuel sales are equal to the sales price (which includes the motor fuel taxes) less the delivered cost of the fuel and motor fuel taxes, and are measured on a cents per gallon basis. Fuel margins are impacted by local supply, demand and competition. Margins for retail merchandise sold are equal to retail merchandise sales less the delivered cost of the merchandise, net of any supplier discounts and inventory shrinkage, and are measured as a percentage of merchandise sales. Merchandise sales are impacted by convenience or location, branding and competition. Franchisees are required to pay us an initial license fee (generally, $10,000 for licensees located in Minnesota and Wisconsin and $2,000 for licensees located in South Dakota) and a royalty fee for all products and merchandise sold at the convenience store, including motor fuel and diesel. The initial term of the license is generally 10 years, which is renewable by the licensee for a renewal term of 10 years, subject to the licensee satisfying certain conditions. The license agreements also require that, if a franchise store is located within our distribution area, then the franchise store must purchase a high minimum percentage (often 85% to 100%) of its motor fuel supply, including gasoline and distillate, from us. However, if a franchise store is not located within our distribution area, then the franchise store is not required to purchase any portion of its motor fuel supply from us. As of September 30, 2011, 31 of the 67 existing franchise stores are located within our distribution area and, thus, are required to purchase a high minimum percentage of their motor fuel supply from us.
Results of Operations
We operate our business in two segments: the refining segment and the retail segment. Each of these segments is organized and managed based upon the nature of the products and services they offer. Through the refining segment, we operate the St. Paul Park, Minnesota, refinery, terminal and related assets, and through the retail segment, we operate 166 convenience stores primarily in Minnesota. The retail segment also includes the operations of SuperMom’s Bakery and SuperAmerica Franchising LLC, our wholly owned subsidiary (“SAF”), through which we conduct our franchising operations.
In this “Results of Operations” section, we first review our business on a combined and consolidated basis, and then separately review the results of operations of each of the refining segment and the retail segment. Detailed explanations of the period over period changes in our results of operations are contained in the discussion of individual segments. For partial year periods that do not have a corresponding period of the same duration, comparisons are made on a run rate basis comparing the partial period results with the prior year’s average monthly results for the corresponding period of time.
We refer to our financial statement line items in the explanation of our period over period changes in results of operations. Below are general definitions of what those line items include and represent.
Revenue. Revenue primarily includes the sale of refined products in our refining segment and sales of fuel and merchandise to retail consumers in our retail segment. All sales are recorded net of
81
Table of Contents
Index to Financial Statements
customer discounts and rebates and inclusive of federal and state excise taxes. Refining revenue includes inter-segment sales of refined products to the retail segment. For purposes of presenting sales on a combined basis, such intersegment transactions are eliminated. Retail revenue primarily includes sales of fuel and merchandise to customers inclusive of related excise taxes and net of any applicable discounts. Also included in retail revenue is royalty income, revenues from car wash operations and SuperMom’s Bakery sales to third parties.
Cost of sales. Refining cost of sales primarily include costs of crude and refinery feedstocks purchased, ethanol and other refined products purchased and excise taxes paid to various government authorities. Retail cost of sales consists of cost of fuel, merchandise and other products, costs of sales for SuperMom’s Bakery merchandise sales to third parties and excise taxes paid to various government authorities. Retail cost of sales includes intersegment purchases of refined products from the refining segment. For purposes of presenting cost of sales on a combined basis, such inter-segment transactions are eliminated.
Direct operating expenses. Direct operating expenses include the operating expenses of the refinery and costs of operating the convenience stores and the bakery. Refining direct operating expenses primarily include direct costs of labor, maintenance materials and services, chemicals and catalysts, utilities and other direct operating expenses of the refinery. Retail direct operating expenses consist primarily of salaries, labor and benefits, bankcard processing fees, contracted services, repair and maintenance, utilities and rent expense.
Turnaround and related expenses. Turnaround and related expenses represent the costs of required major maintenance projects on refinery processing units. A turnaround is a standard industry operation to refurbish and maintain a refinery and usually requires the shutdown and inspection of major processing units. Processing units require major maintenance every five to six years.
Depreciation and amortization. Depreciation and amortization represents an allocation to expense within the statement of operations of the carrying value of capital and intangible assets. The value is allocated based on the straight-line method over the estimated useful life of the related asset.
Selling, general and administrative. Selling, general and administrative expenses primarily include corporate costs, administrative expenses, shared service costs and marketing expenses.
Formation costs. Formation costs represent costs incurred in the creation of NTI LLC and its subsidiaries. No such costs existed for periods prior to the Marathon Acquisition.
Contingent consideration (income) expense. Contingent consideration income (expense) relates to changes in the estimated fair value of our margin support and earn-out arrangements with Marathon. No such arrangement existed for periods prior to December 1, 2010.
Other income (expense), net. Other income (expense), net primarily represents income (expense) from our equity method investment in the Minnesota Pipe Line Company and dividend income from our cost method investment in MPL Investments.
Gain (loss) from derivative activities. Gain (loss) from derivative activities primarily includes losses incurred on our crack spread derivative strategy initiated in October 2010 in anticipation of the Marathon Acquisition to mitigate market price risk. Included in gain (loss) from derivative activities are realized gains or losses related to settled contracts during the period and unrealized gains or losses on outstanding derivatives to partially hedge the crack spread margins for our refining business through 2012. The offsetting benefits related to these unrealized losses should be realized over future periods as improved crack spreads are realized.
82
Table of Contents
Index to Financial Statements
Bargain purchase gain. Bargain purchase gain represents the excess of the estimated fair value of the net assets acquired in the Marathon Acquisition over the total purchase consideration.
Interest expense, net. Interest expense, net subsequent to December 1, 2010 relates primarily to interest incurred on the senior secured notes that were issued to partially fund the Marathon Acquisition as well as commitment fees and interest on our revolving credit facility and the amortization of deferred financing costs.
The historical financial data presented below are not necessarily indicative of the results to be expected for any future period. The historical financial data for the years ended December 31, 2009 and 2008 and for the eleven months ended November 30, 2010 do not reflect the consummation of the Marathon Acquisition or our capital structure following the Marathon Acquisition. See “—Predecessor Carve-Out Financial Statements.”
Consolidated and Combined Financial Data
| Predecessor | Successor | Predecessor | Successor | |||||||||||||||||||||||||||
| Year Ended December 31, |
Eleven Months Ended November 30, 2010 |
August 10, 2010 (inception date) to December 31, 2010 |
Nine
Months Ended September 30, 2010 |
Nine
Months Ended September 30, 2011 |
||||||||||||||||||||||||||
| 2008 | 2009 | |||||||||||||||||||||||||||||
| (In millions) | ||||||||||||||||||||||||||||||
| Revenue |
$ | 4,122.4 | $ | 2,940.5 | $ | 3,195.2 | $ | 344.9 | $ | 2,582.3 | $ | 3,192.0 | ||||||||||||||||||
| Cost, expenses and other: |
||||||||||||||||||||||||||||||
| Cost of sales |
3,659.0 | 2,507.9 | 2,697.9 | 307.5 | 2,193.8 | 2,573.8 | ||||||||||||||||||||||||
| Direct operating expenses |
252.7 | 238.3 | 227.0 | 21.4 | 183.4 | 194.8 | ||||||||||||||||||||||||
| Turnaround and related expenses |
3.7 | 0.6 | 9.5 | — | 8.2 | 22.5 | ||||||||||||||||||||||||
| Depreciation and amortization |
39.2 | 40.2 | 37.3 | 2.2 | 30.0 | 22.3 | ||||||||||||||||||||||||
| Selling, general and administrative |
67.7 | 64.7 | 59.6 | 6.4 | 47.0 | 65.4 | ||||||||||||||||||||||||
| Formation costs |
— | — | — | 24.3 | — | 6.1 | ||||||||||||||||||||||||
| Contingent consideration income |
— | — | — | — | — | (37.6 | ) | |||||||||||||||||||||||
| Other (income) expense, net |
1.2 | (1.1 | ) | (5.4 | ) | 0.1 | (4.3 | ) | (2.4 | ) | ||||||||||||||||||||
|
|
|
|
|
|
|
|
|
|
|
|
|
|||||||||||||||||||
| Operating income |
98.9 | 89.9 | 169.3 | (17.0 | ) | 124.2 | 347.1 | |||||||||||||||||||||||
| Realized losses from derivative activities |
— | — | — | — | — | (246.4 | ) | |||||||||||||||||||||||
| Unrealized losses from derivative activities |
— | — | (40.9 | ) | (27.1 | ) | — | (334.5 | ) | |||||||||||||||||||||
| Bargain purchase gain |
— | — | — | 51.4 | — | — | ||||||||||||||||||||||||
| Interest expense, net |
(0.5 | ) | (0.4 | ) | (0.3 | ) | (3.2 | ) | (0.2 | ) | (30.6 | ) | ||||||||||||||||||
|
|
|
|
|
|
|
|
|
|
|
|
|
|||||||||||||||||||
| Earnings (loss) before income taxes |
98.4 | 89.5 | 128.1 | 4.1 | 124.0 | (264.4 | ) | |||||||||||||||||||||||
| Income tax provision |
(39.8 | ) | (34.8 | ) | (67.1 | ) | — | (49.2 | ) | — | ||||||||||||||||||||
|
|
|
|
|
|
|
|
|
|
|
|
|
|||||||||||||||||||
| Net earnings (loss) |
58.6 | 54.7 | 61.0 | 4.1 | 74.8 | (264.4 | ) | |||||||||||||||||||||||
| Less: net earnings attributable to noncontrolling preferred interest |
— | — | — | 0.6 | — | 5.5 | ||||||||||||||||||||||||
|
|
|
|
|
|
|
|
|
|
|
|
|
|||||||||||||||||||
| Net earnings (loss) available to members |
$ | 58.6 | $ | 54.7 | $ | 61.0 | $ | 3.5 | $ | 74.8 | $ | (269.9 | ) | |||||||||||||||||
|
|
|
|
|
|
|
|
|
|
|
|
|
|||||||||||||||||||
83
Table of Contents
Index to Financial Statements
Nine Months Ended September 30, 2011 (Successor) Compared to Nine Months Ended September 30, 2010 (Predecessor)
Revenue. Revenue for the nine months ended September 30, 2011 was $3,192.0 million compared to $2,582.3 million for the nine months ended September 30, 2010, an increase of $609.7 million, or 23.6%. Refining segment revenue increased 26.4% for the nine months ended September 30, 2011 compared to the same period in 2010, while retail segment revenue increased by 18.6%. The refining segment benefited from higher average prices across our principal products driven primarily by increased market prices for crude oil. Retail revenue also benefited from higher average fuel prices that were partially offset by lower sales volumes. Excise taxes included in revenue totaled $181.5 million and $226.3 million for the nine months ended September 30, 2011 and 2010, respectively.
Cost of sales. Cost of sales totaled $2,573.8 million for the nine months ended September 30, 2011 compared to $2,193.8 million for the nine months ended September 30, 2010, an increase of $380.0 million, or 17.3%, due primarily to higher priced crude oil and other feedstock costs. Cost of sales as a percentage of revenue decreased from 85.0% for the nine months ended September 30, 2010 to 80.6% for the nine months ended September 30, 2011 due to the increased revenues resulting from higher average prices. Excise taxes included in cost of sales were $181.5 million and $226.3 million for the nine months ended September 30, 2010 and 2011, respectively.
Direct operating expenses. Direct operating expenses totaled $194.8 million for the nine months ended September 30, 2011 compared to $183.4 million for the nine months ended September 30, 2010, an increase of $11.4 million, or 6.2%, due primarily to higher rent costs in our retail segment as a result of the sale-leaseback arrangement entered into in connection with the Marathon Acquisition. Credit card processing fees in our retail segment also increased as a result of the higher revenues. On a pro forma basis for the Marathon Acquisition, direct operating expenses would have been $197.1 million for the nine months ended September 30, 2010.
Turnaround and related expenses. Turnaround and related expenses totaled $22.5 million for the nine months ended September 30, 2011 compared to $8.2 million for the nine months ended September 30, 2010, an increase of $14.3 million, primarily due to the timing and scope of the scheduled turnaround projects undertaken in the respective periods. The 2011 period included a scheduled partial turnaround at the refinery during the month of April principally to replace catalyst in the distillate and gas oil hydrotreaters and to conduct basic maintenance on the No. 1 crude unit.
Depreciation and amortization. Depreciation and amortization was $22.3 million for the nine months ended September 30, 2011 compared to $30.0 million for the nine months ended September 30, 2010, a decrease of $7.7 million, or 25.7%. On a pro forma basis for the Marathon Acquisition, depreciation would have been $22.5 million for the nine months ended September 30, 2010. As part of the Marathon Acquisition, the real estate for the majority of our convenience stores was sold and as a result we are no longer depreciating these convenience store buildings. Additionally, as a result of purchase accounting, the book value of our refinery was increased and its estimated useful life was extended. The impact of these purchase accounting adjustments is a net decrease in overall refinery depreciation.
Selling, general and administrative expenses. Selling, general and administrative expenses were $65.4 million for the nine months ended September 30, 2011 compared to $47.0 million for the nine months ended September 30, 2010. This increase of $18.4 million, or 39.1%, reflects higher administrative costs resulting from operating the Marathon Assets.
Formation costs. Formation costs for the nine months ended September 30, 2011 were $6.1 million, all attributable to the Marathon Acquisition. Such costs were not incurred in the prior comparable period.
84
Table of Contents
Index to Financial Statements
Contingent consideration income. Contingent consideration income was $37.6 million for the nine months ended September 30, 2011, which is due to updated financial performance estimates for the period of performance under the margin support and earn-out agreements.
Other income, net. Other income, net was $2.4 million for the nine months ended September 30, 2011 compared to $4.3 million for the nine months ended September 30, 2010. This change is driven by changes in equity income from our investment in the Minnesota Pipe Line Company.
Loss from derivative activities. For the nine months ended September 30, 2011, we had realized losses of $246.4 million related to settled contracts. Offsetting benefits related to these losses were recognized through improved operating margins. We also incurred unrealized losses of $334.5 million for the nine months ended September 30, 2011 on outstanding derivatives entered into in 2010 to partially hedge the crack spread margins for our refining business through 2012. The offsetting benefits related to these unrealized losses should be realized over future periods as improved operating margins are realized. No such derivative activity existed for the nine months ended September 30, 2010.
Interest expense, net. Interest expense, net was $30.6 million for the nine months ended September 30, 2011 compared to $0.2 million for the nine months ended September 30, 2010, an increase of $30.4 million. This increase was primarily attributable to the senior secured notes issued to partially fund the Marathon Acquisition as well as commitment fees and interest on our revolving credit facility and the amortization of deferred financing costs. On a pro forma basis for the Marathon Acquisition, interest expense would have been $29.1 million for the nine months ended September 30, 2010. See “—Liquidity and Capital Resources—Description of Our Indebtedness –Senior Secured Asset-Based Revolving Credit Facility” and “—Liquidity and Capital Resources—Description of Our Indebtedness—Senior Secured Notes.”
Income tax provision. We operated as a pass-through entity for federal tax purposes for the nine months ended September 30, 2011. Income tax expense was less than $0.1 million for the nine months ended September 30, 2011 compared to $49.2 million for the nine months ended September 30, 2010. The effective tax rate was 39.7% for the nine months ended September 30, 2010, which is not comparable to the nine months ended September 30, 2011. From the date of the Marathon Acquisition, only state taxes have been recognized and no federal provision was recognized.
Net (loss) earnings. Our net loss was $264.4 million for the nine months ended September 30, 2011 compared to net earnings of $74.8 million for the nine months ended September 30, 2010. This variance was primarily attributable to losses on derivative activities of $580.9 million and an increase in interest expense of $30.4 million, partially offset by increased operating income of $222.9 million and lower income taxes of $49.2 million.
2010 Successor Period from August 10, 2010 (inception date) through December 31, 2010
NTI LLC was formed on August 10, 2010 and entered into certain agreements with Marathon on October 6, 2010 to acquire the Marathon Assets. At the closing of the Marathon Acquisition on December 1, 2010, NTI LLC acquired the Marathon Assets. NTI LLC had no operating activities between its August 10, 2010 inception date and the closing date of the Marathon Acquisition, although it incurred various transaction and formation costs which have been included in the 2010 Successor Period.
The discussion below presents a comparison of the 2010 Successor Period and 2009 monthly average run rates, and does not seek to compare the 2010 Successor Period to the equivalent period in the prior year.
85
Table of Contents
Index to Financial Statements
Revenue for the 2010 Successor Period was $344.9 million. Revenue for the 2010 Successor Period was favorably impacted by price increases across both the refining and retail segments. Refining and retail segment revenues increased 48.1% and 9.4% compared to 2009 average monthly run rate revenues. Cost of sales for the 2010 Successor Period was $307.5 million. Excise taxes included in both revenue and cost of sales were $25.1 million for the 2010 Successor Period. Cost of sales as a percentage of revenue was 89.2% for the 2010 Successor Period compared to 85.3% for 2009.
The 2010 Successor Period included two significant non-recurring items: formation costs of $24.3 million and a bargain purchase gain of $51.4 million, both related to the Marathon Acquisition. Additionally, during the 2010 Successor Period, we incurred unrealized losses of $27.1 million on outstanding derivatives entered into in 2010 to partially hedge the crack spread margins for our refining business for 2011 through 2012. The offsetting benefits related to these unrealized losses will be realized over future periods as the improved crack spread margins are realized.
Our net earnings were $4.1 million for the 2010 Successor Period, compared to 2009 average monthly run rate net earnings of $4.6 million. The net earnings in the 2010 Successor Period include $24.3 million of formation costs, $27.1 million of unrealized derivative losses and a $51.4 million bargain purchase gain, all of which were related to the Marathon Acquisition and did not occur in the 2009 period.
Eleven Months Ended November 30, 2010 Compared to Year Ended December 31, 2009
Revenue. Revenue for the eleven months ended November 30, 2010 was $3,195.2 million compared to $2,940.5 million for the year ended December 31, 2009, an 18.5% increase versus the average monthly run rate for 2009. Refining and retail segment revenue increased to $2,799.8 million and $1,206.8 million, respectively, which represent increases of 20.7% and 16.6%, respectively, versus the 2009 average monthly run rate levels. These increases were primarily due to increases in the market prices for refined products across the periods. Federal and state excise taxes included in revenue totaled $271.8 million and $289.6 million for the eleven months ended November 30, 2010 and year ended December 31, 2009, respectively.
Cost of sales. Cost of sales for the eleven months ended November 30, 2010 was $2,697.9 million compared to $2,507.9 million for the year ended December 31, 2009, a 17.4% increase versus the average monthly run rate for 2009. This increase is primarily due to increased market prices for crude oil in the 2010 period. Cost of sales as a percentage of revenue was 84.4% and 85.3% for the eleven months ended November 30, 2010 and year ended December 31, 2009, respectively. Excise taxes included in cost of sales were $271.8 million and $289.6 million for the eleven months ended November 30, 2010 and year ended December 31, 2009, respectively.
Direct operating expenses. Direct operating expenses for the eleven months ended November 30, 2010 were $227.0 million compared to $238.3 million for the year ended December 31, 2009, a 3.9% increase versus the 2009 average monthly run rate. The increase was primarily due to higher utility costs in the refining segment and higher credit card fees in retail segment.
Turnaround and related expenses. Turnaround and related expenses totaled $9.5 million for the eleven months ended November 30, 2010 compared to $0.6 million for the year ended December 31, 2009. This increase is primarily due to a scheduled partial turnaround at the refinery during September and October 2010.
Depreciation and amortization. Depreciation and amortization was $37.3 million for the eleven months ended November 30, 2010 and $40.2 million for the year ended December 31, 2009, a 1.2%
86
Table of Contents
Index to Financial Statements
increase versus the 2009 average monthly run rate. The increase versus the prior year relates primarily to the on-going investment in our refinery infrastructure.
Selling, general and administrative expenses. Selling, general and administrative expenses for the eleven months ended November 30, 2010 were $59.6 million compared to $64.7 million for the year ended December 31, 2009, a 0.5% increase versus the 2009 average monthly run rate.
Other income, net. Other income, net was $5.4 million for the eleven months ended November 30, 2010 compared to other income, net of $1.1 million for the year ended December 31, 2009. This improvement is due to higher equity income from our investment in the Minnesota Pipe Line Company.
Loss from derivative activities. We incurred unrealized losses of $40.9 million for the eleven months ended November 30, 2010 on outstanding derivatives entered into during 2010. The offsetting benefits relating to these unrealized losses should be realized over future periods as improved operating margins are realized. No such derivative activity existed for the year ended December 31, 2009.
Interest expense, net. Interest expense, net was $0.3 million for the eleven months ended November 30, 2010 and $0.4 million for the year ended December 31, 2009.
Income tax provision. Income tax expense was $67.1 million for the eleven months ended November 30, 2010 and $34.8 million for the year ended December 31, 2009. The effective tax rate was 52.4% for the eleven months ended November 30, 2010 and 38.9% for the year ended December 31, 2009. The effective rate was impacted primarily by the establishment of a valuation allowance against capital losses incurred on derivative activities.
Net earnings. Our net earnings were $61.0 million for the eleven months ended November 30, 2010 and $54.7 million for the year ended December 31, 2009. The increase in net earnings is primarily due to the improved gross product margin in our refining business in the 2010 period. Refinery gross product margin per barrel of throughput were $12.86 for the eleven months ended November 30, 2010 and $9.36 for the year ended December 31, 2009.
Year Ended December 31, 2009 Compared to Year Ended December 31, 2008
Revenue. Revenue for the year ended December 31, 2009 was $2,940.5 million compared to $4,122.4 million for the year ended December 31, 2008, a decrease of 28.7%. Refining and retail segment revenues decreased 32.0% and 19.5%, respectively, compared to the prior year levels. The decrease was primarily related to reductions in the market prices of refined products compared to the prior year. Federal and state excise taxes included in revenue totaled $289.6 million and $271.6 million for the years ended December 31, 2009 and 2008, respectively.
Cost of sales. Cost of sales for the year ended December 31, 2009 was $2,507.9 million compared to $3,659.0 million for the year ended December 31, 2008, a decrease of $1,151.1 million, or 31.5%. This decrease was primarily due to a decrease in raw material costs driven principally by lower prices of crude oil. Cost of sales as a percentage of revenue was 85.3% and 88.8% for 2009 and 2008, respectively. Excise taxes included in cost of sales were $289.6 million and $271.6 million for the years ended December 31, 2009 and 2008, respectively.
Direct operating expenses. Direct operating expenses for the year ended December 31, 2009 were $238.3 million compared to $252.7 million for the year ended December 31, 2008, a decrease of $14.4 million, or 5.7%. The decrease was primarily due to lower utility costs in our refining segment and lower credit card fees in our retail segment during 2009.
87
Table of Contents
Index to Financial Statements
Turnaround and related expenses. Turnaround and related expenses totaled $0.6 million for the year ended December 31, 2009 compared to $3.7 million for the year ended December 31, 2008, a decrease of $3.1 million. This decrease is primarily due to the timing and scope of the scheduled turnaround projects undertaken in the respective periods.
Depreciation and amortization. Depreciation and amortization was $40.2 million and $39.2 million for years ended December 31, 2009 and 2008, respectively, an increase of $1.0 million, or 2.6%, related primarily to the on-going investment in our refinery infrastructure.
Selling, general and administrative expenses. Selling, general and administrative expenses for the years ended December 31, 2009 and 2008 were $64.7 million and $67.7 respectively, a 4.4% decrease related primarily to higher administrative expenses at our refinery.
Other income, net. Other income, net was $1.1 million and an expense of $1.2 million for the years ended December 31, 2009 and 2008, respectively. This improvement is due to higher equity income from our investment in the Minnesota Pipe Line Company.
Interest expense, net. Interest expense, net was $0.4 million and $0.5 million for the years ended 2009 and 2008, respectively.
Income tax provision. Income tax expense was $34.8 million and $39.8 million for the years ended December 31, 2009 and 2008, respectively. The effective tax rate was 38.9% for 2009 and 40.4% for 2008.
Net earnings. Our net earnings were $54.7 million and $58.6 million for the years ended December 31, 2009 and 2008 respectively. Net earnings in 2009 decreased by $3.9 million, or 6.7%, compared to the prior year period, primarily as a result of reduced refining margins which more than offset lower operating costs and improved Minnesota Pipe Line Company results.
88
Table of Contents
Index to Financial Statements
Segment Financial Data
The segment financial data for the refining segment discussed below under “—Refining Segment” include intersegment sales of refined products to the retail segment. Similarly, the segment financial data for the retail segment discussed below under “—Retail Segment” contain intersegment purchases of refined products from the refining segment. For purposes of presenting our combined and consolidated results, such intersegment transactions are eliminated, as shown in the following tables.
| Successor | ||||||||||||||||
| Nine Months Ended September 30, 2011 | ||||||||||||||||
| Refinery | Retail | Other/Elim | Consolidated | |||||||||||||
| (in millions) | ||||||||||||||||
| Revenue: |
||||||||||||||||
| Sales and other revenue |
$ | 2,026.4 | $ | 1,165.6 | $ | — | $ | 3,192.0 | ||||||||
| Intersegment sales |
831.3 | — | (831.3 | ) | — | |||||||||||
|
|
|
|
|
|
|
|
|
|||||||||
| Segment revenue |
$ | 2,857.7 | $ | 1,165.6 | $ | (831.3 | ) | $ | 3,192.0 | |||||||
|
|
|
|
|
|
|
|
|
|||||||||
| Cost of sales: |
||||||||||||||||
| Cost of sales |
$ | 2,366.3 | $ | 207.5 | $ | — | $ | 2,573.8 | ||||||||
| Intersegment purchases |
— | 831.3 | (831.3 | ) | — | |||||||||||
|
|
|
|
|
|
|
|
|
|||||||||
| Segment cost of sales |
$ | 2,366.3 | $ | 1,038.8 | $ | (831.3 | ) | $ | 2,573.8 | |||||||
|
|
|
|
|
|
|
|
|
|||||||||
| Predecessor | ||||||||||||||||
| Nine Months Ended September 30, 2010 | ||||||||||||||||
| Refinery | Retail | Other/Elim | Combined | |||||||||||||
| (in millions) | ||||||||||||||||
| Revenue: |
||||||||||||||||
| Sales and other revenue |
$ | 1,599.6 | $ | 982.7 | $ | — | $ | 2,582.3 | ||||||||
| Intersegment sales |
660.6 | — | (660.6 | ) | — | |||||||||||
|
|
|
|
|
|
|
|
|
|||||||||
| Segment revenue |
$ | 2,260.2 | $ | 982.7 | $ | (660.6 | ) | $ | 2,582.3 | |||||||
|
|
|
|
|
|
|
|
|
|||||||||
| Cost of sales: |
||||||||||||||||
| Cost of sales |
$ | 1,995.8 | $ | 197.9 | $ | 0.1 | $ | 2,193.8 | ||||||||
| Intersegment purchases |
— | 660.6 | (660.6 | ) | — | |||||||||||
|
|
|
|
|
|
|
|
|
|||||||||
| Segment cost of sales |
$ | 1,995.8 | $ | 858.5 | $ | (660.5 | ) | $ | 2,193.8 | |||||||
|
|
|
|
|
|
|
|
|
|||||||||
| Successor | ||||||||||||||||
| August 10, 2010 (inception date) to December 31, 2010 | ||||||||||||||||
| Refinery | Retail | Other/Elim | Consolidated | |||||||||||||
| (in millions) | ||||||||||||||||
| Revenue: |
||||||||||||||||
| Sales and other revenue |
$ | 242.0 | $ | 102.9 | $ | — | $ | 344.9 | ||||||||
| Intersegment sales |
70.2 | — | (70.2 | ) | — | |||||||||||
|
|
|
|
|
|
|
|
|
|||||||||
| Segment revenue |
$ | 312.2 | $ | 102.9 | $ | (70.2 | ) | $ | 344.9 | |||||||
|
|
|
|
|
|
|
|
|
|||||||||
| Cost of sales: |
||||||||||||||||
| Cost of sales |
$ | 287.2 | $ | 20.2 | $ | 0.1 | $ | 307.5 | ||||||||
| Intersegment purchases |
— | 70.2 | (70.2 | ) | — | |||||||||||
|
|
|
|
|
|
|
|
|
|||||||||
| Segment cost of sales |
$ | 287.2 | $ | 90.4 | $ | (70.1 | ) | $ | 307.5 | |||||||
|
|
|
|
|
|
|
|
|
|||||||||
89
Table of Contents
Index to Financial Statements
| Predecessor | ||||||||||||||||
| Eleven Months Ended November 30, 2010 | ||||||||||||||||
| Refinery | Retail | Other | Combined | |||||||||||||
| (in millions) | ||||||||||||||||
| Revenue: |
||||||||||||||||
| Sales and other revenue |
$ | 1,988.4 | $ | 1,206.8 | $ | — | $ | 3,195.2 | ||||||||
| Intersegment sales |
811.4 | — | (811.4 | ) | — | |||||||||||
|
|
|
|
|
|
|
|
|
|||||||||
| Segment revenue |
$ | 2,799.8 | $ | 1,206.8 | $ | (811.4 | ) | $ | 3,195.2 | |||||||
|
|
|
|
|
|
|
|
|
|||||||||
| Cost of sales: |
||||||||||||||||
| Cost of sales |
$ | 2,455.9 | $ | 242.0 | $ | — | $ | 2,697.9 | ||||||||
| Intersegment purchases |
— | 811.4 | (811.4 | ) | — | |||||||||||
|
|
|
|
|
|
|
|
|
|||||||||
| Segment cost of sales |
$ | 2,455.9 | $ | 1,053.4 | $ | (811.4 | ) | $ | 2,697.9 | |||||||
|
|
|
|
|
|
|
|
|
|||||||||
| Predecessor | ||||||||||||||||
| Year Ended December 31, 2009 | ||||||||||||||||
| Refinery | Retail | Other | Combined | |||||||||||||
| (in millions) | ||||||||||||||||
| Revenue: |
||||||||||||||||
| Sales and other revenue |
$ | 1,811.3 | $ | 1,129.2 | $ | — | $ | 2,940.5 | ||||||||
| Intersegment sales |
719.4 | — | (719.4 | ) | — | |||||||||||
|
|
|
|
|
|
|
|
|
|||||||||
| Segment revenue |
$ | 2,530.7 | $ | 1,129.2 | $ | (719.4 | ) | $ | 2,940.5 | |||||||
|
|
|
|
|
|
|
|
|
|||||||||
| Cost of sales: |
||||||||||||||||
| Cost of sales |
$ | 2,252.1 | $ | 255.8 | $ | — | $ | 2,507.9 | ||||||||
| Intersegment purchases |
— | 719.4 | (719.4 | ) | — | |||||||||||
|
|
|
|
|
|
|
|
|
|||||||||
| Segment cost of sales |
$ | 2,252.1 | $ | 975.2 | $ | (719.4 | ) | $ | 2,507.9 | |||||||
|
|
|
|
|
|
|
|
|
|||||||||
| Predecessor | ||||||||||||||||
| Year Ended December 31, 2008 | ||||||||||||||||
| Refinery | Retail | Other | Combined | |||||||||||||
| (in millions) | ||||||||||||||||
| Revenue: |
||||||||||||||||
| Sales and other revenue |
$ | 2,719.7 | $ | 1,402.7 | $ | — | $ | 4,122.4 | ||||||||
| Intersegment sales |
999.5 | — | (999.5 | ) | — | |||||||||||
|
|
|
|
|
|
|
|
|
|||||||||
| Segment revenue |
$ | 3,719.2 | $ | 1,402.7 | $ | (999.5 | ) | $ | 4,122.4 | |||||||
|
|
|
|
|
|
|
|
|
|||||||||
| Cost of sales: |
||||||||||||||||
| Cost of sales |
$ | 3,417.1 | $ | 241.9 | $ | — | $ | 3,659.0 | ||||||||
| Intersegment purchases |
— | 999.5 | (999.5 | ) | — | |||||||||||
|
|
|
|
|
|
|
|
|
|||||||||
| Segment cost of sales |
$ | 3,417.1 | $ | 1,241.4 | $ | (999.5 | ) | $ | 3,659.0 | |||||||
|
|
|
|
|
|
|
|
|
|||||||||
90
Table of Contents
Index to Financial Statements
Refining Segment
| Predecessor | Successor | Predecessor | Successor | |||||||||||||||||||||||||
| Year Ended December 31, |
Eleven Months Ended November 31, 2010 |
August 10, 2010 (inception date) to December 31, 2010 |
Nine Months Ended September 30, 2010 |
Nine Months Ended September 30, 2011 |
||||||||||||||||||||||||
| 2008 | 2009 | |||||||||||||||||||||||||||
| (dollars in millions, except per barrel data) | ||||||||||||||||||||||||||||
| Revenue |
$ | 3,719.2 | $ | 2,530.7 | $ | 2,799.8 | $ | 312.2 | $ | 2,260.2 | $ | 2,857.7 | ||||||||||||||||
| Cost, expenses and other: |
||||||||||||||||||||||||||||
| Cost of sales |
3,417.1 | 2,252.1 | 2,455.9 | 287.2 | 1,995.8 | 2,366.3 | ||||||||||||||||||||||
| Direct operating expenses |
147.5 | 138.3 | 132.2 | 11.2 | 106.5 | 96.4 | ||||||||||||||||||||||
| Turnaround and related expenses |
3.7 | 0.6 | 9.5 | 0.0 | 8.2 | 22.5 | ||||||||||||||||||||||
| Depreciation and amortization |
24.4 | 26.0 | 24.9 | 1.7 | 19.9 | 16.0 | ||||||||||||||||||||||
| Selling, general and administrative |
47.6 | 44.2 | 40.0 | 3.1 | 31.2 | 30.4 | ||||||||||||||||||||||
| Other (income) expense, net |
1.2 | (1.1 | ) | (5.5 | ) | (0.1 | ) | (4.3 | ) | (3.9 | ) | |||||||||||||||||
|
|
|
|
|
|
|
|
|
|
|
|
|
|||||||||||||||||
| Operating income |
$ | 77.7 | $ | 70.6 | $ | 142.8 | $ | 9.1 | $ | 102.9 | $ | 330.0 | ||||||||||||||||
|
|
|
|
|
|
|
|
|
|
|
|
|
|||||||||||||||||
| Key operating statistics: |
||||||||||||||||||||||||||||
| Total refinery production (bpd)(1) |
81,525 | 82,126 | 80,958 | 81,853 | 80,043 | 81,173 | ||||||||||||||||||||||
| Total refinery throughput (bpd) |
80,792 | 81,563 | 80,066 | 81,136 | 79,246 | 80,694 | ||||||||||||||||||||||
| Refined products sold (bpd)(2) |
87,229 | 87,572 | 86,682 | 95,122 | 86,273 | 85,170 | ||||||||||||||||||||||
| Per barrel of throughput: |
||||||||||||||||||||||||||||
| Refinery gross product margin(3) |
$ | 10.22 | $ | 9.36 | $ | 12.86 | $ | 9.94 | $ |
12.22 |
|
$ | 22.31 | |||||||||||||||
| Direct operating expenses(3)(4) |
$ | 4.99 | $ | 4.65 | $ | 4.94 | $ | 4.45 | $ |
4.92 |
|
$ | 4.38 | |||||||||||||||
| Per barrel of refined products sold: |
||||||||||||||||||||||||||||
| Refinery gross product margin(3) |
$ | 9.46 | $ | 8.72 | $ | 11.88 | $ | 8.48 | $ | 11.23 | $ | 21.14 | ||||||||||||||||
| Direct operating expenses(3)(4) |
$ | 4.62 | $ | 4.33 | $ | 4.56 | $ | 3.80 | $ | 4.52 | $ | 4.15 | ||||||||||||||||
| Refinery product yields (bpd): |
||||||||||||||||||||||||||||
| Gasoline |
41,140 | 42,674 | 41,080 | 42,485 | 40,798 | 40,238 | ||||||||||||||||||||||
| Distillate(5) |
24,264 | 22,876 | 22,201 | 26,258 | 21,409 | 23,851 | ||||||||||||||||||||||
| Asphalt |
6,499 | 7,688 | 9,532 | 9,099 | 9,313 | 11,169 | ||||||||||||||||||||||
| Other(6) |
9,622 | 8,888 | 8,145 | 4,011 | 8,523 | 5,915 | ||||||||||||||||||||||
|
|
|
|
|
|
|
|
|
|
|
|
|
|||||||||||||||||
| Total |
81,525 | 82,126 | 80,958 | 81,853 | 80,043 | 81,173 | ||||||||||||||||||||||
|
|
|
|
|
|
|
|
|
|
|
|
|
|||||||||||||||||
| Refinery throughput (bpd): |
||||||||||||||||||||||||||||
| Crude oil |
72,806 | 74,539 | 74,095 | 74,649 | 73,381 | 76,829 | ||||||||||||||||||||||
| Other feedstocks(7) |
7,986 | 7,024 | 5,971 | 6,487 | 5,865 | 3,865 | ||||||||||||||||||||||
|
|
|
|
|
|
|
|
|
|
|
|
|
|||||||||||||||||
| Total |
80,792 | 81,563 | 80,066 | 81,136 | 79,246 | 80,694 | ||||||||||||||||||||||
|
|
|
|
|
|
|
|
|
|
|
|
|
|||||||||||||||||
| Market Statistics: |
||||||||||||||||||||||||||||
| Crude Oil Average Pricing: |
||||||||||||||||||||||||||||
| West Texas Intermediate ($/barrel) |
$ | 99.75 | $ | 62.09 | $ | 78.69 | $ | 89.23 | $ | 77.52 | $ | 95.47 | ||||||||||||||||
| PADD II / Group 3 Average Pricing: |
||||||||||||||||||||||||||||
| Unleaded 87 Gasoline ($/barrel) |
$ | 104.14 | $ | 69.95 | $ | 86.86 | $ | 96.97 | $ | 86.44 | $ | 120.38 | ||||||||||||||||
| Ultra Low Sulfur Diesel ($/barrel) |
$ | 123.73 | $ | 70.20 | $ | 90.38 | $ | 103.38 | $ | 88.78 | $ | 126.35 | ||||||||||||||||
| (1) | Excludes fuel and coke on catalyst, which are used in our refining process. Also excludes purchased refined products. |
| (2) | Includes produced and purchased refined products, including ethanol and biodiesel. |
| (3) | Refinery gross product margin per barrel of throughput is a per barrel measurement calculated by subtracting refinery costs of sales from total refinery revenues and dividing the difference by the total throughput or total refined products sold for the respective periods presented. Refinery gross product margin per barrel of throughput is a non-GAAP performance measure that we believe is important to investors in evaluating our refinery performance as a general indication of the amount above our cost of products that we are able to sell refined products. Each of the components used in this calculation (revenues and cost of sales) can be reconciled directly to our statement of operations. Our calculation of refinery gross product margin per barrel of throughput may differ from similar calculations of other companies in our industry, thereby limiting its usefulness as a comparative measure. For a reconciliation of refinery gross product margin per barrel to refining segment revenue, the most directly comparable GAAP measure, see “Prospectus Summary—Summary Historical and Unaudited Pro Forma Condensed Consolidated Financial and Other Data.” |
| (4) | Direct operating expenses per barrel is calculated by dividing direct operating expenses by the total barrels of throughput or total barrels of refined products sold for the respective periods presented. |
| (5) | Distillate includes diesel, jet fuel and kerosene. |
| (6) | Other refinery products include propane, propylene, liquid sulfur, light cycle oil and No. 6 fuel oil, among others. None of these products, by itself, contributes significantly to overall refinery product yields. |
| (7) | Other feedstocks include gas oil, natural gasoline, normal butane and isobutane, among others. None of these feedstocks, by itself, contributes significantly to overall refinery throughput. |
91
Table of Contents
Index to Financial Statements
Nine Months Ended September 30, 2011 (Successor) Compared to Nine Months Ended September 30, 2010 (Predecessor)
Revenue. Revenue for the nine months ended September 30, 2011 was $2,857.7 million compared to $2,260.2 million for the nine months ended September 30, 2010, an increase of $597.5 million, or 26.4%. This increase was primarily due to an increase in third party sales driven by higher average prices across our principal refined products sold and an increase in intersegment sales driven by a similar increase in average prices per gallon across our principal refined products sold. Excise taxes included in revenue were $173.6 million and $219.1 million for the nine months ended September 30, 2011 and 2010, respectively.
Cost of sales. Cost of sales totaled $2,366.3 million for the nine months ended September 30, 2011 compared to $1,995.8 million for the nine months ended September 30, 2010, a $370.5 million or 18.6% increase. This increase was primarily due to an increase in raw material costs driven principally by higher prices of crude oil and other feedstocks. Cost of sales as a percentage of revenue was 82.8% and 88.3% for the nine months ended September 30, 2011 and 2010, respectively. This improvement is the result of increased revenue driven by higher average prices relative to the increased cost of crude oil. Excise taxes included in cost of sales were $173.6 million and $219.1 million for the nine months ended September 30, 2011 and 2010, respectively.
Refinery gross product margin per barrel of throughput was $22.31 for the nine months ended September 30, 2011 compared to $12.22 for the nine months ended September 30, 2010, an increase of $10.09, or 82.6%, which is primarily due to improved market conditions and favorable NYMEX WTI pricing.
Direct operating expenses. Direct operating expenses totaled $96.4 million for the nine months ended September 30, 2011 compared to $106.5 million for the nine months ended September 30, 2010, a $10.1 million or 9.5% decrease. This variance was due to a decrease in normal maintenance costs for the nine months ended September 30, 2011. These resources were directed towards turnaround and related activities for the period, as a result of the refinery turnaround occurring in April 2011.
Turnaround and related expenses. Turnaround and related expenses totaled $22.5 million for the nine months ended September 30, 2011 compared to $8.2 million for the nine months ended September 30, 2010, an increase of $14.3 million primarily due to the timing and scope of the scheduled turnaround projects undertaken in the respective periods. The 2011 period included a scheduled partial turnaround at the refinery during the month of April principally to replace catalyst in the distillate and gas oil hydrotreaters and to conduct basic maintenance on the No. 1 crude unit.
Depreciation and amortization. Depreciation and amortization was $16.0 million for the nine months ended September 30, 2011 compared to $19.9 million for the nine months ended September 30, 2010, a decrease of $3.9 million, or 19.6%. This decrease was primarily due to the impact of the refinery fair value adjustment as a result of the Marathon Acquisition as well as a change in the estimated remaining useful life of the refinery assets.
Selling, general and administrative expenses. Selling, general and administrative expenses were $30.4 million and $31.2 million for the nine months ended September 30, 2011 and 2010, respectively. This 2.6% reduction is due to lower administrative expenses at the refinery for the period.
Other income, net. Other income, net decreased by $0.4 million, or 9.3%, from $4.3 million for the nine months ended September 30, 2010 to $3.9 million for the nine months ended September 30, 2011.
92
Table of Contents
Index to Financial Statements
Operating income. Income from operations was $330.0 million for the nine months ended September 30, 2011 compared to $102.9 million for the nine months ended September 30, 2010, an increase of $227.1 million. This increase was primarily due to higher crack spreads across our principal refined products sold which helped increase our refinery gross product margin.
2010 Successor Period from August 10, 2010 (inception date) through December 31, 2010
The discussion below presents a comparison of the 2010 Successor Period and 2009 monthly average run rates, and does not seek to compare the 2010 Successor Period to the equivalent period in the prior year.
Revenue for the 2010 Successor Period was $312.2 million. The revenue for the period represents a 48.1% increase over the average monthly run rate for 2009. The increase relates primarily to an 8.6% increase in sales volumes per day and market pricing increases for refined products when compared to the average for 2009. Cost of sales totaled $287.2 million for the 2010 Successor Period. Cost of sales as a percentage of revenue was 92.0% and excise taxes included in both revenue and cost of sales were $24.3 million for the 2010 Successor Period. Refinery gross product margin per barrel of throughput was $9.94 for the 2010 Successor Period compared to $9.36 per barrel average monthly run rate for 2009.
Operating income for the 2010 Successor Period totaled $9.1 million, an improvement of $3.2 million versus the average monthly run rate of fiscal 2009. The improvement in operating income is due to the increased volumes of refined products sold and improved Group 3 3:2:1 crack spreads.
Eleven Months Ended November 30, 2010 Compared to Year Ended December 31, 2009
Revenue. Revenue for the eleven months ended November 30, 2010 was $2,799.8 million compared to $2,530.7 million for the year ended December 31, 2009. The increase of 20.7% versus the 2009 average monthly run rate is due to an increase in the market prices for refined products which more than offset a 1.0% decline in sales volume per day. Included in revenue were excise taxes of $263.0 million and $280.3 million for the eleven months ended November 30, 2010 and year ended December 31, 2009, respectively.
Cost of sales. Cost of sales for the eleven months ended November 30, 2010 was $2,455.9 million compared to $2,252.1 million for the year ended December 31, 2009. The cost of sales for the eleven months represents a 19.0% increase over the average monthly run rate for fiscal 2009. The increase relates primarily to market increases in crude oil costs when compared to the average for 2009. Cost of sales as a percentage of revenue was 87.7% and 89.0% for the eleven months ended November 30, 2010 and year ended December 31, 2009, respectively. Excise taxes included in cost of sales were $263.0 million and $280.3 million for the eleven months ended November 30, 2010 and year ended December 31, 2009, respectively.
Refinery gross product margin per barrel of throughput was $12.86 for the eleven months ended November 30, 2010 and $9.36 for the year ended December 31, 2009. The increase was primarily due to improved market crack spreads in the 2010 period.
Direct operating expenses. Direct operating expenses for the eleven months ended November 30, 2010 totaled $132.2 million compared to $138.3 million for the year ended December 31, 2009, a 4.4% increase compared to the 2009 average run monthly rate. The increase in direct operating expenses compared to the 2009 run rate is primarily due to higher utility costs during the 2010 period.
Turnaround and related expenses. Turnaround and related expenses totaled $9.5 million and $0.6 million for the eleven months ended November 30, 2010 and year ended December 31, 2009,
93
Table of Contents
Index to Financial Statements
respectively. The increase in turnaround costs versus the prior year is due to the timing, nature and extent of turnaround activities completed in the two periods. The 2010 period included a scheduled partial turnaround at the refinery during September and October 2010. The units involved in this turnaround were the No. 2 crude unit, No. 2 vacuum unit and No. 2 sulfur recovery/Shell Claus Off-Gas Treating unit.
Depreciation and amortization. Depreciation and amortization for the eleven months ended November 30, 2010 totaled $24.9 million compared to $26.0 million for the year ended December 31, 2009. The 4.4% increase versus average 2009 monthly run rate levels relates to the on going investment in the refinery infrastructure.
Selling, general and administrative expenses. Selling, general and administrative expenses totaled $40.0 million and $44.2 million for the eleven months ended November 30, 2010 and year ended December 31, 2009, respectively, representing a reduction of 1.1% compared to the average monthly run rate levels of fiscal 2009. This reduction was primarily due to reduced shared service allocations from Marathon in the 2010 period.
Other income, net. Other income, net for the eleven months ended November 30, 2010 totaled $5.5 million compared to $1.1 million for the year ended December 31, 2009. This increase is due to higher equity income from our investment in the Minnesota Pipe Line Company.
Operating income. Income from operations for the eleven months ended November 30, 2010 totaled $142.8 million compared to $70.6 million for the year ended December 31, 2009. The increase is due to the higher crack spreads and refining gross product margin and an increase in equity income from our investment in the Minnesota Pipe Line Company.
Year Ended December 31, 2009 Compared to Year Ended December 31, 2008
Revenue. Revenue for the year ended December 31, 2009 was $2,530.7 million compared to $3,719.2 million for the year ended December 31, 2008. The 32.0% reduction in refining revenue is due primarily to reductions in the market prices of refined products. Sales volume was essentially flat versus the prior year. Included in revenue were excise taxes of $280.3 million and $262.3 million for the year ended December 31, 2009 and 2008, respectively.
Cost of sales. Cost of sales for the year ended December 31, 2009 totaled $2,252.1 million compared to $3,417.1 million for the year ended December 31, 2008, a decrease of $1,165.0 million, or 34.1%. This decrease was primarily due to a decrease in raw material costs driven principally by lower prices of crude oil. Sales volume was essentially flat versus the prior year. Cost of sales as a percentage of revenue was 89.0% and 91.9% for 2009 and 2008, respectively. Excise taxes included in cost of sales were $280.3 million and $262.3 million for the years ended December 31, 2009 and 2008, respectively.
Refinery gross product margin per barrel of throughput was $9.36 for the year ended December 31, 2009 and $10.22 for the year ended December 31, 2008.
Direct operating expenses. Direct operating expenses for the year ended December 31, 2009 totaled $138.3 million compared to $147.5 million for the year ended December 31, 2008, a decrease of $9.2 million, or 6.2%. The decrease was primarily due to lower utility costs in 2009.
Turnaround and related expenses. Turnaround and related expenses totaled $0.6 million and $3.7 million for the year ended December 31, 2009 and 2008, respectively, a decrease of $3.1 million. The decrease is due to the timing and scope of the scheduled turnaround projects undertaken in the respective periods.
94
Table of Contents
Index to Financial Statements
Depreciation and amortization. Depreciation and amortization for the year ended December 31, 2009 totaled $26.0 million compared to $24.4 million for the year ended December 31, 2008, an increase of $1.6 million, or 6.6%. The increase versus the prior year relates to the on-going investment in the refinery infrastructure.
Selling, general and administrative expenses. Selling, general and administrative expenses totaled $44.2 million and $47.6 million for the year ended December 31, 2009 and 2008, respectively, a decrease of $3.4 million, or 7.1%. The reduction from the prior year levels was primarily due to lower administrative expenses at the refinery during 2009.
Other income, net. Other income, net for the year ended December 31, 2009 was $1.1 million compared to a net expense of $1.2 million for the year ended December 31, 2008. This improvement is due to higher equity income from our investment in the Minnesota Pipe Line Company.
Operating income. Income from operations the year ended December 31, 2009 totaled $70.6 million compared to $77.7 million for the year ended December 31, 2008. The reduction in refining segment operating income is due to the lower crack spreads and refining gross product margin, offsetting an increase in equity income from our investment in the Minnesota Pipe Line Company.
Retail Segment
| Predecessor | Successor | Predecessor | Successor | |||||||||||||||||||||||||
| Year Ended December 31, |
Eleven Months Ended November 30, 2010 |
August 10, 2010 (inception date) to December 31, 2010 |
Nine Months Ended September 30, 2010 |
Nine Months Ended September 30, 2011 |
||||||||||||||||||||||||
| 2008 | 2009 | |||||||||||||||||||||||||||
| (dollars in millions, except per gallon data) | ||||||||||||||||||||||||||||
| Revenue |
$ | 1,402.7 | $ | 1,129.2 | $ | 1,206.8 | $ | 102.9 | $ | 982.7 | $ | 1,165.6 | ||||||||||||||||
| Cost, expenses and other |
||||||||||||||||||||||||||||
| Cost of sales |
1,241.4 | 975.2 | 1,053.4 | 90.4 | 858.5 | 1,038.8 | ||||||||||||||||||||||
| Direct operating expenses |
105.2 | 100.0 | 94.9 | 10.2 | 76.9 | 98.4 | ||||||||||||||||||||||
| Depreciation and amortization |
14.8 | 14.2 | 12.4 | 0.5 | 10.1 | 6.0 | ||||||||||||||||||||||
| Selling, general and administrative |
20.1 | 20.5 | 19.6 | 1.3 | 15.9 | 12.8 | ||||||||||||||||||||||
|
|
|
|
|
|
|
|
|
|
|
|
|
|||||||||||||||||
| Operating income |
$ | 21.2 | $ | 19.3 | $ | 26.5 | $ | 0.5 | $ | 21.3 | $ | 9.6 | ||||||||||||||||
|
|
|
|
|
|
|
|
|
|
|
|
|
|||||||||||||||||
| Operating data: |
||||||||||||||||||||||||||||
| Company-operated stores: |
||||||||||||||||||||||||||||
| Retail fuel gallons sold (in millions) |
340.6 | 335.7 | 316.0 | 29.1 | 259.0 | 245.8 | ||||||||||||||||||||||
| Retail fuel margin per gallon(1) |
$ | 0.17 | $ | 0.14 | $ | 0.17 | $ | 0.16 | $ | 0.16 | $ | 0.20 | ||||||||||||||||
| Merchandise sales |
$ | 314.9 | $ | 328.4 | $ | 309.8 | $ | 26.8 | $ | 254.5 | $ | 253.9 | ||||||||||||||||
| Merchandise margin (%)(2) |
26.4 | % | 26.8 | % | 26.3 | % | 24.1 | % | 26.4 | % | 25.5 | % | ||||||||||||||||
| Number of stores at period end |
168 | 166 | 166 | 166 | 166 | 166 | ||||||||||||||||||||||
| Franchisee stores: |
||||||||||||||||||||||||||||
| Fuel gallons sold |
43.0 | 51.3 | 48.3 | 4.1 | 39.1 | 37.5 | ||||||||||||||||||||||
| Royalty income |
$ | 1.4 | $ | 1.6 | $ | 1.5 | $ | 0.1 | $ | 1.2 | $ | 1.2 | ||||||||||||||||
| Number of stores at period end |
64 | 68 | 67 | 67 | 67 | 67 | ||||||||||||||||||||||
| Market Statistics: |
||||||||||||||||||||||||||||
| PADD II gasoline prices ($/gallon) |
$ | 3.23 | $ | 2.34 | $ | 2.76 | $ | 3.00 | $ | 2.74 | $ | 3.60 | ||||||||||||||||
| (1) | Retail fuel margin per gallon is calculated by dividing retail fuel gross margin by the fuel gallons sold at company-operated stores. Retail fuel gross margin is a non-GAAP performance measure |
| that we believe is important to investors in evaluating our retail performance. Our calculation of |
95
Table of Contents
Index to Financial Statements
| retail fuel gross margin may differ from similar calculations of other companies in our industry, thereby limiting its usefulness as a comparative measure. For a reconciliation of retail fuel gross margin to retail segment operating income, the most directly comparable GAAP measure, see “Prospectus Summary—Summary Historical and Unaudited Pro Forma Condensed Consolidated Financial and Other Data.” |
| (2) | Merchandise margin is expressed as a percentage of merchandise sales and is calculated by subtracting costs of merchandise from merchandise sales for company-operated stores. Merchandise margin is a non-GAAP performance measure that we believe is important to investors in evaluating our retail performance. Our calculation of merchandise margin may differ from similar calculations of other companies in our industry, thereby limiting its usefulness as a comparative measure. For a reconciliation of merchandise margin to retail segment operating income, the most directly comparable GAAP measure, see “Prospectus Summary — Summary Historical and Unaudited Pro Forma Condensed Consolidated Financial and Other Data.” |
Nine Months Ended September 30, 2011 (Successor) Compared to Nine Months Ended September 30, 2010 (Predecessor)
Revenue. Revenue for the nine months ended September 30, 2011 was $1,165.6 million compared to $982.7 million for the nine months ended September 30, 2010, an increase of $182.9 million, or 18.6%. This increase was primarily due to an increase in fuel sales driven by higher average prices of the fuels sold. Partially offsetting this increase was the impact of lower fuel volumes sold and lower merchandise sales. Poor weather conditions and higher priced gasoline resulted in 5.1% less fuel gallons sold in our retail segment for the first nine months of 2011 as compared to the prior year period. Excise taxes included in revenue were $7.9 million and $7.2 million for the nine months ended September 30, 2011 and 2010, respectively.
Cost of sales. Cost of sales totaled $1,038.8 million for the nine months ended September 30, 2011 compared to $858.5 million for the nine months ended September 30, 2010, a $180.3 million increase, or 21.0%. This increase was primarily due to higher prices for purchased fuel. Cost of sales as a percentage of revenue was 89.1% and 87.4% for the nine months ended September 30, 2011 and 2010, respectively. Excise taxes included in cost of sales were $7.9 million and $7.2 million for the nine months ended September 30, 2011 and 2010, respectively. For company-operated stores, retail fuel margin per gallon was $0.20 for the nine months ended September 30, 2011 and $0.16 per gallon for the nine months ended September 30, 2010.
Direct operating expenses. Direct operating expenses totaled $98.4 million for the nine months ended September 30, 2011 compared to $76.9 million for the nine months ended September 30, 2010, a $21.5 million increase, or 28.0%. This increase was primarily due to increased credit card fees due to higher fuel prices and higher rent expense. Concurrent with the Marathon Acquisition, we entered into a sale-leaseback for the majority of our convenience stores. As a result, we have operating leases for the majority of our convenience stores, which results in higher rent expense, but lower depreciation.
Depreciation and amortization. Depreciation and amortization was $6.0 million for the nine months ended September 30, 2011 compared to $10.1 million for the nine months ended September 30, 2010, a decrease of $4.1 million, or 40.6%. As a result of the sale-leaseback transaction noted above, we have operating leases for the majority of our convenience stores which results in lower depreciation.
Selling, general and administrative expenses. Selling, general and administrative expenses were $12.8 million and $15.9 million for the nine months ended September 30, 2011 and 2010, respectively, which represents a decrease of $3.1 million, or 19.5%. This decrease is primarily the
96
Table of Contents
Index to Financial Statements
result of timing differences for certain services incurred such as advertising expenses and other administrative expenses.
Operating income. Income from operations was $9.6 million for the nine months ended September 30, 2011 compared to $21.3 million for the nine months ended September 30, 2010, a decrease of $11.7 million, or 54.9%. The decrease in the retail segment’s operating income is attributable to lower merchandise volumes, increased direct operating expenses caused by higher rents and increased credit card fees which more than offset improved fuel margins and lower depreciation and selling, general and administrative expenses.
2010 Successor Period from August 10, 2010 (inception date) through December 31, 2010
The discussion below presents a comparison of the 2010 Successor Period and 2009 monthly average run rates, and does not seek to compare the 2010 Successor Period to the equivalent period in the prior year.
Revenue for the 2010 Successor Period was $102.9 million, an increase of 9.4% compared to the monthly average run rate for fiscal 2009. The increase in the 2010 Successor Period as compared to the 2009 average monthly run rate is due to higher average market prices for fuel and a 4.0% increase in fuel volumes, which more than offset a 2.1% decline in merchandise revenue in the period. Cost of sales for the 2010 Successor Period was $90.4 million, an 11.2% increase from the 2009 average monthly run rate. Cost of sales as a percentage of revenue was 87.9% for the 2010 Successor Period compared to 86.4% for 2009. Excise taxes included in revenue and cost of sales were $0.8 million for the 2010 Successor Period. For company-operated stores, retail fuel margin per gallon was $0.16 for the 2010 Successor Period compared to $0.14 during 2009.
Income from operations for the 2010 Successor Period totaled $0.5 million compared to average monthly run rate operating income of $1.6 million for 2009.
Eleven Months Ended November 30, 2010 Compared to Year Ended December 31, 2009
Revenue. Revenue for the eleven months ended November 30, 2010 was $1,206.8 million compared to $1,129.2 million for the year ended December 31, 2009, an increase of 16.6% compared to the average monthly run rate for 2009. The increase in the 2010 period as compared to the 2009 average monthly run rate levels is due to higher average market prices for fuel, a 2.7% increase in fuel volumes and a 2.9% increase in merchandise revenue in the period. Excise taxes included in revenue totaled $8.8 million and $9.3 million for the eleven months ended November 30, 2010 and year ended December 31, 2009, respectively.
Cost of sales. Cost of sales for the eleven months ended November 30, 2010 was $1,053.4 million compared to $975.2 million for the year ended December 31, 2009, an increase of 17.8% from the 2009 average monthly run rate due to higher average fuel costs in the 2010 period. Cost of sales as a percentage of revenue was 87.3% and 86.4% for the eleven months ended November 30, 2010 and year ended December 31, 2009, respectively. Excise taxes included in cost of sales were $8.8 million and $9.3 million for the eleven months ended November 30, 2010 and year ended December 31, 2009, respectively. For company-operated stores, retail fuel margin per gallon was $0.17 for the eleven months ended November 30, 2010 and $0.14 per gallon for the year ended December 31, 2009.
Direct operating expenses. Direct operating expenses totaled $94.9 million and $100.0 million for the eleven months ended November 30, 2010 and year ended December 31, 2009, respectively, a 3.5% increase compared to the 2009 average monthly run rate levels. This increase in the period is primarily due to higher credit card fees associated with the higher average selling prices for fuel.
97
Table of Contents
Index to Financial Statements
Depreciation and amortization. Depreciation and amortization was $12.4 million for the eleven months ended November 30, 2010 compared to $14.2 million for the year ended December 31, 2009, a 4.2% decrease from the average monthly run rate for 2009.
Selling, general and administrative expenses. Selling, general and administrative expenses for the eleven months ended November 30, 2010 were $19.6 million compared to $20.5 million for the year ended December 31, 2009, a 4.1% increase from the average monthly run rate levels for 2009.
Operating income. Income from operations the eleven months ended November 30, 2010 totaled $26.5 million compared to $19.3 million for the year ended December 31, 2009, an increase of 49.8% from the 2009 average monthly run rate levels. The improvement in operating income for the 2010 period is primarily due to higher fuel margins per gallon and higher fuel volumes compared to the 2009 average monthly run rate levels.
Year Ended December 31, 2009 Compared to Year Ended December 31, 2008
Revenue. Revenue for the year ended December 31, 2009 was $1,129.2 million compared to $1,402.7 million for the year ended December 31, 2008, a decrease of 19.5% compared to 2008. The decrease in the 2009 period is due to lower average market prices for fuel and a 1.4% decrease in fuel volumes more than offsetting a 4.3% increase in merchandise revenue in the period. Excise taxes included in revenue totaled $9.3 million and $9.3 million for the year ended December 31, 2009 and 2008, respectively.
Cost of sales. Cost of sales for the year ended December 31, 2009 was $975.2 million compared to $1,241.4 million for the year ended December 31, 2008, a decrease of 21.4%, primarily as a result of lower average fuel costs. Cost of sales as a percentage of revenue was 86.4% and 88.5% for 2009 and 2008, respectively. Excise taxes included in cost of sales were $9.3 million and $9.3 million for the years ended December 31, 2009 and 2008, respectively. For company-operated stores, retail fuel margin per gallon was $0.14 for the year ended December 31, 2009 compared to $0.17 per gallon for the year ended December 31, 2008.
Direct operating expenses. Direct operating expenses totaled $100.0 million and $105.2 million for the year ended December 31, 2009 and 2008, respectively, a 4.9% decrease compared to 2008. This decrease in the period is primarily due to lower credit card fees associated with the lower average selling prices for fuel and improvements in inventory losses.
Depreciation and amortization. Depreciation and amortization was $14.2 million for the year ended December 31, 2009 compared to $14.8 million for the year ended December 31, 2008, a decrease of $0.6 million, or 4.1%, from the prior year.
Selling, general and administrative expenses. Selling, general and administrative expenses for the year ended December 31, 2009 were $20.5 million compared to $20.1 million for the year ended December 31, 2008, a 2.0% increase from the prior year.
Operating income. Income from operations the year ended December 31, 2009 totaled $19.3 million compared to $21.2 million for the year ended December 31, 2008.
98
Table of Contents
Index to Financial Statements
Adjusted EBITDA
Our management uses Adjusted EBITDA as a measure of operating performance to assist in comparing performance from period to period on a consistent basis and to readily view operating trends, as a measure for planning and forecasting overall expectations and for evaluating actual results against such expectations, and in communications with our board of directors, creditors, analysts and investors concerning our financial performance. Our revolving credit facility and other contractual obligations also include similar measures as a basis for certain covenants under those agreements which may differ from the Adjusted EBITDA definition described below.
Adjusted EBITDA is not a presentation made in accordance with GAAP and our computation of Adjusted EBITDA may vary from others in our industry. In addition, Adjusted EBITDA contains some, but not all, adjustments that are taken into account in the calculation of the components of various covenants in the agreements governing our senior secured notes, revolving credit facility, earn-out, margin support agreement and management services agreement. Adjusted EBITDA should not be considered as an alternative to operating earnings or net (loss) earnings as measures of operating performance. In addition, Adjusted EBITDA is not presented as and should not be considered an alternative to cash flows from operations as a measure of liquidity. Adjusted EBITDA is defined as EBITDA before turnaround and related expenses, stock-based compensation expense, gains (losses) from derivative activities, contingent consideration, formation costs, bargain purchase gain and adjustments to reflect proportionate EBITDA from the Minnesota Pipeline operations. Other companies, including other companies in our industry, may calculate Adjusted EBITDA differently than we do, limiting their usefulness as a comparative measure. Adjusted EBITDA also has limitations as an analytical tool and should not be considered in isolation, or as a substitute for analysis of our results as reported under GAAP. Some of these limitations include that Adjusted EBITDA:
| Ÿ | does not reflect our cash expenditures, or future requirements, for capital expenditures or contractual commitments; |
| Ÿ | does not reflect changes in, or cash requirements for, our working capital needs; |
| Ÿ | does not reflect our interest expense, or the cash requirements necessary to service interest or principal payments, on our debt; |
| Ÿ | does not reflect the equity income in our Minnesota Pipe Line Company investment, but includes 17% of the calculated EBITDA of the Minnesota Pipe Line Company; |
| Ÿ | does not reflect realized and unrealized gains and losses from hedging activities; |
| Ÿ | does not reflect certain other non-cash income and expenses; and |
| Ÿ | excludes income taxes that may represent a reduction in available cash. |
99
Table of Contents
Index to Financial Statements
The following tables reconcile net (loss) earnings as reflected in the results of operations tables and segment footnote disclosures to Adjusted EBITDA for the periods presented:
| Successor | ||||||||||||||||
| Nine Months Ended September 30, 2011 | ||||||||||||||||
| Refining | Retail | Other | Total | |||||||||||||
| (in millions) | ||||||||||||||||
| Net (loss) earnings |
$ | 330.0 | $ | 9.6 | $ | (604.0 | ) | $ | (264.4 | ) | ||||||
| Adjustments: |
||||||||||||||||
| Interest expense |
— | — | 30.6 | 30.6 | ||||||||||||
| Depreciation and amortization |
16.0 | 6.0 | 0.3 | 22.3 | ||||||||||||
|
|
|
|
|
|
|
|
|
|||||||||
| EBITDA subtotal |
346.0 | 15.6 | (573.1 | ) | (211.5 | ) | ||||||||||
| Minnesota Pipeline proportionate EBITDA |
2.7 | — | — | 2.7 | ||||||||||||
| Turnaround and related expenses |
22.5 | — | — | 22.5 | ||||||||||||
| Stock-based compensation expense |
— | — | 1.1 | 1.1 | ||||||||||||
| Unrealized losses on derivative activities |
— | — | 334.5 | 334.5 | ||||||||||||
| Contingent consideration income |
— | — | (37.6 | ) | (37.6 | ) | ||||||||||
| Formation costs |
— | — | 6.1 | 6.1 | ||||||||||||
| Realized losses on derivative activities |
— | — | 246.4 | 246.4 | ||||||||||||
|
|
|
|
|
|
|
|
|
|||||||||
| Adjusted EBITDA |
$ | 371.2 | $ | 15.6 | $ | (22.6 | ) | $ | 364.2 | |||||||
|
|
|
|
|
|
|
|
|
|||||||||
| Predecessor | ||||||||||||||||
| Nine Months Ended September 30, 2010 | ||||||||||||||||
| Refining | Retail | Other | Total | |||||||||||||
| (in millions) | ||||||||||||||||
| Net (loss) earnings |
$ | 102.9 | $ | 21.3 | $ | (49.4 | ) | $ | 74.8 | |||||||
| Adjustments: |
||||||||||||||||
| Interest expense |
— | — | 0.2 | 0.2 | ||||||||||||
| Depreciation and amortization |
19.9 | 10.1 | — | 30.0 | ||||||||||||
| Income tax provision |
— | — | 49.2 | 49.2 | ||||||||||||
|
|
|
|
|
|
|
|
|
|||||||||
| EBITDA subtotal |
122.8 | 31.4 | — | 154.2 | ||||||||||||
| Minnesota Pipeline proportionate EBITDA |
2.9 | — | — | 2.9 | ||||||||||||
| Turnaround and related expenses |
8.2 | — | — | 8.2 | ||||||||||||
| Stock-based compensation expense |
0.2 | — | — | |
0.2 |
| ||||||||||
|
|
|
|
|
|
|
|
|
|||||||||
| Adjusted EBITDA |
$ | 134.1 | $ | 31.4 | $ | — | $ | 165.5 | ||||||||
|
|
|
|
|
|
|
|
|
|||||||||
100
Table of Contents
Index to Financial Statements
| Successor | ||||||||||||||||
| August 10, 2010 (inception date) to December 31, 2010 | ||||||||||||||||
| Refining | Retail | Other | Total | |||||||||||||
| (in millions) | ||||||||||||||||
| Net (loss) earnings |
$ | 9.1 | $ | 0.5 | $ | (5.5 | ) | $ | 4.1 | |||||||
| Adjustments: |
||||||||||||||||
| Interest expense |
— | — | 3.2 | 3.2 | ||||||||||||
| Depreciation and amortization |
1.7 | 0.5 | — | 2.2 | ||||||||||||
|
|
|
|
|
|
|
|
|
|||||||||
| EBITDA subtotal |
10.8 | 1.0 | (2.3 | ) | 9.5 | |||||||||||
| Minnesota Pipeline proportionate EBITDA |
0.3 | — | — | 0.3 | ||||||||||||
| Stock-based compensation expense |
— | — | 0.1 | 0.1 | ||||||||||||
| Unrealized losses on derivative activities |
— | — | 27.1 | 27.1 | ||||||||||||
| Formation costs |
— | — | 24.3 | 24.3 | ||||||||||||
| Bargain purchase gain |
— | — | (51.4 | ) | (51.4 | ) | ||||||||||
|
|
|
|
|
|
|
|
|
|||||||||
| Adjusted EBITDA |
$ | 11.1 | $ | 1.0 | $ | (2.2 | ) | $ | 9.9 | |||||||
|
|
|
|
|
|
|
|
|
|||||||||
| Predecessor | ||||||||||||||||
| Eleven Months Ended November 30, 2010 | ||||||||||||||||
| Refining | Retail | Other | Total | |||||||||||||
| (in millions) | ||||||||||||||||
| Net (loss) earnings |
$ | 142.8 | $ | 26.5 | $ | (108.3 | ) | $ | 61.0 | |||||||
| Adjustments: |
||||||||||||||||
| Interest expense |
— | — | 0.3 | 0.3 | ||||||||||||
| Depreciation and amortization |
24.9 | 12.4 | — | 37.3 | ||||||||||||
| Income tax provision |
— | — | 67.1 | 67.1 | ||||||||||||
|
|
|
|
|
|
|
|
|
|||||||||
| EBITDA subtotal |
167.7 | 38.9 | (40.9 | ) | 165.7 | |||||||||||
| Minnesota Pipeline proportionate EBITDA |
3.7 | — | — | 3.7 | ||||||||||||
| Turnaround and related expenses |
9.5 | — | — | 9.5 | ||||||||||||
| Stock-based compensation expense |
0.3 | — | — | 0.3 | ||||||||||||
| Unrealized losses on derivative activities |
— | — | 40.9 | 40.9 | ||||||||||||
|
|
|
|
|
|
|
|
|
|||||||||
| Adjusted EBITDA |
$ | 181.2 | $ | 38.9 | $ | — | $ | 220.1 | ||||||||
|
|
|
|
|
|
|
|
|
|||||||||
| Predecessor | ||||||||||||||||
| Year Ended December 31, 2009 | ||||||||||||||||
| Refining | Retail | Other | Total | |||||||||||||
| (in millions) | ||||||||||||||||
| Net (loss) earnings |
$ | 70.6 | $ | 19.3 | $ | (35.2 | ) | $ | 54.7 | |||||||
| Adjustments: |
||||||||||||||||
| Interest expense |
— | — | 0.4 | 0.4 | ||||||||||||
| Depreciation and amortization |
26.0 | 14.2 | — | 40.2 | ||||||||||||
| Income tax provision |
— | — | 34.8 | 34.8 | ||||||||||||
|
|
|
|
|
|
|
|
|
|||||||||
| EBITDA subtotal |
96.6 | 33.5 | — | 130.1 | ||||||||||||
| Minnesota Pipeline proportionate EBITDA |
4.2 | — | — | 4.2 | ||||||||||||
| Turnaround and related expenses |
0.6 | — | — | 0.6 | ||||||||||||
| Stock-based compensation expense |
0.3 | — | — | 0.3 | ||||||||||||
|
|
|
|
|
|
|
|
|
|||||||||
| Adjusted EBITDA |
$ | 101.7 | $ | 33.5 | $ | — | $ | 135.2 | ||||||||
|
|
|
|
|
|
|
|
|
|||||||||
101
Table of Contents
Index to Financial Statements
| Predecessor | ||||||||||||||||
| Year Ended December 31, 2008 | ||||||||||||||||
| Refining | Retail | Other | Total | |||||||||||||
| (in millions) | ||||||||||||||||
| Net (loss) earnings |
$ | 77.7 | $ | 21.2 | $ | (40.3 | ) | $ | 58.6 | |||||||
| Adjustments: |
||||||||||||||||
| Interest expense |
— | — | 0.5 | 0.5 | ||||||||||||
| Depreciation and amortization |
24.4 | 14.8 | — | 39.2 | ||||||||||||
| Income tax provision |
— | — | 39.8 | 39.8 | ||||||||||||
|
|
|
|
|
|
|
|
|
|||||||||
| EBITDA subtotal |
102.1 | 36.0 | — | 138.1 | ||||||||||||
| Minnesota Pipeline proportionate EBITDA |
3.2 | — | — | 3.2 | ||||||||||||
| Turnaround and related expenses |
3.7 | — | — | 3.7 | ||||||||||||
| Stock-based compensation expense |
0.3 | — | — | 0.3 | ||||||||||||
|
|
|
|
|
|
|
|
|
|||||||||
| Adjusted EBITDA |
$ | 109.3 | $ | 36.0 | $ | — | $ | 145.3 | ||||||||
|
|
|
|
|
|
|
|
|
|||||||||
Liquidity and Capital Resources
Our primary sources of liquidity have traditionally been cash generated from our operating activities and borrowings under our revolving credit facility. Our ability to generate sufficient cash flows from our operating activities will continue to be primarily dependent on producing or purchasing and selling sufficient quantities of refined products and merchandise at margins sufficient to cover fixed and variable expenses. For discussions on our refinery gross product margin per barrel and retail fuel margin per gallon and merchandise margin for company-operated stores, see “—Results of Operations—Refining Segment” and “—Results of Operations—Retail Segment” and for discussions on factors that affect our results of operations, see “—Major Influences on Results of Operations.” For more information on our revolving credit facility, see “—Description of Our Indebtedness—Senior Secured Asset-Based Revolving Credit Facility.”
Based on current and anticipated levels of operations and conditions in our industry and markets, we believe that cash on hand, together with cash flows from operations and borrowings available to us under our revolving credit facility, will be adequate to meet our working capital, capital expenditures, any debt service and other cash requirements for at least the next twelve months.
We use a variety of hedging instruments to enhance the stability of our cash flows. In general, we attempt to hedge risks related to the variability of our future cash flow and profitability resulting from changes in applicable commodity prices or interest rates so that we can maintain cash flows sufficient to meet debt service, required capital expenditures and similar requirements. See “—Quantitative and Qualitative Disclosures About Market Risk.”
102
Table of Contents
Index to Financial Statements
Cash Flows
The following table sets forth our cash flows for the periods indicated:
| Predecessor | Successor | Predecessor | Successor | |||||||||||||||||||||||||
| Year Ended December 31, |
Eleven Months Ended November 30, 2010 |
August 10, 2010 (inception date) to December 31, 2010 |
Nine Months Ended September 30, 2010 |
Nine Months Ended September 30, 2011 |
||||||||||||||||||||||||
| 2008 | 2009 | |||||||||||||||||||||||||||
| (In millions) | ||||||||||||||||||||||||||||
| Net cash provided by (used in) operating activities |
$ | 47.1 | $ | 129.4 | $ | 145.4 | $ | (18.5 | ) | $ | 73.5 | $ | 194.3 | |||||||||||||||
| Net cash used in investing activities |
(84.6 | ) | (25.0 | ) | (29.3 | ) | (363.3 | ) | (21.1 | ) | (140.2 | ) | ||||||||||||||||
| Net cash provided by (used in) financing activities |
34.5 | (103.9 | ) | (115.4 | ) | 456.1 | (52.3 | ) | (1.5 | ) | ||||||||||||||||||
|
|
|
|
|
|
|
|
|
|
|
|
|
|||||||||||||||||
| Net increase (decrease) in cash and cash equivalents |
(3.0 | ) | 0.5 | 0.7 | 74.3 | 0.1 | 52.6 | |||||||||||||||||||||
| Cash and cash equivalents at beginning of period |
8.5 | 5.5 | 6.0 | — | 6.0 | 74.3 | ||||||||||||||||||||||
|
|
|
|
|
|
|
|
|
|
|
|
|
|||||||||||||||||
| Cash and cash equivalents at end of period |
$ | 5.5 | $ | 6.0 | $ | 6.7 | $ | 74.3 | $ | 6.1 | $ | 126.9 | ||||||||||||||||
|
|
|
|
|
|
|
|
|
|
|
|
|
|||||||||||||||||
Net Cash Provided By Operating Activities. Net cash provided by operating activities for the nine months ended September 30, 2011 was $194.3 million. The most significant providers of cash were our operating income ($347.1 million) adjusted for non-cash adjustments, such as depreciation and amortization expense ($22.3 million) and non-cash contingent consideration income ($37.6 million). Additionally, cash was provided by decreases in other current assets ($15.9 million) and increases in accounts payable and accrued expenses ($116.9 million). These increases in cash were partially offset by realized losses on derivative activities of $246.4 and interest expense ($30.6 million).
Net cash provided by operating activities for the nine months ended September 30, 2010 was $73.5 million. The most significant providers of cash were net earnings ($74.8 million) and adjustments to reconcile net earnings to net cash provided from operating activities, such as depreciation and amortization ($30.0 million) and changes in inventories ($26.7 million). These increases in cash were partially offset by a net cash outflow from changes in current receivables ($19.7 million) and inventories ($17.0 million) and changes in receivables from related parties ($19.0 million).
Net cash used in operating activities for the 2010 Successor Period was $18.5 million. The most significant providers of cash were net income ($4.1 million) and adjustments to reconcile net earnings to net cash provided from operating activities, such as depreciation and amortization ($2.2 million), unrealized losses from derivative activities ($27.1 million), changes in inventories ($38.6 million) and changes in accounts payable and accrued expenses ($88.6 million). These increases in cash were offset by a net cash outflow from changes in current receivables ($100.2 million), changes in other current assets ($27.7 million) and an adjustment for non-cash bargain purchase gain ($51.4 million).
Net cash provided by operating for the eleven months ended November 30, 2010 was $145.4 million. The most significant providers of cash were net earnings ($61.0 million) and adjustments to reconcile net earnings to net cash provided from operating activities, such as depreciation and amortization ($37.3 million), unrealized losses from derivative activities ($40.9 million) and changes in accounts payable and accrued expenses ($23.8 million). These increases in cash were partially offset by a net cash outflow from changes in current receivables ($17.5 million).
103
Table of Contents
Index to Financial Statements
Net cash provided by operating activities for the fiscal year ended December 31, 2009 was $129.4 million. The most significant providers of cash were our net earnings ($54.7 million) and adjustments to reconcile net earnings to net cash provided from operating activities, such as depreciation and amortization ($40.2 million) and changes in current accounts payable and accrued expenses ($31.2 million) and receivables from/payables to related parties ($23.8 million). These increases in cash were partially offset by a net cash outflow from changes in accounts receivables ($14.7 million) and inventories ($6.8 million).
Net cash provided by operating activities for the fiscal year ended December 31, 2008 was $47.1 million. The most significant providers of cash were our net earnings ($58.6 million) and adjustments to reconcile net income to net cash provided from operating activities, such as depreciation and amortization ($39.2 million), deferred income taxes ($10.0 million) and changes in current receivables ($70.2 million). These increases in cash were partially offset by a net cash outflow from changes in current accounts payable and accrued expenses ($83.7 million) and receivables from/payables to related parties ($45.6 million).
Changes in accounts payable and receivable and accrued expenses described above primarily relate to the changes in our total revenue, costs and expenses for such period discussed above under “Results of Operations.” Other factors affecting these changes were not material.
Net Cash Used In Investing Activities. Net cash used in investing activities for the nine months ended September 30, 2011 was $140.2 million, relating to capital expenditures ($27.4 million) and cash paid to Marathon Oil as part of the Marathon Acquisition ($112.8 million). Capital spending for the nine months ended September 30, 2011 primarily included a multi-year boiler replacement project at the refinery and safety related enhancements and facility improvements at the refinery. We recently completed a multi-year boiler replacement project with a total estimated project cost of approximately $17.9 million (including costs of $12.8 million during the period from 2008 through November 30, 2010, and costs of $5.1 million during the period from December 1, 2010 through September 30, 2011).
Net cash used in investing activities for the nine months ended September 30, 2010 was $21.1 million primarily relating to capital expenditures. Capital spending for the nine months ended September 30, 2010 primarily included ongoing expenditures related to the revamp of the No. 2 crude unit, the multi-year boiler replacement project at the refinery, safety related enhancements and facility improvements at the refinery.
Net cash used in investing activities for the 2010 Successor Period was $363.3 million, primarily relating to net cash paid for the Marathon Acquisition ($360.8 million).
Net cash used in investing activities for the eleven months ended November 30, 2010 was $29.3 million, primarily relating to capital expenditures ($29.8 million). Capital spending for the eleven months ended November 30, 2010 primarily included ongoing expenditures related to the revamp of the No. 2 crude unit, the multi-year boiler replacement project at the refinery, safety related enhancements and facility improvements at the refinery.
Net cash used in investing activities for the year ended December 31, 2009 was $25.0 million, primarily relating to capital expenditures ($29.0 million), partially offset by the return of capital on our cost method investment ($3.3 million). Capital spending for 2009 included ongoing expenditures related to the revamp of the No. 2 crude unit, the multi-year boiler replacement project at the refinery, safety related enhancements and facility improvements.
Net cash used in investing activities for the year ended December 31, 2008 was $84.6 million, primarily relating to capital expenditures ($45.0 million) and our portion of contributions to fund capital spending at the Minnesota Pipe Line Company for the capacity expansion at Minnesota pipeline
104
Table of Contents
Index to Financial Statements
($40.5 million) completed in 2008. For more information on this expansion project, see “Business—Crude Oil Supply.” Capital spending for 2008 included ongoing expenditures related to the revamp of the No. 2 crude unit and safety related enhancements and facility improvements at the refinery.
Net Cash Provided By (Used In) Financing Activities. Net cash used in financing activities was $1.5 million for the nine months ended September 30, 2011, representing tax distributions to the Existing Owners. Net cash used in financing activities was $52.3 million for the nine months ended September 30, 2010, representing distributions to Marathon. Net cash from financing activities for the 2010 Successor Period were $456.1 million representing borrowing from our senior secured notes ($290.0 million) and investments from members ($200.2 million) offset by financing costs related to the establishment of our credit facilities ($34.1 million). Net cash used in financing activities for the eleven months ended November 30, 2010 and the year ended December 31, 2009 were $115.4 million and $103.9 million, respectively, each representing net distributions to Marathon. Net cash provided by financing activities for the year ended December 31, 2008, was $34.5 million, representing net contributions from Marathon.
Working Capital
Working capital at September 30, 2011 was a deficit of $131.2 million, consisting of $425.5 million in total current assets and $556.7 million in total current liabilities. The working capital at September 30, 2011 was negatively impacted by the short-term derivative liability for unrealized losses of $346.2 million related to our crack spread risk management program. The offsetting benefits related to these unrealized losses should be realized over future periods as the improved crack spread margins are realized. Working capital at December 31, 2010 was $107.8 million, consisting of $359.6 million in total current assets and $251.8 million in total current liabilities. Working capital at December 31, 2009, was negative $51.2 million, consisting of $224.8 million in total current assets and $276.0 million in total current liabilities.
At the closing of the Marathon Acquisition, we entered into a five-year crude oil and supply and logistics agreement with JPM CCC pursuant to which JPM CCC assists us in the purchase of the crude oil requirements of our refinery and provides transportation and other logistical services for delivery of the crude oil to our storage tanks at Cottage Grove, Minnesota, which are approximately two miles from our refinery. Upon delivery of the crude oil to us we pay JPM CCC the price of the crude oil (determined as of one day subsequent to the date of delivery) plus certain agreed fees and expenses. We believe this crude oil supply and logistics agreement significantly reduces our crude inventories and allows us to take title to and price our crude oil at the refinery, as opposed to the crude oil origination point, reducing the time we are exposed to market fluctuations before the finished product output is sold.
Acquisition Financing
We financed the Marathon Acquisition through a combination of capital contributions from ACON Refining, TPG Refining, and certain members of our senior management, the issuance of an $80 million noncontrolling preferred interest to Marathon, the issuance of $290 million in senior secured notes and through certain third-party transactions. See “—Comparability of Historical Results.”
Capital Spending
Capital spending for the first nine months of 2011 primarily included a multi-year boiler replacement project at the refinery, safety related enhancements and facility improvements at the refinery. We completed a multi-year boiler replacement project, which entailed $17.9 million of capital expenditures over the project life, $12.8 million during the period from 2008 through November 30,
105
Table of Contents
Index to Financial Statements
2010 and $5.1 million during the period from December 1, 2010 through September 30, 2011. We currently expect to spend approximately $30 to $40 million per year in capital expenditures during 2011 and 2012.
The following table summarizes our capital expenditures divided among capital replacements, business improvements, environmental, safety and security and other for the relevant periods.
| Predecessor | Successor | Predecessor | Successor | |||||||||||||||||||||||||
| Year Ended December 31, |
Eleven Months Ended November 30, 2010 |
August 10, 2010- (inception date) to December 31, 2010 |
Nine Months Ended September 30, 2010 |
Nine Months Ended September 30, 2011 |
||||||||||||||||||||||||
| 2008 | 2009 | |||||||||||||||||||||||||||
| (In millions) | ||||||||||||||||||||||||||||
| Capital replacements |
$ | 4.9 | $ | 5.5 | $ | 9.1 | $ | 0.5 | $ | 6.7 | $ | 6.3 | ||||||||||||||||
| Business improvements(1) |
18.6 | 6.7 | 3.5 | 0.2 | 3.2 | 5.7 | ||||||||||||||||||||||
| Environmental, safety and security |
17.8 | 8.8 | 13.2 | 1.3 | 9.6 | 5.4 | ||||||||||||||||||||||
| Other(2) |
3.7 | 8.0 | 4.0 | 0.5 | 2.1 | 10.0 | ||||||||||||||||||||||
|
|
|
|
|
|
|
|
|
|
|
|
|
|||||||||||||||||
| Total |
$ | 45.0 | $ | 29.0 | $ | 29.8 | $ | 2.5 | $ | 21.6 | $ | 27.4 | ||||||||||||||||
|
|
|
|
|
|
|
|
|
|
|
|
|
|||||||||||||||||
| (1) | Includes capital spending for operating or process improvements and expansion of markets or facilities, such as liquified petroleum gas (“LPG”) storage and operating improvements and gasoline blender upgrades. |
| (2) | For 2011, includes spending for enterprise resource planning system and information technology infrastructure. |
Contractual Obligations and Commitments
We have the following contractual obligations and commitments as of December 31, 2010:
| Payments Due by Period | ||||||||||||||||||||
| Less Than 1 Year |
1-3 Years | 3-5 Years | More than 5 Years |
Total | ||||||||||||||||
| (in millions) | ||||||||||||||||||||
| Long-term debt(a) |
$ | 32.3 | $ | 64.7 | $ | 64.7 | $ | 350.9 | $ | 512.6 | ||||||||||
| Lease obligations(b) |
24.5 | 43.3 | 42.0 | 205.4 | 315.2 | |||||||||||||||
| Capital expenditures(c) |
1.8 | 1.4 | — | — | 3.2 | |||||||||||||||
| Environmental remediation costs |
0.4 | 0.6 | 0.5 | 2.1 | 3.6 | |||||||||||||||
| (a) | Long-term obligations represent (i) the repayment of the $290 million senior secured notes at their 2017 maturity date, (ii) cash interest payments for the senior secured notes through the 2017 maturity date, and (iii) commitment fees of 0.625% on an assumed $300 million undrawn balance under our revolving credit facility with a maturity date of 2015. |
| (b) | Lease obligations represent payments for a variety of facilities and equipment under lease, including existing real property leases and payments pursuant to our lease arrangement with Realty Income, office equipment and vehicles, as well as rail tracks for storage of rail tank cars near the refinery and numerous rail tank cars. |
| (c) | Capital expenditures represent our contractual commitments to acquire property, plant and equipment. |
106
Table of Contents
Index to Financial Statements
Tax Receivable Agreement
We intend to enter into the Tax Receivable Agreement with the Existing Owners, including ACON Refining and TPG Refining. This agreement generally provides for the payment by us of 85% of the amount of cash savings, if any, in U.S. federal, state and local income tax or franchise tax that we actually realize (or are deemed to realize in certain circumstances) in periods after this offering as a result of (i) the increase in tax basis in NTI LLC’s assets that arose from the Marathon Acquisition, (ii) the basis increase resulting from the distribution of offering proceeds to the Existing Owners, (iii) the basis increases resulting from the exchanges of NTI LLC Units (along with the corresponding shares of Class B common stock) for shares of our Class A common stock, (iv) additional deductions allocated to us pursuant to Section 704(c) of the Code, to reflect the difference between the fair market value and the adjusted tax basis of NTI LLC’s assets as of the date of this offering, (v) imputed interest deemed to be paid by us as a result of, and additional tax basis arising from, payments under the Tax Receivable Agreement, and (vi) any net operating losses available to us as a result of the Existing Owner Exchange. In addition, the Tax Receivable Agreement will provide for interest earned from the due date (without extensions) of the corresponding tax return to the date of payment specified by the Tax Receivable Agreement.
The payment obligations under the Tax Receivable Agreement are our obligations and are not obligations of NTI LLC. For purposes of the Tax Receivable Agreement, cash savings in tax generally are calculated by comparing our actual income tax liability to the amount we would have been required to pay had we not been able to utilize any of the tax benefits subject to the Tax Receivable Agreement. In order to calculate the amount we would have been required to pay, we will need to determine the tax basis in certain assets in effect prior to the Marathon Acquisition. This determination will be made in our sole judgment based on information received from Marathon in connection with the Marathon Acquisition and consistent with NTI LLC’s current tax reporting. This information will not be subject to verification by any third party, and thus there can be no assurance that the historic tax basis as determined by us will be accurate and that payments by us under the Tax Receivable Agreement will not exceed 85% of the cash savings that we actually realize. The term of the Tax Receivable Agreement will commence upon the completion of this offering and will continue until all such tax benefits have been utilized or expired, unless we exercise our right to terminate the Tax Receivable Agreement.
Estimating the amount of payments that may be made under the Tax Receivable Agreement is by its nature imprecise, insofar as the calculation of amounts payable depends on a variety of factors. The actual increase in tax basis, as well as the amount and timing of any payments under the Tax Receivable Agreement, will vary depending upon a number of factors, including the timing of exchanges, the price of our Class A common stock at the time of the exchange, the extent to which such exchanges are taxable, the amount and timing of the taxable income we realize in the future and the tax rate then applicable, our use of loss carryovers and the portion of our payments under the Tax Receivable Agreement constituting imputed interest or depreciable or amortizable basis. We expect that the payments that we will be required to make under the Tax Receivable Agreement will be substantial. Assuming no material changes in the relevant tax law and that we earn sufficient taxable income to realize all tax benefits that are subject to the Tax Receivable Agreement, we expect that future payments under the Tax Receivable Agreement associated with (i) the existing tax basis in NTI LLC’s assets that arose from the Marathon Acquisition, (ii) the basis increase resulting from the distribution of offering proceeds to the Existing Owners, (iii) additional deductions allocated to us pursuant to Section 704(c) of the Code to reflect the difference between the fair market value and the adjusted tax basis of NTI LLC’s assets as of the date of this offering and (iv) the use of any net operating losses available to us as a result of the Existing Owner Exchange will aggregate $ million and will range from approximately $ million to $ million per year over the next 15 years. The foregoing numbers are merely estimates and the actual payments could differ materially. Furthermore, these amounts reflect only the cash savings attributable to current
107
Table of Contents
Index to Financial Statements
tax attributes resulting from the four items described above. It is possible that future transactions or events could increase or decrease the actual tax benefits realized and the corresponding Tax Receivable Agreement payments. Future payments to the Existing Owners in respect of subsequent exchanges of NTI LLC Units would be in addition to these amounts and are expected to be substantial. There may be a substantial negative impact on our liquidity if, as a result of timing discrepancies or otherwise, (i) the payments under the Tax Receivable Agreement exceed the actual benefits we realize in respect of the tax attributes subject to the Tax Receivable Agreement and/or (ii) distributions to us by NTI LLC are not sufficient to permit us to make payments under the Tax Receivable Agreement subsequent to the payment of taxes and other obligations. The payments under the Tax Receivable Agreement will not be conditioned upon a holder of rights under a Tax Receivable Agreement having a continued ownership interest in either NTI LLC or us. For more information about the Tax Receivable Agreement, see “Certain Relationships and Related Person Transactions—Tax Receivable Agreement.”
Off-Balance Sheet Arrangements
Historically we have not had any off-balance sheet arrangements. In connection with the closing of the Marathon Acquisition, we entered into a lease arrangement with Realty Income, pursuant to which we leased 135 SuperAmerica convenience stores and one support facility over a 15-year initial term at an aggregate annual rent fixed for five years at an annual rate of $20.3 million, with consumer price index-based rent increases thereafter. For more information on the sale-leaseback arrangement, see “—Comparability of Historical Results.”
Description of Our Indebtedness
Senior Secured Asset-Based Revolving Credit Facility
Summarized below are the principal terms of our revolving credit facility. This summary is not a description of all of the terms of such indebtedness and is qualified in its entirety by reference to our credit facility, which has been filed as an exhibit to the registration statement of which this prospectus forms a part.
At the closing of the Marathon Acquisition, Northern Tier Energy LLC, which is a wholly owned subsidiary of NTI LLC, and certain of its subsidiaries (the “ABL Borrowers”) entered into an asset-backed lending facility (the “ABL Facility”) with JP Morgan Chase Bank, N.A. as administrative agent and collateral agent (the “ABL Agent”), Bank of America, N.A., as syndication agent, and lenders party thereto. The ABL Facility provides for revolving credit financing through December 1, 2015 in an aggregate principal amount of up to $300 million (of which $150 million may be utilized for the issuance of letters of credit and up to $30 million may be short-term borrowings upon same-day notice, referred to as swingline loans) and may be increased up to a maximum aggregate principal amount of $400 million, subject to borrowing base availability and lender approval. Availability under the ABL Facility at any time will be the lesser of (a) the aggregate commitments under the ABL Facility and (b) the borrowing base, less any outstanding borrowings and letters of credit. The borrowing base is calculated based on a percentage of eligible accounts receivable, petroleum inventory and other assets.
Borrowings under the ABL Facility bear interest, at our option, at either (a) an alternative base rate, plus an applicable margin (ranging between 1.75% and 2.25%) or (b) a LIBOR rate plus an applicable margin (ranging between 2.75% and 3.25%). The alternative base rate is the greater of (a) the prime rate, (b) the Federal Funds Effective rate plus 50 basis points, or (c) one-month LIBOR rate plus 100 basis points and a spread of up to 225 basis points based upon percentage utilization of this facility. In addition to paying interest on outstanding borrowings, we are also required to pay an annual commitment fee ranging from 0.375% to 0.625% and letter of credit fees.
108
Table of Contents
Index to Financial Statements
As of September 30, 2011, the availability under the ABL Facility was $137.5 million. This availability is net of $61.5 million in outstanding letters of credit. We had no borrowings under the ABL Facility at September 30, 2011 and December 31, 2010.
The ABL Facility requires that if the amount available under the ABL Facility is less than the greater of (i) 15% of the lesser of (x) the $300 million commitment amount and (y) the then-applicable borrowing base and (ii) $22.5 million, the ABL Borrowers comply with a minimum fixed charge coverage ratio of at least 1.0 to 1.0. In addition, the ABL Facility contains negative covenants that restrict the ABL Borrowers ability to, among other things, incur certain additional debt, grant certain liens, enter into certain guarantees, enter into certain mergers, make certain loans and investments, dispose of certain assets, prepay certain debt, declare dividends, modify certain material agreements or organizational documents, or change the business we conduct.
The ABL Facility also contains certain customary representations and warranties, affirmative covenants and events of default. Events of default include, among other things, payment defaults, breach of representations and warranties, covenant defaults, cross-defaults and cross-acceleration to certain indebtedness, certain events of bankruptcy, certain events under ERISA, material judgments, actual or asserted failure of any guaranty or security document supporting the ABL Facility to be in full force and effect, and change of control. If such an event of default occurs, the lenders under the ABL Facility would be entitled to take various actions, including the acceleration of amounts due under the ABL Facility and all actions permitted to be taken by a secured creditor.
Senior Secured Notes
Summarized below are the principal terms of Northern Tier Energy LLC’s 10.5% senior secured notes due 2017. This summary is not a description of all of the terms of such indebtedness and is qualified in its entirety by reference to the indenture governing the terms of the notes, which has been filed as an exhibit to the registration statement of which this prospectus forms a part.
In December 2010, in connection with the consummation of the Marathon Acquisition, Northern Tier Energy LLC (the “Issuer”) and Northern Tier Finance Corporation (the “Co-Issuer” and, together with the Issuer, the “Issuers”) privately placed $290 million in aggregate principal amount of our 10.50% senior secured notes due 2017, which we refer to as the senior secured notes. The proceeds from the offering of senior secured notes were used as part of the financing for the Marathon Acquisition. Deutsche Bank Trust Company Americas acts as trustee for the senior secured notes.
The senior secured notes are guaranteed, jointly and severally, on a senior secured basis, by all of Northern Tier Energy LLC’s existing and future direct and indirect subsidiaries that borrow under, or guarantee, any obligation under the ABL Facility, or that guarantee Northern Tier Energy LLC’s indebtedness or the indebtedness of another subsidiary and any other material wholly-owned domestic subsidiaries. The senior secured notes and the note guarantees are secured, subject to permitted liens, by (a) a first-priority security interest in substantially all present and hereinafter acquired tangible and intangible assets of the Issuers and each of the subsidiary guarantors in which liens have been granted in relation to the 10.5% senior secured notes due 2017 (other than those items described in clause (b) below), and (b) a second-priority security interest in the (i) inventory, (ii) accounts receivable, (iii) investment property, general intangibles (excluding trademarks, trade names and other intellectual property), documents, instruments, deposit accounts and other bank and securities accounts (with certain exceptions), and cash and cash equivalents, in each case, relating to the items in clauses (i) and (ii), (iv) all books and records relating to the items in subclauses (i), (ii), and (iii), (v) all proceeds of or supporting obligation relating to the foregoing, and (vi) certain other related assets, in each case owned or hereinafter acquired by the issuers and each of the subsidiary guarantors.
109
Table of Contents
Index to Financial Statements
The senior secured notes are the Issuers’ general senior secured obligations that are effectively subordinated to the Issuers’ obligations under the ABL Facility, structurally subordinated to any existing and future indebtedness and claims of holders of preferred stock and other liabilities of the Issuers’ direct or indirect subsidiaries that are not guarantors of the notes (other than Northern Tier Finance Corporation), and pari passu in right of payment with all of the Issuers’ existing and future indebtedness that is not subordinated. The notes rank effectively senior to all of the Issuers’ existing and future unsecured indebtedness to the extent of the value of the collateral, effectively equal to the obligations under certain hedge agreements and any future indebtedness which is permitted to be secured on a pari passu basis with the notes to the extent of the value of the collateral and senior in right of payment to any future subordinated indebtedness of the Issuers.
At any time prior to the maturity date of the notes, the Issuers may, at their option, redeem all or any portion of the notes for the outstanding principal amount plus unpaid interest and a make-whole premium as defined in the indenture.
The indenture governing the senior secured notes contains certain covenants that, among other things, limit the ability of the Issuer and certain of its subsidiaries to, subject to certain exceptions:
| Ÿ | incur, assume or guarantee additional debt or issue redeemable stock and preferred stock if the Issuer’s fixed charge coverage ratio, after giving effect to the issuance, assumption or guarantee of such additional debt or the issuance of such redeemable stock or preferred stock, for the immediately preceding quarter would have been less than 2.0 to 1.0, determined on a pro forma basis; |
| Ÿ | declare or pay dividends on or make any other payment or distribution on account of its or any of its restricted subsidiaries’ equity interests; |
| Ÿ | make any payment with respect to, or purchase, repurchase, redeem, defease or otherwise acquire or retire for value its equity interests; |
| Ÿ | purchase, repurchase, redeem, defease or otherwise acquire or retire for value or give any irrevocable notice of redemption with respect to certain subordinated debt; |
| Ÿ | make certain restricted investments; |
| Ÿ | make loans or advances, or sell, lease or transfer any of its property or assets; |
| Ÿ | merge, consolidate, lease or sell substantially all of its assets; |
| Ÿ | create, incur, assume or otherwise cause or suffer to exist or become effective any lien; |
| Ÿ | conduct any business or enter into or permit to exist any contract or transaction with any affiliate involving aggregate payments or consideration in excess of $5.0 million; |
| Ÿ | suffer a change of control; |
| Ÿ | enter into new lines of business; and |
| Ÿ | enter into agreements that restrict distributions from certain subsidiaries. |
The senior secured notes also provide for events of default which, if any of them occurs, would permit or require the principal of and accrued interest on such notes to become or to be declared to be due and payable.
Inflation
Inflation in the United States has been relatively low in recent years and did not have a material impact on our results of operations for the years ended December 31, 2008, 2009 and 2010. Although the impact of inflation has been insignificant in recent years, it is still a factor in the United States economy.
110
Table of Contents
Index to Financial Statements
Critical Accounting Policies and Estimates
The discussion and analysis of our financial condition and results of operations are based upon our consolidated financial statements, which have been prepared in accordance with accounting principles generally accepted in the United States. The preparation of our financial statements requires us to make estimates and assumptions that affect the reported amounts of assets, liabilities, revenues and expenses and related disclosure of contingent assets and liabilities. Certain accounting policies involve judgments and uncertainties to such an extent that there is reasonable likelihood that materially different amounts could have been reported under different conditions, or if different assumptions had been used. We evaluate our estimates and assumptions on a regular basis. We base our estimates on historical experience and various other assumptions that are believed to be reasonable under the circumstances, the results of which form the basis for making judgments about the carrying values of assets and liabilities that are not readily apparent from other sources. Actual results may differ from these estimates and assumptions used in preparation of our consolidated financial statements. We provide expanded discussion of our more significant accounting policies, estimates and judgments below. We believe these accounting policies reflect our more significant estimates and assumptions used in preparation of our consolidated financial statements. See Note 2 to our audited financial statements for a discussion of additional accounting policies and estimates made by management.
Contingent Consideration and Margin Support Arrangements
We will be required to make earn-out payments to Marathon if the Agreement Adjusted EBITDA exceeds $165 million, less, among other things, any rental expense accrued pursuant to the sale-leaseback arrangement with Realty Income, during any year in each of the eight years following the Marathon Acquisition. Agreement Adjusted EBITDA adjusts for, among other items, (i) any unrealized gains or losses relating to derivative activities, (ii) any gains or losses generated by the liquidation of any LIFO inventory layers, (iii) any losses related to lower of cost or market inventory adjustments, and (iv) any gains on the sale of property, plant or equipment and certain other assets. Marathon will receive 40% of the amount by which Agreement Adjusted EBITDA exceeds the specified threshold, not to exceed $125 million over the eight years following the Marathon Acquisition. The Marathon Acquisition agreements also include a margin support component that requires Marathon to pay us up to $30 million per year to the extent the Agreement Adjusted EBITDA is below $145 million, less, among other things, any rental expense accrued pursuant to the sale-leaseback arrangement with Realty Income, in either of the twelve-month periods ending November 30, 2011 or 2012 up to a maximum of $60 million. Any such payments made by Marathon will increase the amount that we may be required to pay Marathon over the earn-out period. Subsequent fair value adjustments to these collective contingent consideration arrangements (earn-out arrangement and margin support arrangement) will be recorded in the statement of operations based on quarterly remeasurements. These subsequent fair value adjustments will be made based on our estimates of the Agreement Adjusted EBITDA expected over the earn-out period. As such, there are inherent risks related to the accuracy of such estimates. See Note 13 to our audited financial statements for further information on our fair value measurements.
Investment in the Minnesota Pipe Line Company and MPL Investments
Our 17% common interest in the Minnesota Pipe Line Company is accounted for using the equity method of accounting and carried at our share of net assets in accordance with the Financial Accounting Standards Board, or the FASB, Accounting Standards Codification paragraph 323-30-35-3. Income from equity method investment represents our proportionate share of net (loss) earnings attributed to common owners generated by the Minnesota Pipe Line Company.
111
Table of Contents
Index to Financial Statements
The equity method investment is assessed for impairment whenever changes in the facts and circumstances indicate a loss in value has occurred. When the loss is deemed to be other than temporary, the carrying value of the equity method investment is written down to fair value, and the amount of the write-down is included in net (loss) earnings.
The investment in MPL Investments, over which we do not have significant influence and whose stock does not have a readily determinable fair value, is carried at cost. MPL Investments owns all of the preferred membership units of the Minnesota Pipe Line Company. Dividends received from MPL Investments are recorded as return of capital from cost method investment and in other income).
Inventories
Inventories are carried at the lower of cost or net realizable value. Cost of inventories is determined primarily under the LIFO method. However, we maintain other inventories in the retail segment whose cost is primarily determined using the first-in, first-out (“FIFO”) method. The refining segment has a LIFO pool for crude oil and refinery feedstocks and a separate LIFO pool for refined products.
The retail segment has separate LIFO pools for refined products, cigarettes, soft drinks, beer and wine and general merchandise. The LIFO values for each pool were maintained by Speedway SuperAmerica LLC, a wholly-owned subsidiary of Marathon Oil (“SSA”) at the store level through the allocation of LIFO costs based on the percentage of each store’s weighted moving average cost of inventory to SSA’s total weighted moving average inventory cost for the items in each LIFO pool. Cost of inventories of perishable items such as prepaid food inventories are determined using the FIFO method.
Intangible Assets
Intangible assets primarily include a retail marketing trade name, franchise agreements, refinery licensed technology agreements and refinery permits and plans. The marketing trade name has an indefinite life and therefore is not amortized, but rather is tested for impairment annually and when events or changes in circumstances indicate that the fair value of the intangible asset has been reduced below carrying value. The other intangibles are amortized on a straight-line basis over the expected remaining lives of the related contracts, as applicable, which range from 8 to 15 years. Amortized intangible assets are reviewed for impairment whenever events or changes in circumstances indicate that the carrying amount of an asset may not be recoverable. If the sum of the expected undiscounted future cash flows from the use of the asset and its eventual disposition is less than the carrying amount of the asset, an impairment loss is recognized based on the fair value of the asset.
Major Maintenance Activities
We incur costs for planned major refinery maintenance, referred to as “turnarounds.” These types of costs include contractor repair services, materials and supplies, equipment rentals and labor costs. Such costs are expensed in the period incurred.
Environmental Costs
Environmental expenditures are capitalized if the costs mitigate or prevent future contamination or if the costs improve environmental safety or efficiency of the existing assets. We provide for remediation costs and penalties when the responsibility to remediate is probable and the amount of associated costs can be reasonably estimated. The timing of remediation accruals coincides with completion of a feasibility study or the commitment to a formal plan of action. Remediation liabilities are accrued based on estimates of known environmental exposure and are discounted when the estimated amounts are reasonably fixed and determinable. If recoveries of remediation costs from third parties are probable, a receivable is recorded and is discounted when the estimated amount is reasonably fixed and determinable.
112
Table of Contents
Index to Financial Statements
Asset Retirement Obligations
The fair value of asset retirement obligations is recognized in the period in which the obligations are incurred if a reasonable estimate of fair value can be made. Conditional asset retirement obligations for removal and disposal of fire-retardant material from certain refining assets and asset retirement obligations for the removal of underground storage tanks from leased convenient stores have been recognized. The amounts recorded for such obligations are based on the most probable current cost projections. Asset retirement obligations have not been recognized for the removal of materials and equipment from or the closure of certain refinery, pipeline, terminal and retail marketing assets because the fair value cannot be reasonably estimated since the settlement dates of the obligations are indeterminable.
Current inflation rates and credit-adjusted-risk-free interest rates are used to estimate the fair value of asset retirement obligations. Depreciation of capitalized asset retirement costs and accretion of asset retirement obligations are recorded over time. Depreciation is determined on a straight-line basis, while accretion escalates over the lives of the assets.
Derivative Financial Instruments
We are exposed to earnings and cash flow volatility based on the timing and change in refined product prices versus crude oil prices. To manage these risks, we use derivative instruments associated with the purchase or sale of crude oil and refined products. Crack spread option contracts are used to hedge the volatility of refining margins. We also may use futures contracts to manage price risks associated with inventory quantities above or below target levels. We have not designated any derivative instruments as hedges for accounting purposes and we do not enter into derivative contracts for speculative purposes. All derivative instruments are recorded in the consolidated balance sheet at fair value and are classified depending on the maturity date of the underlying contracts. Changes in the fair value of its contracts are accounted for by marking them to market and recognizing any resulting gains or losses in its statements of operations. These gains or losses are reported within operating activities on the consolidated statement of cash flows.
Income Taxes
Subsequent to the Marathon Acquisition, we are structured as limited liability companies and are therefore pass-through entities for income tax purposes. As a result, we do not incur federal income taxes. Prior to the Marathon Acquisition, our taxable income was historically included in the consolidated U.S. federal income tax returns of Marathon and also in a number of state income tax returns, which are filed as consolidated returns.
Prior to the Marathon Acquisition, the provision for income taxes was computed as if we were a stand-alone tax-paying entity and as if we paid the amount of our current federal and state tax liabilities to Marathon in each period. As such, the accrual and payment of the current federal and state tax liabilities is recorded within the net investment in the combined financial statements in the period incurred.
Prior to the Marathon Acquisition, deferred tax assets and liabilities were recognized based on temporary differences between the financial statement carrying amounts of our assets and liabilities and their tax bases as reported in Marathon’s tax filings with the respective taxing authorities. The realization of deferred tax assets was assessed periodically based on several interrelated factors. These factors included the expectation to generate sufficient future taxable income in order to utilize tax credits and operating loss carry-forwards.
For more information, see Note 5 to our audited historical financial statements included elsewhere in this prospectus.
113
Table of Contents
Index to Financial Statements
Recent Accounting Pronouncements
Variable interest accounting standards were amended by the FASB in June 2009. The new accounting standards replace the existing quantitative-based risks and rewards calculation for determining which enterprise has a controlling financial interest in a variable interest entity with an approach focused on identifying which enterprise has the power to direct the activities of a variable interest entity. In addition, the concept of qualifying special-purpose entities has been eliminated. Ongoing assessments of whether an enterprise is the primary beneficiary of a variable interest entity are also required. The amended variable interest accounting standard requires reconsideration for determining whether an entity is a variable interest entity when changes in facts and circumstances occur such that the holders of the equity investment at risk, as a group, lack the power from voting rights or similar rights to direct the activities of the entity. Enhanced disclosures are required for any enterprise that holds a variable interest in a variable interest entity. Prospective application of this standard beginning in the first quarter of 2010 did not have any impact on our combined results of operations, financial position or cash flows.
A standard to improve disclosures about fair value measurements was issued by the FASB in January 2010. The additional disclosures required include: (1) the different classes of assets and liabilities measured at fair value, (2) the significant inputs and techniques used to measure Level 2 and Level 3 assets and liabilities for both recurring and nonrecurring fair value measurements, (3) the gross presentation of purchases, sales, issuances and settlements for Level 3 rollforward of activity, and (4) the transfers in and out of Levels 1 and 2. We adopted all aspects of this standard effective January 1, 2010, including the gross presentation of the roll forward of Level 3 activity, which could have been deferred until 2011. This adoption did not have any impact on our combined results of operations, financial position or cash flows.
The FASB amended the reporting standards for comprehensive income in June 2011 to eliminate the option to present the components of other comprehensive income as part of the statement of changes in stockholders’ equity. All non-owner changes in stockholders’ equity are required to be presented either in a single continuous statement of comprehensive income or in two separate but consecutive statements. In the two statement approach, the first statement should present total net income and its components followed consecutively by a second statement that should present total other comprehensive income, the components of other comprehensive income, and the total of comprehensive income. The amendments did not change the items that must be reported in other comprehensive income or when an item of other comprehensive income must be reclassified to net income. The amendment is effective for fiscal years, and interim periods within those years, beginning after December 15, 2012, and will be applied retrospectively. Early application is permitted. This standard will not have an impact on our consolidated results of operations, financial position or cash flows.
Quantitative and Qualitative Disclosures About Market Risk
We are exposed to market risks, including changes in commodity prices and interest rates. We may use financial instruments such as puts, calls, swaps, forward agreements and other financial instruments to mitigate the effects of the identified risks. In general, we attempt to hedge risks related to the variability of our future cash flow and profitability resulting from changes in applicable commodity prices or interest rates so that we can maintain cash flows sufficient to meet debt service, required capital expenditures and similar requirements.
Commodity Price Risk
As a refiner of petroleum products, we have exposure to market pricing for products sold in the future. In order to realize value from our processing capacity, we must achieve a positive spread
114
Table of Contents
Index to Financial Statements
between the cost of raw materials and the value of finished products (i.e., refinery gross product margin or crack spread). The physical commodities that comprise our raw materials and finished goods are typically bought and sold at a spot or index price that can be highly variable. The timing, direction and overall change in refined product prices versus crude oil prices will impact profit margins and could have a significant impact on our earnings and cash flows. Assuming all other factors remained constant, a $1 per barrel change in our average refinery gross product margin, based on our 2010 average refinery throughput of 80,157 bpd, would result in a change of $29.3 million in our overall gross margin.
The prices of crude oil, refined products and other commodities are subject to fluctuations in response to changes in supply, demand, market uncertainty and a variety of additional factors that are beyond our control. We monitor these risks and, where appropriate under our hedging policy, we will seek to reduce the volatility of our cash flows by hedging a significant and operationally reasonable volume of our gasoline and diesel production for a three-to-four year period on a rolling basis. We enter into hedging transactions designed to mitigate the impact of commodity price fluctuations on our business by locking in or fixing a percentage of the anticipated or planned gross margin in future periods. We will not enter into financial instruments for purposes of speculating on commodity prices. However, we may execute derivative financial instruments pursuant to our hedging policy that are not considered to be hedges within the applicable accounting guidelines.
In addition, the crude oil supply and logistics agreement with JPM CCC allows us to take title to, and price, our crude oil at the refinery, as opposed to the crude oil origination point, reducing the time we are exposed to market fluctuations before the finished refined products are sold. Furthermore, this agreement enables us to mitigate potential working capital fluctuations relating to crude oil price volatility.
Basis Risk
The effectiveness of our derivative strategies is dependent upon the correlation of the price index utilized for the hedging activity and the cash or spot price of the physical commodity for which price risk is being mitigated. Basis risk is a term we use to define that relationship. Basis risk can exist due to several factors, for example the location differences between the derivative instrument and the underlying physical commodity. Our selection of the appropriate index to utilize in a hedging strategy is a prime consideration in our basis risk exposure. In hedging NYMEX or U.S. Gulf Coast (or any other relevant benchmark) crack spreads, we experience location basis as the settlement price of NYMEX refined products (related more to New York Harbor cash markets) or U.S. Gulf Coast refined products (related more to U.S. Gulf Coast cash markets) may be different than the prices of refined products in our Upper Great Plains pricing area. The risk associated with not hedging the basis when using NYMEX or U.S. Gulf Coast forward contracts to fix future margins is if the crack spread increases based on prices traded on NYMEX or U.S. Gulf Coast while pricing in our market remains flat or decreases, then we would be in a position to lose money on the derivative position while not earning an offsetting additional margin on the physical position based on the pricing in our market.
Commodities Price and Basis Risk Management Activities
At the closing of the Marathon Acquisition, we entered into an arrangement with J. Aron & Company that governs all cash-settled commodity transactions that we enter into with J. Aron & Company for the purpose of managing our risk with respect to the crack spread created by the purchase of crude oil for future delivery and the sale of refined petroleum products, including gasoline, diesel, jet fuel and heating fuel, for future delivery. Under the agreement, as market conditions permit, we have the capacity to hedge our crack spread risk with respect to significant percentages of the refinery’s projected monthly production of some or all of these refined products on a three-to-four-year
115
Table of Contents
Index to Financial Statements
rolling basis. We entered into an amendment to the agreement with J. Aron & Company in November 2011 to permit us to enter into additional hedging transactions with a different counterparty should we elect to do so. As of September 30, 2011, we have hedged approximately 22 million barrels of future gasoline and diesel production under commodity derivatives contracts that are either exchange-traded contracts in the form of futures contracts or over-the-counter contracts in the form of commodity price swaps that reference benchmark indices such as NYMEX or U.S. Gulf Coast.
Our open positions at September 30, 2011 will expire at various times during the remainder of 2012. We prepared a sensitivity analysis to estimate our exposure to market risk associated with our derivative instruments. This analysis may differ from actual results. Based on our open positions of 22 million barrels, a $1.00 per barrel change in quoted market prices of our derivative instruments, assuming all other factors remain constant, could change the fair value of our derivative instruments and our net (loss) earnings by approximately $22 million.
We intend to enter into additional futures derivatives contracts in connection with material increases in our estimated refined product production and at times when we believe market conditions or other circumstances suggest that it is prudent to do so. We may use commodity derivatives contracts such as puts, calls, swaps, forward agreements and other financial instruments to mitigate the effects of the identified risks. Additionally, we may take advantage of opportunities to modify our derivative portfolio to change the percentage of our hedged refined product volumes when circumstances suggest that it is prudent to do so. We will not hedge the basis risk between the actual or spot prices of refined products sold in our market and that of the NYMEX or USGC associated with selling forward derivatives contracts for NYMEX or U.S. Gulf Coast crack spreads.
Interest Rate Risk
As of September 30, 2011, the availability under the ABL Facility was $137.5 million. This availability is net of $61.5 million in outstanding letters of credit. NTE had no borrowings under the ABL Facility at September 30, 2011 and December 31, 2010. Borrowings under the ABL Facility bear interest, at our election, at either an alternative base rate, plus an applicable margin (which ranges between 1.75% and 2.25% pursuant to a grid based on average excess availability) or a LIBOR rate, plus an applicable margin (which ranges between 2.75% and 3.25% pursuant to a grid based on average excess availability). See “—Liquidity and Capital Resources—Description of Our Indebtedness—Senior Secured Asset-Based Revolving Credit Facility.”
We have interest rate exposure on a portion of the cost of crude oil payable to JPM CCC for the crude oil inventory that they purchase for delivery to our refinery under the crude oil supply and logistics agreement. This exposure is offset with the credits we receive from JPM CCC for the trade terms granted by suppliers to them on crude oil purchases intended for our refinery. Our interest rate exposure is the spread between 3-months and 1-month LIBOR. A widening of the spread between these two rates may result in a higher cost of crude oil to us.
Credit Risk
We are subject to risk of losses resulting from nonpayment or nonperformance by our customers. We will continue to closely monitor the creditworthiness of customers to whom we grant credit and establish credit limits in accordance with our credit policy.
116
Table of Contents
Index to Financial Statements
Overview
We are an independent downstream energy company with refining, retail, and pipeline operations that serve the PADD II region of the United States. We operate our assets in two business segments: the refining business and the retail business. For the nine months ended September 30, 2011, we had total revenues of $3.2 billion, operating income of $347.1 million, a net loss of $264.4 million and Adjusted EBITDA of $364.2 million. For the year ended December 31, 2010, on a pro forma basis for the Marathon Acquisition, total revenues were $3.5 billion, operating income was $169.7 million, net earnings were $63.0 million and Adjusted EBITDA was $213.1 million. For a definition, and reconciliation, of Adjusted EBITDA to net (loss) earnings, see “Prospectus Summary—Summary Historical and Unaudited Pro Forma Condensed Consolidated Financial and Other Data.”
Refining Business
Our refining business primarily consists of a 74,000 bpd (84,500 barrels per stream day) refinery, located in St. Paul Park, Minnesota. Our refinery has a Nelson complexity index of 11.5, which refers to the ability of a refinery to produce finished products based on its investment intensity and cost relative to other refineries. We are one of only two refineries in Minnesota and one of four refineries in the Upper Great Plains area within the PADD II region. Of the 27 operable refineries in the PADD II region, only three have a Nelson complexity index higher than ours. Our strategic location allows us direct access, primarily via the Minnesota Pipeline, to crude oils from Western Canada and North Dakota, as well as the ability to distribute our refined products throughout the midwestern United States. Our refinery produces a broad slate of refined products including gasoline, diesel, jet fuel and asphalt, which are then marketed to resellers and consumers primarily in the PADD II region. Approximately 79% and 78% of our total refinery production for the nine months ended September 30, 2011 and the year ended December 31, 2010, respectively, comprised higher value, light refined products, including gasoline and distillates.
We also own various storage and transportation assets, including a light products terminal, a heavy products terminal, storage tanks, rail loading/unloading facilities and a Mississippi river dock. Approximately 80% and 75% of our gasoline and diesel volumes for the nine months ended September 30, 2011 and the year ended December 31, 2010, respectively, were sold via our light products terminal to our company-operated and franchised SuperAmerica branded convenience stores, Marathon branded convenience stores and other resellers. We have a contract with Marathon to supply substantially all of the gasoline and diesel requirements for 90 independently owned and operated Marathon branded convenience stores.
Our refining business also includes our 17% interest in the Minnesota Pipe Line Company, which owns and operates the Minnesota Pipeline, a 455,000 bpd crude oil pipeline system that transports crude oil (primarily from Western Canada and North Dakota) for approximately 300 miles from the Enbridge pipeline hub at Clearbrook, Minnesota to our refinery. The Minnesota Pipeline has historically supplied the majority of the crude oil used and processed in our refinery.
Retail Business
As of September 30, 2011, our retail business operated 166 convenience stores under the SuperAmerica brand and also supported 67 franchised convenience stores, which are also operated under the SuperAmerica brand. These convenience stores are located primarily in Minnesota and Wisconsin and sell various grades of gasoline and diesel, tobacco products and immediately consumable items such as non-alcoholic beverages, beer, prepared food and a large variety of snacks
117
Table of Contents
Index to Financial Statements
and prepackaged items. Our refinery supplied substantially all of the gasoline and diesel sold in our company-operated and franchised convenience stores for the nine months ended September 30, 2011 and the year ended December 31, 2010.
We also own and operate SuperMom’s Bakery, which prepares and distributes baked goods and other prepared food items for sale in our company-operated and franchised convenience stores and other third party locations.
Refining Industry Overview
Crude oil refining is the process of separating the hydrocarbons present in crude oil for the purpose of converting them into marketable finished, or refined, petroleum products such as gasoline, diesel, jet fuel, asphalt and other products. Refining is primarily a margin-based business where both the feedstock (primarily crude oil) and the refined products are commodities with fluctuating prices. In order to increase profitability, it is important for a refinery to maximize the yields of high value finished products and to minimize the costs of feedstock and operating expenses.
According to the EIA, as of January 1, 2011, there were 137 oil refineries operating in the United States, with the 15 smallest each having a refining capacity of 14,000 bpd or less, and the 10 largest having capacities ranging from 330,000 bpd to 560,640 bpd.
High capital costs, historical excess capacity and environmental regulatory requirements have limited the construction of new refineries in the United States over the past 30 years. According to the EIA, domestic operating refining capacity has increased approximately 5% between January 1982 and January 2011 from 16.1 million bpd to 16.9 million bpd. Much of this increase in capacity is generally the result of efficiency measures and moderate expansions at various refineries, known as “capacity creep,” but some significant expansions at existing refineries have occurred as well. During this same time period, more than 110 generally smaller and less efficient refineries that had limited access to a wide variety of crude oils or were unable to profitably process feedstock into a marketable product mix were closed.
According to the EIA, total demand for refined products in PADD II, which is the region in which we operate, has represented approximately 26% of total U.S. refined products demand from 2006 to 2010. Within PADD II, refined product production capacity is currently insufficient to meet demand. For example, according to the EIA, due to product supply shortfalls within PADD II, net receipts of gasoline, distillate and jet fuel/kerosene from domestic sources outside of PADD II comprised approximately 19%, 17% and 16%, respectively, of demand for these products. Refining capacity in the PADD II region has decreased approximately 3% between January 1982 and January 2011 from approximately 3.8 million bpd to approximately 3.6 million bpd, while more than 25 refineries in the PADD II region have ceased operations. The refined product volumes that are necessary to satisfy the demand in excess of PADD II production are primarily sourced from domestic refineries located outside of PADD II, specifically from the U.S. Gulf Coast.
118
Table of Contents
Index to Financial Statements
The following tables illustrate the balance of certain refined products in PADD II from 2005 – 2010:
PADD II Gasoline Balance (mbpd)
| 2005 | 2006 | 2007 | 2008 | 2009 | 2010 | |||||||||||||||||||
| Production by Refineries Within PADD II |
1,816 | 1,796 | 1,769 | 1,713 | 1,778 | 1,807 | ||||||||||||||||||
| Net Receipts of Products from Domestic Sources Outside PADD II |
673 | 691 | 673 | 594 | 550 | 482 | ||||||||||||||||||
| Ethanol |
136 | 138 | 179 | 243 | 222 | 231 | ||||||||||||||||||
| Exports to Non-U.S. Sources |
0 | 2 | 11 | 19 | 1 | 5 | ||||||||||||||||||
| Imports from Non-U.S. Sources |
2 | 1 | 2 | 1 | 1 | 3 | ||||||||||||||||||
| Other |
(1 | ) | 1 | (15 | ) | (26 | ) | (17 | ) | (2 | ) | |||||||||||||
|
|
|
|
|
|
|
|
|
|
|
|
|
|||||||||||||
| Total |
2,626 | 2,629 | 2,619 | 2,544 | 2,535 | 2,526 | ||||||||||||||||||
|
|
|
|
|
|
|
|
|
|
|
|
|
|||||||||||||
PADD II Distillate Balance (mbpd)
| 2005 | 2006 | 2007 | 2008 | 2009 | 2010 | |||||||||||||||||||
| Production by Refineries Within PADD II |
908 | 914 | 927 | 987 | 898 | 963 | ||||||||||||||||||
| Net Receipts of Products from Domestic Sources Outside PADD II |
344 | 332 | 336 | 249 | 180 | 195 | ||||||||||||||||||
| Exports to Non-U.S. Sources |
(9 | ) | (2 | ) | (6 | ) | (12 | ) | (6 | ) | (3 | ) | ||||||||||||
| Imports from Non-U.S. Sources |
4 | 6 | 6 | 5 | 4 | 6 | ||||||||||||||||||
| Other |
2 | 5 | (8 | ) | (7 | ) | 1 | 1 | ||||||||||||||||
|
|
|
|
|
|
|
|
|
|
|
|
|
|||||||||||||
| Total |
1,249 | 1,255 | 1,255 | 1,222 | 1,077 | 1,162 | ||||||||||||||||||
|
|
|
|
|
|
|
|
|
|
|
|
|
|||||||||||||
PADD II Jet Fuel/Kerosene Balance (mbpd)
| 2005 | 2006 | 2007 | 2008 | 2009 | 2010 | |||||||||||||||||||
| Production by Refineries Within PADD II |
230 | 220 | 202 | 209 | 208 | 219 | ||||||||||||||||||
| Net Receipts of Products from Domestic Sources Outside PADD II |
145 | 119 | 115 | 74 | 49 | 41 | ||||||||||||||||||
| Exports to Non-U.S. Sources |
(1 | ) | (4 | ) | (7 | ) | (10 | ) | (5 | ) | (4 | ) | ||||||||||||
| Imports from Non-U.S. Sources |
0 | 0 | 0 | 0 | 0 | |||||||||||||||||||
| Other |
(3 | ) | 2 | 1 | 2 | (4 | ) | (1 | ) | |||||||||||||||
|
|
|
|
|
|
|
|
|
|
|
|
|
|||||||||||||
| Total |
371 | 337 | 311 | 275 | 248 | 255 | ||||||||||||||||||
|
|
|
|
|
|
|
|
|
|
|
|
|
|||||||||||||
Source: EIA; see “Market and Industry Data and Forecasts.”
Our Business Strategy
The primary components of our business strategy are:
| Ÿ | Focus on Optimizing Crude Oil Supply. We are focused on optimizing our crude oil purchases for our refining operations and minimizing our crude oil feedstock costs. Our strategic location and the refinery’s complexity allow us to receive and process a variety of light, heavy, sweet and sour crude oils from Western Canada and the United States, many of which have historically priced at a discount to the NYMEX WTI price benchmark. |
119
Table of Contents
Index to Financial Statements
| Ÿ | Maintain Significant Liquidity in Our Business. We rely on cash from operating activities, existing cash balances and our revolving credit facility as sources of liquidity to provide us with financial flexibility during periods of volatile commodity prices. We manage our operations prudently with a focus on maintaining ample liquidity to meet unforeseen capital needs. During December 2010, we entered into a five-year crude oil supply and logistics agreement with JPM CCC to supply our refinery’s crude oil feedstock requirements, which helps reduce the amount of working capital required in our refinery operations. On a pro forma basis for this offering, as of September 30, 2011, we estimate that we would have had approximately $ million of available liquidity comprised of cash on hand and amounts available for borrowing under our $300 million revolving credit facility. Our actual available liquidity may vary from our estimated amount depending on several factors, including fluctuations in inventory and accounts receivable values as well as cash balances. |
| Ÿ | Reduce Reliance on Wholesale Market by Growing Our Retail Business. We intend to emphasize the development and growth of our dedicated SuperAmerica branded retail business to which we supply transportation fuels directly from our refining operations. We expect our near-term growth to be driven by an expansion of our SuperAmerica franchise business. In the long term, we anticipate increasing the number of company-operated convenience stores in select areas. |
| Ÿ | Selectively Engage in Hedging Activities to Mitigate Gross Margin Volatility. We seek to mitigate the variability of commodity price exposure by selectively engaging in hedging strategies that are intended to protect our refining gross margins and operating cash flows. Our hedging policy establishes that we systematically evaluate the merits of entering into commodity derivatives contracts to hedge our crack spread risk with respect to a portion of our expected gasoline and diesel production on a rolling basis. Crack spread measures the difference between the price received from the sale of light products and the price paid for crude oil. For example, the 3:2:1 crack spread is a general industry standard that approximates the per barrel refining margin resulting from processing three barrels of crude oil to produce two barrels of gasoline and one barrel of distillates, which generally includes diesel, jet fuel or kerosene. Commodity derivatives contracts that we enter into are either exchange-traded contracts in the form of futures contracts or over-the-counter contracts in the form of commodity price swaps that reference benchmark indices. As of September 30, 2011, we hedged approximately 22 million barrels of future gasoline and distillate production under commodity derivatives contracts. |
| Ÿ | Selectively Consider Acquisition Opportunities. We intend to selectively consider strategic acquisitions within the refining and retail marketing industry. In selecting acquisitions within the refining industry, we will consider the following criteria: (i) performance through the refining cycle, (ii) advantageous access to crude oil supplies, (iii) attractive refined products market fundamentals and (iv) access to distribution and logistics infrastructure. In our existing areas of operation, we will seek acquisition opportunities that have the potential for operational efficiencies. We may also evaluate opportunities in the energy industry outside of our existing areas of operation and in new geographic regions to expand our operating footprint. |
Our Competitive Strengths
We have a number of competitive strengths that we believe will help us to successfully execute our business strategy:
| Ÿ | Strategically Located Refinery with Advantageous Access to Crude Oil Supply. Our refinery is located on approximately 170 acres along the Mississippi River in a strategically advantageous area within the PADD II region. The refinery has the ability to source a variety of crude oils, |
120
Table of Contents
Index to Financial Statements
| including heavy Canadian crude oils and light North Dakota crude oils, primarily via the Minnesota Pipeline. Our refinery also has access to crude oils from Cushing, Oklahoma, the U.S. Gulf Coast and other foreign markets. The ability to source and process multiple types of crude oil enables us to capitalize our changing market conditions and, we believe, increase our overall profitability. For the nine months ended September 30, 2011, 52% of the crude oil processed at the refinery was Canadian crude oil, with the remainder comprised of locally produced U.S. crude oils, mostly from the Bakken Shale in North Dakota. |
Historically, we have purchased our crude oil at a discount to NYMEX WTI as a result of our close proximity to plentiful sources of crude oil in Western Canada and North Dakota. Over the five years ended September 30, 2011, we realized an average discount of $1.95 per barrel of crude oil purchased for our refinery when compared to the average NYMEX WTI price per barrel over the same period. More recently, the increase of the discount at which a barrel of NYMEX WTI traded relative to a barrel of Brent has allowed refineries, such as ours, that are capable of sourcing and utilizing crude oil that is priced more in line with NYMEX WTI, to realize lower feedstock costs and benefit from higher refined product prices resulting from higher Brent prices.
The following chart highlights the recent trend in this discount:
Recent Trends in Crude Oil Prices and the WTI / Brent Differential
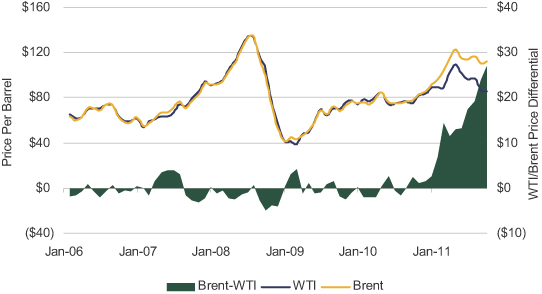
Source: Bloomberg; see “Market and Industry Data and Forecasts.”
| Ÿ | Attractive Regional Refined Products Supply/Demand Dynamics. In recent years, demand for refined products in the PADD II region has exceeded regional production, resulting in a need for imports from other regions, specifically from the U.S. Gulf Coast region. Our inland location means that foreign and coastal domestic refiners seeking to access our marketing area would incur additional transportation costs. Over the five years ended September 30, 2011, our refinery has realized an average price premium of $3.35 per barrel for its gasoline and distillates production relative to the prices used in calculating the U.S. Gulf Coast 3:2:1 crack spread and an average price premium of $1.86 per barrel relative to the benchmark Group 3 3:2:1 crack spread in each case, assuming a comparable rate of two barrels of gasoline and |
121
Table of Contents
Index to Financial Statements
| one barrel of distillate (see footnote 4 to “Prospectus Summary—Summary Historical and Unaudited Pro Forma Condensed Consolidated Financial and Other Data”). |
| Ÿ | Substantial Refinery Operating Flexibility. Since 2006, approximately $213 million (including $194 million from January 2006 through November 2010 and $19 million from our inception date of August 10, 2010 through September 2011) has been invested in upgrades and capital projects to modernize the St. Paul Park refinery, improve its operating flexibility, increase its complexity and meet U.S. environmental, health and safety requirements, including revamping the gas oil hydrotreater in 2006 to allow for the production of ultra low sulfur diesel. As a result of these capital expenditures, we believe that we will be able to comply with known prospective fuel quality requirements without incurring significant capital costs or substantially increased operating costs. In addition, we have significant redundancies in our refining assets, which include two crude oil distillation and vacuum towers, two reformers, two sulfur recovery units and five hydrotreating units. These redundancies allow us to continue to receive and process crude oil and other feedstocks in the event a unit goes out of service and allows for increased maintenance flexibility as a redundant unit may be used without having to shut down the entire refinery in the case of a major unit turnaround. |
Our refinery has a Nelson complexity index of 11.5. Of the 27 operable refineries in the PADD II region, only three have a Nelson complexity index higher than ours. Our refinery’s complexity means we can process lower cost crude oils into higher value light refined products, including transportation fuels such as gasoline and distillates. Gasoline and distillates comprised approximately 79% and 78% of our total refinery production for the nine months ended September 30, 2011 and the year ended December 31, 2010, respectively.
| Ÿ | Strong Refinery Operating and Safety Track Record. Our refinery has a strong operating and safety track record as evidenced by our high mechanical availability and low recordable incidents. This performance is due to, among other things, the periodic upgrades and maintenance performed at our refinery. We measure our safety track record primarily through the use of injury frequency rates as determined by the OSHA. Our refinery had an OSHA Recordable Rate of 0.35 and 0.40 during the nine months ended September 30, 2011 and the year ended December 31, 2010, respectively. |
| Ÿ | Integrated Refining and Retail Distribution Operations. Our business is an integrated refining operation with significant storage assets and a retail distribution network comprising, as of September 30, 2011, 166 company-operated and 67 franchised convenience stores, all of which are operated under the SuperAmerica brand. For the nine months ended September 30, 2011 and the year ended December 31, 2010, we sold approximately 80% and 75%, respectively, of our gasoline and diesel volumes via our eight-bay bottom-loading light products terminal located at the refinery, primarily to our retail distribution network and to a lesser extent, other resellers. Our refinery supplied substantially all of the gasoline and diesel sold in our company-operated and franchised convenience stores during these periods. We also have a contract with Marathon to supply substantially all of the gasoline and diesel requirements of 90 independently owned and operated Marathon branded convenience stores. In addition, we also have (i) a seven-bay heavy products terminal located on the refinery property, (ii) rail facilities for shipping liquefied petroleum gases and asphalt and for receiving butane, isobutane, crude oil and ethanol and (iii) a barge dock on the Mississippi River used primarily for shipping vacuum residuals and slurry. |
| Ÿ | Experienced, Proven and Incentivized Management Team. Our management team is led by our Chief Executive Officer, Mario E. Rodriguez, formerly a managing director in the global energy investment banking division of Citigroup Global Markets, who has approximately 20 years experience in the energy and finance industries. Our President and Chief Operating Officer, Hank Kuchta, has over 30 years of industry experience and was formerly President and Chief Operating Officer of Premcor Inc. Premcor operated four refineries in the United States |
122
Table of Contents
Index to Financial Statements
| with approximately 750,000 bpd of refining capacity at the time of its sale to Valero Energy Corporation in April 2005. Prior to Premcor, Mr. Kuchta served in various management positions at Phillips 66 Company, Tosco Corporation and Exxon Corporation. Our President of refinery operations, Greg Mullins, previously worked at Marathon for over 30 years and has extensive experience in all aspects of refinery operations and management as well as major project development and project management. Several members of our management team, including our President and Chief Operating Officer; our Vice President, Marketing; our Vice President, Supply; our Vice President, Human Resources; and our Vice President, Chief Information Officer, have experience working together as a management team at Premcor. In addition, our management team will have a significant ownership interest in us immediately following the completion of this offering, which we believe provides significant incentives to grow the value of our business for the benefit of all of our stockholders. |
Our Refining Business
Our refinery occupies approximately 170 acres along the Mississippi River in the southeast of St. Paul Park, Minnesota and was originally built in 1939. The refinery was acquired by Ashland Oil, Inc. in 1970 from Northwestern Refining, was jointly owned by Ashland Oil, Inc. and Marathon from 1998 through 2005 and became fully owned by Marathon in 2005. Our refinery is a 74,000 bpd (84,500 barrels per stream day) cracking facility with operations including crude fractionation, catalytic cracking, hydrotreating, reforming, alkylation, sulfur recovery and a hydrogen plant. A major refinery improvement and expansion project was completed in 1993 to enable the refinery to produce environmentally compatible low sulfur fuels. In 2006, the gas oil hydrotreater was revamped, which enables us to produce ultra low sulfur diesel, at a capital cost of approximately $24 million. The fluid catalytic cracking unit was expanded in 2007 for a total capital cost of approximately $37 million, which improved gasoline yield and increased capacity from 27,100 bpd to 28,500 bpd. We have just completed a multi-year boiler replacement project with a total estimated project cost of approximately $17.9 million (including costs of $12.8 million during the period from 2008 through November 30, 2010 and $5.1 million during the period from December 1, 2010 through September 30, 2011).
A refinery’s location can have an important impact on its refining margins because location can influence access to feedstocks and efficient distribution for refined products. There are five regions in the United States, the Petroleum Administration for Defense Districts (“PADDs”), that have historically experienced varying levels of refining profitability due to regional market conditions. Refiners located in the U.S. Gulf Coast region operate in a highly competitive market due to the fact that this region (“PADD III”) accounts for approximately 38% of the total number of operable U.S. refineries as of January 1, 2011 and approximately 49% of the country’s refining capacity as of January 2011. Our refinery is located in the strategically advantageous PADD II region. In recent years, demand for refined products in the PADD II region has exceeded regional capacity, resulting in a need for imports from other regions, specifically from the U.S. Gulf Coast region. Our inland location means that foreign and coastal domestic refiners seeking to access our marketing area would incur additional transportation costs. This favorable supply/demand imbalance has allowed our refinery to generate higher refining margins, as measured by the U.S. Gulf Coast 3:2:1 crack spread. We have realized, on average, a premium of $5.30 per barrel of refined product relative to the benchmark Group 3 3:2:1 crack spread over the past five years through September 30, 2011 assuming a comparable rate of two barrels of gasoline and one barrel of distillate for each of the U.S. Gulf Coast 3:2:1 crack spread and the Group 3 3:2:1 crack spread.
The refinery is an integrated refining operation with significant storage and transportation assets. Our transportation assets include our 17% interest in the Minnesota Pipe Line Company, an eight-bay light product terminal located approximately two miles from the refinery, a seven-bay heavy product
123
Table of Contents
Index to Financial Statements
loading rack located on the refinery property, rail facilities for shipping LPG and asphalt and receiving butane, isobutane and ethanol and a barge dock on the Mississippi River used primarily for shipping vacuum residue and slurry. As of September 30, 2011, our storage assets include 84 hydrocarbon storage tanks with a total capacity of 3.7 million barrels (156 million gallons), 0.8 million barrels of crude oil storage and 2.9 million barrels of feedstock and product storage.
Process Summary
Our refinery is a 74,000 bpd (84,500 barrels per stream day) cracking facility with operations including crude fractionation, catalytic cracking, hydrotreating, reforming, alkylation, sulfur recovery and a hydrogen plant. We have significant redundancy in our refining assets, which include two crude oil distillation and vacuum towers, two reformers, two sulfur recovery units and five hydrotreating units. This redundancy allows us to continue to receive and process crude oil even if one tower goes out of service and also allows for increased maintenance flexibility as a redundant unit may be used without having to shut down the entire refinery in the case of a major unit turnaround. During the nine months ended September 30, 2011 and the year ended December 31, 2010, the refinery processed nearly 76,829 bpd and 74,142 bpd of crude oil, respectively, and 3,865 bpd and 6,015 bpd of other charge and blendstocks, respectively. The facility processes a mix of light sweet, synthetic and heavy sour crude oils, predominately from Canada and North Dakota, into products such as gasoline, diesel, jet fuel, asphalt, kerosene, propane, LPG, propylene and sulfur. Our refinery crude capacity utilization rates have ranged from approximately 80% to approximately 88% over the last five years. Please see below a simplified process flow diagram of the major refining units at our refinery.
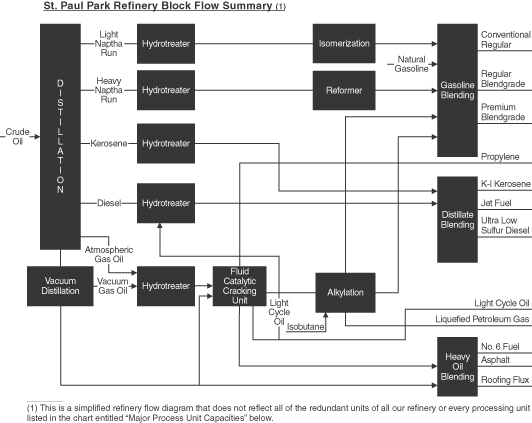
124
Table of Contents
Index to Financial Statements
The following table summarizes our refinery’s major process unit capacities. Unit capacities are shown in barrels per stream day.
Major Process Unit Capacities
(Barrels per stream day)
| Process Unit |
Capacity | % of Crude Oil Capacity |
||||||
| No. 1 Crude Oil Unit |
37,000 | 44 | % | |||||
| No. 2 Crude Oil Unit |
47,000 | 56 | % | |||||
| Vacuum Distillation Unit #1 |
19,000 | 23 | % | |||||
| Vacuum Distillation Unit #2 |
22,500 | 27 | % | |||||
| Catalytic Reforming Unit #1 |
13,000 | 15 | % | |||||
| Catalytic Reforming Unit #2 |
6,500 | 8 | % | |||||
| Fluid Catalytic Cracking Unit |
28,500 | 40 | % | |||||
| HF Alkylation Unit |
5,500 | 7 | % | |||||
| C4/C5/C6 Isom Unit |
8,500 | 10 | % | |||||
| Isom Desulfurizer |
8,500 | 10 | % | |||||
| Naphtha Hydrotreater #1 |
13,500 | 16 | % | |||||
| Naphtha Hydrotreater #2 |
7,000 | 8 | % | |||||
| Kerosene Hydrotreater |
7,500 | 9 | % | |||||
| Distillate Hydrotreater |
21,500 | 26 | % | |||||
| Gas Oil Hydrotreater |
29,500 | 35 | % | |||||
| Hydrogen Plant (MSCF/D) |
8,500 | — | ||||||
| Sulfur Recovery Units (Long Tons/day) |
100 | — | ||||||
| TailGas Recovery Units (Long Tons/day) |
4 | — | ||||||
The complexity of a refinery refers to the number, type and capacity of processing units at the refinery and is measured by its Nelson complexity index. Our refinery has a Nelson complexity index of 11.5. Of the 27 operable refineries in the PADD II region, only three have a Nelson complexity index greater than ours. Our refinery’s complexity allows us to process lower cost crude oils into higher value light refined products or transportation fuels (gasoline and distillates), which comprised approximately 79% and 78% of our total refinery production for the nine months ended September 30, 2011 and for the year ended December 31, 2010, respectively.
125
Table of Contents
Index to Financial Statements
Raw Material Supply
The primary input for our refinery is crude oil, which represented approximately 95% and 93% of our total refinery throughput volumes for the nine months ended September 30, 2011 and the year ended December 31, 2010, respectively. We processed approximately 76,829 bpd of crude oil for the nine months ended September 30, 2011 and 74,142 bpd of crude oil for the year ended December 31, 2010. The following table describes the historical feedstocks for our refinery:
| Nine Months Ended September 30 | Year Ended December 31, | |||||||||||||||||||||||||||||||||||||||
| 2011 | % | 2010 | % | 2010 | % | 2009 | % | 2008 | % | |||||||||||||||||||||||||||||||
| (bpd) | ||||||||||||||||||||||||||||||||||||||||
| Refinery Throughput Crude Oil Feedstocks by Location: |
||||||||||||||||||||||||||||||||||||||||
| Canadian and Other International |
40,039 | 52 | % | 39,784 | 54 | % | 41,156 | 56 | % | 48,213 | 65 | % | 45,826 | 63 | % | |||||||||||||||||||||||||
| Domestic |
36,790 | 48 | % | 33,597 | 46 | % | 32,986 | 44 | % | 26,326 | 35 | % | 26,980 | 37 | % | |||||||||||||||||||||||||
|
|
|
|
|
|
|
|
|
|
|
|
|
|
|
|
|
|
|
|
|
|||||||||||||||||||||
| Total Crude Oil |
76,829 | 100 | % | 73,381 | 100 | % | 74,142 | 100 | % | 74,539 | 100 | % | 72,806 | 100 | % | |||||||||||||||||||||||||
|
|
|
|
|
|
|
|
|
|
|
|
|
|
|
|
|
|
|
|
|
|||||||||||||||||||||
| Crude Oil Feedstocks by Type: |
||||||||||||||||||||||||||||||||||||||||
| Light and Intermediate (1) |
54,914 | 71 | % | 55,002 | 75 | % | 55,782 | 75 | % | 59,112 | 79 | % | 61,637 | 85 | % | |||||||||||||||||||||||||
| Heavy (2) |
21,915 | 29 | % | 18,379 | 25 | % | 18,360 | 25 | % | 15,427 | 21 | % | 11,169 | 15 | % | |||||||||||||||||||||||||
|
|
|
|
|
|
|
|
|
|
|
|
|
|
|
|
|
|
|
|
|
|||||||||||||||||||||
| Total Crude Oil |
76,829 | 100 | % | 73,381 | 100 | % | 74,142 | 100 | % | 74,539 | 100 | % | 72,806 | 100 | % | |||||||||||||||||||||||||
|
|
|
|
|
|
|
|
|
|
|
|
|
|
|
|
|
|
|
|
|
|||||||||||||||||||||
| Other Feedstocks/Blendstocks(2): |
||||||||||||||||||||||||||||||||||||||||
| Natural Gasoline |
2,396 | 62 | % | 4,093 | 70 | % | 3,839 | 64 | % | 4,790 | 68 | % | 5,500 | 69 | % | |||||||||||||||||||||||||
| Butanes |
890 | 23 | % | 993 | 17 | % | 1,242 | 21 | % | 1,004 | 14 | % | 930 | 12 | % | |||||||||||||||||||||||||
| Gasoil |
579 | 15 | % | 317 | 5 | % | 446 | 7 | % | 733 | 11 | % | 644 | 8 | % | |||||||||||||||||||||||||
| Other |
0 | 0 | % | 462 | 8 | % | 488 | 8 | % | 497 | 7 | % | 912 | 11 | % | |||||||||||||||||||||||||
|
|
|
|
|
|
|
|
|
|
|
|
|
|
|
|
|
|
|
|
|
|||||||||||||||||||||
| Total Other Feedstocks/Blendstocks |
3,865 | 100 | % | 5,865 | 100 | % | 6,015 | 100 | % | 7,024 | 100 | % | 7,986 | 100 | % | |||||||||||||||||||||||||
|
|
|
|
|
|
|
|
|
|
|
|
|
|
|
|
|
|
|
|
|
|||||||||||||||||||||
| Total Inputs |
80,694 | 79,246 | 80,157 | 81,563 | 80,792 | |||||||||||||||||||||||||||||||||||
| (1) | Crude oil is classified as light, intermediate or heavy, according to its measured American Petroleum Institute, or API, gravity. API gravity, which is expressed in degrees, is a scale developed for measuring the relative density of various petroleum liquids. It also serves as an approximate measure of crude oil’s value, as the higher the API gravity, the richer the yield in high value refined oil products, such as gasoline, diesel and jet fuel. For purposes of categorizing our crude oil feedstocks by type, light crude oil has an API gravity of 33 degrees or more, intermediate crude oil has API gravity between 28 and 33 degrees, and heavy crude has an API gravity of 28 degrees or less. |
| (2) | Other Feedstocks/Blendstocks includes only feedstocks/blendstocks that are used at the refinery, and does not include ethanol and biodiesel. Although we also purchase ethanol and biodiesel to supplement the fuels produced at the refinery, we do not include these in the table as those items are blended at the terminal located adjacent to the refinery or at terminals on the Magellan Pipe Line system. |
Of the crude oil processed at our refinery for the nine months ended September 30, 2011 and for the year ended December 31, 2010, approximately 52% and 56%, respectively, was Canadian crude oil and the remainder was comprised of mostly light sweet crude oil from North Dakota. There is an abundant supply of Canadian crude oil, according to the EIA. Canada exported approximately 2.0 million bpd of crude oil into the United States in 2010, making it the largest exporter to the United States. Crude production from North Dakota has increased significantly from approximately 98,000 bpd in 2005 to approximately 310,000 bpd in 2010, according to the EIA. The chart below shows crude oil bpd production in North Dakota, and illustrates the rapid increase in production attributable to the Bakken Shale. We believe production from the Bakken Shale will continue to increase due to continued growth in unconventional production.
126
Table of Contents
Index to Financial Statements
North Dakota Crude Oil Production (thousands of BPD)
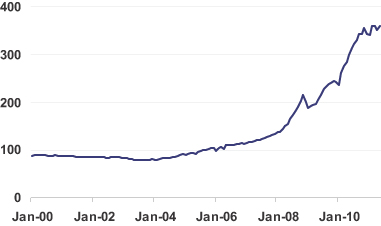
Source: EIA; see “Market and Industry Data and Forecasts.”
Crude Oil Supply
In December 2010, we entered into a five-year crude oil supply and logistics agreement with JPM CCC pursuant to which JPM CCC assists us in the purchase of the crude oil requirements of our refinery. Once we identify cargos of crude oil and pricing terms that meet our requirements, we notify JPM CCC, which then provides, for a fee, credit, transportation and other logistical services for delivery of the crude oil to the Cottage Grove, Minnesota, storage tanks, which are approximately two miles from our refinery. Title to the crude oil passes from JPM CCC to us as the crude oil exits the storage tanks located at Cottage Grove and moves to the refinery. The Cottage Grove storage tanks are leased by JPM CCC from us for the duration of the crude oil supply and logistics agreement. We believe our crude oil supply and logistics agreement significantly reduces the investment that we are required to maintain in crude inventories and allows us to take title to, and price our crude oil, at the refinery, as opposed to the crude oil origination point, because it reduces the time we are exposed to market fluctuations before the finished product output is sold.
We have the right to source crude oil directly from vendors so long as the crude oil sourced and purchased by us is sold immediately to JPM CCC at the injection point on the pipeline. This feature provides us the ability to take advantage of more favorable credit terms, to the extent that such terms arise. In this case, once JPM CCC confirms receipt from us of crude oil in the pipeline, JPM CCC credits the value of that crude oil against that day’s payment obligation for crude oil delivered into the refinery. If the value of the crude oil delivered by us to JPM CCC is less than the amount due on that day, we will pay the balance in cash; if the value of the crude oil is greater than the amount due on that day, we will receive a credit against succeeding payments. In effect, we can pay for crude oil delivered into the refinery with either cash and/or an equivalent value of crude oil.
The approximately 455,000 bpd Minnesota Pipeline system is our primary supply route for crude oil to our refinery and has supplied a significant majority of our crude oil since its major expansion in 2008. The Minnesota Pipeline extends from Clearbrook, Minnesota to the refinery and receives crude oil from Western Canada and North Dakota through connections with various Enbridge pipelines. The Minnesota Pipeline is an interstate crude oil pipeline regulated by FERC pursuant to the ICA. Access to capacity on the Minnesota Pipeline is governed by the pipeline’s tariff, which is filed with FERC and must comply with the applicable provisions of the ICA. Pursuant to the rules and regulations applicable
127
Table of Contents
Index to Financial Statements
to the Minnesota Pipeline, if nominations are received for more crude oil than the pipeline can transport in a given month, capacity is pro-rated based on each shipper’s relative use of the line over the preceding twelve-month period ending the month prior to the month the excess nominations were received, with further reductions as necessary to accommodate new shippers. For each of the nine months ended September 30, 2011 and the year ended December 31, 2010, our shipments comprised approximately 25% of the total volumes shipped on the Minnesota Pipeline. Our 17% interest in the Minnesota Pipe Line Company mitigates the impact of tariff rate increases on the pipeline, as we receive a pro rata share of tariffs. See “—Pipeline Assets” for more information regarding the Minnesota Pipeline system.
In addition to the Minnesota Pipeline, the refinery is also capable of receiving crude oil from the Wood River Pipeline (owned and operated by affiliates of Koch Industries, Inc.). The Wood River Pipeline extends from Wood River, Illinois to a connection with the Minnesota Pipeline near Pine Bend, Minnesota, allowing for deliveries to the refinery and providing the refinery with access to crude supply from the Cushing, Oklahoma area via the Ozark Pipeline and to crude supply from the U.S. Gulf Coast and foreign markets via Capline and Capwood pipelines.
Below is a map illustrating the pipelines that provide the refinery with access to its crude oil supply:
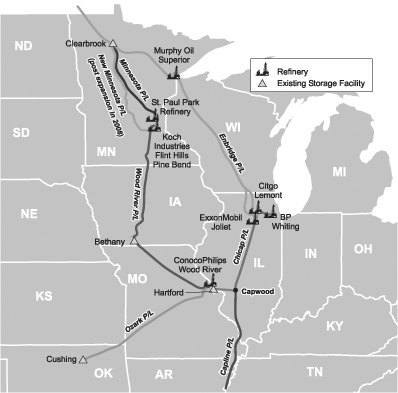
Other Feedstocks/Blendstocks
The refinery also purchases ethanol and biodiesel, as well as conventional petroleum based blendstocks such as natural gasoline to supplement the fuels produced at the refinery. We purchase ethanol for blending with gasoline to meet the EPA’s oxygenated fuel mandate levels. The state of Minnesota has a current mandate for all gasoline power motor vehicles for 10% ethanol blending in gasoline or the maximum amount of ethanol allowed under federal law, whichever is greater. The same
128
Table of Contents
Index to Financial Statements
legislation will require 20% ethanol blending in gasoline or the maximum amount of ethanol allowed under federal law, whichever is greater, effective August 30, 2013. Federal law currently allows a maximum of 15% ethanol for cars and light trucks manufactured since 2001, and 10% ethanol for all other vehicles. In addition, there is a biodiesel mandate in Minnesota requiring the blending of diesel with 5% bio-fuel. If certain preconditions are met, the minimum biodiesel content in diesel sold in the state will increase to 10% beginning on May 1, 2012, and to 20% beginning on May 1, 2015. We purchase ethanol and biodiesel blendstocks pursuant to month-to-month agreements with market related pricing provisions and receive those volumes primarily via truck. We purchase natural gasoline blendstock from third parties that is delivered to us via third party pipeline.
Refined Products—Production, Sales and Transportation
On average over the last three fiscal years, the refinery produced approximately 81,000 bpd of refined products, of which 49% was gasoline, 30% were distillates (including ultra low sulfur diesel and jet fuel), 12% was asphalt and the remainder was made up of propane, heavy fuel and other specialty products. The following table identifies the product yield of our refinery for each of the periods indicated.
| Nine Months Ended September 30, | Year Ended December 31, | |||||||||||||||||||
| 2011 | 2010 | 2010 | 2009 | 2008 | ||||||||||||||||
| (bpd) | ||||||||||||||||||||
| Refinery product yields: |
||||||||||||||||||||
| Gasoline |
40,238 | 40,798 | 41,199 | 42,674 | 41,140 | |||||||||||||||
| Distillate |
23,851 | 21,409 | 22,546 | 22,876 | 24,264 | |||||||||||||||
| Asphalt |
11,169 | 9,313 | 9,495 | 7,688 | 6,499 | |||||||||||||||
| Other |
5,915 | 8,523 | 7,794 | 8,888 | 9,622 | |||||||||||||||
|
|
|
|
|
|
|
|
|
|
|
|||||||||||
| Total Production |
81,173 | 80,043 | 81,034 | 82,126 | 81,525 | |||||||||||||||
|
|
|
|
|
|
|
|
|
|
|
|||||||||||
For the years ended December 2008, 2009 and 2010, gasoline accounted for 50%, 52% and 51% of our total revenue for the refining business for such periods, respectively, and distillates accounted for 30%, 20% and 28% of our total revenue for the refining business for such periods, respectively.
Approximately 90% of the refinery business’s gasoline and diesel volumes were sold within the state of Minnesota for the nine months ended September 30, 2011, with the remainder being sold within Iowa, Nebraska, Oklahoma, South and North Dakota and Wisconsin. Our refinery supplied substantially all of the gasoline and diesel sold in our company-operated or franchised convenience stores for the nine months ended September 30, 2011 and year ended December 31, 2010, as well as supplied 90 independently owned and operated Marathon branded stores in our marketing area. We entered into an agreement with Marathon to supply substantially all of the gasoline and diesel requirements for the 90 independently owned and operated Marathon branded convenience stores in our marketing area.
Primary distribution for the fuels is through our light products terminal, which is equipped with an eight-bay, bottom-loading truck rack and located adjacent to the refinery. Approximately 80% and 75% of our gasoline and diesel volumes for the nine months ended September 30, 2011 and for the year ended December 31, 2010, respectively were transported via this light products terminal to our company-operated or franchised SuperAmerica convenience stores, Marathon branded convenience stores and other resellers throughout our market area. Light refined products, which include gasoline and distillates, are distributed from the refinery through a pipeline and terminal system owned by Magellan, which has facilities throughout the Upper Great Plains. Asphalt and heavy fuel oil are transported from the refinery via truck from our seven-bay heavy products terminal and via rail and barge through our rail facilities and Mississippi River barge dock and sold to a broad customer base. See “—Refining Operations Customers” below.
129
Table of Contents
Index to Financial Statements
Refining Operations Suppliers
The primary input for our refinery is crude oil, which represented approximately 95% and 93% of our total refinery throughput volumes for the nine months ended September 30, 2011 and for the year ended December 31, 2010, respectively. JPM CCC assists us in the purchase of the crude oil requirements of our refinery and provides transportation and other logistical services for delivery of the crude oil to our storage tanks at Cottage Grove, Minnesota, which are approximately two miles from our refinery. We also purchase ethanol and biodiesel, as well as conventional petroleum based blendstocks such as natural gasoline to supplement the fuels produced at the refinery. For more information, see “—Crude Oil Supply” and “—Other Feedstocks/Blendstocks.
Refining Operations Customers
Our refinery supplies substantially all of the gasoline and diesel sold in our company-operated and franchised convenience stores, as well as substantially all of the gasoline and diesel sold in 90 independently owned and operated Marathon branded stores in our marketing area. For each of the nine months ended September 30, 2011 and the year ended December 31, 2010, Marathon branded stores accounted for approximately 9% of our refined product sales volumes. For more information about our contract with Marathon, see “—Refined Products—Production, Sales and Transportation” and for information about the risks associated with our commercial relationship with Marathon, see “Risk Factors—General Business and Industry Risks—Our arrangements with Marathon expose us to Marathon related credit and performance risk.”
Asphalt and heavy fuel oil are sold to a broad customer base, including asphalt paving contractors, government entities (states, counties, cities and townships), and asphalt roofing shingle manufacturers. For more information, see “—Refined Products—Production, Sales and Transportation.”
Turnaround and Refinery Reliability
Periodically, we have planned maintenance turnarounds at our refinery, which require the temporary shutdown of certain operating units. The refinery generally undergoes a major facility turnaround every five to six years, and the last full plant turnaround was completed in 2007. The length of the turnaround is contingent upon the scope of work to be completed. A major turnaround of either of the two main refinery units (fluid catalytic cracking unit and Alkylation unit) generally takes two to four weeks to complete, and is planned and accomplished in a manner that allows for reduced production during maintenance instead of a complete shutdown. We completed a partial turnaround in April 2011, during which we replaced a catalyst in the distillate and gas oil hydrotreaters and conducted basic maintenance on the No. 1 crude unit. The next major turnaround is scheduled for 2013.
Seasonality
Our refining business experiences seasonal effects, as the demand for gasoline products is generally higher during summer months than during winter months due to seasonal increases in highway traffic. Demand for diesel during winter months also decreases due to declines in agricultural work. As a result, our results of operations related to our refinery business for the first and fourth calendar quarters are generally lower than for those for the second and third calendar quarters. In addition, unseasonably cool weather in summer months and/or unseasonably warm weather in winter months in the markets in which we sell our refined products can impact the demand for gasoline and diesel.
Seasonal fluctuations in traffic also affect sales of motor fuels and merchandise in our convenience stores. Weather conditions in our operating area also have a significant effect on our
130
Table of Contents
Index to Financial Statements
retail operating results. Customers are more likely to purchase higher profit margin items at our convenience stores, such as fast foods, fountain drinks and other beverages and more gasoline during the spring and summer months, thereby typically generating higher revenues and gross margins for us in these periods. Unfavorable weather conditions during these months and a resulting lack of the expected seasonal upswings in traffic and sales could impact the demand for such higher profit margin items in those months.
Pipeline Assets
We acquired 17% of the outstanding common interests of the Minnesota Pipe Line Company and a 17% interest in MPL Investments which owns 100% of the preferred interests of the Minnesota Pipe Line Company. The Minnesota Pipe Line Company owns the Minnesota Pipeline, a crude oil pipeline system in Minnesota that transports crude oil to the St. Paul area and which supplies most of our crude oil input. The remaining interests in the Minnesota Pipe Line Company are held by a subsidiary of Koch Industries, Inc., the owner of the only other refinery in Minnesota, with a 74.16% interest, and TROF, Inc. with an 8.84% interest. The Minnesota Pipeline system is also operated by a subsidiary of Koch Industries, Inc. Because we do not operate the Minnesota Pipeline or control the board of managers of the Minnesota Pipe Line Company, we do not control how the Minnesota Pipeline tariff is applied, including the tariff provisions governing the allocation of capacity, or control the decision-making with respect to tariff changes for the pipeline.
The Minnesota Pipeline system has multiple lines that run approximately 300 miles from Clearbrook in Clearwater County, Minnesota to Dakota County, Minnesota, transporting crude oil received through the Enbridge pipeline connections at Clearbrook from Western Canada and North Dakota to our refinery and Koch Industries’s Flint Hills Resources refinery in Minnesota. The system consists of a 24” pipeline, two parallel 16” pipelines and a partial third 16” pipeline with a combined capacity of approximately 455,000 bpd with further expansion capability to 640,000 bpd with the construction of an additional compressor station.
We also own an 8.6 mile 8” products pipeline, referred to as the Aranco Pipeline, which is leased to Magellan and used to ship refined products. The Aranco Pipeline extends from the refinery to a pipeline operated by Magellan as part of its products pipeline system. The pipeline is operated by Magellan as part of their products system. The annual lease fee is approximately $450,000. The term of lease agreement is year-to-year and both parties have the right to terminate upon notice at least 180 days prior to the expiration of the then-current annual term. We sent Magellan a termination notice in November 2011 and will either renegotiate the existing lease or terminate it in May 2012. In addition, we own the Cottage Grove pipelines, which are 16” and 12” pipelines extending from the Cottage Grove tank farm, which is used to house the Cottage Grove storage tanks, to the refinery.
Our Retail Business
We have a retail-marketing network of 233 convenience stores, as of September 30, 2011, located throughout Minnesota, Wisconsin and South Dakota, of which we operate 166 stores and support 67 franchised stores, as set forth by location in the table below. All of our company-operated and franchised convenience stores are operated under the SuperAmerica brand. We also own and operate SuperMom’s Bakery, which prepares and distributes baked goods and other prepared items for sale in our retail outlets and for other third parties. Substantially all of the fuel gallons sold at the 233 convenience stores for the nine months ended September 30, 2011 and the year ended December 31, 2010, respectively, was supplied by our refining business.
In December 2010, we entered into a lease arrangement with Realty Income, pursuant to which we leased 135 SuperAmerica convenience stores and one support facility over a 15-year initial term at
131
Table of Contents
Index to Financial Statements
an aggregate annual rent fixed for five years at an annual rate of $20.3 million, with consumer price index-based rent increases thereafter. The stores covered under the lease are located in Minnesota and Wisconsin, and average approximately 3,500 leasable square feet on approximately 1.14 acres. In addition, the individual locations have, on average, 6.5 multi-pump gasoline dispensers, and are seasoned stores with long-term operating histories. Additionally, 30 of our other company-operated properties are leased pursuant to a combination of ground leases and real property leases with third parties and one company-operated property is owned by us. The table below sets forth our company-operated and franchised stores by state as of September 30, 2011.
| Location |
Company- Operated |
Franchised | Total | |||||||||
| Minnesota |
159 | 61 | 220 | |||||||||
| Wisconsin |
6 | 5 | 11 | |||||||||
| South Dakota |
1 | 1 | 2 | |||||||||
|
|
|
|
|
|
|
|||||||
| Total |
166 | 67 | 233 | |||||||||
|
|
|
|
|
|
|
|||||||
Below is a map illustrating the locations of our convenience stores as of September 30, 2011:
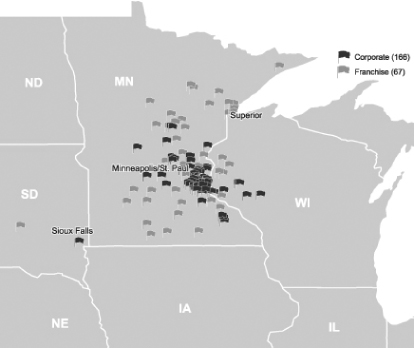
Of our company-operated sites, approximately 80% are open 24 hours per day and the remaining sites are open at least 16 hours per day. Our average store size is approximately 3,400 square feet with approximately 97% of our stores being 2,400 or more square feet. Our convenience stores typically offer tobacco products and immediately consumable items such as non-alcoholic beverages, beer and a large variety of snacks and prepackaged items. A significant number of the sites also offer state sanctioned lottery games, ATM services, money orders and car washes. We also provide support to 67 franchised convenience stores, selling gasoline, merchandise, and other services through SAF. SAF has license agreements in place with each franchisee that, among other things, cover the term of the franchise (generally 10 years), set forth the monthly royalty payments to be paid by franchisees to SAF, authorize the use of proprietary marks and provide for consultation services for the construction and opening of stores. Franchisees are required to pay to SAF an initial license fee (generally, $10,000
132
Table of Contents
Index to Financial Statements
for licensees located in Minnesota and Wisconsin and $2,000 for licensees located in South Dakota) and a royalty fee for all products and merchandise sold at the convenience store, including motor fuel, along with a separate diesel royalty fee. The license agreements also require that, if a franchise store is located within our distribution area, then the franchise store must purchase a high minimum percentage (often 85% to 100%) of its motor fuel supply, including gasoline and distillate, from us. However, if a franchise store is not located within our distribution area, then the franchise store is not required to purchase any portion of its motor fuel supply from us. As of September 30, 2011, 31 of the 67 existing franchise stores are located within our distribution area and, thus, are required to purchase a high minimum percentage of their motor fuel supply from us.
Annual sales of refined products through our 166 owned and leased convenience stores averaged 347 million gallons over the period 2007-2010. The demand for gasoline is seasonal in nature, with higher demand during the summer months. 22.1 % and 25.7% of the retail segment’s revenues were generated from non-fuel sales, including items like cigarettes, beer, milk, food and general merchandise for the nine months ended September 30, 2011 and the year ended December 31, 2010, respectively. The following table summarizes the results of our retail business for the periods indicated.
| Nine Months Ended September 30, |
Year Ended December 31, | |||||||||||||||||||
| 2011 | 2010 | 2010 | 2009 | 2008 | ||||||||||||||||
| Company-operated |
||||||||||||||||||||
| Fuel gallons sold (in millions) |
245.8 | 259.0 | 345.1 | 335.7 | 340.6 | |||||||||||||||
| Retail fuel margin ($/gallon)(1) |
$ | 0.20 | $ | 0.16 | $ | 0.17 | $ | 0.14 | $ | 0.17 | ||||||||||
| Merchandise sales ($ in millions) |
$ | 253.9 | $ | 254.5 | $ | 336.4 | $ | 328.4 | $ | 314.9 | ||||||||||
| Merchandise margin(%)(2) |
25.5 | % | 26.4 | % | 26.1 | % | 26.8 | % | 26.4 | % | ||||||||||
| Number of outlets at year end |
166 | 166 | 166 | 166 | 168 | |||||||||||||||
| Franchised Stores |
||||||||||||||||||||
| Fuel gallons sold (in millions) |
37.5 | 39.1 | 52.4 | 51.3 | 43.0 | |||||||||||||||
| Royalty income (in millions) |
$ | 1.2 | $ | 1.2 | $ | 1.6 | $ | 1.6 | $ | 1.4 | ||||||||||
| Number of outlets at year end |
67 | 67 | 67 | 68 | 64 | |||||||||||||||
| (1) | Retail fuel margin per gallon is calculated by dividing retail fuel gross margin by the fuel gallons sold at company-operated stores. Retail fuel gross margin is a non-GAAP performance measure that we believe is important to investors in evaluating our retail performance. Our calculation of retail fuel gross margin may differ from similar calculations of other companies in our industry, thereby limiting its usefulness as a comparative measure. For a reconciliation of retail fuel gross margin to retail segment operating income, the most directly comparable GAAP measure, see “Prospectus Summary—Summary Historical and Unaudited Pro Forma Condensed Consolidated Financial and Other Data.” |
| (2) | Merchandise margin is expressed as a percentage of the merchandise sales, calculated by subtracting the costs of merchandise from the merchandise sales. Merchandise margin is a non-GAAP performance measure that we believe is important to investors in evaluating our retail performance. Our calculation of merchandise margin may differ from similar calculations of other companies in our industry, thereby limiting its usefulness as a comparative measure. For a reconciliation of merchandise margin to retail segment operating income, the most directly comparable GAAP measure, see “Prospectus Summary — Summary Historical and Unaudited Pro Forma Condensed Consolidated Financial and Other Data.” |
133
Table of Contents
Index to Financial Statements
Retail Operations Suppliers
Our refinery supplies substantially all of the gasoline and diesel sold in our company-operated and franchised convenience stores. We also own and operate SuperMom’s Bakery, which prepares and distributes baked goods and other prepared food items for sale in our SuperAmerica company-operated and franchised convenience stores and other third party locations.
Eby-Brown has been the primary supplier of general retail merchandise, including most tobacco and grocery items, for all our company-operated and franchised convenience stores since 1993. For each of the nine months ended September 30, 2011 and the year ended December 31, 2010, our retail business purchased approximately 80% of its convenience store inside merchandise requirements from Eby-Brown. Our retail business also purchases a variety of merchandise, including soda, beer, bread, dairy products, ice cream and snack foods, directly from a number of third-party manufacturers and their wholesalers. All merchandise is delivered directly to our stores by Eby-Brown, other third-party vendors or our SuperMom’s Bakery business. We do not maintain additional product inventories other than what is in our stores and at SuperMom’s Bakery. For information about the risks associated with our commercial relationship with Eby-Brown, see “Risk Factors — Risks Related to Our Business and Industry — Risks Primarily Related to Our Retail Business — Our retail business depends on one principal supplier for a substantial portion of its merchandise inventory. A change of merchandise suppliers, a disruption in merchandise supply, a significant change in our relationship with our principal merchandise supplier or material changes in the payment terms or availability of trade credit provided by our merchandise suppliers could have a material adverse effect on our retail business and results of operations or liquidity.”
Retail Operations Customers
Our retail customers primarily include retail end-users, motorists and commercial drivers. We have a retail-marketing network of 233 convenience stores, as of September 30, 2011, located throughout Minnesota, Wisconsin and South Dakota, of which we operate 166 stores and support 67 franchised stores.
Competition
Petroleum refining and marketing is highly competitive. With respect to our wholesale gasoline and distillate sales and marketing, we compete directly with Koch Industries’s Flint Hills Resources Refinery in Pine Bend, Minnesota, as well as the other refiners in the PADD II region and, to a lesser extent, major U.S. and foreign refiners. Many of our principal competitors are integrated, multinational oil companies that are substantially larger and more recognized than we are. The principal competitive factors affecting our refining segment are costs of crude oil and other feedstocks, refinery efficiency, refinery product mix and costs of product distribution and transportation. We have no crude oil reserves and are not engaged in the exploration or production of crude oil. We believe that we will be able to obtain adequate crude oil and other feedstocks at generally competitive prices for the foreseeable future.
Our major retail competitors include Holiday and Kwik Trip. The principal competitive factors affecting our retail segment are location of stores, product price and quality, appearance and cleanliness of stores and brand identification. We expect to continue to face competition from large, integrated oil companies, as well as from other convenience stores that sell motor fuels. Increasingly, grocery and dry goods retailers such as Wal-Mart are entering the motor fuel retailing business.
134
Table of Contents
Index to Financial Statements
Insurance and Risk Management
Our operations are subject to significant hazards and risks inherent in refining operations and in transporting and storing crude oil, intermediate products and refined products. Our property damage and business interruption coverage at the refinery has a maximum loss limit of up to $1 billion combined, with no sublimit for business interruption. Our business interruption coverage is for 24 months from the date of the loss, subject to a deductible of 45 days with a minimum loss of $15 million. Our property damage insurance has a deductible of $1 million. In addition, we have a full suite of insurance covering workers compensation, general products liability, directors and officers’ liability, environmental liability, safety and other applicable risk management programs. See also “Risk Factors— General Business and Industry Risks— Our insurance policies may be inadequate or expensive.”
Environmental Regulations
Refining Operations
Our refinery operations are subject to stringent and complex federal, state and local laws and regulations governing the discharge of materials into the environment or otherwise relating to environmental protection. These laws and regulations may obligate us to obtain permits to conduct regulated activities; incur significant capital expenditures to install pollution control equipment; restrict the manner in which we may release materials into the environment; require remedial activities to mitigate pollution from former or current operations; apply specific health and safety criteria addressing worker protection; and impose substantial liabilities on us for pollution resulting from our operations. Certain of these environmental laws impose joint and several, strict liability for costs required to remediate and restore sites where petroleum hydrocarbons, wastes or other materials have been released or disposed. Failure to comply with environmental laws and regulations may result in the triggering of administrative, civil and criminal measures, including the assessment of monetary penalties, the imposition of remedial obligations, and the issuance of injunctions limiting or prohibiting some or all of our operations.
The clear trend in environmental regulation is to place more restrictions and limitations on activities that may affect the environment and any changes in environmental laws and regulations that result in more restrictive and costly emission limits, operational controls, fuel specifications, waste handling, disposal or remediation requirements could have a material adverse effect on our operations and financial position. In the event of future increases in costs, we may be unable to pass on those increases to our customers. There can be no assurance that our future environmental compliance expenditures will not become material.
Air Emissions
Our operations are subject to the federal Clean Air Act, as amended, and comparable state and local laws. Under the Clean Air Act, facilities that emit regulated pollutants, including volatile organic compounds, particulates, sulfur, nitrogen oxides or hazardous air pollutants, face increasingly stringent regulations, including requirements to install various levels of control technology on sources of pollutants. In addition, the petroleum refining sector is subject to stringent new regulations adopted by the EPA, that impose maximum achievable control technology, “MACT,” requirements on refinery equipment emitting certain listed hazardous air pollutants. Air permits are required for our refining operations that result in the emission of regulated air contaminants. These permits incorporate stringent control technology requirements and are subject to extensive review and periodic renewal.
Over the past decade, the EPA has pursued a National Petroleum Refinery Initiative, which is a coordinated, integrated compliance and enforcement strategy to address federal Clean Air Act
135
Table of Contents
Index to Financial Statements
compliance issues at the nation’s largest petroleum refineries. In connection with the initiative, Marathon entered into an environmental settlement agreement with the EPA, the U.S. Department of Justice and the state of Minnesota in May 2001, pursuant to which pollution control equipment was installed to significantly reduce emissions from stacks, wastewater vents, valves and flares at the refinery (the “2001 Consent Decree”). We are currently participating in negotiations with the EPA, the Minnesota Pollution Control Authority (“MPCA”) and Marathon concerning termination of the 2001 Consent Decree as to our refinery. The EPA and the MPCA have proposed modification of the 2001 Consent Decree to reflect the change in ownership of the refinery and to add our subsidiary as a named party. Once the 2001 Consent Decree has been modified, the EPA proposes to terminate the 2001 Consent Decree as to our refinery and to have the MPCA issue an Amended Title V Air Permit to the refinery. The Amended Title V Permit would incorporate the emission limits and requirements set forth in the 2001 Consent Decree. Negotiations regarding modification and termination of the 2001 Consent Decree, as well as submittal of an amended Title V Permit application, are ongoing.
The refinery is obligated to comply with the conditions of its Title V Permit as well as emissions limitations and other requirements imposed under the Clean Air Act and similar state laws and regulations. These requirements are complex and stringent. Any failure to comply with such requirements may result in fines, penalties, and corrective action orders. Such fines, penalties, and corrective action orders could reduce the profitability of our refining operations.
Fuel Quality Requirements
Pursuant to the Energy Policy Act of 2005 and the Energy Independence and Securing Act of 2007, the EPA has issued RFS implementing mandates to blend renewable fuels into petroleum fuels produced and sold in the United States. We are subject to RFS. Under the RFS, the EPA establishes a volume of renewable fuels that obligated refineries must blend into their finished petroleum fuels. The obligated volume increases annually over time until 2022. Our refinery currently generates a surplus of RINS under the RFS for some fuel categories, but we must purchase RINS on the open market for other fuel categories. We must also purchase waiver credits for cellulosic biofuels from the EPA. In the future, we may be required to purchase additional RINS on the open market and waiver credits from the EPA to comply with the RFS. We cannot currently predict the future prices of RINS or waiver credits, but the costs to obtain the necessary number of RINS and waiver credits could be material.
Minnesota law currently requires that all diesel sold in the state for combustion in internal combustion engines must contain at least 5% biodiesel. Under this statute, if certain preconditions are met, the minimum biodiesel content in diesel sold in the state will increase to 10% beginning on May 1, 2012, and to 20% beginning on May 1, 2015. We are installing a new tank at our refinery to store biodiesel to enable us to comply with this mandate. We anticipate that we will spend approximately $1.7 million, in addition to the $1.2 million that we have already spent, to complete the installation of this new biodiesel tank. Minnesota law also currently requires, with limited exceptions, that all gasoline sold or offered for sale in the state must contain the maximum amount of ethanol allowed under federal law for use in all gasoline powered motor vehicles. Federal law currently allows a maximum of 15% ethanol for cars and light trucks manufactured since 2001, and 10% ethanol for all other vehicles.
136
Table of Contents
Index to Financial Statements
Fuels produced at our refinery are currently blended with the appropriate amounts of ethanol or biodiesel to ensure that they comply with applicable federal and state renewable fuel standards. Blending renewable fuels into our finished petroleum fuels to comply with these requirements will displace an increasing volume of a refinery’s product pool.
We also are required to meet the new Mobile Source Air Toxics (“MSAT II”) regulations to reduce the benzene content of gasoline. Under the MSAT II regulations, benzene in the finished gasoline pool must be reduced to an annual average of 0.62 volume percent by January 1, 2011 with or without the use of benzene credits and compliance must be demonstrated by January 1, 2012. Beginning on July 1, 2012, we must also maintain an annual average of 1.30 volume percent benzene without the use of benzene credits. A refinery may generate benzene credits by making reductions in the benzene content of the gasoline that it produces beyond what is required by the applicable regulations. These credits may be utilized by the refinery that generates them for future compliance, or they may be sold to other refineries. Our refinery’s average benzene content for 2011 may exceed the 0.62% limit. If that occurs, we anticipate using benzene credits we have accumulated in prior years and benzene credits purchased on the open market in order to comply with MSAT II requirements. We are also considering operational changes to lower the benzene content of the gasoline we produce. We may be required to purchase additional benzene credits to meet our compliance obligations in the future. The cost for purchase of credits is variable and market driven. If the market price of credits increases in the future, the costs to obtain the necessary number of benzene credits could become material.
We are also subject to other fuel quality requirements under federal and state law, including federal standards governing the maximum sulfur content of gasoline and diesel fuel manufactured at the refinery. If we fail to comply with any of these fuel quality requirements, we could be subject to fines, penalties and corrective action orders.
Climate Change
In response to certain scientific studies suggesting that emissions of greenhouse gases (“GHGs”) and including carbon dioxide and methane, are contributing to the warming of the Earth’s atmosphere and other climatic conditions, both houses of Congress have actively considered legislation to reduce emissions of GHGs, and almost one-half of the states have already taken legal measures to reduce emissions of GHGs, primarily through the planned development of GHG emission inventories and/or regional GHG cap and trade programs. Most of these cap and trade programs work by requiring either major sources of emissions or major producers of fuels to acquire and surrender emission allowances, with the number of allowances available for purchase reduced each year until the overall GHG emission reduction goal is achieved. These allowances would be expected to escalate significantly in cost over time. Although it is not possible at this time to predict if or when Congress may pass climate change legislation, any future federal laws that may be adopted to address GHG emissions would likely require us to incur increased operating costs and could adversely affect demand for the refined petroleum products we produce.
In addition, on December 15, 2009, the EPA published its findings that emissions of GHGs present an endangerment to public health and the environment. These findings allow the EPA to adopt and implement regulations that would restrict emissions of GHGs under existing provisions of the federal Clean Air Act. The EPA has adopted two sets of regulations under the Clean Air Act. The first limits emissions of GHGs from motor vehicles beginning with the 2012 model year. The EPA has asserted that these final motor vehicle GHG emission standards trigger Clean Air Act construction and operating permit requirements for stationary sources, commencing when the motor vehicle standards took effect on January 2, 2011. On June 3, 2010, the EPA published its final rule to address the permitting of GHG emissions from stationary sources under the Prevention of Significant Deterioration (“PSD”) and Title V permitting programs. This rule “tailors” these permitting programs to apply to
137
Table of Contents
Index to Financial Statements
certain stationary sources of GHG emissions in a multi-step process, with the largest sources first subject to permitting. Facilities required to obtain PSD permits for their GHG emissions also will be required to reduce those emissions according to “best available control technology” standards (“BACT”) for GHG that have yet to be fully developed. The EPA issued guidance in November 2010 to industry and permitting authorities on how to determine BACT for GHG emissions from new and modified sources. In addition, on October 30, 2009, the EPA published a final rule requiring the reporting of GHG emissions from specified large GHG emission sources in the United States, including refineries, on an annual basis, beginning in 2011 for emissions occurring after January 1, 2010. We have been monitoring GHG emissions, and submitted our first annual report on these emissions to EPA in September 2011. The adoption of any regulations that require reporting of GHGs or otherwise limits emissions of GHGs from our refinery could require us to incur significant costs and expenses and such requirements also could adversely affect demand for the refined petroleum products that we produce.
Hazardous Substances and Wastes
The Comprehensive Environmental Response, Compensation and Liability Act, as amended (“CERCLA”), also known as the “Superfund” law, and comparable state laws impose liability without regard to fault or the legality of the original conduct, on certain classes of persons who are considered to be responsible for the release of a hazardous substance into the environment. Such classes of persons include the current and past owners and operators of sites where a hazardous substance was released, and companies that disposed or arranged for disposal of hazardous substances at offsite locations, such as landfills. Under CERCLA, these “responsible persons” may be subject to joint and several, strict liability for the costs of cleaning up the hazardous substances that have been released into the environment, for damages to natural resources, for costs incurred by third parties and for the costs of certain environmental and health studies. It is not uncommon for neighboring landowners and other third parties to file claims for personal injury and property damage allegedly caused by the release of hazardous substances into the environment. In the course of our operations, we generate wastes or handle substances that may be regulated as hazardous substances, and we could become subject to liability under CERCLA and comparable state laws.
We also may incur liability under the Resource Conservation and Recovery Act (“RCRA”), and comparable state and local laws, which impose requirements related to the handling, storage, treatment, and disposal of solid and hazardous wastes. In the course of our operations, we generate petroleum product wastes and ordinary industrial wastes, such as paint wastes, waste solvents, and waste oils that may be regulated as hazardous wastes. In addition, our operations also generate solid wastes, which are regulated under RCRA and state law.
Our refinery site has been used for refining activities for many years. Although prior owners may have used operating and waste disposal practices that were standard in the industry at the time, petroleum hydrocarbons and various wastes have been released on or under our refinery site. There has been remediation of soil and groundwater contamination beneath the refinery for many years, and we are required to continue to monitor and perform corrective actions for this contamination until the applicable regulatory standards have been achieved. This remediation is being overseen by the MPCA pursuant to a compliance agreement entered into by Marathon and the agency in 2007. Based on current investigative and remedial activities, we believe that the contamination can be controlled or remedied without having a material adverse effect on our financial condition. However, such costs are often unpredictable, and there can be no assurance that future costs will not become material. We currently anticipate that we will incur costs of approximately $431,000 in 2011 and an additional approximate $2.0 million through the year 2023 in connection with continued monitoring and remediation of this contamination at the refinery.
138
Table of Contents
Index to Financial Statements
Water Discharges
The Federal Water Pollution Control Act of 1972, as amended, also known as the Clean Water Act, and analogous state laws impose restrictions and stringent controls on the discharge of pollutants, including oil, into federal and state waters. Such discharges are prohibited, except in accordance with the terms of a permit issued by the EPA or the MPCA. Any unpermitted release of pollutants, including crude oil as well as refined products, could result in penalties, as well as significant remedial obligations. The spill prevention, control, and countermeasure requirements of federal and state laws require containment, such as berms or similar structures, to help prevent the contamination of navigable waters in the event of a petroleum hydrocarbon tank spill, rupture, or leak.
The refinery’s wastewater treatment plant utilizes two lagoons. Prior to our ownership of the refinery, Marathon reported to us and to the MPCA several instances in which concentrations of benzene in the wastewater flowing into the first lagoon exceeded the level that could potentially subject the lagoon to regulation as a hazardous waste unit. Since December 2010, we have experienced only three exceedances of benzene discharges into the lagoons and none since March 2011. We have reported the three known instances that have occurred during our period of ownership to the MPCA, and the refinery has engaged in discussions with the MPCA regarding the implications and appropriate responses to these instances. If the benzene level was exceeded, the refinery could be subject to fines and penalties, and if no exemption from hazardous waste regulation applies, the refinery may be required to incur additional capital and operating costs and expenses. The MPCA initiated enforcement against Marathon and us relating to the instances of potentially excessive concentrations of benzene entering the lagoons that occurred during each company’s respective period of ownership. Marathon settled with the State of Minnesota in November 2011. The MPCA enforcement against us remains pending. There can be no assurance that any fines, penalties, costs and expenses that we may incur will not become material. Under the agreements that we entered into with Marathon at the time of the acquisitions, we have the ability to seek reimbursement from Marathon on certain capital costs and expenses that we may incur in connection with any such enforcement action.
Environmental Capital and Maintenance Projects
A number of capital projects are planned for continued environmental compliance at our refinery. For example, in April of 2010, the MPCA issued a new permit that will govern stormwater discharges at the refinery. This new permit included a new effluent standard for total suspended solids (“TSS”). We plan to spend approximately $2.0 million over the next three years in order that the refinery will comply with the TSS standard by 2013, within the time allowed by the permit. We plan to spend approximately $1.0 million over the next four years on a number of additional, smaller capital projects at the refinery related to environmental compliance. Additionally, we are currently evaluating upgrades to the refinery’s wastewater treatment plant, potentially including changes to the process used to treat the wastewater, construction of new tanks, closure of one or more existing lagoons, and dredging and disposal of sludge that has accumulated in the lagoons. Depending on the final scope of the wastewater treatment plant upgrades, which will be subject to approval and permitting by the MPCA, we estimate that costs could be as high as $35 million over the next two years, beginning in 2012. Pursuant to the agreements entered into in connection with the Marathon Acquisition, Marathon may reimburse us for a portion of the costs and expenses incurred in these wastewater treatment plant upgrades.
Health, Safety and Maintenance
We are subject to the requirements of the federal Occupational Safety and Health Act (“OSHA”) and comparable state occupational safety laws. These laws and the implementing regulations strictly govern the protection of the health and safety of employees. In addition, OSHA’s hazard communication standard requires that information be maintained about hazardous materials used or produced in our operations and that this information be available to employees and contractors and,
139
Table of Contents
Index to Financial Statements
where required, to state and local government authorities and to local residents. We provide all required information to employees and contractors on how to avoid or protect against exposure to hazardous materials present in our operations. Also, we maintain safety, training, and maintenance programs as part of our ongoing efforts to ensure compliance with applicable laws and regulations. We believe that the refinery is in substantial compliance with OSHA and similar state laws, including general industry standards, recordkeeping and reporting, hazard communication and process safety management. The refinery is currently in the process of installing Safety Instrumented Systems to enhance its safety program, and the estimated costs for these installations are $12.3 million over the next 2 years.
Pipelines
We own three pipelines: (1) the “Aranco Pipeline,” which connects the refinery to a pipeline owned by Magellan, (2) a 16” pipeline connecting the refinery to the Cottage Grove tank farm and (3) a 12” pipeline connecting the refinery to the Cottage Grove tank farm. Potential environmental liabilities associated with pipeline operation include costs incurred for remediating spills or releases and maintaining the integrity of the pipeline to prevent such spills and releases. Under a lease agreement, Magellan operates the Aranco Pipeline and bears the responsibility and costs for any leaks or spills from the Aranco Pipeline, as well as for maintenance activities.
We also own an equity interest in the Minnesota Pipe Line Company, which owns and operates the pipeline that provides the primary supply of crude oil to the refinery. The Minnesota Pipe Line Company bears the responsibility and costs for any leaks or spills from the pipeline, as well as for maintenance activities.
Retail Business
Our retail business operates convenience stores with fuel stations in Minnesota, Wisconsin, and South Dakota. Each retail station has underground fuel storage tanks, which are subject to federal and state regulations. Complying with these underground storage tank regulations can be costly. The operation of underground storage tanks also poses environmental risks, including the potential for fuel releases and soil and groundwater contamination. We are currently completing the investigation and remediation of reported leaks from underground storage tanks at a number of our convenience stores. We currently anticipate that the known contamination at these stores can be remediated for approximately $370,000 through the end of 2012. It is possible that we may identify more leaks or contamination in the future that could result in fines or civil liability for us, as well as remediation obligations and expenses. States, including Minnesota, have established funds to reimburse some expenses associated with remediating leaks from underground storage tanks, but such state reimbursement funds may not cover all remediation costs.
Other Government Regulation
Our transportation activities are subject to regulation by multiple governmental agencies. Our projected expenditures related to the Minnesota Pipeline reflect the recurring costs resulting from compliance with these regulations, and these costs may increase due to future acquisitions, changes in regulation, changes in use, ongoing expenditures to maintain reliability and efficiency or discovery of existing but unknown compliance issues. Further, the regulatory burden on the industry increases the cost of doing business and affects profitability. Additional proposals and proceedings that affect the oil industry are regularly considered by Congress, the states, FERC, and the courts. We cannot predict when or whether any such proposals may become effective or what impact such proposals may have.
140
Table of Contents
Index to Financial Statements
The ICA and its implementing regulations give FERC authority to regulate the rates and the terms and conditions of service of interstate common carrier oil pipelines, such as the Minnesota Pipeline. The ICA and its implementing regulations require that tariff rates and terms and conditions of service of interstate common carrier oil pipelines be just and reasonable and not unduly discriminatory or preferential. The ICA also requires that oil pipeline tariffs setting forth transportation rates and the rules and regulations governing transportation services be filed with FERC.
In October 1992, Congress passed the Energy Policy Act of 1992 (“EPAct”), which, among other things, required FERC to issue rules to establish a simplified and generally applicable ratemaking methodology for petroleum pipelines and to streamline procedures in petroleum pipeline proceedings. FERC responded to this mandate by establishing a methodology for petroleum pipelines to change their rates within prescribed ceiling levels that are tied to an inflation index. Pipelines are allowed to raise their rates to the rate ceiling level generated by application of the index. If the methodology reduces the ceiling level such that it is lower than a pipeline’s filed rate, the pipeline must reduce its rate to conform with the lower ceiling unless doing so would reduce a rate “grandfathered” by EPAct to below the grandfathered level. A pipeline must, as a general rule, use the indexing methodology to change its rates. FERC, however, retained cost-of-service ratemaking, market based rates, agreement with an unaffiliated shipper, and settlement as alternatives to the indexing approach that may be used in certain specified circumstances. The Minnesota Pipeline currently uses the indexing methodology to set its tariff rates. In order for the Minnesota Pipeline to increase rates beyond the maximum allowed by the indexing methodology, it must file a cost-of-service justification, obtain approval from an unaffiliated party that intends to ship on the pipeline (with respect to initial rates for any new service), obtain approval from all current shippers (i.e., settlement), or obtain prior approval to file market-based rates. We do not control the board of managers of the Minnesota Pipe Line Company and thus do not control the decision-making with respect to tariff changes for the Minnesota Pipeline.
FERC’s indexing methodology is subject to review every five years. In an order issued in December 2010, FERC announced that, effective July 1, 2011, the index would equal the change in the producer price index for finished goods plus 2.65% (previously, the index was equal to the change in the producer price index for finished goods plus 1.3%). This index is to be in effect through July 2016. The current or any revised indexing formula could hamper our ability to recover our costs because: (1) the indexing methodology is tied to an inflation index; (2) it is not based on pipeline-specific costs; and (3) it could be reduced in comparison to the current formula. Further, shippers may protest rate increases made within the ceiling levels, but such protests must show that the portion of the rate increase resulting from application of the index is substantially in excess of the pipeline’s increase in costs from the previous year and that the pipeline is substantially over-recovering its cost of service. Shippers may also file complaints against index-based rates, but such complaints must show that the pipeline is substantially over-recovering its cost of service and that application of the index substantially exacerbates that over-recovery. In addition, due to the common carrier regulatory obligation applicable to interstate oil pipelines, capacity must be prorated among shippers in an equitable manner in accordance with the tariff then in effect in the event there are nominations in excess of capacity. Therefore, nominations by new shippers or increased nominations by existing shippers may reduce the capacity available to us.
EPAct deemed petroleum pipeline rates in effect for the 365-day period ending on the date of enactment of EPAct that had not been subject to complaint, protest or investigation during that 365-day period to be just and reasonable under the ICA (“grandfathered”). There are grandfathered rates underlying Minnesota Pipeline’s current rates. Absent a successful challenge against the grandfathered rates, these rates act as a floor below which the pipeline’s rates cannot be lowered. Generally, shippers challenging grandfathered rates must show that a substantial change has occurred since the enactment of EPAct in either the economic circumstances of the oil pipeline, or in the nature of the services provided, that were a basis for the rate. EPAct places no such limit on challenges to a
141
Table of Contents
Index to Financial Statements
provision of an oil pipeline tariff as unduly discriminatory or preferential. If a shipper were to successfully challenge the grandfathered portion of the Minnesota Pipeline’s rates, the Minnesota Pipeline would no longer benefit from the floor provided by these grandfathered rates and could adversely affect the Minnesota Pipe Line Company’s financial position, cash flows and results of operations.
Under certain circumstances, including a change in FERC’s ratemaking methodology for oil pipelines or a protest or complaint filed by a shipper, FERC could limit the Minnesota Pipe Line Company’s ability to set rates based on its costs, could order it to reduce its rates, and/or could require the payment of refunds and/or reparations to shippers. Rate regulation or a successful challenge to the rates the Minnesota Pipeline charges could adversely affect its financial position, cash flows, or results of operations. Conversely, reduced rates on the Minnesota Pipeline will reduce the rates we are charged as a shipper for transportation of crude oil on the Minnesota Pipeline into our refinery. If FERC found the Minnesota Pipeline’s terms of service to be contrary to statutory requirements, FERC could impose conditions it considers appropriate and/or impose penalties. Further, FERC could declare non-jurisdictional facilities to be common carrier facilities and require that common carrier access be provided or otherwise alter the terms of service and/or rates of such facilities, to the extent applicable.
The Aranco Pipeline, currently leased to and operated by Magellan, is part of Magellan’s interstate pipeline system and, as a result, we are not required to maintain a tariff with respect to the Aranco Pipeline. If this lease were to be terminated and the pipeline were used to transport crude oil or petroleum products in interstate commerce, the Aranco Pipeline would be subject to the interstate common carrier regulatory regime discussed above in the context of the Minnesota Pipeline and we would be required to comply with such regulation in order to operate the Aranco Pipeline. In addition, if the 16” and/or 12” pipeline connecting the refinery to the Cottage Grove tank farm were to provide interstate crude oil or petroleum product transportation service, they would be subject to the same interstate common carrier regulatory regime discussed above.
The Federal Trade Commission, FERC and the Commodity Futures Trading Commission hold statutory authority to monitor certain segments of the physical and futures energy commodities markets. These agencies have imposed broad regulations prohibiting fraud and manipulation of such markets. With regard to our physical sales of oil or other energy commodities, and any related hedging activities that we undertake, we are required to observe the market-related regulations enforced by these agencies, which hold substantial enforcement authority. Failure to comply with such regulations, as interpreted and enforced, could have a material adverse effect on our business, results of operations, and financial condition.
Our petroleum pipeline facilities are also subject to regulation by the U.S. Department of Transportation with respect to their design, installation, testing, construction, operation, replacement and management. We are also subject to the requirements of the Federal Occupational Safety and Health Act and other comparable federal and state statutes that address employee health and safety. Compliance costs associated with these regulations can potentially be significant, particularly if higher industry and regulatory safety standards are imposed in the future.
Legal Proceedings
We are not currently a party to any legal proceedings that, if determined adversely against us, individually or in the aggregate, would have a material adverse effect on our financial position, results of operations or cash flows. Marathon, however, is a named defendant in certain lawsuits, investigations and claims arising in the ordinary course of conducting the business relating to the assets we acquired from Marathon, including certain environmental claims and employee-related matters. For a discussion of certain environmental settlements and consent decrees relating to the
142
Table of Contents
Index to Financial Statements
assets we acquired from Marathon, see “—Environmental Regulations.” While the outcome of these lawsuits, investigations and claims against Marathon cannot be predicted with certainty, we do not expect these matters to have a material adverse impact on our business, results of operations, cash flows or financial condition. We have not assumed any liabilities arising out of these lawsuits, investigations and claims against Marathon. Marathon also has indemnification obligations to us pursuant to the agreements entered into in connection with the Marathon Acquisition. Marathon’s indemnification obligation resulting from any breach of representations and warranties generally are limited by an indemnification deductible of $25 million and an indemnification ceiling of $100 million and are guaranteed by Marathon Petroleum. In addition, from time to time, we are involved in lawsuits, investigations and claims arising out of our operations in the ordinary course of business.
Intellectual Property
We hold and use certain trade secret and confidential information related specifically to our refining operations. In addition, we are party to various process license agreements that allow us to use certain intellectual property rights of third parties in our refining operations pursuant to fully-paid up licenses. We do not own any patents relating to the refining business but license a limited number of patents from Marathon based on the previous use of such patents in our refining operations.
Employees
As of October 1, 2011, we employed 642 people, including 229 employees associated with the operations of our refining business and 361 employees associated with the operations of our retail business. Our future success will depend partially on our ability to attract, retain and motivate qualified personnel. As of October 1, 2011, Marathon was still providing approximately 2,350 employees through our transition services agreement. We expect substantially all of the remainder of the Marathon employees will be transitioned by January 1, 2012, at which point we will have a total of approximately 3,000 employees. Once all of the Marathon employees have been transitioned to us, we will be party to collective bargaining agreements covering approximately 170 of our 400 employees associated with the operations of our refining business and 20 of our 2,500 employees associated with the operations of our retail business. The collective bargaining agreements covering the employees associated with our refining and retail businesses expire in December 2013 and August 2012, respectively. We consider our relations with our employees to be satisfactory.
Properties
Our principal executive offices are located at 38C Grove Street, Suite 100, Ridgefield, Connecticut 06877. The location and general character of our principal refineries, retail locations and other important physical properties have been described by segment under “—Our Refining Business” and “—Our Retail Business.” We believe that our properties and facilities are generally adequate for our operations and that our facilities are maintained in a good state of repair. We are the lessee under a number of cancelable and non-cancelable leases for certain properties. Our leases are discussed more fully in Note 17 to our audited consolidated financial statements.
143
Table of Contents
Index to Financial Statements
Directors and Executive Officers
The following table sets forth information regarding our directors and executive officers. There are no family relationships among any of our directors or executive officers.
| Name |
Age (as of September 30, 2011) |
Title | ||
| Dan F. Smith |
65 | Chairman of the Board of Directors | ||
| Mario E. Rodriguez |
44 | Chief Executive Officer and Director | ||
| Hank Kuchta |
55 | President, Chief Operating Officer and Director | ||
| Bernard W. Aronson |
65 | Director | ||
| Jonathan Ginns |
47 | Director | ||
| Michael MacDougall |
40 | Director | ||
| Eric Liaw |
31 | Director | ||
| Thomas Hofmann |
60 | Director | ||
| Scott D. Josey |
54 | Director | ||
| David Bonczek |
42 | Vice President and Chief Financial Officer | ||
| Greg Mullins |
59 | President, St. Paul Park Refining Company |
Set forth below is a description of the backgrounds of our directors and executive officers.
Dan F. Smith has served as Chairman of the board of directors of our Company and Northern Tier Energy LLC since November 2011 and as a director of our company since its formation in October 2011 and of Northern Tier Energy LLC since May 2011. Mr. Smith is the former chairman, president and chief executive officer of Lyondell Chemical Company. He began his career with ARCO (Atlantic Richfield Company) in 1968 as an engineer. He was elected president of Lyondell Chemical Company in August 1994, chief executive officer in December 1996 and chairman of the board of directors in May 2007. Mr. Smith retired in December 2007 from Lyondell Chemical Company following the acquisition of Lyondell by Basell Polyolefins. Mr. Smith also served as chief executive officer of Equistar Chemicals, LP from December 1997 through December 2007 and as chief executive officer of Millennium Chemicals Inc. from November 2004 until December 2007. Equistar and Millennium are wholly owned subsidiaries of Lyondell. Since retiring from Lyondell in December 2007, Mr. Smith has served as a director of a number of companies. Mr. Smith has been a director of Cooper Industries, PLC since 1998, chairman and a director of Kraton Performance Polymers, Inc. since 2008, chairman and a director of Valerus Compression Services, L.P. since 2010, and chairman and a director of Nexeo Solutions, LLC since 2011. He also serves as a member of the College of Engineering Advisory Council at Lamar University. Mr. Smith is a graduate of Lamar University with a B.S. degree in chemical engineering.
Mr. Smith brings valuable expertise to the board due to his extensive executive experience at the highest levels, including more than ten years of experience as the chief executive officer of a major chemical company.
Mario E. Rodriguez has served as Chief Executive Officer and a director of our company since its formation in October 2011 and of Northern Tier Energy LLC since December 2010. Mr. Rodriguez founded NTR Partners LLC, an investment partnership focused on the petroleum refining sector, in 2006. Mr. Rodriguez served as president and chief executive officer of NTR Partners LLC from 2006 to 2010 and was chief executive officer of NTR Acquisition Co., an AMEX-hosted company formed for the acquisition of refining assets, from 2006 to 2009. Prior to founding NTR Partners LLC, Mr. Rodriguez was a managing director in the Global Energy Investment Banking Division of Citigroup Global Markets
144
Table of Contents
Index to Financial Statements
from 2000 to 2006. Prior to Citigroup, he was a Vice President in the Natural Resources & Power Group of J.P. Morgan & Co. and a Consultant in the Energy Directorate of Arthur D. Little, Inc. He received a B.S. in mechanical engineering from Universidad Simon Bolivar, Caracas, Venezuela and an M.B.A. from Harvard Business School.
These experiences, combined with Mr. Rodriguez’s talent for leadership and his long-term strategic perspective, offer significant benefits to Northern Tier Energy, Inc. as a large and complex company.
Hank Kuchta has served as President and Chief Operating Officer and a director of our Company since its formation in October 2011 and of Northern Tier Energy LLC since December 2010. Since 2006, Mr. Kuchta has been a member of NTR Partners LLC. Mr. Kuchta served as a director as well as president and chief operating officer of NTR Acquisition Co. from 2006 to 2009. Prior to NTR Partners LLC, Mr. Kuchta served as president of Premcor, Inc. from 2003 until 2005 and as chief operating officer of Premcor, Inc. from 2002 until 2005. In 2002, Mr. Kuchta served as executive vice president-refining of Premcor. Premcor operated four refineries in the United States and had approximately 750,000 bpd of refining capacity at the time of its sale to Valero Energy Corporation in April 2005. From 2001 until 2002, Mr. Kuchta served as business development manager for Phillips 66 Company following Phillips’ 2001 acquisition of Tosco Corporation. Prior to Phillips, Mr. Kuchta served in various corporate, commercial and refining positions at Tosco Corporation from 1993 to 2001. Before joining Tosco, Mr. Kuchta spent 12 years at Exxon Corporation in various refining, engineering and financial positions, including assignments overseas. He holds a B.S. in chemical engineering from Wayne State University.
Mr. Kuchta’s extensive operational experience in the refining industry gives him an appreciation for the business practices that are critical to the success of a growing business such as ours.
Bernard W. Aronson has served as a director of our Company since its formation in October 2011 and of Northern Tier Energy LLC since December 2010. Mr. Aronson co-founded ACON Investments LLC in 1996 and has served as managing partner of ACON Investments, L.L.C. since 1996. He has previously served as international advisor to Goldman, Sachs & Co., executive speechwriter and special assistant to the Vice President of the United States and Assistant Secretary of State for Inter-American Affairs. Following his State Department service from 1989 to 1993, he was presented the Distinguished Service Award by the Secretary of State, the State Department’s highest honor. Mr. Aronson has served on the board of directors of Hyatt Hotels Corp since 2004, Liz Claiborne Inc. since 1998, Royal Caribbean Cruise Lines since 1993, and Chroma Oil & Gas since 2008. He chairs the governance committee of Hyatt. He served as Director and Chair of the Governance Committee of Mariner Energy Inc. until November 2010 when Mariner Energy merged with Apache Oil and Gas. Mr. Aronson also serves on the board of directors of The National Democratic Institute for International Affairs and the Maryland/D.C. chapter of the Nature Conservancy. He is a member of the Council on Foreign Relations and the Inter-American Dialogue. Mr. Aronson graduated with honors from the University of Chicago.
Mr. Aronson has significant corporate governance experience as a result of having served on a number of public company boards of directors and board committees. He also brings valuable knowledge of the energy industry as a result of his services on the board of directors of Mariner Energy.
Jonathan Ginns has served as a director of our Company since its formation in October 2011 and of Northern Tier Energy LLC since December 2010. Mr. Ginns co-founded ACON Investments LLC in 1996 and has served as managing partner of ACON Investments, L.L.C since 1996. Mr. Ginns has served on a number of public and private boards of directors. He has served on the board of
145
Table of Contents
Index to Financial Statements
directors of Signal International Inc. since 2003, Milagro Exploration since 2007 and Chroma Oil & Gas Corp since 2008. Mr. Ginns received an M.B.A. from the Harvard Business School, and a B.A. from Brandeis University.
Mr. Ginns’ background as a member of multiple public company boards of directors and familiarity with the energy industry are both assets to the board.
Michael MacDougall has served as a director of our Company since its formation in October 2011 and of Northern Tier Energy LLC since December 2010. Mr. MacDougall is a partner of TPG Capital. Mr. MacDougall leads the firm’s global energy and natural resources investing efforts. Prior to joining TPG Capital in 2002, Mr. MacDougall was a vice president in the Principal Investment Area of the Merchant Banking Division of Goldman, Sachs & Co., where he focused on private equity and mezzanine investments. He is a director of Amber Holdings (successor to certain assets of Alinta Energy), Copano Energy, L.L.C., Energy Future Holdings Corp. (formally TXU Corp.), Graphic Packaging Holding Company, Harvester Holdings, L.L.C. and Nexeo Solutions, LLC, and is a director of the general partner of Valerus Compression Services, L.P. He is also a member of the board of directors of the Dwight School Foundation, Islesboro Affordable Property, The Opportunity Network and The University of Texas Development Board. Mr. MacDougall received his B.B.A., with highest honors, from The University of Texas at Austin and received his M.B.A., with distinction, from Harvard Business School.
Mr. MacDougall’s extensive transactional and investment banking experience, his experience as a private equity investor and his experience as a director of other public companies enable Mr. MacDougall to provide valuable insight regarding complex financial and strategic issues in our industry.
Eric Liaw has served as a director of our Company since its formation in October 2011 and of Northern Tier Energy LLC since December 2010. Mr. Liaw is a vice president of TPG Capital. Mr. Liaw is focused on the firm’s global energy and natural resources investing efforts. Prior to joining TPG Capital in 2008, Mr. Liaw attended Harvard Business School from 2006 to 2008. Prior to attending Harvard Business School, Mr. Liaw was an associate at Bain Capital from 2004 to 2006, where he focused on private equity investments. He is a director of Harvester Holdings, L.L.C. and a director of Valerus Compression Services, L.P. Mr. Liaw received his B.A., with highest honors, and B.B.A., with highest honors, from the University of Texas at Austin and received his M.B.A., with distinction, from Harvard Business School.
Mr. Liaw’s knowledge of the energy and natural resources industry, his transactional experience as a private equity investor, and his experience on the boards of Harvester Holdings, L.L.C. and Valerus Compression Services, L.P. make him a valuable asset to the board.
Thomas Hofmann has served as a director of our Company since its formation in October 2011 and of Northern Tier Energy LLC since May 2011. Since December 2008, Mr. Hofmann has been retired. Mr. Hofmann served as senior vice president and chief financial officer of Sunoco, Inc., an oil refining and marketing company, from January 2002 to December 2008. Mr. Hofmann also serves as a director of West Pharmaceuticals Services, Inc. and a director of the general partner of Penn Virginia Resource Partners, L.P. In the last five years, he has also served on the board of directors of the general partner of Sunoco Logistics Partners, L.P. and VIASYS Healthcare Inc. Mr. Hofmann received a B.S. degree from the University of Delaware and a master’s degree from Villanova University.
As the former chief financial officer of Sunoco, Inc., Mr. Hofmann has substantial experience and knowledge regarding financial issues related to energy companies and the energy industry. His extensive financial, management and strategic experiences allow him to provide critical insights to the board.
146
Table of Contents
Index to Financial Statements
Scott D. Josey has served as a director of our Company since its formation in October 2011 and of Northern Tier Energy LLC since May 2011. Since October 2011, Mr. Josey has been the chief executive officer of Sequitur Energy Management LLC, which performs management oversight services for exploration and production companies. Mr. Josey has owned Chromatic Industries since May 2011, which provides engineered valves to the energy industry. Mr. Josey is the former chairman, president and chief executive officer of Mariner Energy, Inc. He served as the chairman of the board of Mariner Energy, Inc. from August 2001 until November 2010, when Mariner merged with Apache Corporation. He was appointed chief executive officer of Mariner in October 2002 and president in February 2005. From 2000 to 2002, he served as vice president of Enron North America Corp. and co-managed its Energy Capital Resources group. From 1995 to 2000, Mr. Josey provided investment banking services to the oil and gas industry and portfolio management services to institutional investors as a co-founder of Sagestone Capital Partners. From 1993 to 1995, he was a director with Enron Capital & Trade Resources Corp. in its energy investment group. From 1982 to 1993, he worked in all phases of drilling, production, pipeline, corporate planning and commercial activities at Texas Oil and Gas Corp. Since February 2011, Mr. Josey has served as a director of Apache Corporation and currently serves on the executive committee. He is a member of the board and chairman of the compensation committee of the Association of Former Students of Texas A&M University and is also a member of the Society of Petroleum Engineers and the Independent Petroleum Association of America. Mr. Josey obtained a B.S. degree in mechanical engineering from Texas A&M University, his M.B.A. from the University of Texas at Austin and his M.S. in petroleum engineering from the University of Houston.
Mr. Josey has spent his entire 30-year career in the oil and gas industry and as the former chief executive officer of Mariner Energy, Inc., he gained extensive management, financial and technical expertise in the energy field, which brings valuable experience to the board.
David Bonczek has served as Vice President and Chief Financial Officer of our Company since its formation in October 2011 and of Northern Tier Energy LLC since August 2011. Mr. Bonczek previously served as the chief accounting officer for Northern Tier Energy LLC from March to August 2011. Prior to joining Northern Tier Energy LLC, Mr. Bonczek was assistant corporate controller at Chemtura Corporation, a NYSE-listed company, from April 2008 through March 2011. From September 1998 through March 2008, Mr. Bonczek held finance management positions within Eastman Kodak including corporate controller of their Kodak Polychrome Graphics joint venture. Mr. Bonczek began his career with KPMG where his last position was senior manager in their audit practice. Mr. Bonczek received a B.S. degree in accounting from Binghamton University, and he is a Certified Public Accountant.
Greg Mullins has served as President, St. Paul Park Refining Company, since December 2010. Mr. Mullins has a B.S. in chemical engineering from Wayne State University and worked for Marathon Petroleum from 1978 until January 2008. From January 2008 until August 2010, Mr. Mullins was retired. From August 2010 until joining St. Paul Park Refining Co. LLC in December 2010, Mr. Mullins performed consulting work for NTR Partners LLC. During his career with Marathon, Mr. Mullins worked at several of Marathon’s refineries as well as the Findlay, Ohio corporate offices. He has extensive experience in all aspects of refinery operations and management as well as major project development and project management. He has developed and managed refining capital and expense budgets, worked in business development, and led Marathon’s due diligence team for the prospective purchase of BP’s Lima refinery. He developed and sponsored the Detroit refinery expansion while incorporating the requirements for ultra low sulfur fuels while staging the refinery to include significantly larger volumes of heavy, sour Canadian crudes. Mr. Mullins is currently a member of the American Institute of Chemical Engineers, served as an expert panel member for the 2007 National Petroleum Refiners Association Q & A, a former member of the American Petroleum Institute Operating Practices Committee and chaired the Wayne State University Industrial Advisory Board for the Chemical and Metallurgical Engineering Department from 2002 to 2007.
147
Table of Contents
Index to Financial Statements
Board of Directors
Our board of directors currently consists of nine members, including our Chief Executive Officer and our President and Chief Operating Officer, and two members designated by each of ACON Refining and TPG Refining.
Initially, our board of directors will consist of a single class of directors each serving one year terms. Once ACON Refining and TPG Refining, in the aggregate, no longer beneficially own more than 50% of the outstanding shares of our voting stock or our company would fail to qualify as a “controlled company” under the NYSE rules as in effect at the time of this offering, our board of directors will be divided into three classes of directors, with each class as nearly equal in number as possible, serving staggered three year terms (other than directors which may be elected by holders of preferred stock, if any).
Director Independence
We intend to avail ourselves of the “controlled company” exception under the NYSE rules, which exempts us from the requirements that a listed company must have a majority of independent directors on its board of directors and that its compensation and nominating and corporate governance committees be composed entirely of independent directors.
In any event, our board of directors has reviewed the materiality of any relationship that each of our directors has with us, either directly or indirectly. Based on this review, the board has determined that Messrs. Hofmann, Josey and Smith are each an “independent director” as defined by the NYSE rules and Rule 10A-3 of the Exchange Act.
Committees of the Board of Directors
We will be a “controlled company” as that term is set forth in Section 303A of the NYSE Listed Company Manual because more than 50% of our voting power is held by funds affiliated with ACON Refining and TPG Refining, acting as a group. Under the NYSE rules, a “controlled company” may elect not to comply with certain NYSE corporate governance requirements, including (1) the requirement that a majority of the board of directors consist of independent directors, (2) the requirement that the nominating and corporate governance committee be composed entirely of independent directors with a written charter addressing the committee’s purpose and responsibilities, (3) the requirement that the compensation committee be composed entirely of independent directors with a written charter addressing the committee’s purpose and responsibilities and (4) the requirement for an annual performance evaluation of the nominating and corporate governance and compensation committees. After completion of this offering, more than 50% of our voting power will continue to be held by funds affiliated with ACON Refining and TPG Refining, and we intend to elect to be treated as a “controlled company” and thus avail ourselves of these exemptions. As a result, although we have adopted charters for our audit, nominating and corporate governance and compensation committees and intend to conduct annual performance evaluations of these committees, our board of directors does not consist of a majority of independent directors nor do our nominating and corporate governance and compensation committees consist of independent directors. Accordingly, so long as we are a “controlled company,” you will not have the same protections afforded to stockholders of companies that are subject to all of the corporate governance requirements of the NYSE.
Our board of directors has an audit committee, compensation committee and nominating and governance committee, and may have such other committees as the board of directors shall determine from time to time. Each of the standing committees of the board of directors has the composition and responsibilities described below.
148
Table of Contents
Index to Financial Statements
Audit Committee
The members of our audit committee are Messrs. Hofmann, Ginns, Liaw and Smith, each of whom our board of directors has determined is financially literate. Mr. Hofmann is the Chairman of this committee. Our board of directors has determined that Mr. Hofmann is an audit committee financial expert. We will rely on the phase-in rules of the SEC and NYSE with respect to the independence of our audit committee. These rules permit us to have an audit committee that has one member that is independent by the date that our Class A common stock is first traded on the NYSE, a majority of members that are independent within 90 days of the effectiveness of the registration statement of which this prospectus forms a part (the “effective date”) and all members that are independent within one year of the effective date. Our audit committee is authorized to:
| Ÿ | approve and retain the independent auditors to conduct the annual audit of our books and records; |
| Ÿ | review the independence and performance of the independent auditors; |
| Ÿ | review the proposed scope and results of the audit; |
| Ÿ | review and pre-approve the independent auditors’ audit and non-audit services rendered; |
| Ÿ | approve the audit fees to be paid; |
| Ÿ | review accounting and financial controls with the independent auditors and our financial and accounting staff; |
| Ÿ | review and approve transactions between us and our directors, officers and affiliates; |
| Ÿ | recognize and prevent prohibited non-audit services; |
| Ÿ | establish procedures for complaints received by us regarding accounting matters; |
| Ÿ | oversee internal audit functions; |
| Ÿ | oversee our compliance with legal and regulatory requirements; and |
| Ÿ | prepare the report of the audit committee that SEC rules require to be included in our annual meeting proxy statement. |
Compensation Committee
The members of our compensation committee are Messrs. Aronson, Josey, Liaw and Smith. Mr. Smith is the Chairman of this committee. Our compensation committee is authorized to:
| Ÿ | review and recommend the compensation arrangements for management, including the compensation for our Chief Executive Officer; |
| Ÿ | establish and review general compensation policies with the objective to attract and retain superior talent, to reward individual performance and to achieve our financial goals; |
| Ÿ | administer our incentive compensation and benefits plans, including our stock incentive plan; and |
| Ÿ | prepare the report of the compensation committee that SEC rules require to be included in our annual meeting proxy statement. |
149
Table of Contents
Index to Financial Statements
Nominating and Corporate Governance Committee
The members of our nominating and corporate governance committee are Messrs. , and . Mr. is the Chairman of this committee. Our nominating and corporate governance committee is authorized to:
| Ÿ | identify, evaluate and recommend qualified nominees for election to the board of directors; |
| Ÿ | develop, recommend to the board of directors and oversee a set of corporate governance principles applicable to our company; |
| Ÿ | oversee the evaluation of the board of directors and management; and |
| Ÿ | develop and maintain a management succession plan. |
Compensation Committee Interlocks and Insider Participation
No member of our compensation committee has been at any time an employee of ours. None of our executive officers will serve as a member of the board of directors or compensation committee of any entity that has one or more executive officers serving as a member of our board of directors or compensation committee.
To the extent any members of our compensation committee and affiliates of theirs have participated in transactions with us, a description of those transactions is described in “Certain Relationships and Related Person Transactions.”
Code of Business Conduct and Ethics
Our board of directors will adopt a code of business conduct and ethics applicable to our employees, directors and officers, in accordance with applicable U.S. federal securities laws and the corporate governance rules of the NYSE. Any waiver of this code may be made only by our board of directors and will be promptly disclosed as required by applicable U.S. federal securities laws and the corporate governance rules of the NYSE.
Corporate Governance Guidelines
Our board of directors will adopt corporate governance guidelines in accordance with the corporate governance rules of the NYSE.
150
Table of Contents
Index to Financial Statements
COMPENSATION DISCUSSION AND ANALYSIS
The following discussion and analysis of compensation arrangements (“CD&A”) of our named executive officers for 2011 (as set forth in the Summary Compensation Table below) should be read together with the compensation tables and related disclosures set forth below. This discussion contains forward-looking statements that are based on our current plans, considerations, expectations and determinations regarding future compensation programs. Actual compensation programs that we adopt may differ materially from the currently planned programs summarized in this discussion.
Summary of Our Executive Compensation Program
Our executive compensation program has generally been overseen by our board of directors or an informal subcommittee of our board of directors, along with significant input from our senior management team. The ultimate responsibility for making decisions relating to the compensation of our named executive officers differs depending on the compensation element at issue. As of December 31, 2011, our board of directors generally made all decisions regarding salary, a subcommittee of our board of directors addressed overall compensation for Messrs. Rodriguez and Kuchta (our chief executive officer and our president and chief operating officer, respectively), and our senior management team made recommendations to the board of directors regarding all elements of compensation.
We determined that for our fiscal year ended December 31, 2011, the following individuals met the standards of a “named executive officer” for the 2011 fiscal year:
| Ÿ | Mario Rodriguez — Chief Executive Officer; |
| Ÿ | Hank Kuchta — President and Chief Operating Officer; |
| Ÿ | David Bonczek — Vice President and Chief Financial Officer; |
| Ÿ | Neal Murphy — Former Chief Financial Officer; and |
| Ÿ | Greg Mullins — President, St. Paul Park Refining Company |
Mr. Murphy left our company on August 22, 2011 and was succeeded in the role of Chief Financial Officer by Mr. Dave Bonczek. We have determined that as of December 31, 2011, no other individual met the standards necessary to classify him or her as a “named executive officer.”
Objectives of Our Executive Compensation Program
We have, and will continue to design, an executive compensation program with the following objectives:
| Ÿ | The recruitment and retention of talented individuals for key leadership positions; |
| Ÿ | The linking of compensation to an executive’s individual performance and our financial performance; and |
| Ÿ | The alignment of our executives’ compensation opportunities with our short-term and long-term financial objectives. |
Key Components of Our Compensation Policy
In furtherance of our objectives for our executive compensation program, we have created both fixed and variable compensation elements for our compensation program. We desire to provide a certain level of fixed elements, such as salary and health and welfare benefits, in order to provide
151
Table of Contents
Index to Financial Statements
stability and reliability to our executives. These fixed compensation elements are important because they allow our executives to keep their main focus on our business objectives. However, we believe that variable compensation elements, such as annual cash bonuses and equity incentive awards, allow us to incentivize and reward our executives in years where they have provided us with superior services, and this “pay for performance” concept aligns the executive’s goals with those of our stockholders. In connection with our commencement of operations following the consummation of the Marathon Acquisition, our named executive officers received compensation in the following forms during the 2011 fiscal year:
| Ÿ | Base salary; |
| Ÿ | Annual bonus awards; |
| Ÿ | Long-term equity incentive awards in the form of profits interests in NTI Management Company, L.P (“NTI Management”), one of our Existing Owners; |
| Ÿ | Severance and change in control provisions; and |
| Ÿ | Participation in broad-based retirement, health and welfare benefits. |
Mr. Bonczek was the only named executive officer to receive NTI Management profits interests awards during the 2011 year. The remaining named executive officers received NTI Management profits interests awards during the 2010 year in connection with the close of the Marathon Acquisition (see “—Long-Term Equity-Based Incentives” below for more details).
As we form a more comprehensive compensation program suitable for a public company, however, we expect to add a pension plan component to the compensation and incentive package provided to our named executive officers on a going forward basis. The design of our long-term equity incentive awards will also likely be modified, and we expect that future awards will be granted under a new long term incentive plan that will be based upon our Class A common stock, as described in greater detail below under “— Long-Term Incentive Plan.” We have not historically benchmarked any compensation elements against a particular peer group, but we anticipate that an analysis of our peers’ executive compensation packages will occur after the completion of this offering in order to more closely gauge our competitiveness to that of our peer companies. In January 2012 our board of directors engaged Pearl Meyer & Partners (“PMP”), an independent compensation consulting firm, to review our current compensation programs and to assist us in identifying our peer group. As of this filing PMP is still conducting its review and we have not used any PMP information to make compensation decisions for the 2012 year.
The structure of each of the compensation elements provided to our named executive officers during the 2011 fiscal year and the current 2012 fiscal year, where applicable, is described in detail below
Components of Executive Compensation Program
Base Salary
Each named executive officer’s base salary is a fixed component of compensation and does not vary depending on the level of performance achieved. Base salaries are determined for each named executive based on his or her position and responsibility. Our board of directors generally reviews the base salaries for each named executive annually as well as at the time of any promotion or significant change in job responsibilities, and in connection with each review it considers individual and company performance over the course of that year. Our board of directors and our named executive officers worked together to determine appropriate levels of base salary compensation for our named executive
152
Table of Contents
Index to Financial Statements
officers at our operations following the Marathon Acquisition. They utilized our internal human resources staff to look at publicly available information regarding salaries at various companies within our industry, although a formal peer group or market median was not targeted in making these determinations.
With respect to Messrs. Rodriguez and Kuchta, their base salaries are set forth in formal employment agreements that we entered into on December 1, 2010. Mr. Rodriguez has a base salary of $500,000 per year, while Mr. Kuchta has a base salary of $450,000 per year. Messrs. Rodriguez and Kuchta’s employment agreements provide that our board of directors will set and review their base salaries, and that our board of directors may increase, but not decrease, their base salaries at any time.
Mr. Murphy’s base salary was set forth in the offer letter that we provided to him at the time of his employment, in the amount of $350,000. Messrs. Bonczek and Mullins also received offer letters prior to beginning their employment with us. Mr. Bonczek originally received his offer letter on February 7, 2011, when he was hired as our Chief Accounting Officer and Corporate Controller. We increased the annual base salary set forth in Mr. Bonczek’s offer letter from $235,000 to $270,000 as of August 29, 2011, in order to reflect the change in his position to Chief Financial Officer. Our offer letter to Mr. Mullins was dated December 1, 2010, and provides him with an annual base salary of $275,000.
The base salary earned by each named executive officer for the 2011 fiscal year is set forth in the Summary Compensation Table below. We have not made any changes to base salaries for the 2012 year as of the date of this filing, but as noted above, PMP will provide us with a review of our executive compensation program compared to that of our peers during the 2012 year. We expect that some changes to our compensation structure, including salary modifications, may occur during the 2012 year as a result of that analysis.
Bonuses
Each of the named executive officers will be eligible to receive bonus payments pursuant to the Incentive Compensation Plan for Calendar Year 2011 (the “Bonus Plan”), which is designed to encourage our employees to achieve our business objectives and to attract and retain key employees through the opportunity for substantial performance-related incentive compensation. The Bonus Plan is designed to fully align employee interests with those of our stockholders through primary focus on financial performance, namely earnings before interest, taxes, depreciation, and amortization (“EBITDA”). While the financial drivers of the Bonus Plan, such as EBITDA, represent our primary performance measurement, our compensation committee will retain the right to exercise full discretion to apply other financial or performance measures in determining the payment amount of any individual’s bonus award following its review of our performance during the 2011 year. Such factors that may come into consideration from time to time are safety and environmental performance, operational performance, or the successful acquisition and integration of the Marathon Assets.
The Bonus Plan set a target bonus award for each participant based upon a percentage of that individual’s base salary: the percentage of salary for the 2011 target Bonus Plan awards was 100% with respect to Messrs. Rodriguez and Kutcha, 70% for Mr. Bonczek, 65% for Mr. Mullins, and would have been 70% for Mr. Murphy had he been employed at the end of the 2011 year. Participants will generally earn 0% to 150% of their target bonus amount, subject to any discretionary adjustments made by our compensation committee. Once a performance metric for the plan is chosen, the compensation committee will assign threshold, target and maximum levels applicable to the performance metric to act as guidelines at the end of the performance period, which will be each full calendar year. If applicable performance targets are earned at a threshold level, the general payout will be 40% of the target bonus; if performance targets are earned at target, 100% of the target bonus will
153
Table of Contents
Index to Financial Statements
typically be paid; and if performance targets are earned at maximum levels, up to 150% of the target bonus may be paid (although the compensation committee may choose to pay up to 200% of the target to members of our senior management team if superior performance is provided during the performance period). As of the date of this filing, the compensation committee has not yet determined any particular performance metric or determined any levels or amounts that could be assigned to any particular performance metric for the 2011 year.
No participant will be entitled to any payments under the Bonus Plan until the individual’s award is approved by our compensation committee. We expect that our compensation committee will approve all awards to be granted within the first fifteen business days after our outside auditors approve our year-end earnings release. A participant should also by and large be employed on the date that the awards are paid to employees generally in order to receive an award payment, although our compensation committee has the discretion to award a pro-rata payment in the event of a participant’s death, disability, or retirement.
Long-Term Equity-Based Incentives
During the 2010 fiscal year, the named executive officers (other than Mr. Bonczek, who received his grant during the 2011 calendar year) received units in NTI Management, which is a limited partner of NTI LP. The incentive units were granted to the members of our then-current senior management team on December 1, 2010 following the close of the Marathon Acquisition. The NTI Management units granted were Class C units, which are designed as profits interests rather than capital interests. Class C units are further divided into series, from Class C1 to Class C5 units, which correspond to Class C1 to Class C5 units in NTI LP that NTI Management received from NTI LP. Profits interests in NTI LP have no value for tax purposes on the date of grant, but instead are designed to gain value only after NTI LP has realized a certain level of returns for the holders of other classes of NTI LP’s equity. Under the NTI LP partnership agreement, distributions with respect to NTI LP units are made first to Class A common unit holders, until such holders have received a full return of their capital contributions to NTI LP. Distributions are next made to Class A unit holders, Class C1 unit holders and Class D unit holders in accordance with their sharing percentages, until the Class C2 unit threshold is met. Once the Class C2 unit threshold is met, the holders of Class C2 units become eligible to receive distributions alongside the Class A unit holders, the Class C1 unit holders and the Class D unit holders. This process of adding an additional Class C level to the distribution chain continues until Class C5 unit holders are included. Notwithstanding the preceding, once distributions to Class A unit holders from NTI LP equal an aggregate sum of $3.5 million plus 200% of their capital contributions, then distributions will be made solely to holders of Class D units in accordance with their sharing percentages until the Class D unit holders receive $3.5 million. Holders of NTI Management units receive distributions from NTI Management that correspond to the distributions made to NTI Management by NTI LP. All Class C units in NTI Management are subject to a five-year vesting schedule, which will lapse in equal 20% installments on each anniversary of the grant date of the units. The vesting schedule may be accelerated in certain situations, which is described in more detail within the “Potential Payments Upon Termination or a Change in Control” section below.
Messrs. Rodriguez and Kuchta each received a grant of Class C2, Class C3, Class C4 and Class C5 units in NTI Management in December 2010 upon the closing of the Marathon Acquisition. Messrs. Murphy and Mullins received grants of Class C1, Class C2 and Class C3 units in NTI Management in 2010. Messrs. Rodriguez and Kuchta chose to reserve the grant of Class C1 units for other executive officers due to the fact that the Class C1 units will receive a payout, if at all, at an earlier date than the remaining classes of units. Messrs. Rodriguez and Kuchta agreed to receive the Class C4 and Class C5 units, which will pay out at a later date, in order to show their commitment to our company and their intent to remain employed for a significant period of time. Mr. Bonczek received grants of Class C1, Class C2 and Class C3 units in NTI Management on March 14, 2011 in connection with his entry into
154
Table of Contents
Index to Financial Statements
employment with us. The actual number of units and the value associated with a potential payment of Mr. Bonczek’s units is described in greater detail in the “Grants of Plan-Based Awards for the 2011 Fiscal Year” table below.
We believe that overall business success creates meaningful value to both our shareholders and, through their equity holdings, our executives. The NTI Management Class C units were intended to provide an immediate and significant alignment between our executives and the success of our business. The information provided with respect to these NTI Management Class C units is provided in order to comply with the disclosure rules of the SEC regarding historical compensation, but we do not expect that additional grants of NTI Management Class C units or other NTI Management units will comprise a part of our executive compensation program on a going forward basis. We intend to adopt a new equity-based long-term incentive plan in connection with this offering which is described in greater detail below under “— Long-Term Incentive Plan.”
Severance and Change in Control Benefits
We maintained certain agreements with our named executive officers during the 2011 fiscal year that provided for severance and/or change in control protections. We believe that severance protection provisions create important retention tools for us, as post-termination payments allow employees to leave our employment with value in the event of certain terminations of employment that were beyond their control. Post-termination payments allow management to focus their attention and energy on making the best objective business decisions that are in our interest without allowing personal considerations to cloud the decision-making process. Further, we believe that change in control protections maximize stockholder value by encouraging the named executive officers to review objectively any proposed transaction in determining whether such proposal or termination is in the best interest of our stockholders, whether or not the executive will continue to be employed. Executive officers at other companies in our industry and the general market against which we compete for executive talent commonly have post-termination payments, and we have provided this benefit to the named executive officers in order to remain competitive in attracting and retaining skilled professionals in our industry.
A more detailed description of the severance and change in control provisions that we provide to our named executive officers can be found in the “Potential Payments Upon Termination or a Change in Control” section below.
Other Benefits
We provide our employees, including our named executive officers, with health and welfare benefits, as well as certain retirement plans. We currently maintain a plan intended to qualify under section 401(k) of the Internal Revenue Code of 1986, as amended (the “Code”), where employees are allowed to contribute portions of their base compensation into a retirement account. We provide a matching contribution in amounts up to 7.0% of the employees’ eligible compensation, and an additional 2.0% non-elective annual contribution that will not vest until the end of a three-year period of service. The amounts that we contributed to each named executive officer’s account for the 2011 year are reflected in the Summary Compensation Table below.
We adopted a cash balance retirement plan for our employees in November 2011, which is a defined benefit pension plan. Plan benefits are 5% of eligible annual compensation, plus a specified interest credit. Participant account balances are subject to a three-year cliff vesting schedule. The first contribution to the cash balance plan trust was made in December 2011, and we intend to make required contributions during or before the third quarter in 2012. Named executive officer account balances at the end of 2011 are listed in the Pension Benefits table.
155
Table of Contents
Index to Financial Statements
We believe that our named executive officers should operate under substantially similar conditions as our employees generally, thus we do not generally provide perquisites to our named executive officers.
Other Compensation Items
We do not structure our compensation program according to any particular tax or accounting policies, nor do we have an official securities ownership policy for our named executive officers at this time. Section 162(m) of the Code generally disallows a tax deduction to public companies for certain compensation in excess of $1 million paid to our chief executive officer and our three other most highly compensated executive officers other than our principal financial officer, unless such compensation is designed to be performance-based. However, companies that have become public pursuant to a public offering are allowed an exception to this rule for a period of time following the offering, subject to meeting certain conditions specified in the regulations, and we are currently within this reliance period. While we may become subject to the deductibility restrictions of Section 162(m) of the Code in the future, this Code section does not currently impact our compensation decisions.
Actions Taken After the 2011 Fiscal Year
Long-Term Incentive Plan
We intend to adopt the Northern Tier Energy, Inc. 2012 Long-Term Incentive Plan (“LTIP”) for the employees, consultants and the directors of our company and its affiliates who perform services for us. The description of the LTIP set forth below is a summary of the material features of the plan. This summary, however, does not purport to be a complete description of all the provisions of the LTIP. This summary is qualified in its entirety by reference to the LTIP. The purpose of the LTIP is to provide a means to attract and retain individuals to serve as our directors, employees and consultants who will provide services to us by affording such individuals a means to acquire and maintain ownership of awards, the value of which is tied to the performance of our Class A common stock.
The LTIP will provide flexibility for us to grant (1) incentive stock options qualified as such under U.S. federal income tax laws (“Incentive Options”), (2) stock options that do not qualify as incentive stock options (“Nonstatutory Options,” and together with Incentive Options, “Options”), (3) restricted stock awards (“Restricted Stock Awards”), (4) phantom stock awards (“Phantom Stock Awards”), (5) restricted stock units (“Restricted Stock Units” or “RSUs”), (6) bonus stock (“Bonus Stock Awards”), (7) performance awards (“Performance Awards”), and (8) annual incentive awards (“Annual Incentive Awards”) (collectively referred to as “Awards”).
Administration
The compensation committee of our board of directors will administer the LTIP pursuant to its terms and all applicable state, federal, or other rules or laws, except in the event that our board of directors chooses to take action under the LTIP. The LTIP administrator will have the power to determine to whom and when Awards will be granted, determine the amount of Awards (measured in cash or in shares of our Class A common stock), proscribe and interpret the terms and provisions of each Award agreement (the terms of which may vary), accelerate the exercise terms of an Option, delegate duties under the LTIP, and execute all other responsibilities permitted or required under the LTIP. The LTIP administrator shall be limited in its administration of the LTIP only in the event that a Performance Award or Annual Incentive Award intended to comply with Section 162(m) of the Code requires the compensation committee to be composed solely of “outside” directors at a time when not all directors are considered “outside” directors for purposes of Section 162(m); at such time any director that is not qualified to grant or administer such an Award will recuse himself from the compensation committee’s actions with regard to that Award.
156
Table of Contents
Index to Financial Statements
Securities to be Offered
The maximum aggregate number of shares of Class A common stock that may be issued pursuant to any and all Awards under the LTIP shall not exceed shares, subject to adjustment due to recapitalization or reorganization, or related to forfeitures or the expiration of Awards, as provided under the LTIP.
If Class A common stock subject to any Award is not issued or transferred, or ceases to be issuable or transferable for any reason, including (but not exclusively) because shares are withheld or surrendered in payment of taxes or any exercise or purchase price relating to an Award or because an Award is forfeited, terminated, expires unexercised, is settled in cash in lieu of Class A common stock or is otherwise terminated without a delivery of shares, those shares of Class A common stock will again be available for issue, transfer or exercise pursuant to Awards under the LTIP to the extent allowable by law.
Options. We may grant Options to eligible persons including (1) Incentive Options (only to our employees or those of our subsidiaries) which comply with Section 422 of the Code, and (2) Nonstatutory Options. The exercise price of each Option granted under the LTIP will be stated in the Option agreement and may vary; however, the exercise price for an Option must not be less than the fair market value per share of Class A common stock as of the date of grant (or 110% of the fair market value for certain Incentive Options), nor may the Option be re-priced without the prior approval of our stockholders. Options may be exercised as the compensation committee determines, but not later than ten years from the date of grant. The compensation committee will determine the methods and form of payment for the exercise price of an Option (including, in the discretion of the compensation committee, payment in Class A common stock, other Awards or other property) and the methods and forms in which Class A common stock will be delivered to a participant.
Stock appreciation rights (SARs”) may be awarded in connection with an Option (or as SARs that stand alone, as discussed below). SARs awarded in connection with an Option will entitle the holder, upon exercise, to surrender the related Option or portion thereof relating to the number of shares for which the SAR is exercised. The surrendered Option or portion thereof will then cease to be exercisable. Such SAR is exercisable or transferable only to the extent that the related Option is exercisable or transferable.
SARs. A SAR is the right to receive a share of Class A common stock, or an amount equal to the excess of the fair market value of one share of the Class A common stock on the date of exercise over the grant price of the SAR, as determined by the compensation committee. The exercise price of a share of Class A common stock subject to the SAR shall be determined by the compensation committee, but in no event shall that exercise price be less than the fair market value of the Class A common stock on the date of grant. The compensation committee will have the discretion to determine other terms and conditions of a SAR Award.
Restricted Stock Awards. A Restricted Stock Award is a grant of shares of Class A common stock subject to a risk of forfeiture, performance conditions, restrictions on transferability, and any other restrictions imposed by the compensation committee in its discretion. Restrictions may lapse at such times and under such circumstances as determined by the compensation committee. Except as otherwise provided under the terms of the LTIP or an Award agreement, the holder of a Restricted Stock Award may have rights as a stockholder, including the right to vote the Class A common stock subject to the Restricted Stock Award or to receive dividends on the Class A common stock subject to the Restricted Stock Award during the restriction period. The compensation committee shall provide, in the Restricted Stock Award agreement, whether the Restricted Stock will be forfeited and reacquired by the Company upon certain terminations of employment. Unless otherwise determined by the
157
Table of Contents
Index to Financial Statements
compensation committee, Class A common stock distributed in connection with a stock split or stock dividend, and other property distributed as a dividend, will be subject to restrictions and a risk of forfeiture to the same extent as the Restricted Stock Award with respect to which such Class A common stock or other property has been distributed.
Phantom Stock Awards. Phantom Stock Awards are rights to receive Class A common stock, cash, or a combination of both at the end of a specified period. The compensation committee may subject Phantom Stock Awards to restrictions (which may include a risk of forfeiture) to be specified in the Phantom Stock Award agreement that may lapse at such times determined by the compensation committee. Phantom Stock Awards may be satisfied by delivery of Class A common stock, cash equal to the fair market value of the specified number of shares of Class A common stock covered by the Phantom Stock Award, or any combination thereof determined by the compensation committee at the date of grant or thereafter. Except as otherwise provided by the compensation committee in the Phantom Stock Award agreement or otherwise, Phantom Stock Awards subject to forfeiture restrictions may be forfeited upon termination of a Participant’s employment prior to the end of the specified period. Cash dividend equivalents may be paid during or after the vesting period with respect to a Phantom Stock Award, as determined by the compensation committee.
Restricted Stock Units. Restricted Stock Units are rights to receive Class A common stock, cash, or a combination of both at the end of a specified period. The compensation committee may subject Restricted Stock Units to restrictions (which may include a risk of forfeiture) to be specified in the Restricted Stock Unit Award agreement, and those restrictions may lapse at such times determined by the compensation committee. Restricted Stock Units may be settled by delivery of Class A common stock, cash equal to the fair market value of the specified number of shares of Class A common stock covered by the Restricted Stock Units, or any combination thereof determined by the compensation committee at the date of grant or thereafter. Dividend equivalents on the specified number of shares of Class A common stock covered by Restricted Stock Units may be paid on a current, deferred or contingent basis, as determined by the compensation committee on or following the date of grant.
Bonus Stock Awards. The compensation committee will be authorized to grant Class A common stock as a Bonus Stock Award. The compensation committee will determine any terms and conditions applicable to grants of Class A common stock, including performance criteria, if any, associated with a Bonus Stock Award.
Performance Awards and Annual Incentive Awards. The compensation committee may designate that certain Awards granted under the LTIP constitute “performance” Awards. A Performance Award is any Award the grant, exercise or settlement of which is subject to one or more performance standards. An Annual Incentive Award is an award based on a performance period of the fiscal year, and is also conditioned on one or more performance standards. One or more of the following business criteria for the Company, on a consolidated basis, and/or for specified subsidiaries or business or geographical units of our company, shall be used by the compensation committee in establishing performance goals for such Performance Awards or Annual Incentive Awards that are intended to meet the “performance-based compensation” criteria of Section 162(m) of the Code: (1) earnings per share; (2) increase in revenues; (3) increase in cash flow; (4) increase in cash flow from operations; (5) increase in cash flow return; (6) return on net assets; (7) return on assets; (8) return on investment; (9) return on capital; (10) return on equity; (11) economic value added; (12) operating margin; (13) contribution margin; (14) net income; (15) net income per share; (16) pretax earnings; (17) pretax operating earnings after interest expense and before incentives, service fees, and extraordinary or special items; (18) pretax earnings before interest, depreciation and amortization; (19) total stockholder return; (20) debt reduction; (21) market share; (22) change in the fair market value of the Class A common stock; (23) operating income; or (24) sales.
158
Table of Contents
Index to Financial Statements
The compensation committee may also use any of the above goals determined on an absolute or relative basis or as compared to the performance of a published or special index deemed applicable by the compensation committee including, but not limited to, the Standard & Poor’s 500 Stock Index or a group of comparable companies. The business criteria shall be subject to adjustment for changes in accounting standards required by the Financial Accounting Standards Board (“FASB”) after the goal is established, and, to the extent provided for in any Award agreement, shall be subject to adjustment for specified significant extraordinary items or events, or nonrecurring transactions or events. In this regard, business criteria based on the price of our Class A common stock shall be proportionately adjusted for any changes in the price due to a stock split, recapitalization or similar corporate transaction. The compensation committee, in its sole discretion, may provide for an adjustable performance Award value based upon the level of achievement of performance measures and/or provide for a reduction in the value of a Performance Award or Annual Incentive Award during the performance period. Performance Awards or Annual Incentive Awards granted to eligible persons who are deemed by the compensation committee to be “covered employees” pursuant to Section 162(m) of the Code shall be administered in accordance with the rules and regulations issued under Section 162(m) of the Code. The compensation committee may also impose individual performance criteria on the Awards, which, if required for compliance with Section 162(m) of the Code, will be approved by our stockholders.
Miscellaneous
Tax Withholding. At our discretion, subject to conditions that the compensation committee may impose, a participant’s minimum statutory tax withholding with respect to an Award may be satisfied by withholding from any payment related to an Award or by the withholding of shares of Class A common stock issuable pursuant to the Award based on the fair market value of the shares.
Merger, Recapitalization or Change in Control. If any change is made to our capitalization, such as a stock split, stock combination, stock dividend, exchange of shares or other recapitalization, merger or otherwise, which results in an increase or decrease in the number of outstanding shares of Class A common stock, appropriate adjustments will be made by the compensation committee in the shares subject to an Award under the LTIP. We will also have the discretion to make certain adjustments to Awards in the event of a change in control, such as accelerating the exercisability of Options or SARs; requiring the surrender of an Award, with or without consideration; or making any other adjustment or modification to the award we feel is appropriate in light of the specific transaction.
Stock Ownership Guidelines and Hedging Policies. We do not currently have any stock ownership guidelines or hedging policies in place at this time, although we expect that our compensation committee will consider this issue in the near future in order to address certain concerns that could arise from becoming a public company.
Clawback Policies. If required by the Sarbanes-Oxley Act of 2002 and/or by the Dodd-Frank Wall Street Reform and Consumer Protection Act of 2010, any incentive or equity-based award provided to one of our employees shall be conditioned on repayment or forfeiture in accordance with applicable law, any company policy, and any relevant provisions in the applicable award agreement.
159
Table of Contents
Index to Financial Statements
Summary Compensation Table
The table below sets forth the annual compensation earned during the 2011 fiscal year (and for those individuals that were also considered named executive officers during the 2010 year, the 2010 fiscal year) by our “named executive officers.” When the year “2010” is used in the table below, the reference reflects only amounts that were paid between the period of December 1, 2010 (the date that we commenced operations in connection with the Marathon Acquisition) and December 31, 2010 (the “Short Year”).
| Name and Principal Position |
Year | Salary ($) (1) |
Bonus ($) (2) |
Option Awards ($)(3) |
Change in Pension Value |
All Other Compensation(4) |
Total ($) | |||||||||||||||||||||
| Mario Rodriguez |
2011 | 500,000 | — | — | 12,250 | 25,846 | 538,096 | |||||||||||||||||||||
| Chief Executive Officer |
2010 | 41,667 | — | 2,307,504 | — | 2,349,171 | ||||||||||||||||||||||
| Neal Murphy(5) |
2011 | 249,038 | — | — | 0 | 89,250 | 338,288 | |||||||||||||||||||||
| Chief Financial Officer |
2010 | 29,167 | — | 731,722 | — | 760,889 | ||||||||||||||||||||||
| Hank Kuchta |
2011 | 450,000 | — | — | 12,250 | 21,749 | 483,999 | |||||||||||||||||||||
| President and Chief Operating Officer |
2010 | 37,500 | — | 1,887,958 | — | 1,925,458 | ||||||||||||||||||||||
| David Bonczek(5) |
2011 | 192,211 | — | 121,488 | 6,312 | 7,572 | 327,583 | |||||||||||||||||||||
| Vice President and Chief Financial Officer |
||||||||||||||||||||||||||||
| Greg Mullins |
2011 | 275,000 | 25,000 | — | 11,421 | 13,327 | 324,748 | |||||||||||||||||||||
| President, St. Paul Park Refining Company |
||||||||||||||||||||||||||||
| (1) | Amounts in this column for the 2010 year reflect the salary earned by each of the executive officers during the Short Year. Annual base salaries for the 2010 year were $500,000, $350,000 and $450,000 for Messrs. Rodriguez, Murphy and Kuchta respectively. |
| (2) | The amounts of the 2011 Bonus Plan awards, if any, cannot be calculated as of the date of this filing. We expect that such amounts will be determined and paid out prior to March 15, 2012, and we will disclose any such amounts for each applicable named executive officer on a Form 8-K at the appropriate time. In addition, Mr. Mullins received a one-time sign-on bonus of $25,000. |
| (3) | Despite the fact that profits interests such as the NTI Management Class C units do not require the payment of an exercise price, we believe that these awards are economically similar to stock options due to the fact that they have no value for tax purposes at grant and will obtain value only as the price of the underlying security rises, and as such, are required to be reported in this title under the “Option Awards” column. No “options” in the traditional sense have been granted to our named executive officers during the Short Year or the 2011 fiscal year. Amounts included reflect the grant date fair value of the NTI Management Class C units granted to the named executive officers on December 1, 2010, or with respect to Mr. Bonczek, March 14, 2011, computed in accordance with FASB ASC Topic 718. As each 2010 NTI Management Class C unit was granted during the Short Year, the amount shown in the table above for the 2010 year is the full grant date fair value rather than any proportionate share of the awards. The assumptions used to calculate these values for 2010 and 2011 grants were as follows: (a) the expected term was 6.5 years; (b) current price of the underlying unit was $1.00; (c) the expected volatility was 40.6%; (d) the expected dividend yield was 0.0%; and (e) the risk-free investment rate was 2.7%. |
160
Table of Contents
Index to Financial Statements
| (4) | Other than with respect to Mr. Murphy, amounts included here reflect the contribution that each named executive officer received from us in the form of matching contributions into their 401(k) plan accounts for the 2011 year. In addition, we paid a life insurance premium on behalf of Mr. Rodriguez to Banner Life in the amount of $9,346, and on behalf of Mr. Kuchta to MetLife in the amount of $4,599. The amount disclosed for Mr. Murphy consists of the first installment of his separation payment that was paid to him on November 22, 2011 under a separation agreement that he entered in to with us following his resignation (described in greater detail below). |
| (5) | Mr. Murphy is no longer an employee, and has been succeeded by Mr. Dave Bonczek. Mr. Bonczek was previously our Chief Accounting Officer before he became our Chief Financial Officer on August 22, 2011. Amounts reflected in Mr. Bonczek’s “salary” column reflect payments with respect to his previous salary ($235,000) from February 7, 2011 to August 29, 2011, and payments with respect to his current salary ($270,000) from August 29, 2011 to December 31, 2011. |
Grants of Plan-Based Awards for the 2011 Fiscal Year
| Name |
Grant Date | Number of Securities Underlying Options (#)(1) |
Exercise or Base Price of Option Awards ($/Sh) |
Grant Date Fair Value of Stock and Option Awards ($)(2) |
||||||||||||
| David Bonczek |
||||||||||||||||
| Class C1 Units |
3/14/2011 | 60,000 | N/A | 26,897 | ||||||||||||
| Class C2 Units |
3/14/2011 | 145,000 | N/A | 52,528 | ||||||||||||
| Class C3 Units |
3/14/2011 | 145,000 | N/A | 42,063 | ||||||||||||
| (1) | As explained in Footnote 3 to the Summary Compensation Table above, awards reflected in this column represent the number of NTI Management Class C units granted to Mr. Bonczek (the only named executive officer that received such awards during the 2011 fiscal year), rather than actual “option” awards. |
| (2) | Amounts reflected in this column reflect the grant date fair value of the NTI Management Class C units in accordance with FASB ASC Topic 718. |
Narrative Description to the Summary Compensation Table and the Grant of Plan-Based Awards Table for the 2011 Fiscal Year
We entered into formal employment agreements with Messrs. Rodriguez and Kuchta on December 1, 2010. Both employment agreements have a term of employment of one year, with automatic one-year renewals, absent notice by either the executive or us of the intention not to renew the agreement. Mr. Rodriguez has an annual base salary of $500,000, Mr. Kuchta has an annual base salary of $450,000, and each executive has an annual cash incentive bonus target of 100% of their respective annual base salary. The employment agreements for each executive set forth their December grant of NTI Management Class C units, described in greater detail above. Messrs. Rodriguez and Kuchta are eligible to participate in our employee benefit programs, plans and practices in accordance with the terms and conditions of the individual plans, and we provide a life insurance benefit to each of the executives in an amount that will equal no less than 200% of their respective base salaries. The employment agreements contain severance protections, standard confidentiality, non-solicitation and non-compete provisions, each of which is described in greater detail in the “Potential Payments Upon a Termination or Change in Control” section below.
We sent an offer letter to Mr. Murphy on November 22, 2010 that generally set forth the terms and conditions that governed his employment relationship with us, although his offer letter estimated
161
Table of Contents
Index to Financial Statements
that December 1, 2010 would be the effective employment date applicable to him. Mr. Murphy had an annual base salary of $350,000. The offer letter set forth the number of NTI Management Class C units that Mr. Murphy received on December 1, 2010, although the material terms and conditions of the NTI Management Class C units are set forth in individual award agreements and the NTI Management partnership agreement. The offer letter stated that Mr. Murphy would be eligible to participate in all applicable employee benefit plans that we maintain, subject to the terms and conditions of the individual plans. Mr. Murphy was also eligible to receive certain relocation benefits in connection with his move to Ridgefield, Connecticut, up to $100,000, which included temporary living assistance and moving costs that occurred during the first twenty-four months of his employment with us. Upon Mr. Murphy’s resignation in August, we entered into a new separation agreement with him that governs his severance arrangements; please see the “Potential Payments Upon Termination or a Change in Control” section below for more details.
The offer letters provided to Messrs. Bonczek and Mullins contained substantially similar provisions regarding compensation and benefits to the offer letter for Mr. Murphy described above. Mr. Bonczek’s offer letter originally provided him with a salary of $235,000, which was increased to $270,000 by our board of directors in August of 2011 in order to reflect his new position as Chief Financial Officer. The potential severance benefits for Mr. Bonczek are further described in the “Potential Payments Upon a Termination or Change in Control” below. Mr. Mullins offer letter was provided to him on December 1, 2010, and set forth his base salary of $275,000.
Each of the named executive officers hold NTI Management Class C units that are subject to a five year, equal installment vesting schedule. The potential acceleration or forfeiture events relating to these units are described in greater detail within the “Potential Payments Upon a Termination or Change in Control” section below.
Percentage of Salary in Comparison to Total Compensation
| Name |
Salary Percentage of Total Compensation(1) |
|||
| Mario Rodriguez |
93 | % | ||
| Neal Murphy |
74 | % | ||
| Hank Kuchta |
93 | % | ||
| David Bonczek |
59 | % | ||
| Greg Mullins(2) |
92 | % | ||
| (1) | The calculation does not take into account any bonuses that may be awarded for the 2011 year under our Bonus Plan as amounts, if any, have not yet been determined. |
| (2) | Mr. Mullins’ bonus taken into account for this calculation consisted of a one-time signing bonus, rather than an award from our Bonus Plan. |
162
Table of Contents
Index to Financial Statements
Outstanding Equity Awards at 2011 Fiscal Year-End
The following table provides information on the current NTI Management Class C units held by the named executive officers. This table includes unvested NTI Management Class C units. The vesting dates for each award are shown in the accompanying footnotes.
| Option Award (1) | ||||||||||||
| Name |
Number of Securities Underlying Unexercised Options (#) Unexercisable |
Option Exercise Price ($) |
Option Expiration Date |
|||||||||
| Mario Rodriguez |
||||||||||||
| Class C2 Unit (2) |
1,210,000 | N/A | N/A | |||||||||
| Class C3 Units (2) |
1,210,000 | N/A | N/A | |||||||||
| Class C4 Units (2) |
2,145,000 | N/A | N/A | |||||||||
| Class C5 Units (2) |
2,145,000 | N/A | N/A | |||||||||
| Hank Kuchta |
||||||||||||
| Class C2 Units (2) |
990,000 | N/A | N/A | |||||||||
| Class C3 Units (2) |
990,000 | N/A | N/A | |||||||||
| Class C4 Units (2) |
1,755,000 | N/A | N/A | |||||||||
| Class C5 Units (2) |
1,755,000 | N/A | N/A | |||||||||
| David Bonczek |
||||||||||||
| Class C1 Units (3) |
60,000 | N/A | N/A | |||||||||
| Class C2 Units (3) |
145,000 | N/A | N/A | |||||||||
| Class C3 Units (3) |
145,000 | N/A | N/A | |||||||||
| Greg Mullins |
||||||||||||
| Class C1 Units (2) |
160,000 | N/A | N/A | |||||||||
| Class C2 Units (2) |
240,000 | N/A | N/A | |||||||||
| Class C3 Units (2) |
240,000 | N/A | N/A | |||||||||
| (1) | As explained above, the applicable equity awards that are disclosed in these tables are NTI Management Class C units rather than traditional “option” awards. |
| (2) | Each unexercisable unit reflected in this row has the same vesting schedule, which will vest in equal installments on December 1, 2012, 2013, 2014 and 2015. |
| (3) | Each unexercisable unit reflected in this row has the same vesting schedule, which will vest in equal installments on March 14, 2012, 2013, 2014, 2015 and 2016. |
Option Exercises and Stock Vested in the 2011 Fiscal Year
| Option Awards (1) | ||||||||
| Name |
Number of Units Acquired on Exercise (#)(1) |
Value Realized on Exercise ($)(2) |
||||||
| Mario Rodriguez |
1,677,550 | 0 | ||||||
| Hank Kuchta |
877,500 | 0 | ||||||
| Greg Mullins |
160,000 | 0 | ||||||
| (1) | As explained above, the applicable equity awards that are disclosed in these tables are NTI Management Class C units rather than traditional “option” awards. Upon vesting, the named executive officers did not receive any NTI Management units nor can they exercise any rights to |
163
Table of Contents
Index to Financial Statements
| receive an NTI Management unit. The numbers shown here reflect only the number of NTI Management units that became vested during the 2011 year. |
| (2) | Amounts shown in this column reflect our best estimate of the value of the NTI Management Class C units as of December 31, 2011. As described in greater detail within our Compensation Discussion and Analysis above, the holders of the NTI Management Class C units would not receive distributions until such time as NTI LP has realized a certain level of returns for the holders of other classes of NTI LP’s equity, which has not occurred as of the date of this filing. |
Pension Benefits
Each of the named executive officers is eligible to participate in the cash balance pension plan that we adopted during November 2011.
| Name | Plan Name |
Number of Years Credited Service (#) |
Present Value of Accumulated Benefit ($) |
Payments During 2011 Fiscal Year ($) |
||||||||||
| Mario Rodriguez |
Northern Tier Energy Retirement Plan | 1.08 | 12,250 | — | ||||||||||
| Neal Murphy |
Northern Tier Energy Retirement Plan | .72 | 0 | — | ||||||||||
| Hank Kuchta |
Northern Tier Energy Retirement Plan | 1.08 | 12,250 | — | ||||||||||
| David Bonczek |
Northern Tier Energy Retirement Plan | .80 | 6,312 | — | ||||||||||
| Greg Mullins |
Northern Tier Energy Retirement Plan | 1.08 | 11,421 | — | ||||||||||
The Northern Tier Energy Retirement Plan (the “Plan”) is a funded, tax-qualified, noncontributory defined benefit pension plan that covers certain employees. Eligible employees under the Plan include all employees with benefit classifications of refinery, corporate or terminal who have attained age 21 and completed three months of service. Excluded employees include all those with other benefit classification codes, temporary employees, independent contractors and collectively bargained employees under an agreement that does not provide for participation in the Plan. The Plan is designed as a cash balance plan wherein a participant’s account is credited each year with a pay credit and an interest credit such that increases and decreases in the value of the Plan’s investments do not directly affect the benefit amounts promised to participants.
As of the end of the Plan year, the Plan provides for a pay credit equal to 5% of Compensation (as defined below) for each participant who has completed an hour of service during the Plan year. If a participant terminates during the Plan year, he is entitled to the pay credit as of the date of termination. Compensation under the Plan includes wages under Section 3401(a) of the Code excluding severance pay, sign-on bonuses, or any signing bonuses paid to collectively bargained employees.
In addition, each calendar month, the Plan also provides for an interest credit equal to the participant’s account balance times the one plus the applicable interest rate to the 1/12th power minus 1. Participants are not entitled to interest credits beginning on or after the annuity starting date unless the benefit is paid solely to satisfy Section 401(a)(9) of the Code or during the Plan year of termination. The applicable interest rate is the average annual yield on 30-year U.S. Treasury bonds for September of the immediately preceding calendar year. For 2012, the interest crediting rate will be 3.65%.
A participant is 100% vested in his or her account upon completion of three years of vesting service (includes service with Marathon Oil Company based on the most recent date of hire). If a participant terminates for a reason other than death or disability before completion of this time period, he or she forfeits all benefits under the Plan. If a participant attains normal retirement age, dies or becomes disabled, then he or she is entitled to 100% vesting. A participant attains normal retirement age at age 65. A participant is deemed to he disabled if he or she qualifies for benefits under the long-term disability plan or qualifies for Federal Social Security disability benefits.
164
Table of Contents
Index to Financial Statements
The amount of benefit payable with respect to a participant will be his or her vested account balance if payable in lump sum or the actuarially equivalent of such balance if paid in another form; however, where a participant terminated after attaining his or her normal retirement date, the benefit is the greater of the vested account balance or the actuarial increase in such balance as of the end of the preceding Plan year (or, of later, his or her normal retirement date). The normal form is distribution is a qualified joint and survivor annuity if the participant is married on his or her annuity starting date or a single life annuity if he or she is unmarried on that date. Optional forms of distribution include as follows: (1) lump sum, (2) single life annuity, (3) qualified joint and survivor annuity, or (4) the optional joint and survivor annuity.
Nonqualified Deferred Compensation
We do not currently maintain a plan or arrangement that provides for nonqualified deferred compensation benefits.
Potential Payments Upon Termination or a Change in Control
We provide our named executive officers with certain severance and change in control benefits. The rationale for providing these benefits to our executives is described in detail in the CD&A above.
Employment Agreements and Offer Letters
On termination of Messrs. Rodriguez and Kuchta employment by us or the executive due to a notice of non-renewal, the executive will receive any earned but yet unpaid base salary, any earned but yet unpaid bonus for the year that precedes the year in which his termination occurs, reimbursement of any business expenses incurred and all employee benefits he may be entitled to receive under our employee benefit plans (the “Accrued Rights”), and a pro-rata portion of any annual performance bonus that the executive would have been entitled to receive for the year in which the termination occurs (the “Pro-rata Bonus”). If we deliver the notice of non-renewal to the executive, he will also receive continued base salary payments for a period of twenty-four months.
In the event that Messr. Rodriguez or Kuchta is terminated by us without Cause or by the executive with Good Reason (each term defined below), the executive will be entitled to the Accrued Rights, his Pro-rata Bonus, his annual base salary for the twenty-four month period following the date of his termination of employment and certain health care continuation benefits for the eighteen-month period following the date of termination of his employment (the “Medical Benefits”). If the executive incurs Disability (as defined below) during their employment with us, he will receive the Accrued Rights, the Medical Benefits, any amounts that may be payable to them pursuant to any long-term disability plan that we may maintain at the time of their termination from service due to that Disability (that will be paid through insurance policies rather than by the company directly), and continued payments of their base salary for the period of time, if any, that our short-term disability policy covering the executive is in effect before the long-term disability policy becomes effective. A termination of employment for Cause or due to death will result solely in the payment of any Accrued Rights. “Cause” is generally defined for Messrs. Rodriguez and Kuchta as (1) the executive’s failure to comply with any reasonable instruction from our board of directors; (2) the executive’s misconduct, resulting from willful or grossly negligent conduct, which is materially injurious to us or our affiliates; (3) the executive’s intentional or knowingly fraudulent act against us, our customers, clients or employees; (4) the executive’s material breach of his employment agreement; or (5) the executive being changed with, convicted of, or pleading guilty or no contest to a felony or a crime involving fraud, dishonesty or moral turpitude. “Good Reason” is defined in the employment agreements as: (1) our failure to continue the executive in his current position, or to reelect or reappoint the executive to our board of directors,
165
Table of Contents
Index to Financial Statements
(2) our material breach of the employment agreement, (3) a substantial adverse reduction in the executive’s duties or responsibilities, or (4) our relocation of our business offices more than twenty miles away from its present location. Messrs. Rodriguez and Kuchta may be considered to have incurred a “Disability” if they meet the definition for such term in our long-term disability plan in effect at such time.
Messrs. Rodriguez and Kuchta will only receive the severance benefits described above upon the executive’s execution of a general release in our favor, and subject to his continued compliance with the restrictive covenants in his employment agreement. Each of the executives will be subject to restrictive covenants following his termination of employment, including non-compete, non-disclosure of confidential information and non-solicitation provisions, in the case of the non-compete provision, for a one year period and in the case of the non-solicitation provision, for a two year period.
If an executive is a “specified employee” under Section 409A of the Code at the time of his termination of employment, there are certain severance payments that could create an excise tax for the executive officer if the timing of that payment occurs immediately following his termination of employment. In the event that Messr. Rodriguez or Kuchta is deemed to be a “specified employee” and the severance or any portion of the severance payment due to them would create excise taxes under Section 409A of the Code, their employment agreements state that we will defer the payment of that amount until the date that is six months following the executive’s termination of employment.
The offer letter we provided to Mr. Bonczek states that if his employment is terminated in connection with a change in control, he will receive severance in an amount equal to six (6) months of his then-current annual base salary, and he would become immediately vested in any outstanding equity awards held at the time of the termination, if any (other than the NTI Management Class C units). In the event that Mr. Bonczek’s employment is terminated for any other reason (other than for Cause), or resigns for Good Reason (each term defined as follows), he would receive severance in the amount of six (6) months of his then-current annual base salary. The offer letter defines “Cause” as Mr. Bonczek’s willful and continuous failure to substantially perform his duties (other than in connection with a physical or mental incapacity), his gross misconduct or gross negligence, or his conviction of, or entrance of a plea of, guilty or nolo contendere to a felony. A “Good Reason” termination means: (1) a material diminution of Mr. Bonczek’s position, duties or responsibilities, in the title or office that he holds, or our failure to see him reelected to that position; (2) a reduction in his base salary or target incentive opportunity; (3) a material reduction in his employee benefits; (4) without his express consent, our relocation of the place at which he provides services to us by more than 40 miles from Ridgefield, Connecticut; or (5) a material breach of the provisions of the his offer letter.
Mr. Mullins’ offer letter does not contain severance or change in control provisions or protections at this time.
Mr. Murphy resigned his employment with us on August 22, 2011. We entered into a Separation Agreement and Release of Claims agreement (the “Separation Agreement”) with Mr. Murphy on November 2, 2011 that provided Mr. Murphy with a cash separation payment in the amount of $357,000, provided that he continues to comply with certain confidentiality clauses regarding our business or propriety information. The separation payment will be divided into four separate and equal payments, the first of which occurred on November 22, 2011. The remaining installments shall be paid on each of February 22, 2012, May 22, 2012 and August 22, 2012. The severance payment represents the full and final settlement of any amounts that may be due to Mr. Murphy in relation to his employment with us.
166
Table of Contents
Index to Financial Statements
NTI Management Class C Unit Agreements
Class C unit agreements and the NTI Management partnership agreement set forth the treatment of the NTI Management Class C units upon a termination of employment or a change in control.
The normal five-year NTI Management Class C unit vesting schedule will be accelerated upon the occurrence of an MoM Event (defined below) prior to the termination of an executive’s employment by us or our subsidiaries. Full acceleration would also occur in the event that the holder is terminated without Cause or terminates for Good Reason (each term as defined below) in the two-year period following a Change in Control (as defined below). The NTI Management Class C units would also receive partial accelerated vesting upon the holder’s death or Disability (as defined below), as the holder would be credited with one additional year of service. All other terminations of employment would result in forfeiture of unvested units. Once a NTI Management Class C unit becomes vested, it will remain outstanding unless and until it is repurchased by NTI Management in accordance with the procedures set forth in the NTI Management partnership agreement. NTI Management’s partnership agreement generally states that NTI Management will have the right, but not the obligation, to repurchase the Class C units upon a termination of the holder’s employment for any reason. Any such repurchase would use the fair market value of the Class C unit on the date that NTI Management exercises its right to repurchase that unit, except in the case of a termination for Cause or in the event that the holder joins a competitor within a twelve-month period, in which case the purchase price would be the lower of the fair market value or any purchase or strike price assigned to the unit. “Fair market value” is determined by the general partner of NTI Management in good faith based upon the liquidation value of the Class C units at the time of repurchase.
The NTI Management partnership agreement defines an “MoM Event” as the distribution of an amount that, when distributed pursuant to the normal distribution process set forth in the partnership agreement (described above in the CD&A), results in the holders of the Class A common units receiving total distributions in an amount equal to 200% of their capital contributions plus $3.5 million. We do not expect that this offering will trigger an MoM Event for the NTI Management Class C units. The term “Cause” is defined in the NTI Management partnership agreement in substantially the same terms as that found in Messrs. Rodriguez and Kuchta’s employment agreements described above. A “Good Reason” termination will generally occur if there is a material reduction to the executive’s base salary, authority, duties or responsibilities, a material change to the executive’s primary work location, or we take any other action that constitutes a material breach of our employment relationship with that executive. A “Change in Control” will be deemed to occur upon (1) a liquidation, dissolution or winding up of us, NT Holdings or NTI LP; (2) a transfer by NTI LP or its subsidiaries of all or substantially all of the consolidated assets of NTI LP and its subsidiaries; (3) a business combination or reorganization of NTI LP or its subsidiaries with any other person where more than fifty percent of the combined voting power of the surviving entity’s stock outstanding prior to the transaction is not owned, directly or indirectly, by NTI LP.
167
Table of Contents
Index to Financial Statements
The table below shows our best estimate of the amount of payments and benefits that each of the named executive officers would receive upon a termination of employment or a change in control if that event had occurred on December 31, 2010. Amounts payable upon any event will not be determinable until the actual occurrence of any particular event. Estimates below do not include the value of any Accrued Rights, vacation, sick or holiday pay, as all such amounts have been assumed to be paid current at the time of the event in question.
| Executive |
Termination of Employment due to Our Non-Renewal of Employment Agreement ($) |
Termination of Employment for Cause ($) |
Termination of Employment without Cause or for Good Reason ($) |
Termination of Employment for Disability ($)(5) |
Termination of Employment for Death ($)(6) |
Termination of employment without Cause or Good Reason within a Two Year Period of a Change in Control (7)($) |
MoM Event ($) |
|||||||||||||||||||||
| Mario Rodriguez |
||||||||||||||||||||||||||||
| Base Salary and Bonus(1) |
1,500,000 | N/A | 1,500,000 | 250,000 | 1,500,000 | 1,500,000 | N/A | |||||||||||||||||||||
| Continued |
N/A | N/A | 15,716 | 15,716 | N/A | 15,716 | N/A | |||||||||||||||||||||
| Accelerated |
N/A | |||||||||||||||||||||||||||
| Total |
1,500,000 | 1,515,716 | 265,716 | 1,500,000 | 1,515,716 | |||||||||||||||||||||||
| Hank Kuchta |
||||||||||||||||||||||||||||
| Base Salary and Bonus(1) |
1,350,000 | N/A | 1,350,000 | 225,000 | 1,350,000 | 1,350,000 | N/A | |||||||||||||||||||||
| Continued |
N/A | N/A | 0 | 0 | N/A | 0 | N/A | |||||||||||||||||||||
| Accelerated |
N/A | |||||||||||||||||||||||||||
| Total |
1,350,000 | 1,350,000 | 225,000 | 1,350,000 | 1,350,000 | |||||||||||||||||||||||
| David Bonczek |
||||||||||||||||||||||||||||
| Base Salary(4) |
N/A | N/A | 137,500 | 137,500 | 0 | 137,500 | N/A | |||||||||||||||||||||
| Accelerated |
N/A | |||||||||||||||||||||||||||
| Total |
137,500 | 137,500 | 137,500 | |||||||||||||||||||||||||
| Greg Mullins |
||||||||||||||||||||||||||||
| Base Salary |
N/A | N/A | N/A | 135,000 | N/A | N/A | N/A | |||||||||||||||||||||
| Accelerated |
N/A | |||||||||||||||||||||||||||
| Total |
135,000 | |||||||||||||||||||||||||||
| (1) | Amounts in this row reflect a continuation of the executive’s base salary for a period of twenty-four months, assuming that the executive has signed a proper release form in our favor. As we have not calculated bonuses for the 2011 fiscal year, we have assumed that the executives would each be entitled to receive the amount that was their “target” bonus award for the 2011 year (or 100% of base salary); however, the amounts that the executives actually receive for the 2011 year may differ from the numbers in this table following an analysis of our year end financial results. |
| (2) | Continued medical payments were calculated for Mr. Rodriguez by multiplying our cost for his medical benefits as of December 31, 2011. Our costs for Mr. Rodriguez and his family are currently $604.45 per two-week pay period. Mr. Kuchta would not have been eligible to receive any continued medical benefits from us as of December 31, 2011, as he was still being covered by a previous employer’s medical plans. Our obligation to cover him and his family may change in future years. |
| (3) | Amounts shown in these rows reflect our best estimate of the accelerated value of the NTI Management Class C units if a distribution event had occurred on December 31, 2011. |
| (4) | Amounts in this row reflect a payment equal to six months of Mr. Bonczek’s salary as of December 31, 2011. |
| (5) | Our company’s long-term disability benefit plan (“LTD Plan”) will provide benefits to employees following a 180 day period of short-term disability. The LTD Plan will provide up to 60% of base pay up to a maximum of $20,000 per month, which will not be paid by us but by an insurance company. Amounts shown here reflect only the continuation of base salary payments that we will provide to the executives during their 180 days of short term disability. |
| (6) | While we would not provide any further base salary or bonus amounts to the estates of Messrs. Rodriguez and Kuchta upon their termination of employment due to a death, their estates would receive the payout of the life insurance policy that we maintain on behalf of each of the executives. We pay the premiums on these policies, but the payment of the policy proceeds to the executive’s estate would come directly from the insurance company rather than us. We have assumed that the policy is worth exactly two times the amount of each executive’s annual base salary as of December 31, 2011. |
168
Table of Contents
Index to Financial Statements
| (7) | Amounts reflected in the “Base Salary and Bonus” row, as well as the “Continued Medical” row, are the same amounts as those reflected in the “Termination of Employment without Cause or for Good Reason” column, as these amounts will be paid upon these termination events with or without change in control under their employment agreements; however, amounts would only be paid once. |
Director Compensation
We have adopted a director compensation program that will cover each of our non-employee directors. During each period that such a director serves on our board of directors, he or she will receive an annual cash retainer fee of $60,000 which will be paid in quarterly installments. Each non-employee director will also receive an annual award of 60,000 Class B profits interest awards in NTI LP (each grant will vest in two equal installments on the anniversary of the grant date). Directors will also be reimbursed for certain reasonable expenses in connection with their services to us. We have not determined or set any additional fees for participation on committees at this time.
| Name |
Fees Earned or Paid in Cash ($) (1) |
Option Awards ($)(2) |
Total ($) | |||||
| Dan F. Smith |
45,000 | |||||||
| Thomas Hofmann |
45,000 | |||||||
| Scott D. Josey |
30,000 | |||||||
| (1) | Amounts in this row reflect the actual amount received by each director during the 2011 year, which consists of three retainer fee installments for Messrs. Smith and Hofmann, and two retainer fee installments for Mr. Josey. |
| (2) | Each of the directors received their grant of Class B profits interests in NTI LP for the 2011 year on May 27, 2011. Despite the fact that profits interests such as the Class B profits interest awards in NTI LP do not require the payment of an exercise price, we believe that these awards are economically similar to stock options due to the fact that they have no value for tax purposes at grant and will obtain value only as the price of the underlying security rises, and as such, are required to be reported in this title under the “Option Awards” column. Please note that no “options” in the traditional sense have been granted to our directors during 2011 fiscal year. Amounts included reflect the grant date fair value of the units computed in accordance with FASB ASC Topic 718. The assumptions used to calculate these values for were as follows: (a) the expected term was 6.5 years; (b) current price of the underlying unit was $1.00; (c) the expected volatility was 40.6%; (d) the expected dividend yield was 0.0%; and (e) the risk-free investment rate was 2.7%. The number of outstanding Class B profits interest awards in NTI LP held as of December 31, 2011 are as follows: Mr. Smith, ; Mr. Hofmann, ; and Mr. Josey, . |
Risk Assessment
Our board of directors has reviewed our compensation policies as generally applicable to our employees and believes that our policies do not encourage excessive and unnecessary risk-taking, and that the level of risk that they do encourage is not reasonably likely to have a material adverse effect on us. Our board of directors has reviewed and discussed the design features, characteristics, and performance metrics utilized at our company and our approval mechanisms of total compensation for all employees, including salaries, incentive plans, and equity-based compensation awards, to determine whether any of these policies or programs could create risks that are reasonably likely to have a material adverse effect on us.
Our compensation philosophy and culture support the use of base salary, performance-based compensation, and retirement plans that are generally uniform in design and operation throughout our
169
Table of Contents
Index to Financial Statements
organization and with all levels of employees. These compensation policies and practices are centrally designed and administered. In addition, the following specific factors, in particular, reduce the likelihood of excessive risk-taking:
| Ÿ | Our overall compensation levels are competitive with the market. |
| Ÿ | Our compensation mix is balanced among (i) fixed components like salary and benefits, and (ii) annual and long-term incentives that will only reward our executives upon our overall financial performance, business unit financial performance, operational measures and individual performance. |
| Ÿ | The compensation committee has discretion to reduce annual or performance-based awards when it determines that such adjustments would be appropriate based on our interests and the interests of our stockholders. |
170
Table of Contents
Index to Financial Statements
CERTAIN RELATIONSHIPS AND RELATED PERSON TRANSACTIONS
Limited Liability Company Agreement—NTI LLC
As a result of the transactions described in “Organizational Structure”, Northern Tier Energy, Inc. will be a holding company and its sole material asset will be an equity interest in NTI LLC. Northern Tier Energy, Inc., as sole managing member of NTI LLC, will operate and control all of the business and affairs of NTI LLC and its subsidiaries. As such, Northern Tier Energy, Inc., through our officers and directors, will be responsible for all operational and administrative decisions of NTI LLC and the day-to-day management of NTI LLC’s business.
The form of LLC Agreement is filed as an exhibit to the registration statement of which this prospectus forms a part, and the following description of the LLC Agreement is qualified in its entirety by reference thereto.
In accordance with the terms of the LLC Agreement, the Existing Owners will generally have the right to exchange their NTI LLC Units (and a corresponding number of shares of our Class B common stock) for shares of our Class A common stock on a one-for-one basis, subject to customary conversion rate adjustments for stock splits, stock dividends and reclassifications. The Existing Owners will be permitted to exchange their NTI LLC Units for shares of our Class A common stock on a quarterly basis. In addition, any exchanges involving or more NTI LLC Units may occur at any time. As the Existing Owners exchange their NTI LLC Units, our limited liability company interest in NTI LLC will increase proportionally and the Existing Owner’s shares of Class B common stock will be cancelled.
In accordance with the LLC Agreement, net profits and net losses of NTI LLC will be allocated to its members on a pro rata basis in accordance with their respective percentage ownership of NTI LLC Units. Accordingly, net profits and net losses of NTI LLC will initially be allocated, approximately % to us and approximately % to the Existing Owners (or % and %, respectively, if the underwriters’ option to purchase additional shares is exercised in full).
The holders of NTI LLC Units, including Northern Tier Energy, Inc., will incur U.S. federal, state and local income taxes on their proportionate share of any taxable income of NTI LLC. Net profits and net losses of NTI LLC will generally be allocated to its members (including Northern Tier Energy, Inc.) on a pro rata basis in accordance with their respective percentage ownership of NTI LLC Units. The LLC Agreement will provide for cash distributions to the holders of NTI LLC Units if we determine that the taxable income of NTI LLC will give rise to taxable income for such holders. In accordance with the LLC Agreement, we intend to cause NTI LLC to make cash distributions to the holders of NTI LLC Units for purposes of funding their tax obligations in respect of the income of NTI LLC that is allocated to them. Generally, these tax distributions will be computed based on our estimate of the taxable income of NTI LLC allocable to such holder of NTI LLC Units multiplied by an assumed tax rate equal to the highest effective marginal combined U.S. federal, state and local income tax rate prescribed for an individual or corporate resident in New York, New York (taking into account the nondeductibility of certain expenses and the character of our income).
The LLC Agreement will provide that at any time we issue a share of our Class A common stock, the net proceeds received by us with respect to such share, if any, shall be concurrently transferred to NTI LLC and NTI LLC shall issue to us one NTI LLC Unit. Conversely, if at any time, any shares of our Class A common stock are redeemed by us for cash, NTI LLC shall, immediately prior to such redemption of our Class A common stock, redeem an equal number of NTI LLC Units held by us, upon the same terms and for the same price, as the shares of our Class A common stock are redeemed.
171
Table of Contents
Index to Financial Statements
Tax Receivable Agreement
As described in “Prospectus Summary—Our Company—Marathon Acquisition,” we commenced operations in December 2010 through the Marathon Acquisition, which resulted in an increase at the time of such acquisition in the tax basis of the tangible and intangible assets acquired from Marathon. In addition, as described in “Use of Proceeds,” Northern Tier Energy, Inc. intends to contribute a portion of the proceeds of this offering to NTI LLC to be distributed by it to the Existing Owners. Northern Tier Energy, Inc. will be treated for U.S. federal income tax purposes as having used such distributed portion to directly purchase NTI LLC Units from the Existing Owners. Furthermore, as described in “—Limited Liability Company Agreement—NTI LLC,” in the future, the Existing Owners may exchange their NTI LLC Units (together with a corresponding number of shares of Northern Tier Energy, Inc.’s Class B common stock) for shares of our Class A common stock on a one-for-one basis, subject to customary conversion rate adjustments for stock splits, stock dividends and reclassification. NTI LLC intends to make an election under Section 754 of the Code effective for each taxable year in which an exchange of NTI LLC Units for shares of Class A common stock or a purchase of NTI LLC Units occurs. Pursuant to the Section 754 election, the distribution of offering proceeds to the Existing Owners and each future exchange of NTI LLC Units is expected to result in an adjustment to the tax basis of the tangible and intangible assets of NTI LLC, and these adjustments will be allocated to Northern Tier Energy, Inc. Certain of the adjustments to the tax basis of the tangible and intangible assets of NTI LLC described above would not have been available absent the Marathon Acquisition, and other such adjustments will not be available absent the distribution of offering proceeds to the Existing Owners and the subsequent exchanges of NTI LLC Units. Both the existing and the anticipated basis adjustments are expected to reduce the amount of tax that Northern Tier Energy, Inc. would otherwise be required to pay in the future. These basis adjustments may also decrease gains (or increase losses) on future dispositions of certain capital assets to the extent tax basis is allocated to those capital assets. In addition, it is anticipated that certain of the Existing Owners that merge into us in connection with the Existing Owner Exchange may have net operating loss carryforwards. Such net operating loss carryforwards would (subject to certain limitations imposed by the Code) be available for use by Northern Tier Energy, Inc.
Northern Tier Energy, Inc. intends to enter into the Tax Receivable Agreement with the Existing Owners, including ACON Refining and TPG Refining. This agreement generally provides for the payment by Northern Tier Energy, Inc. of 85% of the amount of cash savings, if any, in U.S. federal, state and local income tax or franchise tax that Northern Tier Energy, Inc. actually realizes (or are deemed to realize in certain circumstances) in periods after this offering as a result of (i) the increase in tax basis in NTI LLC’s assets that arose from the Marathon Acquisition, (ii) the basis increase resulting from the distribution of offering proceeds to the Existing Owners, (iii) the basis increases resulting from the exchanges of NTI LLC Units (along with the corresponding shares of our Class B common stock) for shares of Northern Tier Energy, Inc.’s Class A common stock, (iv) additional deductions allocated to Northern Tier Energy, Inc. pursuant to Section 704(c) of the Code to reflect the difference between the fair market value and the adjusted tax basis of NTI LLC’s assets as of the date of this offering, (v) imputed interest deemed to be paid by Northern Tier Energy, Inc. as a result of, and additional tax basis arising from, payments under the Tax Receivable Agreement, and (vi) any net operating losses available to Northern Tier Energy, Inc. as a result of the Existing Owner Exchange. In addition, the Tax Receivable Agreement will provide for interest earned from the due date (without extensions) of the corresponding tax return to the date of payment specified by the Tax Receivable Agreement.
The payment obligations under the Tax Receivable Agreement are Northern Tier Energy, Inc.’s obligations and are not obligations of NTI LLC. For purposes of the Tax Receivable Agreement, cash savings in tax generally are calculated by comparing Northern Tier Energy, Inc.’s actual income tax liability to the amount Northern Tier Energy, Inc. would have been required to pay had it not been able to utilize any of the tax benefits subject to the Tax Receivable Agreement. In order to calculate the amount we would have been required to pay, we will need to determine the tax basis in certain assets
172
Table of Contents
Index to Financial Statements
in effect prior to the Marathon Acquisition. This determination will be made in our sole judgment based on information received from Marathon in connection with the Marathon Acquisition and consistent with NTI LLC’s current tax reporting. This information will not be subject to verification by any third party, and there thus can be no assurance that the historic tax basis as determined by us will be accurate and that payments by us under the Tax Receivable Agreement will not exceed 85% of the cash savings that we actually realize. The term of the Tax Receivable Agreement will commence upon the completion of this offering and will continue until all such tax benefits have been utilized or expired, unless Northern Tier Energy, Inc. exercises its right to terminate the Tax Receivable Agreement.
Estimating the amount of payments that may be made under the Tax Receivable Agreement is by its nature imprecise, insofar as the calculation of amounts payable depends on a variety of factors. The actual increase in tax basis, as well as the amount and timing of any payments under the Tax Receivable Agreement, will vary depending upon a number of factors, including the timing of exchanges, the price of Northern Tier Energy, Inc.’s Class A common stock at the time of the exchange, the extent to which such exchanges are taxable, the amount and timing of the taxable income Northern Tier Energy, Inc. realizes in the future and the tax rate then applicable, Northern Tier Energy, Inc.’s use of loss carryovers and the portion of its payments under the Tax Receivable Agreement constituting imputed interest or depreciable or amortizable basis. Northern Tier Energy, Inc. expects that the payments that it will be required to make under the Tax Receivable Agreement will be substantial. Assuming no material changes in the relevant tax law and that we earn sufficient taxable income to realize all tax benefits that are subject to the Tax Receivable Agreement, we expect that future payments under the Tax Receivable Agreement associated with (i) the existing tax basis in NTI LLC’s assets that arose from the Marathon Acquisition, (ii) the basis increase resulting from the distribution of offering proceeds to the Existing Owners, (iii) additional deductions allocated to us pursuant to Section 704(c) of the Code to reflect the difference between the fair market value and the adjusted tax basis of NTI LLC’s assets as of the date of this offering and (iv) the use of any net operating losses available to us as a result of the Existing Owner Exchange will aggregate $ million and will range from approximately $ million to $ million per year over the next 15 years. The foregoing numbers are merely estimates and the actual payments could differ materially. Furthermore, these amounts reflect only the cash savings attributable to current tax attributes resulting from the four items described above. It is possible that future transactions or events could increase or decrease the actual tax benefits realized and the corresponding Tax Receivable Agreement payments. Future payments to the Existing Owners in respect of subsequent exchanges of NTI LLC Units would be in addition to these amounts and are expected to be substantial. There may be a substantial negative impact on our liquidity if, as a result of timing discrepancies or otherwise, (i) the payments under the Tax Receivable Agreement exceed the actual benefits we realize in respect of the tax attributes subject to the Tax Receivable Agreement and/or (ii) distributions to us by NTI LLC are not sufficient to permit us to make payments under the Tax Receivable Agreement subsequent to the payment of taxes and other obligations. The payments under the Tax Receivable Agreement will not be conditioned upon a holder of rights under a Tax Receivable Agreement having a continued ownership interest in either NTI LLC or us.
The Tax Receivable Agreement provides that upon certain mergers or other changes of control, obligations under the Tax Receivable Agreement (with respect to all NTI LLC Units, whether or not such units have been exchanged or acquired before or after such transaction) will continue based on certain assumptions, including that Northern Tier Energy, Inc. would have sufficient taxable income to fully utilize the deductions arising from the increased tax basis and other benefits subject to the Tax Receivable Agreement. As a result, Northern Tier Energy, Inc. could be required to make payments under the Tax Receivable Agreement that are greater than the specified percentage of the actual benefits, if any, it realizes in respect of the tax attributes subject to the Tax Receivable Agreement. If Northern Tier Energy, Inc. elects to terminate the Tax Receivable Agreement early, it would be required to make an immediate payment equal to the present value of the anticipated future tax
173
Table of Contents
Index to Financial Statements
benefits subject to the Tax Receivable Agreement (based upon certain assumptions and deemed events set forth in the Tax Receivable Agreement, including the assumption that it has sufficient taxable income to fully utilize such benefits and that any NTI LLC units that the Existing Owners or their transferees own on the termination date are deemed to be exchanged on the termination date). Any early termination payment may be made significantly in advance of the actual realization, if any, of such future benefits. In these situations, Northern Tier Energy, Inc.’s obligations under the Tax Receivable Agreement could have a substantial negative impact on Northern Tier Energy, Inc.’s liquidity and could have the effect of delaying, deferring or preventing certain mergers, asset sales, other forms of business combinations or other changes of control. For example, if the Tax Receivable Agreement were terminated immediately after this offering, the estimated termination payment would be approximately $ (calculated using a discount rate equal to ). The foregoing number is merely an estimate and the actual payment could differ materially. There can be no assurance that Northern Tier Energy, Inc. will be able to finance our obligations under the Tax Receivable Agreement.
Payments under the Tax Receivable Agreement will be based on the tax reporting positions that Northern Tier Energy, Inc. will determine. Although Northern Tier Energy, Inc. is not aware of any issue that would cause the IRS to challenge a tax basis increase or other benefits arising under the Tax Receivable Agreement, the holders of rights under the Tax Receivable Agreement will not reimburse Northern Tier Energy, Inc. for any payments previously made under the Tax Receivable Agreement if such basis increases or other benefits are subsequently disallowed, except that excess payments made to any such holder will be netted against payments otherwise to be made, if any, to such holder after our determination of such excess. As a result, in such circumstances, Northern Tier Energy, Inc. could make payments that are greater than our actual cash tax savings, if any, and may not be able to recoup those payments, which could adversely affect Northern Tier Energy, Inc.’s liquidity.
Decisions made by certain of the Existing Owners in the course of running our business, such as with respect to mergers, asset sales, other forms of business combinations or other changes in control, may influence the timing and amount of payments that are received by an exchanging or selling Existing Owner under the Tax Receivable Agreement. For example, the earlier disposition of assets following an exchange or acquisition transaction will generally accelerate payments under the Tax Receivable Agreement and increase the present value of such payments, and the disposition of assets before an exchange or acquisition transaction will increase an Existing Owner’s tax liability without giving rise to any rights of an Existing Owner to receive payments under the Tax Receivable Agreement.
Payments under the Tax Receivable Agreement, if any, will be made pro rata among all parties to the Tax Receivable Agreement entitled to payments on an annual basis to the extent we have sufficient taxable income to utilize the increased tax benefits. The availability of sufficient taxable income to utilize the increased tax benefits will not be determined until such time as the financial results for the year in question are known and tax estimates prepared, which typically occurs within days after the end of the applicable calendar year.
Payments are generally due under the Tax Receivable Agreement within days following the filing of Northern Tier Energy, Inc.’s tax return for the taxable year with respect to which the payment obligation arises, although interest on such payments will begin to accrue at a rate of from the due date (without extensions) of such tax return. In certain circumstances, Northern Tier Energy, Inc. may defer payments under the Tax Receivable Agreement, but only to the extent it does not have available cash to satisfy its payment obligations under the Tax Receivable Agreement. Such deferred payments would accrue interest at a rate of .
Because Northern Tier Energy, Inc. is a holding company with no operations of its own, its ability to make payments under the Tax Receivable Agreement is dependent on the ability of NTI LLC to make distributions to it in an amount sufficient to cover Northern Tier Energy, Inc.’s obligations under
174
Table of Contents
Index to Financial Statements
such agreements; this ability, in turn, may depend on the ability of NTI LLC’s subsidiaries to provide payments to it. The ability of NTI LLC and its subsidiaries to make such distributions will be subject to, among other things, the applicable provisions of Delaware law that may limit the amount of funds available for distribution and restrictions in our debt instruments. To the extent that Northern Tier Energy, Inc. is unable to make payments under the Tax Receivable Agreement for any reason, such payments will be deferred and will accrue interest until paid.
The form of the Tax Receivable Agreement is filed as an exhibit to the registration statement of which this prospectus forms a part, and the foregoing description of the Tax Receivable Agreement is qualified by reference thereto.
Registration Rights and Shareholders’ Agreement
Certain of the Existing Owners, their affiliates and certain of their transferees will enter into a registration rights and shareholders’ agreement with Northern Tier Energy, Inc. The existing registration rights agreement between us, ACON Refining and TPG Refining will be amended to provide that ACON Refining and TPG Refining can cause Northern Tier Energy, Inc. to register their shares of Class A common stock under the Securities Act and to maintain a shelf registration statement effective with respect to such shares. Additionally, the registration rights and shareholders’ agreement will place restrictions on each party’s right to transfer the Class A common stock without consent of the other party, and grant rights to the other party to participate on the same terms in mutually consented transfers. These provisions will be in effect for a limited time, and terminate earlier if the ownership interest of ACON Refining and TPG Refining falls below certain levels. Furthermore, each of ACON Refining and TPG Refining will have the right to elect two directors to the board of directors of Northern Tier Energy, Inc. so long as it beneficially owns 10% or more of the outstanding Class A common stock and one director so long as it beneficially owns 2% or more of the Class A common stock.
The form of registration rights and shareholders’ agreement is filed as an exhibit to the registration statement of which this prospectus forms a part, and the foregoing description of the registration rights and shareholders’ agreement is qualified by reference thereto.
Management Services Agreement
In 2010, Northern Tier Energy LLC entered into a management services agreement with ACON Funds Management L.L.C. (“ACON Management”), an affiliate of ACON Investments, and TPG Capital pursuant to which they provide Northern Tier Energy LLC with ongoing management, advisory and consulting services, which agreement was amended and restated in January 2012. In connection with the entry into the management services agreement, ACON Management and TPG Capital received a one-time aggregate transaction fee of $12.5 million, as well as reimbursements of out-of-pocket expenses incurred by them in connection with the Marathon Acquisition. Pursuant to the amended and restated management services agreement, ACON Management and an affiliate of TPG Capital also receive quarterly management fees equal to 1% of our “Adjusted EBITDA” (as defined in the agreement) for the previous quarter (subject to a minimum annual fee of $2 million), as well as reimbursements for out-of-pocket expenses incurred by them in connection with providing such management services. Northern Tier Energy LLC will also pay ACON Management and an affiliate of TPG Capital specified success fees in connection with advice they provide in relation with certain corporate transactions. The agreement also contains customary exculpation and indemnification provisions in favor of ACON Management and TPG Capital and their affiliates.
175
Table of Contents
Index to Financial Statements
Historical Transactions with ACON Refining and TPG Refining
ACON Refining and TPG Refining are equal owners of 97.5% of the partnership interests in NTI LP. An entity owned by certain members of our management team holds the remaining 2.5% partnership interests in NTI LP. ACON Refining and TPG Refining made capital contributions to NTI LP totaling an aggregate of $195 million and an entity owned by certain members of our management team made capital contributions of $5 million.
Related Person Sales and Purchases
Transactions with Marathon
From time to time, we may enter into related person transactions in the ordinary course of business.
During the Predecessor period, our related persons included:
| Ÿ | Marathon, which refines, markets and transports crude oil and petroleum products, primarily in the Midwest, Upper Great Plains, U.S. Gulf Coast and southwestern regions of the United States. |
| Ÿ | Marathon Oil Company, which is a wholly owned subsidiary of Marathon Oil. It purchases or produces crude oil in the United States that is used at Marathon’s refineries. |
| Ÿ | Marathon Petroleum Company Canada, Ltd., which is a wholly owned subsidiary of Marathon. It purchases crude oil in Canada to be used at Marathon’s refineries. |
| Ÿ | Marathon Petroleum Trading Canada LLC, which is a wholly owned subsidiary of Marathon. It purchases crude oil in Canada to be used at Marathon’s refineries. |
| Ÿ | Minnesota Pipe Line Company, in which we own a 17% interest. Minnesota Pipe Line Company owns and operates the Minnesota Pipeline. |
| Ÿ | Pilot Travel Centers LLC (“PTC”), in which Marathon sold its 50% interest in October 2008. PTC owns and operates travel centers in the United States. |
| Ÿ | SSA, which is a wholly-owned subsidiary of Marathon Oil. Under the Predecessor, SSA was the owner of SuperAmerica branded convenience stores that were sold to us as part of the Marathon Acquisition. |
We have historically sold refined products to Marathon. Refined product sales to Marathon were recorded at intercompany transfer prices that were market-based prices. Revenues from sales to related parties totaled $210.1 million for the eleven months ended November 30, 2010, which represented 6.6% of total revenues for that period. There were no related party sales for periods subsequent to the Marathon Acquisition. For more information on these related party sales, see Note 3 to our audited consolidated financial statements.
During the Predecessor period, we made purchases from our related parties, including:
| Ÿ | purchases from Marathon Oil Company, Marathon Petroleum Company Canada, Ltd. and Marathon Petroleum Trading Canada LLC consisting primarily of crude oil. Purchases from Marathon Oil Company are recorded at contracted prices that are market-based. Purchases from Marathon Petroleum Company Canada, Ltd. and Marathon Petroleum Trading Canada LLC are recorded at contracted prices based on their acquisition cost, plus an administrative fee; |
176
Table of Contents
Index to Financial Statements
| Ÿ | purchases from Marathon consisting primarily of refined products and refinery feedstocks, certain general and administrative costs and costs associated with employees associated with our refining segment participating in Marathon’s multi-employer benefit plans. Refined product and refinery feedstock purchases from Marathon are recorded at intercompany transfer prices that are market-based prices; |
| Ÿ | purchases from Minnesota Pipe Line Company consisting primarily of crude oil transportation services, which are based on published tariffs; and |
| Ÿ | purchases from SSA consisting of certain overhead costs and costs associated with employees associated with our retail segment participating in SSA’s multi-employer benefit plans. |
Purchases from related parties totaled $1,378.3 million for the eleven months ended November 30, 2010. There were no related party purchases for periods subsequent to the Marathon Acquisition. For more information on these related party purchases, see Note 3 to our audited consolidated financial statements.
Marathon has provided certain services to us such as marketing, crude acquisition, engineering, human resources, insurance, treasury, accounting, tax, legal, procurement and information technology services. Charges for these services were allocated based on usage or other methods, such as headcount, capital employed or store count, which management believes to be reasonable. Related party purchases reflect charges for these services of $26.5 million for the eleven months ended November 30, 2010. There were no related party purchases for periods subsequent to the Marathon Acquisition.
Until November 30, 2010, we participated in Marathon’s centralized cash management programs under which cash receipts were remitted to and cash disbursements were funded by Marathon or SSA. All intercompany activity associated with the transfer of cash was included in the net investment value.
For the eleven months ended November 30, 2010, we were considered to have participated in multi-employer benefit plans of Marathon. Our allocated share of Marathon’s employee benefit plan expenses, including costs related to stock-based compensation plans, was included in related party purchases and was $21.5 million for the eleven months ended November 30, 2010. There were no related party purchases for periods subsequent to the Marathon Acquisition. Expenses for employee benefit plans other than stock-based compensation plans were allocated to us primarily as a percentage of salary and wage expense. For the stock-based compensation plans, we were charged with the expenses directly attributed to our employees, which were $0.3 million for the eleven months ended November 30, 2010. For more information on these related party transactions, see Note 3 to our audited consolidated financial statements.
Our refinery supplies the gasoline and diesel sold in 90 independently owned and operated Marathon branded convenience stores in our marketing area. In connection with the Marathon Acquisition, we entered into an agreement with Marathon to supply substantially all of the gasoline and diesel requirements for the 90 independently owned and operated Marathon branded convenience stores in our marketing area. For the nine months ended September 30, 2011, Marathon purchased approximately $200 million of gasoline and diesel pursuant to this agreement. In addition, Marathon was issued $80 million of noncontrolling preferred interests in one of our subsidiaries in connection with the Marathon Acquisition.
Other Related Person Transactions
Chet Kuchta is our Vice President, Supply and has served in that position since August 2011. He is the brother of Hank Kuchta, our President and Chief Operating Officer and a member of our board of directors. During 2011, Mr. Chet Kuchta received aggregate compensation in the amount of $180,000.
177
Table of Contents
Index to Financial Statements
Procedures for Approval of Related Person Transactions
A “Related Person Transaction” is a transaction, arrangement or relationship in which we or any of our subsidiaries was, is or will be a participant, the amount of which involved exceeds $120,000, and in which any related person had, has or will have a direct or indirect material interest. A “Related Person” means:
| Ÿ | any person who is, or at any time during the applicable period was, one of our executive officers or one of our directors; |
| Ÿ | any person who is known by us to be the beneficial owner of more than 5% of our voting stock; |
| Ÿ | any immediate family member of any of the foregoing persons, which means any child, stepchild, parent, stepparent, spouse, sibling, mother-in-law, father-in-law, son-in-law, daughter-in-law, brother-in-law or sister-in-law of a director, executive officer or a beneficial owner of more than 5% of our voting stock, and any person (other than a tenant or employee) sharing the household of such director, executive officer or beneficial owner of more than 5% of our voting stock; and |
| Ÿ | any firm, corporation or other entity in which any of the foregoing persons is a partner or principal or in a similar position or in which such person has a 10% or greater beneficial ownership interest. |
Prior to the closing of this offering we will adopt a set of related person transaction policies designed to minimize potential conflicts of interest arising from any dealings we may have with our affiliates and to provide appropriate procedures for the disclosure, approval and resolution of any real or potential conflicts of interest which may exist from time to time. Such policies will provide, among other things, that all related person transactions, including any loans between us, our principal stockholders and our affiliates, will be approved by our nominating and corporate governance committee of the board of directors, after considering all relevant facts and circumstances, including without limitation the commercial reasonableness of the terms, the benefit and perceived benefit, or lack thereof, to us, opportunity costs of alternative transactions, the materiality and character of the related person’s direct or indirect interest, and the actual or apparent conflict of interest of the related person, and after determining that the transaction is in, or not inconsistent with, our and our stockholders’ best interests.
178
Table of Contents
Index to Financial Statements
The following tables set forth certain information with respect to the beneficial ownership of our capital stock by:
| Ÿ | each stockholder known by us to be the beneficial owner of more than 5% of any class of our outstanding voting stock; |
| Ÿ | each of our named executive officers; |
| Ÿ | each of our directors; and |
| Ÿ | all of our directors and executive officers as a group. |
The number of shares of our capital stock and of NTI LLC Units outstanding and the percentage of beneficial ownership before and after the consummation of the offering set forth below is presented after giving effect to the reorganization transactions described under “Organizational Structure.” The number of shares of our capital stock and NTI LLC Units outstanding and the percentage of beneficial ownership before this offering set forth below is based on the number of shares of our capital stock and NTI LLC Units, respectively, outstanding immediately prior to the closing of this offering. The number of shares of our capital stock and of NTI LLC Units outstanding and the percentage of beneficial ownership after this offering set forth below is based on the number of shares of our capital stock and NTI LLC Units, respectively, outstanding immediately after the closing of this offering.
Beneficial ownership is determined in accordance with the rules of the SEC. These rules generally attribute beneficial ownership of securities to persons who possess sole or shared voting power or investments power with respect to such securities. Except as otherwise indicated, we believe that all persons listed below have sole voting and investment power with respect to the shares beneficially owned by them, except to the extent this power may be shared with a spouse, based on information provided to us by such persons. Unless otherwise indicated by us, the address of each person or entity named in the table is 38C Grove Street, Suite 100, Ridgefield, Connecticut 06877.
179
Table of Contents
Index to Financial Statements
| Class A Common Stock Beneficially Owned(1) |
Combined Voting Powers(2) | |||||||||||||||||||||||||||||||||||
| Prior to the Offering |
After the Offering Assuming Underwriters’ Option is Not Exercised |
After the Offering Assuming Underwriters’ Option is Exercised in Full |
Prior to the Offering |
After the Offering Assuming Underwriters’ Option is Not Exercised |
After the Offering Assuming Underwriters’ Option is Exercised in Full |
|||||||||||||||||||||||||||||||
| Name of Beneficial Owner |
Number | % | Number | % | Number | % | % | % | % | |||||||||||||||||||||||||||
| 5% Stockholders |
||||||||||||||||||||||||||||||||||||
| ACON Refining Partners, L.L.C.(3) |
% | % | % | % | % | % | ||||||||||||||||||||||||||||||
| TPG Funds |
% | % | % | % | % | % | ||||||||||||||||||||||||||||||
| Directors and Named Executive Officers |
||||||||||||||||||||||||||||||||||||
| Mario E. Rodriguez(5)(6) |
— | — | — | — | — | — | % | % | % | |||||||||||||||||||||||||||
| Hank Kuchta(5)(6) |
— | — | — | — | — | — | % | % | % | |||||||||||||||||||||||||||
| Bernard W. Aronson(3) |
— | — | — | — | — | — | — | — | — | |||||||||||||||||||||||||||
| Jonathan Ginns(3) |
— | — | — | — | — | — | — | — | — | |||||||||||||||||||||||||||
| Michael MacDougall(7) |
— | — | — | — | — | — | — | — | — | |||||||||||||||||||||||||||
| Eric Liaw(8) |
— | — | — | — | — | — | — | — | — | |||||||||||||||||||||||||||
| Scott D. Josey |
— | — | — | — | — | — | % | % | % | |||||||||||||||||||||||||||
| Thomas Hofmann |
— | — | — | — | — | — | % | % | % | |||||||||||||||||||||||||||
| Dan F. Smith |
— | — | — | — | — | — | % | % | % | |||||||||||||||||||||||||||
| Neal Murphy(9) |
— | — | — | — | — | — | % | % | % | |||||||||||||||||||||||||||
| All directors and executive officers as a group (11 persons) |
% | % | % | % | % | % | ||||||||||||||||||||||||||||||
180
Table of Contents
Index to Financial Statements
| NTI LLC Units Beneficially Owned(1)(4) |
||||||||||||||||||
| Prior to the Offering |
After the Offering Assuming Underwriters’ Option is Not Exercised |
After the Offering Assuming Underwriters’ Option is Exercised in Full |
||||||||||||||||
| Name of Beneficial Owner |
Number | % | Number | % | Number | % | ||||||||||||
| 5% Stockholders |
||||||||||||||||||
| ACON Refining Partners, L.L.C. |
% | % | % | |||||||||||||||
| TPG Funds |
% | % | % | |||||||||||||||
| Directors and Named Executive Officers |
||||||||||||||||||
| Mario E. Rodriguez(5)(6) |
% | % | % | |||||||||||||||
| Hank Kuchta(5)(6) |
% | % | % | |||||||||||||||
| Bernard W. Aronson(3) |
— | — | — | |||||||||||||||
| Jonathan Ginns(3) |
— | — | — | |||||||||||||||
| Michael MacDougall(7) |
— | — | — | |||||||||||||||
| Eric Liaw(8) |
— | — | — | |||||||||||||||
| Scott D. Josey |
— | — | — | |||||||||||||||
| Thomas Hofmann |
— | — | — | |||||||||||||||
| Dan F. Smith |
— | — | — | |||||||||||||||
| Neal Murphy(9) |
% | % | % | |||||||||||||||
| All directors and executive officers as a group (11 persons) |
% | % | % | |||||||||||||||
| * | Represents less than 1%. |
| (1) | Immediately after the closing of the offering, the TPG Funds will hold shares of Class A common stock and shares of Class B common stock (collectively, “TPG Stock”), and none of the other persons listed will hold shares of our Class A common stock. |
| Subject to the terms of the LLC Agreement, the NTI LLC Units are exchangeable (together with a corresponding number of shares of Class B common stock) for shares of our Class A common stock on a one-for-one basis. See “Certain Relationships and Related Person Transactions—Limited Liability Company Agreement—NTI LLC.” Beneficial ownership of NTI LLC Units is not reflected as beneficial ownership of shares of our Class A common stock for which such units may be exchanged. |
| (2) | Represents percentage of voting power of our Class A common stock and Class B common stock voting together as a single class. The Existing Owners will hold one share of Class B common stock for each NTI LLC Unit that they own. Each share of Class B common stock has no economic rights, but entitles the holder thereof to one vote for each NTI LLC Unit held by such holder,. Accordingly, the Existing Owners collectively have a number of votes in Northern Tier Energy, Inc. equal to the number of NTI LLC Units that they hold. See “Description of Capital Stock—Class A Common Stock” and “—Class B Common Stock.” |
| (3) | ACON Funds Management, L.L.C. (“ACON Management”) is the managing member of AIP V GenPar, L.L.C., which in turn is the managing member of ACON Refining Partners, L.L.C. (“ARP”). ACON Management may be deemed, pursuant to Rule 13d-3 under the Exchange Act to beneficially own all of the securities held by ARP. Jonathan Ginns, Ken Brotman, Bernard Aronson, Daniel Jinich and Guillermo Bron are managing members and sole equity holders of ACON Management, and therefore, Messrs. Ginns, Brotman, Aronson, Jinich and Bron may be |
181
Table of Contents
Index to Financial Statements
| deemed to be the beneficial owners of, with indirect voting and dispositive authority over, the equity securities held by ACON Refining Partners, L.L.C. Messrs. Ginns, Brotman, Aronson, Jinich and Bron disclaim beneficial ownership of the securities of ARP except to the extent of their pecuniary interest therein. The address of ACON Management and Messrs. Ginns, Brotman, Aronson, Jinich and Bron is c/o ACON Funds Management, L.L.C., 1133 Connecticut Avenue, NW, Suite 700, Washington, D.C. 20036. |
| (4) | Includes shares of Class A common stock held by TPG VI DE BDH, L.P. (“TPG BDH”) a Delaware limited partnership, and shares of Class B common stock and NTI LLC Units held by TPG Refining, L.P. (“together with TPG BDH, the “TPG Funds”). The general partner of TPG Refining, L.P. and TPG BDH is TPG VI AIV SLP SD, L.P., a Delaware limited partnership, whose general partner is TPG VI AIV SLP SD Advisors, LLC, a Delaware limited liability company, whose general partner is TPG Holdings II, L.P., a Delaware limited partnership, whose general partner is TPG Holdings II-A, LLC, a Delaware limited liability company, whose sole member is TPG Group Holdings (SBS), L.P., a Delaware limited partnership, whose general partner is TPG Group Holdings (SBS) Advisors, Inc. (“Group Advisors”), a Delaware corporation. David Bonderman and James G. Coulter are officers, directors and sole shareholders of Group Advisors and may therefore be deemed to be the beneficial owners of the TPG Stock and the NTI LLC Units held by the TPG Funds. Messrs. Bonderman and Coulter disclaim beneficial ownership of the TPG Stock and the NTI LLC Units held by the TPG Funds except to the extent of their pecuniary interest therein. The address of Group Advisors and Messrs. Bonderman and Coulter is c/o TPG Capital, L.P., 301 Commerce Street, Suite 3300, Fort Worth, TX 76102. |
| (5) | Messrs. Rodriguez and Kuchta hold unvested interests in NTI Management. The amounts shown in the table setting forth the beneficial ownership of NTI LLC Units include NTI LLC Units to be distributed upon the vesting of their interests in NTI Management. |
| (6) | Includes NTI LLC Units and Class B common stock held by NTR Partners, L.L.C. and NTR Partners II, L.L.C. (together, the “NTR Partners Entities”). Messrs. Rodriguez and Kuchta, as the controlling persons of the NTR Partners Entities, may be deemed to share beneficial ownership of any NTI LLC Units and Class B common stock held by the NTR Partners Entities. |
| (7) | Mr. MacDougall, who is one of our directors, is a partner of TPG Capital. Mr. MacDougall has no voting or investment power over and disclaims beneficial ownership of the TPG Stock and the NTI LLC Units held by the TPG Funds. The address of Mr. MacDougall is c/o TPG Capital, L.P., 301 Commerce Street, Suite 3300, Fort Worth, TX 76102. |
| (8) | Mr. Liaw, who is one of our directors, is a vice president of TPG Capital. Mr. Liaw has no voting or investment power over and disclaims beneficial ownership of the TPG Stock and the NTI LLC Units held by the TPG Funds. The address of Mr. Liaw is c/o TPG Capital, L.P., 301 Commerce Street, Suite 3300, Fort Worth, TX 76102. |
| (9) | Mr. Murphy departed our company on August 22, 2011. |
182
Table of Contents
Index to Financial Statements
As discussed under “Organizational Structure—Reorganization Transactions,” the allocation of NTI LLC Units among the Existing Owners will be determined pursuant to the distribution provisions of the existing amended and restated limited partnership agreement of NTI LP based upon the liquidation value of NTI LP, which will be implied by the initial public offering price of the shares of Class A common stock sold in this offering. The foregoing tables assume that the shares of Class A common stock to be sold in this offering are sold at $ per share (the midpoint of the price range indicated on the front cover of this prospectus). Accordingly, the precise holdings of NTI LLC Units by particular Existing Owners could differ from that presented in the table above. The following table presents the ownership of Class A common stock and NTI LLC Units following the completion of this offering by the individuals identified in the previous tables at the low, mid and high-points of the price range indicated on the front cover of this prospectus, assuming that the underwriters option to purchase additional shares is not exercised:
| Initial Public Offering Price Per Share | ||||||||||||
| $ | $ | $ | ||||||||||
| Name of Beneficial Owner |
Class A Common Stock |
NTI LLC Units |
Class A Common Stock |
NTI LLC Units |
Class A Common Stock |
NTI LLC Units | ||||||
| 5% Stockholders |
||||||||||||
| ACON Refining Partners, L.L.C. |
||||||||||||
| c/o ACON Funds Management, L.L.C. |
||||||||||||
| TPG Funds c/o TPG Capital, L.P. |
||||||||||||
| Directors and Named Executive Officers |
||||||||||||
| Mario E. Rodriguez |
||||||||||||
| Hank Kuchta |
||||||||||||
| Bernard W. Aronson |
||||||||||||
| Jonathan Ginns |
||||||||||||
| Michael MacDougall |
||||||||||||
| Eric Liaw |
||||||||||||
| Scott D. Josey |
||||||||||||
| Thomas Hofmann |
||||||||||||
| Dan F. Smith |
||||||||||||
| Neal Murphy |
||||||||||||
| All directors and executive officers as a group (11 persons) |
||||||||||||
| * | Represents less than 1%. |
183
Table of Contents
Index to Financial Statements
Upon completion of this offering, the authorized capital stock of Northern Tier Energy, Inc. will consist of shares of Class A common stock, $0.01 par value per share, of which shares will be issued and outstanding, shares of Class B common stock, $0.01 par value per share, of which shares will be issued and outstanding and shares of preferred stock, $0.01 par value per share, of which no shares will be issued and outstanding.
We will adopt an amended and restated certificate of incorporation and amended and restated bylaws concurrently with the completion of this offering. The following summary of the capital stock and certificate of incorporation and bylaws of Northern Tier Energy, Inc. does not purport to be complete and is qualified in its entirety by reference to the provisions of applicable law and to our amended and restated certificate of incorporation and amended and restated bylaws, which are filed as exhibits to the registration statement of which this prospectus is a part.
Class A Common Stock
Holders of shares of our Class A common stock are entitled to one vote for each share held of record on all matters submitted to a vote of stockholders and do not have cumulative voting rights.
Holders of shares of our Class A common stock are entitled to ratably receive dividends when and if declared by our board of directors out of funds legally available therefor, subject to any statutory or contractual restrictions on the payment of dividends and to any restrictions on the payment of dividends imposed by the terms of any outstanding preferred stock.
Upon our dissolution or liquidation or the sale of all or substantially all of our assets, after payment in full of all amounts required to be paid to creditors and to the holders of preferred stock having liquidation preferences, if any, the holders of shares of our Class A common stock will be entitled to receive pro rata our remaining assets available for distribution.
Holders of shares of our Class A common stock do not have preferences or preemptive, subscription, redemption or conversion rights.
Class B Common Stock
Holders of shares of our Class B common stock are entitled to one vote for each share held of record on all matters submitted to a vote of stockholders. In connection with the reorganization and this offering, the Existing Owners will be issued one share of Class B common stock for each NTI LLC Unit that they hold. Accordingly, the Existing Owners collectively have a number of votes in Northern Tier Energy, Inc. equal to the aggregate number of NTI LLC Units that they hold.
Holders of shares of our Class A common stock and Class B common stock vote together as a single class on all matters presented to our stockholders for their vote or approval, except as otherwise required by applicable law.
Holders of our Class B common stock do not have any right to receive dividends or to receive a distribution upon a liquidation or winding up of Northern Tier Energy, Inc.
Preferred Stock
The preferred stock, if issued, would have priority over the common stock with respect to dividends and other distributions, including the distribution of our assets upon liquidation. Our board of directors has the authority, without further stockholder authorization, to issue from time to time shares
184
Table of Contents
Index to Financial Statements
of preferred stock in one or more series and to fix the terms, limitations, relative rights and preferences and variations of each series. Although we have no present plans to issue any shares of preferred stock, the issuance of shares of preferred stock, or the issuance of rights to purchase such shares, could decrease the amount of earnings and assets available for distribution to the holders of common stock, could adversely affect the rights and powers, including voting rights, of the common stock and could have the effect of delaying, deterring or preventing a change in control of us or an unsolicited acquisition proposal.
Certain Provisions of Our Certificate of Incorporation and By-laws
Provisions of our certificate of incorporation and by-laws, which will become effective upon the closing of this offering, may delay or discourage transactions involving an actual or potential change of control or change in our management, including transactions in which stockholders might otherwise receive a premium for their shares, or transactions that our stockholders might otherwise deem to be in their best interests. Therefore, these provisions could adversely affect the price of our Class A common stock.
Among other things, our by-laws provide that, at any time that ACON Refining and TPG Refining no longer beneficially own at least 50% of our outstanding voting power, or if we fail to qualify as a “controlled company” under the NYSE rules:
| Ÿ | any action to be taken by our stockholders must be effected at a duly called annual or special meeting and not by a consent in writing, |
| Ÿ | annual or special meetings of the stockholders can only be called pursuant to a resolution adopted by a majority of our board of directors or by the chairman of the board, |
| Ÿ | our board of directors would be divided into three classes, with each class serving for a term of three years, |
| Ÿ | vacancies on the board, including newly created directorships, would be filled for the remainder of the relevant term by a majority of the directors then in office, and |
| Ÿ | our directors may be removed only for cause and only by affirmative vote of holders of a majority of the combined voting power of our then-outstanding capital stock. |
Our bylaws provide that stockholders seeking to bring business before an annual or special meeting of stockholders or to nominate candidates for election as directors at an annual or special meeting of stockholders, must comply with advance notice requirements in writing. To be timely, a stockholder’s notice must be received at our principal executive offices not less than 90 days nor more than 120 days prior to the anniversary date of the immediately preceding annual meeting of stockholders. In the event that the annual meeting is called for a date that is not within 30 days before or 60 days after the anniversary date, in order to be timely, notice from the stockholder must be received:
| Ÿ | not earlier than 120 days prior to the annual meeting of stockholders, and |
| Ÿ | not later than 90 days prior to the annual meeting of stockholders or, if the first public announcement of the date of such annual meeting is less than 100 days prior to the date of such annual meeting, the tenth day following the date on which notice of the annual meeting was made public. |
In the case of a special meeting of stockholders called for the purpose of electing directors, notice by the stockholder, in order to be timely, must be received:
| Ÿ | not earlier than 120 days prior to the special meeting, and |
| Ÿ | not later than 90 days prior to the special meeting or the close of business on the tenth day following the day on which public disclosure of the date of the special meeting was made. |
185
Table of Contents
Index to Financial Statements
Our bylaws also specify requirements as to the form and content of a stockholder’s notice. These provisions may preclude stockholders from bringing matters before an annual or special meeting of stockholders or from making nominations for directors at an annual or special meeting of stockholders or from making nominations for directors at an annual or special meeting of stockholders. In addition, our certificate of incorporation permits our board of directors to amend or repeal our bylaws by majority vote, but requires a two-thirds supermajority vote of stockholders to amend or repeal our bylaws.
The provisions in our certificate of incorporation and our bylaws are intended to enhance the likelihood of continuity and stability in the composition of the board of directors and in the policies formulated by the board of directors and to discourage certain types of transactions that may involve an actual or threatened change of control of our company. These provisions also are designed to reduce our vulnerability to an unsolicited takeover proposal that does not contemplate the acquisition of all of the outstanding shares of our common stock or an unsolicited proposal for the restructuring or sale of all or part of us. These provisions, however, could discourage potential acquisition proposals and could delay or prevent a change in control of our company. They may also have the effect of preventing changes in our management.
Opt-Out of Section 203 of the DGCL
We have expressly elected not to be governed by the “business combination” provisions of Section 203 of the DGCL. At any time after ACON Refining and TPG Refining no longer collectively beneficially own at least 25% of the outstanding shares of our voting stock, such election shall be automatically withdrawn and we will thereafter be governed by the “Business Combination” provisions of Section 203 of the DGCL. Section 203 prohibits a person who acquires more than 15% but less than 85% of all classes of our outstanding voting stock without the approval of our board of directors from merging or combining with us for a period of three years from the time when such person acquired such shares, unless the merger or combination is approved by a two-thirds vote of the shares not owned by such person. These provisions would apply even if the proposed merger or acquisition could be considered beneficial by some shareholders.
Limitation of Liability and Indemnification Matters
Our certificate of incorporation limits the liability of our directors for monetary damages for breach of their fiduciary duty as directors, except for liability that cannot be eliminated under the DGCL. Delaware law provides that directors of a company will not be personally liable for monetary damages for breach of their fiduciary duty as directors, except for liabilities:
| Ÿ | for any breach of their duty of loyalty to us or our stockholders; |
| Ÿ | for acts or omissions not in good faith or which involve intentional misconduct or a knowing violation of law; |
| Ÿ | for unlawful payment of dividend or unlawful stock repurchase or redemption, as provided under Section 174 of the DGCL; or |
| Ÿ | for any transaction from which the director derived an improper personal benefit. |
Any amendment, repeal or modification of these provisions will be prospective only and would not affect any limitation on liability of a director for acts or omissions that occurred prior to any such amendment, repeal or modification.
Our certificate of incorporation and bylaws also provide that we will indemnify our directors and officers to the fullest extent permitted by Delaware law. Our certificate of incorporation and bylaws also permit us to purchase insurance on behalf of any officer, director, employee or other agent for any liability arising out of that person’s actions as our officer, director, employee or agent, regardless of
186
Table of Contents
Index to Financial Statements
whether Delaware law would permit indemnification. We intend to enter into indemnification agreements with each of our current and future directors and officers. These agreements will require us to indemnify these individuals to the fullest extent permitted under Delaware law against liability that may arise by reason of their service to us, and to advance expenses incurred as a result of any proceeding against them as to which they could be indemnified. We believe that the limitation of liability provision in our certificate of incorporation and the indemnification agreements will facilitate our ability to continue to attract and retain qualified individuals to serve as directors and officers.
Transfer Agent and Registrar
Upon completion of the offering, the transfer agent and registrar for our Class A common stock is American Stock Transfer & Trust Company, LLC.
Listing
We expect to list our Class A common stock for quotation on the New York Stock Exchange under the symbol “NTI.”
187
Table of Contents
Index to Financial Statements
SHARES ELIGIBLE FOR FUTURE SALE
Prior to this offering, there has been no market for our Class A common stock. We cannot predict the effect, if any, that future sales of Class A common stock or the perception that such sales may occur may have on the market price of our Class A common stock.
Upon the closing of this offering, we will have outstanding an aggregate of shares of Class A common stock. Of these shares, shares of our Class A common stock outstanding (or shares of Class A common stock if the underwriters exercise in full their option to purchase additional shares of Class A common stock) sold in this offering will be freely tradable without restriction or further registration under the Securities Act by persons other than our “affiliates” as defined in Rule 144 under the Securities Act, which would be subject to the limitations and restrictions described below under “—Rule 144.”
In addition, subject to certain limitations and exceptions, pursuant to the terms of the LLC Agreement we intend to enter into with the Existing Owners, holders of NTI LLC Units (other than us) may (subject to the terms of the LLC Agreement) exchange NTI LLC Units (together with a corresponding number of shares of our Class B common stock) for shares of our Class A common stock on a one-for-one basis, subject to customary conversion rate adjustments for stock splits, stock dividends and reclassifications. Upon consummation of this offering, the Existing Owners will hold NTI LLC Units (or NTI LLC Units if the underwriters exercise in full their option to purchase additional shares of Class A common stock), all of which (together with a corresponding number of shares of our Class B common stock) will be exchangeable for shares of our Class A common stock. See “Certain Relationships and Related Person Transactions—Limited Liability Company Agreement—NTI LLC.” The shares of Class A common stock we issue upon such exchanges would be “restricted securities” as defined in Rule 144 described below. However, upon the closing of this offering, we intend to enter into a registration rights and shareholders agreement with the Existing Owners that will require us to register under the Securities Act these shares of Class A common stock. See “—Registration Rights.”
Lock-up Agreements
We, our directors and executive officers and certain of our principal stockholders have agreed with the underwriters not to dispose of any Class A common stock for a period of 180 days from the date of this prospectus, subject to certain exceptions and extensions, without the prior consent of Goldman, Sachs & Co. See “Underwriting.”
Rule 144
In general, under Rule 144 under the Securities Act as currently in effect, once we have been a reporting company subject to the reporting requirements of Section 13 or 15(d) of the Exchange Act for 90 days, a person (or persons whose shares are aggregated) who is not deemed to have been an affiliate of ours at any time during the three months preceding a sale, and who has beneficially owned restricted securities within the meaning of Rule 144 for at least six months (including any period of consecutive ownership of preceding non-affiliated holders) would be entitled to sell those shares, subject only to the availability of current public information about us. A non-affiliated person who has beneficially owned restricted securities within the meaning of Rule 144 for at least one year would be entitled to sell those shares without regard to the provisions of Rule 144.
Once we have been a reporting company subject to the reporting requirements of Section 13 of 15(d) of the Exchange Act for 90 days, a person (or persons whose shares are aggregated) who is deemed to be an affiliate of ours and who has beneficially owned restricted securities within the
188
Table of Contents
Index to Financial Statements
meaning of Rule 144 for at least six months would be entitled to sell within any three-month period a number of shares that does not exceed the greater of one percent of the then outstanding shares of our Class A common stock or the average weekly trading volume of our Class A common stock reported through the NYSE during the four calendar weeks preceding the filing of notice of the sale. Such sales are also subject to certain manner of sale provisions, notice requirements and the availability of current public information about us.
For purposes of Rule 144, an “affiliate” of an issuer is a person that directly or indirectly controls, is controlled by or is under common control with that issuer.
Rule 701
In general, under Rule 701 under the Securities Act, any of our employees, directors, officers, consultants or advisors who purchases shares from us in connection with a compensatory stock or option plan or other written agreement before the effective date of this offering is entitled to sell such shares 90 days after the effective date of this offering in reliance on Rule 144, without having to comply with the holding period requirement of Rule 144 and, in the case of non-affiliates, without having to comply with the public information, volume limitation or notice filing provisions of Rule 144. The SEC has indicated that Rule 701 will apply to typical stock options granted by an issuer before it becomes subject to the reporting requirements of the Exchange Act, along with the shares acquired upon exercise of such options, including exercises after the date of this prospectus.
Stock Issued Pursuant to Long-Term Incentive Plan
In addition, shares of Class A common stock may be granted under our LTIP. See “Compensation Discussion and Analysis—Actions Taken After the 2010 Fiscal Year—Long-Term Incentive Plan.” We intend to file a registration statement on Form S-8 under the Securities Act to register shares of Class A common stock or securities convertible into or exchangeable for shares of Class A common stock issued under or covered by our Long-Term Incentive Plan. The registration statement on Form S-8 is expected to be filed following the effective date of the registration statement of which this prospectus is a part and will be effective upon filing. Accordingly, shares registered under such registration statement will be available for sale in the open market following the effective date, unless such shares are subject to vesting restrictions, Rule 144 restrictions applicable to our affiliates or the lock-up restrictions described above.
Registration Rights
In connection with this offering we will enter into a registration rights and shareholders agreement with the Existing Owners. Under certain circumstances, and subject to the lock-up agreements described above, these persons and certain of their transferees can require us to register under the Securities Act shares of Class A common stock held by them, including Class A common stock delivered in exchange for NTI LLC Units. See “Certain Relationships and Related Person Transactions—Registration Rights and Shareholders’ Agreement.”
189
Table of Contents
Index to Financial Statements
MATERIAL U.S. FEDERAL INCOME AND ESTATE TAX CONSIDERATIONS
TO NON-U.S. HOLDERS OF OUR CLASS A COMMON STOCK
The following is a general discussion of the material U.S. federal income and estate tax consequences to a non-U.S. holder (as defined below) of the acquisition, ownership and disposition of our Class A common stock. The following discussion is based on current provisions of the Code, the Treasury Regulations promulgated thereunder, and administrative and judicial interpretations thereof, all as in effect on the date hereof, and all of which are subject to change, possibly with retroactive effect.
For the purpose of this discussion, a non-U.S. holder is any beneficial owner of our Class A common stock that is not, for U.S. federal income tax purposes, any of the following:
| Ÿ | an individual who is a citizen or resident of the United States (as determined for U.S. federal income tax purposes); |
| Ÿ | a corporation (or other entity treated as a corporation for U.S. federal income tax purposes) created or organized in or under the laws of the United States, any state thereof or the District of Columbia; |
| Ÿ | a partnership (or other entity treated as a partnership or other pass through entity for U.S. federal income tax purposes); |
| Ÿ | an estate the income of which is subject to U.S. federal income tax regardless of its source; or |
| Ÿ | a trust (x) if a U.S. court is able to exercise primary supervision over the administration of the trust and one or more U.S. persons (within the meaning of Section 7701(a)(30) of the Code) have authority to control all substantial decisions of the trust or (y) that has made a valid election to be treated as a U.S. person. |
If a partnership (or an entity treated as a partnership for U.S. federal income tax purposes) holds our Class A common stock, the tax treatment of a partner in the partnership will generally depend on the status of the partner and the activities of the partnership. Partnerships that hold our Class A common stock, and partners in such partnerships, should consult their own tax advisors regarding the tax consequences of the acquisition, ownership and disposition of our Class A common stock.
This discussion is limited to non-U.S. holders that will hold our Class A common stock issued pursuant to this offering as a capital asset within the meaning of Section 1221 of the Code (generally, property held for investment). This discussion does not address all of the U.S. federal income and estate tax consequences that may be relevant to a non-U.S. holder in light of such holder’s particular circumstances, nor does it consider special situations, such as:
| Ÿ | tax consequences to non-U.S. holders that may be subject to special treatment under U.S. federal income tax laws, including, without limitation, U.S. expatriates, insurance companies, tax-exempt or governmental organizations, mutual funds, dealers or traders in securities or currency, banks or other financial institutions, investors whose functional currency is other than the U.S. dollar, “controlled foreign corporations,” “passive foreign investment companies,” common trust funds, certain trusts, and hybrid entities; |
| Ÿ | tax consequences to investors that hold our Class A common stock as part of a hedge, straddle, synthetic security, conversion transaction or other integrated investment; |
| Ÿ | any gift tax consequences; |
| Ÿ | any alternative minimum tax consequences; or |
| Ÿ | any aspects of state, local or non-U.S. taxation. |
190
Table of Contents
Index to Financial Statements
Prospective investors should consult their own tax advisors regarding the U.S. federal income and estate tax consequences to them in light of their own particular circumstances, as well as any tax consequences arising under the U.S. federal gift or alternative minimum tax laws and the laws of any state, local or non-U.S. taxing jurisdiction, the effect of any changes in applicable tax law and their entitlement to benefits under any applicable tax treaty.
Distributions on Our Class A Common Stock
We have not made any distributions on our Class A common stock, and we do not plan to make any distributions in the foreseeable future. However, if we do make distributions of cash or other property on our Class A common stock, those distributions will constitute dividends for U.S. tax purposes to the extent paid from our current or accumulated earnings and profits, as determined under U.S. federal income tax principles. To the extent those distributions exceed our current and accumulated earnings and profits, the distributions will constitute a return of capital and will first reduce a non-U.S. holder’s adjusted tax basis in its Class A common stock, but not below zero, and then will be treated as gain from the sale of Class A common stock (see “—Gain on Disposition of Class A Common Stock”).
Any dividends paid to a non-U.S. holder of our Class A common stock generally will be subject to withholding of U.S. federal income tax at a rate of 30%, or such lower rate as may be specified by an applicable tax treaty, of the gross amount of the dividend. To receive the benefit of a reduced treaty rate, a non-U.S. holder must provide us with an IRS Form W-8BEN or other appropriate version of IRS Form W-8 certifying qualification for the reduced rate. A non-U.S. holder of our Class A common stock that is eligible for a reduced rate of U.S. federal withholding tax under an income tax treaty may obtain a refund from the IRS of any excess amounts withheld by timely filing an appropriate claim for refund with the IRS.
Dividends received by a non-U.S. holder that are effectively connected with a trade or business conducted by the non-U.S. holder in the United States (and, if an applicable tax treaty so provides, are attributable to a permanent establishment or fixed base maintained by the non-U.S. holder in the United States) generally will be exempt from the withholding tax described above and instead will be subject to U.S. federal income tax on a net income basis at the same graduated rates generally applicable to U.S. persons. To obtain this exemption from withholding tax, the non-U.S. holder must provide us with an IRS Form W-8ECI properly certifying eligibility for such exemption. In addition to the income tax described above, dividends received by a corporate non-U.S. holder that are effectively connected with a trade or business conducted by the corporate non-U.S. holder in the United States (and, if an applicable tax treaty so provides, are attributable to a permanent establishment or fixed base maintained by the corporate non-U.S. holder in the United States) may be subject to a branch profits tax at a rate of 30% or such lower rate as may be specified by an applicable tax treaty.
Gain on Disposition of Class A Common Stock
A non-U.S. holder generally will not be subject to U.S. federal income tax on any gain realized upon the sale or other disposition of our Class A common stock unless:
| Ÿ | the gain is effectively connected with a trade or business conducted by the non-U.S. holder in the United States (and, if an applicable tax treaty so provides, is attributable to a permanent establishment or fixed base maintained by the non-U.S. holder in the United States), in which case the non-U.S. holder generally will be subject to U.S. federal income tax on any gain realized upon the sale or other disposition on a net income basis at the same graduated rates generally applicable to U.S. persons (furthermore, the branch profits tax described above also may apply to a corporate non-U.S. holder); |
191
Table of Contents
Index to Financial Statements
| Ÿ | the non-U.S. holder is an individual who is present in the United States for a period or periods aggregating 183 days or more during the calendar year in which the sale or disposition occurs and certain other conditions are met, in which case the non-U.S. holder will be subject to a flat 30% U.S. federal income tax (or such lower rate as may be specified by an applicable tax treaty), which may be offset by U.S. source capital losses, provided that the non-U.S. holder has timely filed U.S. federal income tax returns with respect to such losses; or |
| Ÿ | we are or have been a “U.S. real property holding corporation” (“USRPHC”) for U.S. federal income tax purposes at any time within the shorter of the five-year period preceding the date of the sale or other disposition and the non-U.S. holder’s holding period, in which case the non-U.S. holder will be subject to tax as described in the following paragraph. |
Generally, a corporation is a USRPHC if the fair market value of its “United States real property interests” equals or exceeds 50% of the sum of the fair market value of its worldwide real property interests and its other assets used or held for use in a trade or business (all as determined for U.S. federal income tax purposes). For this purpose, real property interests include land, improvements and associated personal property. We believe that we are not currently, and we do not anticipate becoming in the future, a USRPHC for U.S. federal income tax purposes. If we are a USRPHC at any time during the applicable testing period described above, then, provided that our Class A common stock is considered to be “regularly traded on an established securities market” (within the meaning of Section 897 of the Code and the applicable Treasury Regulations) at any time during the calendar year in which the future sale or other disposition occurs, and the non-U.S. holder does not own (directly, indirectly or constructively) at any time during the five-year period ending on the date of the sale or other disposition more than 5% of our Class A common stock, gains realized upon the sale or other disposition of our Class A common stock generally will not be subject to U.S. federal income tax pursuant to the second bullet point above. If we are a USRPHC at any time during the applicable testing period described above and our Class A common stock is not considered to be “regularly traded on an established securities market,” upon a future sale or other disposition of our Class A common stock, a non-U.S. holder will be subject to U.S. federal income tax on a net income basis at the same graduated rates generally applicable to U.S. persons and will be subject to U.S. federal income tax withholding on the amount realized from such sale or other disposition at a 10% rate. Non-U.S. holders should consult their own tax advisors with respect to the application of the foregoing rules to their ownership and disposition of our Class A common stock.
U.S. Federal Estate Tax
Our Class A common stock owned or treated as owned by an individual who is not a citizen or resident of the United States (as specifically defined for U.S. federal estate tax purposes) at the time of death will be includible in the individual’s gross estate for U.S. federal estate tax purposes and may be subject to U.S. federal estate tax unless an applicable estate tax treaty provides otherwise.
Information Reporting and Backup Withholding
Generally, we must report annually to the IRS the amount of dividends paid to each non-U.S. holder, the name and address of the recipient, and the amount, if any, of tax withheld with respect to those dividends, regardless of whether withholding was required. In addition, payments of the proceeds from the sale or other disposition of our Class A common stock are potentially subject to information reporting to the IRS. If the sale or other disposition is effected outside the U.S. by or through a foreign office of a broker, information reporting will apply to payments of the proceeds if the broker does not have documentary evidence that the holder is a non-U.S. holder, an exemption is not otherwise established, and the broker has certain relationships with the United States. If the sale or other disposition is effected by or through a U.S. office of a broker, information reporting will apply to
192
Table of Contents
Index to Financial Statements
payments of the proceeds unless the non-U.S. holder establishes an exemption, for example, by properly certifying its non-U.S. status on an IRS Form W-8BEN or another appropriate version of IRS Form W-8. Notwithstanding the foregoing, information reporting may apply if the broker has actual knowledge, or reason to know, that the beneficial owner is a U.S. person. Pursuant to tax treaties or other agreements, the IRS may make its reports available to tax authorities in the recipient’s country of residence.
Payments of the proceeds from sale or other disposition by a non-U.S. holder of our Class A common stock effected outside the U.S. by or through a foreign office of a broker generally will not be subject to backup withholding. Dividends and the proceeds from the sale or other disposition of our Class A common stock effected by or through a U.S. office of a broker are potentially subject to backup withholding (at the applicable rate, which is currently 28%). In general, backup withholding will not apply to payments to a non-U.S. holder if the holder has provided the required certification that it is a non-U.S. holder, such as providing an IRS Form W-8BEN or IRS Form W-8ECI. Notwithstanding the foregoing, backup withholding may apply if either we or a broker or other paying agent has actual knowledge, or reason to know, that the beneficial owner is a U.S. person that is not an exempt recipient.
Backup withholding is not an additional tax. Any amounts withheld under the backup withholding rules will be allowed as a refund or credit against a holder’s U.S. federal income tax liability, provided that the required information is furnished to the IRS in a timely manner.
Non-U.S. holders should consult their own tax advisors regarding the application of the information reporting and backup withholding rules to them.
Legislation Affecting Class A Common Stock Held Through Foreign Accounts
The Foreign Account Tax Compliance Act, or FATCA, was enacted in 2010 as part of the Hiring Incentives to Restore Employment Act. Subject to certain exceptions, FATCA generally imposes a withholding tax of 30% on distributions paid with respect to shares of our Class A common stock, and the gross proceeds from the disposition of shares of our Class A common stock paid, to a “foreign financial institution” (as specifically defined under these rules) after December 31, 2012 (regardless of whether the foreign financial institution holds such shares of our Class A common stock for its own account or as an intermediary), unless such institution enters into an agreement with the U.S. government to comply with certain obligations with respect to each account it maintains, including the obligations to collect and provide to the U.S. tax authorities information regarding U.S. account holders of such institution (which would include certain equity and debt holders of such institution, as well as certain account holders that are foreign entities with U.S. owners). In addition, subject to certain exceptions, FATCA also generally imposes a withholding tax of 30% on distributions paid with respect to shares of our Class A common stock, and the gross proceeds from the disposition of shares of our Class A common stock paid, to a “non-financial foreign entity” (as specifically defined under these rules) after December 31, 2012, unless such entity provides the withholding agent with a certification that it does not have any substantial U.S. owners or provides information to the withholding agent identifying the substantial U.S. owners of the entity. Under certain circumstances, a non-U.S. holder might be eligible for refunds or credits of such withholding taxes. Holders are encouraged to consult with their own tax advisors regarding the possible implications of FATCA on their investment in shares of our Class A common stock.
In a recently issued notice, the IRS has indicated that under future Treasury Regulations the FATCA withholding tax of 30% generally will not apply to distributions paid on shares of our Class A common stock until after December 31, 2013, and to gross proceeds from the disposition of shares of our Class A common stock until after December 31, 2014.
193
Table of Contents
Index to Financial Statements
We and the underwriters named below have entered into an underwriting agreement with respect to the shares of Class A common stock being offered. Subject to certain conditions, each underwriter has severally agreed to purchase the number of shares of Class A common stock indicated in the following table. Goldman, Sachs & Co. is the representative of the underwriters.
| Underwriters |
Number of Shares | |
| Goldman, Sachs & Co. |
||
| Merrill Lynch, Pierce, Fenner &
Smith |
||
| Deutsche Bank Securities Inc. |
||
| J.P. Morgan Securities LLC |
||
| Macquarie Capital (USA) Inc. |
||
|
| ||
| Total |
||
|
|
The underwriters are committed to take and pay for all of the shares of Class A common stock being offered, if any are taken, other than the shares covered by the option described below unless and until this option is exercised.
The underwriters have an option to buy up to an additional shares of Class A common stock from us to cover sales by the underwriters of a greater number of shares than the total number set forth in the table above. They may exercise that option for 30 days. If any shares of Class A common stock are purchased pursuant to this option, the underwriters will severally purchase shares in approximately the same proportion as set forth in the table above.
The following table shows the per share and total underwriting discounts and commissions to be paid to the underwriters by us. Such amounts are shown assuming both no exercise and full exercise of the underwriters’ option to purchase additional shares of Class A common stock.
Paid by Us
| No Exercise | Full Exercise | |||||||
| Per Share |
$ | $ | ||||||
| Total |
$ | $ | ||||||
Shares of Class A common stock sold by the underwriters to the public will initially be offered at the initial public offering price set forth on the cover of this prospectus. Any shares sold by the underwriters to securities dealers may be sold at a discount of up to $ per share from the initial public offering price. After the initial offering of the shares, the representative may change the offering price and the other selling terms. The offering of the shares of Class A common stock by the underwriters is subject to receipt and acceptance and subject to the underwriters’ right to reject any order in whole or in part.
We and our executive officers and directors and certain of our principal stockholders have agreed with the underwriters, subject to certain exceptions, including an exception for sales of Class A common stock to satisfy tax withholding and other obligations in connection with the equity awards issued under our LTIP, not to dispose of or hedge any of their Class A common stock or securities convertible into or exchangeable for shares of Class A common stock during the period from the date of this prospectus continuing through the date 180 days after the date of this prospectus, except with the prior written consent of the representative. This agreement does not apply to any existing employee benefit plans. See “Shares Eligible for Future Sale” for a discussion of certain transfer restrictions.
194
Table of Contents
Index to Financial Statements
The 180-day restricted period described in the preceding paragraph will be automatically extended if: (1) during the last 17 days of the 180-day restricted period we issue an earnings release or announce material news or a material event; or (2) prior to the expiration of the 180-day restricted period, we announce that we will release earnings results during the 15-day period following the last day of the 180-day period, in which case the restrictions described in the preceding paragraph will continue to apply until the expiration of the 18-day period beginning on the issuance of the earnings release of the announcement of the material news or material event.
Prior to the offering, there has been no public market for our Class A common stock. The initial public offering price has been negotiated between us and the representative. Among the factors to be considered in determining the initial public offering price of the shares, in addition to prevailing market conditions, will be our historical performance, estimates of our business potential and earnings prospects, an assessment of our management and the consideration of the above factors in relation to market valuation of companies in related businesses.
We intend to apply to list our Class A common stock on the NYSE under the symbol “NTI.” In order to meet one of the requirements for listing the Class A common stock on the NYSE, the underwriters have undertaken to sell lots of 100 or more shares to a minimum of 400 beneficial holders.
In connection with the offering, the underwriters may purchase and sell shares of Class A common stock in the open market. These transactions may include short sales, stabilizing transactions and purchases to cover positions created by short sales. Short sales involve the sale by the underwriters of a greater number of shares than they are required to purchase in the offering, and a short position represents the amount of such sales that have not been covered by subsequent purchases. A “covered short position” is a short position that is not greater than the amount of additional shares for which the underwriters’ option described above may be exercised. The underwriters may cover any covered short position by either exercising their option to purchase additional shares of Class A common stock or purchasing shares in the open market. In determining the source of shares to cover the covered short position, the underwriters will consider, among other things, the price of shares available for purchase in the open market as compared to the price at which they may purchase additional shares pursuant to the option described above. “Naked” short sales are any short sales that create a short position greater than the amount of additional shares for which the option described above may be exercised. The underwriters must cover any such naked short position by purchasing shares in the open market. A naked short position is more likely to be created if the underwriters are concerned that there may be downward pressure on the price of the Class A common stock in the open market after pricing that could adversely affect investors who purchase in the offering. Stabilizing transactions consist of various bids for or purchases of Class A common stock made by the underwriters in the open market prior to the completion of the offering.
The underwriters may also impose a penalty bid. This occurs when a particular underwriter repays to the underwriters a portion of the underwriting discount received by it because the representative has repurchased shares sold by or for the account of such underwriter in stabilizing or short covering transactions.
Purchases to cover a short position and stabilizing transactions, as well as other purchases by the underwriters for their own accounts, may have the effect of preventing or retarding a decline in the market price of our Class A common stock, and together with the imposition of the penalty bid, may stabilize, maintain or otherwise affect the market price of the Class A common stock. As a result, the price of the Class A common stock may be higher than the price that otherwise might exist in the open market. The underwriters are not required to engage in these activities and may end any of these activities at any time. These transactions may be effected on the NYSE, in the over-the-counter market or otherwise.
195
Table of Contents
Index to Financial Statements
European Economic Area
In relation to each Member State of the European Economic Area which has implemented the Prospectus Directive (each, a “Relevant Member State”), each underwriter has represented and agreed that with effect from and including the date on which the Prospectus Directive is implemented in that Relevant Member State (the “Relevant Implementation Date”) it has not made and will not make an offer of shares of Class A common stock to the public in that Relevant Member State prior to the publication of a prospectus in relation to the shares which has been approved by the competent authority in that Relevant Member State or, where appropriate, approved in another Relevant Member State and notified to the competent authority in that Relevant Member State, all in accordance with the Prospectus Directive, except that it may, with effect from and including the Relevant Implementation Date, make an offer of shares to the public in that Relevant Member State at any time:
| (a) | to legal entities which are qualified investors as defined in the Prospectus Directive; |
| (b) | to fewer than 100, or, if the Relevant Member State has implemented the relevant provisions of the 2010 PD Amending Directive, 150, natural or legal persons (other than qualified investors as defined in the Prospectus Directive), as permitted by the Prospectus Directive, subject to obtaining the prior consent of the representatives for any such offer; or |
| (d) | in any other circumstances falling within Article 3(2) of the Prospectus Directive, provided that no such offer shall require the publication by us of a prospectus pursuant to Article 3 of the Prospectus Directive. |
For the purposes of this provision, the expression an “offer of shares to the public” in relation to any shares in any Relevant Member State means the communication in any form and by any means of sufficient information on the terms of the offer and the shares to be offered so as to enable an investor to decide to purchase or subscribe the shares, as the same may be varied in that Relevant Member State by any measure implementing the Prospectus Directive in that Relevant Member State and the expression Prospectus Directive means Directive 2003/71/EC (and amendments thereto, including the 2010 PD Amending Directive, to the extent implemented in the Relevant Member State) and includes any relevant implementing measure in each Relevant Member State, and the expression 2010 PD Amending Directive means Directive 2010/73/EU.
Each underwriter has represented and agreed that:
| (a) | it has only communicated or caused to be communicated and will only communicate or cause to be communicated an invitation or inducement to engage in investment activity (within the meaning of Section 21 of the FSMA) received by it in connection with the issue or sale of the shares in circumstances in which Section 21(1) of the FSMA does not apply to us; and |
| (b) | it has complied and will comply with all applicable provisions of the FSMA with respect to anything done by it in relation to the shares in, from or otherwise involving the United Kingdom. |
This communication is only being distributed to and is only directed at (i) persons who are outside the United Kingdom or (ii) investment professionals falling within Article 19(5) of the Financial Services and Markets Act 2000 (Financial Promotion) Order 2005 (the “Order”) or (iii) high net worth companies, and other persons to whom it may lawfully be communicated, falling within Article 49(2)(a) to (d) of the Order (all such persons together being referred to as “relevant persons”). The shares of Class A common stock are only available to, and any invitation, offer or agreement to subscribe, purchase or otherwise acquire such shares of Class A common stock will be engaged in only with, relevant persons. Any person who is not a relevant person should not act or rely on this document or any of its contents.
196
Table of Contents
Index to Financial Statements
The shares of Class A common stock may not be offered or sold by means of any document other than (i) in circumstances which do not constitute an offer to the public within the meaning of the Companies Ordinance (Cap.32, Laws of Hong Kong), or (ii) to “professional investors” within the meaning of the Securities and Futures Ordinance (Cap.571, Laws of Hong Kong) and any rules made thereunder, or (iii) in other circumstances which do not result in the document being a “prospectus” within the meaning of the Companies Ordinance (Cap.32, Laws of Hong Kong), and no advertisement, invitation or document relating to the shares may be issued or may be in the possession of any person for the purpose of issue (in each case whether in Hong Kong or elsewhere), which is directed at, or the contents of which are likely to be accessed or read by, the public in Hong Kong (except if permitted to do so under the laws of Hong Kong) other than with respect to shares which are or are intended to be disposed of only to persons outside Hong Kong or only to “professional investors” within the meaning of the Securities and Futures Ordinance (Cap. 571, Laws of Hong Kong) and any rules made thereunder.
This prospectus has not been registered as a prospectus with the Monetary Authority of Singapore. Accordingly, this prospectus and any other document or material in connection with the offer or sale, or invitation for subscription or purchase, of the shares of Class A common stock may not be circulated or distributed, nor may the shares be offered or sold, or be made the subject of an invitation for subscription or purchase, whether directly or indirectly, to persons in Singapore other than (i) to an institutional investor under Section 274 of the Securities and Futures Act, Chapter 289 of Singapore (the “SFA”), (ii) to a relevant person, or any person pursuant to Section 275(1A), and in accordance with the conditions, specified in Section 275 of the SFA or (iii) otherwise pursuant to, and in accordance with the conditions of, any other applicable provision of the SFA.
Where the shares of Class A common stock are subscribed or purchased under Section 275 by a relevant person which is: (a) a corporation (which is not an accredited investor) the sole business of which is to hold investments and the entire share capital of which is owned by one or more individuals, each of whom is an accredited investor; or (b) a trust (where the trustee is not an accredited investor) whose sole purpose is to hold investments and each beneficiary is an accredited investor, shares, debentures and units of shares and debentures of that corporation or the beneficiaries’ rights and interest in that trust shall not be transferable for 6 months after that corporation or that trust has acquired the shares under Section 275 except: (1) to an institutional investor under Section 274 of the SFA or to a relevant person, or any person pursuant to Section 275(1A), and in accordance with the conditions, specified in Section 275 of the SFA; (2) where no consideration is given for the transfer; or (3) by operation of law.
The shares of Class A common stock have not been and will not be registered under the Financial Instruments and Exchange Law of Japan (the Financial Instruments and Exchange Law) and each underwriter has agreed that it will not offer or sell any shares, directly or indirectly, in Japan or to, or for the benefit of, any resident of Japan (which term as used herein means any person resident in Japan, including any corporation or other entity organized under the laws of Japan), or to others for re-offering or resale, directly or indirectly, in Japan or to a resident of Japan, except pursuant to an exemption from the registration requirements of, and otherwise in compliance with, the Financial Instruments and Exchange Law and any other applicable laws, regulations and ministerial guidelines of Japan.
Notice to Prospective Investors in Switzerland
The shares may not be publicly offered in Switzerland and will not be listed on the SIX Swiss Exchange (“SIX”) or on any other stock exchange or regulated trading facility in Switzerland. This document has been prepared without regard to the disclosure standards for issuance prospectuses
197
Table of Contents
Index to Financial Statements
under art. 652a or art. 1156 of the Swiss Code of Obligations or the disclosure standards for listing prospectuses under art. 27 ff. of the SIX Listing Rules or the listing rules of any other stock exchange or regulated trading facility in Switzerland. Neither this document nor any other offering or marketing material relating to the shares or the offering may be publicly distributed or otherwise made publicly available in Switzerland.
Neither this document nor any other offering or marketing material relating to the offering, the Company, the shares have been or will be filed with or approved by any Swiss regulatory authority. In particular, this document will not be filed with, and the offer of shares will not be supervised by, the Swiss Financial Market Supervisory Authority FINMA (FINMA), and the offer of shares has not been and will not be authorized under the Swiss Federal Act on Collective Investment Schemes (“CISA”). The investor protection afforded to acquirers of interests in collective investment schemes under the CISA does not extend to acquirers of shares.
Notice to Prospective Investors in the Dubai International Financial Centre
This prospectus supplement relates to an Exempt Offer in accordance with the Offered Securities Rules of the Dubai Financial Services Authority (“DFSA”). This prospectus supplement is intended for distribution only to persons of a type specified in the Offered Securities Rules of the DFSA. It must not be delivered to, or relied on by, any other person. The DFSA has no responsibility for reviewing or verifying any documents in connection with Exempt Offers. The DFSA has not approved this prospectus supplement nor taken steps to verify the information set forth herein and has no responsibility for the prospectus supplement. The shares to which this prospectus supplement relates may be illiquid and/or subject to restrictions on their resale. Prospective purchasers of the shares offered should conduct their own due diligence on the shares. If you do not understand the contents of this prospectus supplement you should consult an authorized financial advisor.
The underwriters do not expect sales to discretionary accounts to exceed 5% of the total number of shares offered.
We estimate that our share of the total expenses of the offering, excluding underwriting discounts and commissions, will be approximately $ .
We have agreed to indemnify the several underwriters against certain liabilities, including liabilities under the Securities Act.
The underwriters and their respective affiliates are full service financial institutions engaged in various activities, which may include securities trading, commercial and investment banking, financial advisory, investment management, investment research, principal investment, hedging, financing and brokerage activities. Certain of the underwriters and their respective affiliates have, from time to time, performed, and may in the future perform, various financial advisory and investment banking services for us, for which they received or will receive customary fees and expenses.
In the ordinary course of their various business activities, the underwriters and their respective affiliates may make or hold a broad array of investments, including serving as counterparties to certain derivative and hedging arrangements, and actively trade debt and equity securities (or related derivative securities) and financial instruments (including bank loans) for their own account and for the accounts of their customers, and such investment and securities activities may involve our securities and/or instruments. The underwriters and their respective affiliates may also make investment recommendations and/or publish or express independent research views in respect of such securities or instruments and may at any time hold, or recommend to clients that they acquire, long and/or short positions in such securities and instruments.
198
Table of Contents
Index to Financial Statements
The validity of our Class A common stock offered by this prospectus will be passed upon for us by Vinson & Elkins L.L.P., Houston, Texas. The underwriters are being represented by Cleary Gottlieb Steen & Hamilton LLP, New York, New York.
The consolidated financial statements as of December 31, 2010 and for the period from August 10, 2010 (inception date) to December 31, 2010 of Northern Tier Investors, LLC, Successor, included in this prospectus have been so included in reliance on the report of PricewaterhouseCoopers LLP, an independent registered public accounting firm, given on the authority of said firm as experts in auditing and accounting.
The combined financial statements as of December 31, 2009 and for the eleven months ended November 30, 2010 and for each of the two years in the period ended December 31, 2009 of the St. Paul Park Refinery & Retail Marketing Business, a component of Marathon Oil Corporation, Predecessor, included in this prospectus have been so included in reliance on the report of PricewaterhouseCoopers LLP, an independent registered public accounting firm, given on the authority of said firm as experts in auditing and accounting.
WHERE YOU CAN FIND MORE INFORMATION
We have filed with the SEC a registration statement on Form S-1 (including the exhibits, schedules and amendments thereto) under the Securities Act, with respect to the shares of our Class A common stock offered hereby. This prospectus does not contain all of the information set forth in the registration statement and the exhibits and schedules thereto. For further information with respect to us and the Class A common stock offered hereby, we refer you to the registration statement and the exhibits and schedules filed therewith. Statements contained in this prospectus as to the contents of any contract, agreement or any other document are summaries of the material terms of this contract, agreement or other document and are not necessarily complete. With respect to each of these contracts, agreements or other documents filed as an exhibit to the registration statement, reference is made to the exhibits for a more complete description of the matter involved. A copy of the registration statement, and the exhibits and schedules thereto, may be inspected without charge at the public reference facilities maintained by the SEC at 100 F Street NE, Washington, D.C. 20549. Copies of these materials may be obtained, upon payment of a duplicating fee, from the Public Reference Section of the SEC at 100 F Street NE, Washington, D.C. 20549. Please call the SEC at 1-800-SEC-0330 for further information on the operation of the public reference facility. The SEC maintains a website that contains reports, proxy and information statements and other information regarding registrants that file electronically with the SEC. The address of the SEC’s website is www.sec.gov.
As a result of the offering, we will become subject to the full informational requirements of the Exchange Act. We will fulfill our obligations with respect to such requirements by filing periodic reports, proxy statements and other information with the SEC. We intend to furnish our shareholders with annual reports containing financial statements certified by an independent public accounting firm. These periodic reports and other information will be available for inspection and copying at the SEC’s public reference room and the website of the SEC referred to above, as well as on our website, www.ntenergy.com. This reference to our website is an inactive textual reference only and is not a hyperlink. The contents of our website are not part of this prospectus, and you should not consider the contents of our website in making an investment decision with respect to our common stock.
199
Table of Contents
Index to Financial Statements
| Page | ||
| Northern Tier Investors, LLC (Successor) and St. Paul Park Refinery and Retail Marketing Business (Predecessor) |
||
| Consolidated Financial Statements for the Nine Months Ended September 30, 2011 and Combined Financial Statements for the Nine Months Ended September 30, 2010: |
||
| F-2 | ||
| Consolidated and Combined Statements of Operations (Unaudited) |
F-3 | |
| Consolidated and Combined Statements of Cash Flows (Unaudited) |
F-4 | |
| Notes to Consolidated and Combined Financial Statements (Unaudited) |
F-5 | |
| Consolidated Financial Statements from August 10, 2010 (inception date) to December 31, 2010 and Combined Financial Statements for the Eleven Months Ended November 30, 2010 and Years Ended December 31, 2009 and 2008: |
||
| Report of Independent Registered Public Accounting Firm (Successor statements) |
F-24 | |
| Report of Independent Registered Public Accounting Firm (Predecessor statements) |
F-25 | |
| F-26 | ||
| F-27 | ||
| F-28 | ||
| F-29 | ||
| F-30 | ||
F-1
Table of Contents
Index to Financial Statements
NORTHERN TIER INVESTORS, LLC
(FORMERLY KNOWN AS ST. PAUL PARK REFINERY & RETAIL MARKETING BUSINESS)
(in millions)
| September 30, 2011 |
December 31, 2010 |
|||||||
| (Unaudited) | ||||||||
| ASSETS |
||||||||
| CURRENT ASSETS |
||||||||
| Cash and cash equivalents |
$ | 126.9 | $ | 74.3 | ||||
| Receivables, less allowance for doubtful accounts |
103.3 | 100.2 | ||||||
| Inventories |
152.8 | 156.4 | ||||||
| Other current assets |
42.5 | 28.7 | ||||||
|
|
|
|
|
|||||
| Total current assets |
425.5 | 359.6 | ||||||
| NON-CURRENT ASSETS |
||||||||
| Equity method investment |
90.5 | 92.4 | ||||||
| Property, plant and equipment, net |
391.8 | 386.3 | ||||||
| Intangible assets, net |
35.4 | 35.4 | ||||||
| Other assets |
49.3 | 58.4 | ||||||
|
|
|
|
|
|||||
| Total Assets |
$ | 992.5 | $ | 932.1 | ||||
|
|
|
|
|
|||||
| LIABILITIES, PREFERRED INTEREST AND EQUITY |
||||||||
| CURRENT LIABILITIES |
||||||||
| Accounts payable |
$ | 181.5 | $ | 183.7 | ||||
| Accrued liabilities |
29.0 | 22.5 | ||||||
| Derivative liability |
346.2 | 45.6 | ||||||
|
|
|
|
|
|||||
| Total current liabilities |
556.7 | 251.8 | ||||||
| NON-CURRENT LIABILITIES |
||||||||
| Long-term debt |
290.0 | 290.0 | ||||||
| Lease financing obligation |
24.5 | 24.5 | ||||||
| Derivative liability |
56.5 | 22.4 | ||||||
| Other liabilities |
45.4 | 59.2 | ||||||
|
|
|
|
|
|||||
| Total liabilities |
973.1 | 647.9 | ||||||
|
|
|
|
|
|||||
| Commitments and contingencies |
||||||||
| Noncontrolling preferred interest in subsidiary |
86.1 | 80.6 | ||||||
| EQUITY |
||||||||
| Member's interest (deficit) |
(66.7 | ) | 203.6 | |||||
|
|
|
|
|
|||||
| Total Liabilities, Preferred Interest and Equity |
$ | 992.5 | $ | 932.1 | ||||
|
|
|
|
|
|||||
The accompanying notes are an integral part of these consolidated and combined financial statements.
F-2
Table of Contents
Index to Financial Statements
(FORMERLY KNOWN AS ST. PAUL PARK REFINERY & RETAIL MARKETING BUSINESS)
CONSOLIDATED AND COMBINED STATEMENTS OF OPERATIONS
(Unaudited)
(in millions)
| Successor | Predecessor | |||||||||
| Nine Months Ended September 30, 2011 |
Nine Months Ended September 30, 2010 |
|||||||||
| Revenue(a) |
$ | 3,192.0 | $ | 2,582.3 | ||||||
| Costs, expenses and other: |
||||||||||
| Cost of sales(a) |
2,573.8 | 2,193.8 | ||||||||
| Direct operating expenses |
194.8 | 183.4 | ||||||||
| Turnaround and related expenses |
22.5 | 8.2 | ||||||||
| Depreciation and amortization |
22.3 | 30.0 | ||||||||
| Selling, general and administrative |
65.4 | 47.0 | ||||||||
| Formation costs |
6.1 | — | ||||||||
| Contingent consideration income |
(37.6 | ) | — | |||||||
| Other income, net |
(2.4 | ) | (4.3 | ) | ||||||
|
|
|
|
|
|||||||
| Operating income |
347.1 | 124.2 | ||||||||
| Realized losses from derivative activities |
(246.4 | ) | — | |||||||
| Unrealized losses from derivative activities |
(334.5 | ) | — | |||||||
| Interest expense, net |
(30.6 | ) | (0.2 | ) | ||||||
|
|
|
|
|
|||||||
| Earnings/(loss) before income taxes |
(264.4 | ) | 124.0 | |||||||
| Income tax provision |
— | (49.2 | ) | |||||||
|
|
|
|
|
|||||||
| Net (loss) earnings |
(264.4 | ) | 74.8 | |||||||
| Less: net earnings attributable to noncontrolling preferred interest |
5.5 | — | ||||||||
|
|
|
|
|
|||||||
| Net (loss) earnings available to members |
$ | (269.9 | ) | $ | 74.8 | |||||
|
|
|
|
|
|||||||
|
(a) Excise taxes included in revenue and cost of sales. |
$ | 181.5 | $ | 226.3 | ||||||
The accompanying notes are an integral part of these consolidated and combined financial statements.
F-3
Table of Contents
Index to Financial Statements
(FORMERLY KNOWN AS ST. PAUL PARK REFINERY & RETAIL MARKETING BUSINESS)
CONSOLIDATED AND COMBINED STATEMENTS OF CASH FLOWS
(Unaudited)
(in millions)
| Successor | Predecessor | |||||||||
| Increase (decrease) in cash |
Nine Months Ended September 30, 2011 |
Nine Months Ended September 30, 2010 |
||||||||
| CASH FLOWS FROM OPERATING ACTIVITIES |
||||||||||
| Net (loss) earnings |
$ | (264.4 | ) | $ | 74.8 | |||||
| Adjustments to reconcile net (loss) earnings to net cash provided by operating activities: |
||||||||||
| Depreciation and amortization |
22.3 | 30.0 | ||||||||
| Stock-based compensation expense |
1.1 | 0.2 | ||||||||
| Equity method investment, net |
1.9 | 1.7 | ||||||||
| Contingent consideration income |
(37.6 | ) | — | |||||||
| Unrealized loss from derivative activities |
334.5 | — | ||||||||
| Deferred taxes |
— | (1.2 | ) | |||||||
| Changes in assets and liabilities, net: |
||||||||||
| Accounts receivable |
(3.1 | ) | (19.7 | ) | ||||||
| Inventories |
3.6 | 26.7 | ||||||||
| Other current assets |
15.9 | — | ||||||||
| Accounts payable and accrued expenses |
116.9 | (17.0 | ) | |||||||
| Receivables from and payables to related parties |
— | (19.0 | ) | |||||||
| Other, net |
3.2 | (3.0 | ) | |||||||
|
|
|
|
|
|||||||
| Net cash provided by operating activities |
194.3 | 73.5 | ||||||||
|
|
|
|
|
|||||||
| CASH FLOWS FROM INVESTING ACTIVITIES |
||||||||||
| Capital expenditures |
(27.4 | ) | (21.6 | ) | ||||||
| Disposals of assets |
— | 0.4 | ||||||||
| Return of capital from cost method investment |
— | 0.1 | ||||||||
| Acquisition, net of cash acquired |
(112.8 | ) | — | |||||||
|
|
|
|
|
|||||||
| Net cash used in investing activities |
(140.2 | ) | (21.1 | ) | ||||||
|
|
|
|
|
|||||||
| CASH FLOWS FROM FINANCING ACTIVITIES |
||||||||||
| Borrowings from revolving credit arrangement |
55.0 | — | ||||||||
| Repayments of revolving credit arrangement |
(55.0 | ) | — | |||||||
| Other financing activities, net |
(1.5 | ) | ||||||||
| Distributions to Marathon, net |
— | (52.3 | ) | |||||||
|
|
|
|
|
|||||||
| Net cash used in financing activities |
(1.5 | ) | (52.3 | ) | ||||||
|
|
|
|
|
|||||||
| CASH AND CASH EQUIVALENTS |
||||||||||
| Change in cash and cash equivalents |
52.6 | 0.1 | ||||||||
| Cash and cash equivalents at beginning of period |
74.3 | 6.0 | ||||||||
|
|
|
|
|
|||||||
| Cash and cash equivalents at end of period |
$ | 126.9 | $ | 6.1 | ||||||
|
|
|
|
|
|||||||
The accompanying notes are an integral part of these consolidated and combined financial statements.
F-4
Table of Contents
Index to Financial Statements
NOTES TO CONSOLIDATED AND COMBINED FINANCIAL STATEMENTS
1. DESCRIPTION OF THE BUSINESS AND BASIS OF PRESENTATION
Description of the Business
Northern Tier Investors, LLC (the “Company” or the “Successor”) is an independent downstream energy company with refining, retail and pipeline operations that serve the Petroleum Administration for Defense District II (“PADD II”) region of the United States. The Company is a Delaware limited liability company and wholly owns the common equity of Northern Tier Holdings LLC (“NT Holdings”). Additionally, NT Holdings has issued preferred stock that is solely owned by an indirect subsidiary of Marathon Petroleum Corporation (“Marathon Petroleum”). Marathon Petroleum was a wholly owned subsidiary of Marathon Oil Corporation (“Marathon Oil”) until June 30, 2011. NT Holdings wholly owns 100% of the common shares of Northern Tier Energy LLC (“NTE”). NTE, NT Holdings and the Company were formed by affiliates of ACON Investments, L.L.C. and TPG Capital L.P. and certain members of management (collectively, the “Investors”) during 2010.
Predecessor interests represent the St. Paul Park Refinery & Retail Marketing Business formerly owned and operated by subsidiaries of Marathon Oil. These subsidiaries, Marathon Petroleum Company LP (“MPC LP”), Speedway LLC (“Speedway”) and MPL Investments LLC are together referred to as “MPC” or “Marathon” and are subsidiaries of Marathon Petroleum as of June 30, 2011. Predecessor interests are hereinafter referred to as the “Predecessor.” Effective December 1, 2010, the Company acquired the Predecessor business from Marathon for approximately $608 million (the “Acquisition”).
The Company includes the operations of the St. Paul Park Refining Co. LLC (“SPPR”) and Northern Tier Retail LLC (“NTR”). The Company also includes Northern Tier Bakery LLC (“NTB”), SuperAmerica Franchising LLC (“SAF”), a 17% interest in MPL Investments Inc. (“MPLI”) and a 17% interest in Minnesota Pipe Line Company, LLC (“MN PL LLC”). MPLI owns 100% of the preferred interest in MN PL LLC which owns and operates the Minnesota Pipeline, a 455,000 barrels per day crude oil pipeline.
SPPR, which is located in St. Paul Park, Minnesota, has total crude oil throughput capacity of 74,000 barrels per day. Refinery operations include crude fractionation, catalytic cracking, hydrotreating, reforming, alkylation, sulfur recovery and a hydrogen plant. The refinery processes predominately North Dakota and Canadian crude oils into products such as gasoline, diesel, jet fuel, kerosene, asphalt, propane, propylene and sulfur. The refined products are sold to markets primarily located in the Upper Great Plains of the United States.
NTR operates 166 convenience stores under the SuperAmerica brand. SAF supports 67 franchised stores which also utilize the SuperAmerica brand. The SuperAmerica stores are primarily located in Minnesota and Wisconsin and sell gasoline, merchandise, and in some locations, diesel fuel. There is a wide range of merchandise sold at the stores, including prepared foods, beverages and non-food items, as well as a significant number of proprietary items.
NTB prepares and distributes food products under the SuperMom’s Bakery brand primarily to SuperAmerica branded retail outlets.
Basis of Presentation
The accompanying unaudited condensed consolidated and combined financial statements have been prepared in accordance with United States generally accepted accounting principles (“GAAP”) for interim financial information. Accordingly, they do not include all of the information and footnotes required by GAAP for complete financial statements. In the opinion of management, all adjustments (consisting of normal recurring accruals) considered necessary for a fair presentation of the results for
F-5
Table of Contents
Index to Financial Statements
the periods reported have been included. Operating results for the nine months ended September 30, 2011 are not necessarily indicative of the results that may be expected for the year ending December 31, 2011, or for any other period.
The condensed consolidated balance sheet at December 31, 2010 has been derived from the audited financial statements of the Company at that date but does not include all of the information and footnotes required by GAAP for complete financial statements. The accompanying condensed consolidated and combined financial statements should be read in conjunction with the consolidated and combined financial statements and notes thereto included in the Company’s 2010 financial statements.
The accompanying interim consolidated and combined financial statements present separately the financial position, results of operations, and cash flows for both the Company and the Predecessor. In connection with the Acquisition, further described in Note 4, a new accounting basis was established for the Company as of the acquisition date based upon the fair value of the assets acquired and liabilities assumed, in accordance with the guidance for business combinations. Financial information for the pre- and post-acquisition periods have been separated by a line on the face of the consolidated and combined financial statements to highlight the fact that the financial information for such periods has been prepared under two different historical-cost bases of accounting. For the period prior to the closing of the Acquisition, the accompanying combined financial statements reflect all revenues, expenses and cash flows directly attributable to the Predecessor.
Subsequent Events
Events and transactions subsequent to the balance sheet date have been evaluated through December 12, 2011, the date these consolidated and combined financial statements were available to be issued, for potential recognition or disclosure in the financial statements.
2. SUMMARY OF PRINCIPAL ACCOUNTING POLICIES
Principles of Consolidation and Combination
Prior to the closing of the Acquisition, the Predecessor was legally held by multiple subsidiaries and affiliates of Marathon Oil. As such, the accompanying Predecessor financial statements present the combined accounts of such businesses for the period prior to the Acquisition. After the closing of the Acquisition, the Company acquired the stock or net assets of those Predecessor businesses.
All significant intercompany accounts have been eliminated in these consolidated and combined financial statements.
The Company’s and the Predecessor’s 17% common interest in MN PL LLC is accounted for using the equity method of accounting in accordance with Financial Accounting Standards Board’s (“FASB”) Accounting Standards Codification (“ASC”) Topic 323. Income from equity method investment represents the Company’s and the Predecessor’s proportionate share of net income available to common owners generated by MN PL LLC.
The equity method investment is assessed for impairment whenever changes in facts or circumstances indicate a loss in value has occurred. When the loss is deemed to be other than temporary, the carrying value of the equity method investment is written down to fair value, and the amount of the write-down is included in net income. See Note 7 for further information on the Company’s equity investment.
F-6
Table of Contents
Index to Financial Statements
The investment in MPLI over which the Company (and previously, the Predecessor) does not have significant influence is accounted for as a cost method investment. The investment in MPLI is carried at a cost of $7.0 million as of both September 30, 2011 and December 31, 2010 and is included in other noncurrent assets on the consolidated balance sheets. MPLI owns all of the preferred membership units of MN PL LLC.
Use of Estimates
The preparation of financial statements in accordance with generally accepted accounting principles requires management to make estimates and assumptions that affect the reported amounts of assets and liabilities and the disclosure of contingent assets and liabilities as of the date of the consolidated and combined financial statements and the reported amounts of revenues and expenses during the respective reporting periods. Actual results could differ from those estimates. In addition, significant estimates were used in accounting for the Acquisition under the purchase method of accounting.
The Predecessor financial statements include allocations of general, administrative and overhead costs of Marathon that are attributable to the Predecessor’s operations. Management believes the assumptions and allocations underlying the combined financial statements are reasonable. However, these combined financial statements do not include all of the actual expenses that would have been incurred had the Predecessor been a stand-alone entity during the periods presented and do not reflect the Predecessor’s combined results of operations, financial position and cash flows had it been a stand-alone company during the periods presented.
Operating Segments
The Company has two reportable operating segments:
| Ÿ | Refining—operates the St. Paul Park, Minnesota, refinery, terminal and related assets, including the Company’s interest in MPLI and MN PL LLC, and |
| Ÿ | Retail—operates 166 convenience stores primarily in Minnesota and Wisconsin. The Retail segment also includes the operations of NTB and SAF. |
See Note 19 for further information on the Company’s operating segments.
Cash and Cash Equivalents
The Company considers all highly liquid investments with maturities of three months or less from the date of purchase to be cash equivalents.
Property, Plant and Equipment
Property, plant and equipment is recorded at cost and depreciated on a straight-line basis over the estimated useful lives of the assets. Such assets are reviewed for impairment whenever events or changes in circumstances indicate that the carrying amount of an asset may not be recoverable. If the sum of the expected undiscounted future cash flows from the use of the asset and its eventual disposition is less than the carrying amount of the asset, an impairment loss is recognized based on the fair value of the asset.
When property, plant and equipment depreciated on an individual basis are sold or otherwise disposed of, any gains or losses are reported in net income. Gains on the disposal of property, plant
F-7
Table of Contents
Index to Financial Statements
and equipment are recognized when earned, which is generally at the time of closing. If a loss on disposal is expected, such losses are generally recognized when the assets are classified as held for sale.
Expenditures for routine maintenance and repair costs are expensed when incurred. Refinery process units require periodic major maintenance and repairs that are commonly referred to as “turnarounds.” The required frequency of the maintenance varies by unit, but generally is every two to six years depending on the processing unit involved. Turnaround costs are expensed as incurred.
Excise Taxes
The Company (and previously, the Predecessor) is required by various governmental authorities, including federal and state, to collect and remit taxes on certain products. Such taxes are presented on a gross basis in revenues and costs and expenses in the consolidated and combined statements of operations. These taxes totaled $181.5 million and $226.3 million for the nine months ended September 30, 2011 and 2010, respectively.
Income Taxes
After the Acquisition, the Company and its subsidiaries are pass-through entities for U.S. federal income tax purposes. As a result, the Company does not incur U.S. federal income taxes. The Predecessor’s taxable income has historically been included in the consolidated U.S. federal income tax returns of Marathon Oil and also in a number of state income tax returns, which are filed as consolidated returns.
For the Predecessor, the provision for income taxes was computed as if the Predecessor was a stand-alone tax-paying entity and as if it paid the amount of its current U.S. federal and state tax liabilities to Marathon in each period. As such, the accrual and payment of the current U.S. federal and state tax liabilities was recorded within the net investment in the combined financial statements in the period incurred.
Deferred tax assets and liabilities were recognized based on temporary differences between the financial statement carrying amounts of the Predecessor’s assets and liabilities and their tax bases as reported in Marathon Oil tax filings with the respective taxing authorities. The realization of deferred tax assets was assessed periodically based on several interrelated factors. These factors include the Predecessor’s expectation to generate sufficient future taxable income in order to utilize tax credits and operating loss carry-forwards.
Derivative Financial Instruments
The Company (and previously, the Predecessor) is exposed to earnings and cash flow volatility based on the timing and change in refined product prices versus crude oil prices. To manage these risks, the Company uses derivative instruments associated with the purchase or sale of crude oil and refined products. Crack spread option contracts are used to hedge the volatility of refining margins. The Company also may use futures contracts to manage price risks associated with inventory quantities above or below target levels. The Company does not enter into derivative contracts for speculative purposes. All derivative instruments are recorded in the consolidated balance sheet at fair value and are classified depending on the maturity date of the underlying contracts. Changes in the fair value of its contracts are accounted for by marking them to market and recognizing any resulting gains or losses in its statements of operations. These gains or losses are reported within operating activities on the consolidated statement of cash flows.
F-8
Table of Contents
Index to Financial Statements
Reclassifications
Certain reclassifications have been made to the Predecessor’s financial information in order to conform to the Company’s current presentation.
Accounting Developments
Variable interest accounting standards were amended by the FASB in June 2009. The new accounting standards replace the existing quantitative-based risks and rewards calculation for determining which enterprise has a controlling financial interest in a variable interest entity with an approach focused on identifying which enterprise has the power to direct the activities of a variable interest entity. In addition, the concept of qualifying special-purpose entities has been eliminated and therefore, will now be evaluated for consolidation in accordance with the applicable consolidation guidance. Ongoing assessments of whether an enterprise is the primary beneficiary of a variable interest entity are also required. The amended variable interest accounting standard requires reconsideration for determining whether an entity is a variable interest entity when changes in facts and circumstances occur such that the holders of the equity investment at risk, as a group, lack the power from voting rights or similar rights to direct the activities of the entity. Enhanced disclosures are required for any enterprise that holds a variable interest in a variable interest entity. Application is prospective beginning in the first quarter of 2010, and for all interim and annual periods thereafter. The adoption of this standard did not have a significant impact on the consolidated and combined results of operations, financial position or cash flows.
A standard to improve disclosures about fair value measurements was issued by the FASB in January 2010. The additional disclosures required include: (1) the different classes of assets and liabilities measured at fair value, (2) the significant inputs and techniques used to measure Level 2 and Level 3 assets and liabilities for both recurring and nonrecurring fair value measurements, (3) the gross presentation of purchases, sales, issuances and settlements for Level 3 roll forward of activity, and (4) the transfers in and out of Levels 1 and 2. The new disclosures are effective for interim and annual reporting periods beginning after December 15, 2009, except for the gross presentation of purchases, sales, issuances, and settlements for Level 3 roll forward of activity. Those disclosures are effective for fiscal years beginning after December 15, 2010, and for interim periods thereafter. The adoption of this guidance did not have a material impact on the Company’s results of operations, financial condition because it provides enhanced disclosure requirements only.
The FASB amended the reporting standards for comprehensive income in June 2011 to eliminate the option to present the components of other comprehensive income as part of the statement of changes in stockholders’ equity. All non-owner changes in stockholders’ equity are required to be presented either in a single continuous statement of comprehensive income or in two separate but consecutive statements. In the two statement approach, the first statement should present total net income and its components followed consecutively by a second statement that should present total other comprehensive income, the components of other comprehensive income, and the total of comprehensive income. The amendments did not change the items that must be reported in other comprehensive income or when an item of other comprehensive income must be reclassified to net income. The amendment is effective for fiscal years, and interim periods within those years, beginning after December 15, 2011, and will be applied retrospectively. Early application is permitted. This standard will not have an impact on our consolidated results of operations, financial position or cash flows.
3. RELATED PARTY TRANSACTIONS
The Investors, which include affiliates of ACON Investments, L.L.C. and TPG Capital L.P., are related parties of the Company. MN PL LLC is also a related party of the Company. Subsequent to the Acquisition, the Company has had no direct purchases from MN PL LLC.
F-9
Table of Contents
Index to Financial Statements
Related parties for the Predecessor include the following:
| Ÿ | Marathon Oil Company (“MOC”), which is a wholly owned subsidiary of Marathon Oil. MOC purchases or produces crude oil in the United States that is used at MPC’s refineries. |
| Ÿ | MPC LP, which changed its name from Marathon Petroleum Company LLC on October 1, 2010, was a wholly owned subsidiary of Marathon Oil. MPC LP refines, markets and transports crude oil and petroleum products, primarily in the Midwest, Upper Great Plains, Gulf Coast and southwestern regions of the United States. |
| Ÿ | Marathon Petroleum Trading Canada LLC (“MP Trading Canada”), which was a wholly owned subsidiary of MPC LP. MP Trading Canada purchases crude oil in Canada to be used at MPC LP’s refineries. |
| Ÿ | MN PL LLC, in which Marathon owned (and now the Company owns) a 17% interest. MN PL LLC owns and operates a crude oil pipeline running from Clearbrook, Minnesota to Pine Bend, Minnesota. |
| Ÿ | Speedway, which was a wholly owned subsidiary of Marathon Oil. Under the Predecessor, Speedway was the owner of the SuperAmerica branded convenience stores that were sold to NTR as part of the Acquisition. |
Predecessor revenues from related parties for the nine months ended September 30, 2010 were $170.4 million and represented sales to MPC LP. Related party sales to MPC LP consisted primarily of sales of refined products. Refined product sales to MPC were recorded at intercompany transfer prices that were market-based prices.
Predecessor purchases from related parties were as follows:
| (in millions) |
Nine Months Ended September 30, 2010 |
|||
| MOC |
$ | 228.2 | ||
| MPC LP |
47.1 | |||
| MP Trading Canada |
788.1 | |||
| MN PL LLC |
20.2 | |||
| Speedway |
12.7 | |||
|
|
|
|||
| Total |
$ | 1,096.3 | ||
|
|
|
|||
Related party purchases from MOC and MP Trading Canada consisted primarily of crude oil. Purchases from MOC were recorded at contracted prices that were market-based. Purchases from MP Trading Canada were recorded at contracted prices based on MP Trading Canada’s acquisition cost, plus an administrative fee. Related party purchases from MPC LP consisted primarily of purchases of refined products and refinery feedstocks, certain general and administrative costs, and costs associated with the Refining segment participating in MPC LP’s multi-employer benefit plans. Refined product and refinery feedstock purchases from MPC LP were recorded at intercompany transfer prices that were market-based prices. Related party purchases from MN PL LLC consisted primarily of crude oil transportation services which were based on published tariffs. Related party purchases from Speedway consisted of certain overhead costs and costs associated with the Retail segment participating in Speedway’s multi-employer benefit plans.
MPC LP and Speedway provided certain services to the Predecessor such as marketing, crude acquisition, engineering, human resources, insurance, treasury, accounting, tax, legal, procurement
F-10
Table of Contents
Index to Financial Statements
and information technology services. Charges for these services were allocated based on usage or other methods, such as headcount, capital employed or store count, which management believes to be reasonable.
For the purposes of the combined financial statements, the Predecessor was considered to participate in multi-employer benefit plans of MPC LP and Speedway. Expenses for employee benefit plans other than stock-based compensation plans are allocated to the Predecessor primarily as a percentage of salary and wage expense. The Predecessor’s allocated share of MPC LP and Speedway’s employee benefit plan expenses, including costs related to stock-based compensation plans, is included in related party purchases and was $17.2 million for the nine months ended September 30, 2010.
Upon completion of the Acquisition, the Company entered into a management services agreement with the Investors pursuant to which they provide the Company with ongoing management, advisory and consulting services. The Investors also receive quarterly management fees equal to 1% of the Company’s “Adjusted EBITDA” (as defined in the agreement) for the previous quarter (subject to a minimum annual fee of $2 million), as well as reimbursements for out-of pocket expenses incurred by them in connection with providing such management services. The Company also pays the Investors’ specified success fees in connection with advice they provide in relation with certain corporate transactions. For the nine months ended September 30, 2011, the Company incurred fees relating to these services of $1.5 million.
4. ACQUISITION
As previously described in Note 1, effective December 1, 2010, the Company acquired the Predecessor business from MPC for $608 million. Included in this amount is the estimated fair value of earn-out payments of $54 million. Of the $608 million purchase price, $361 million was paid in cash as of December 31, 2010 and $80 million was satisfied by issuing MPC a perpetual payment in kind preferred interest in NT Holdings. The residual purchase price of $113 million (excluding the contingent earn-out consideration) was paid during the three months ended March 31, 2011.
The Company will be required to make earn-out payments to MPC if the Company’s Adjusted EBITDA (as defined in the agreement, the “Agreement Adjusted EBITDA”) exceeds $165 million less, among other things, any rental expense related to the real estate lease arrangement (described below) during any year in each of the next eight years following the Acquisition. Agreement Adjusted EBITDA adjusts for, among other items, (i) any unrealized gains or losses relating to derivative activities, (ii) any gains or losses generated by the liquidation of any LIFO inventory layers, (iii) any losses related to lower of cost or market inventory adjustments, and (iv) any gains on the sale of property, plant or equipment and certain other assets. MPC will receive 40% of the amount by which Agreement Adjusted EBITDA exceeds the specified threshold in any year during the eight years following the Acquisition, not to exceed $125 million over the eight years following the Acquisition. The Acquisition agreement also includes a margin support component that requires MPC to pay the Company up to $30 million per year to the extent Agreement Adjusted EBITDA is below $145 million in either of the first two twelve month periods ending November 30, 2011 or 2012 up to a maximum of $60 million. Any such payments made by Marathon will increase the amount that we may be required to pay Marathon over the earn-out period.
The cash component of the purchase price along with acquisition related costs were financed by an approximate $200 million cash investment by the Investors and aggregate borrowings of $290 million. See Note 11 for a description of the Company’s financing arrangements.
Concurrent with the Acquisition, the following transactions also occurred:
| Ÿ | Certain Marathon assets (including real property interests and land related to 135 of the SuperAmerica convenience stores and the SuperMom’s bakery) were sold to a third party |
F-11
Table of Contents
Index to Financial Statements
| equity real estate investment trust. In connection with the closing of the Acquisition, the Company is leasing these properties from the real estate investment trust on a long-term basis. |
| Ÿ | A third-party purchased substantially all of the crude oil inventory associated with operations of the refinery directly from Marathon. |
The Acquisition was accounted for by the purchase method of accounting for business combinations. The excess of the estimated fair value of the net assets acquired over total purchase consideration was recorded as an estimated bargain purchase gain during 2010. This gain was a result of the market dynamics from the time the purchase price was agreed upon compared to the market as of the closing date of the Acquisition.
The accompanying consolidated financial statements as of December 31, 2010 include the following preliminary fair value allocation of the purchase of the net assets acquired:
| (in millions) |
||||
| Total consideration |
$ | 608.0 | ||
| Allocation of consideration: |
||||
| Store cash acquired |
0.6 | |||
| Inventory |
195.0 | |||
| Property, plant and equipment |
385.0 | |||
| MN PL LLC investment |
93.0 | |||
| MPLI investment |
7.0 | |||
| Intangible assets |
35.4 | |||
| Margin support contract |
17.3 | |||
| Derivative liability |
(40.9 | ) | ||
| Lease financing obligation |
(24.5 | ) | ||
| Other, net |
(8.5 | ) | ||
|
|
|
|||
| Bargain purchase gain |
$ | (51.4 | ) | |
|
|
|
|||
At this time, the valuations and other studies needed to provide a final basis for estimating the fair value of the net assets acquired have been completed.
Subsequent to the Acquisition, MPC has agreed to provide the Company with administrative and support services pursuant to a transition services agreement, including finance and accounting, human resources, and information systems services, as well as support services generally for a period of up to eighteen months in connection with the transition from being a part of MPC’s systems and infrastructure to having its own systems and infrastructure. The transition services agreement requires the Company to pay MPC for the provision of the transition services, as well as to reimburse MPC for compensation paid to MPC employees providing such transition services. In addition, under the agreement, Marathon will provide support services for the operation of the refining and retail business segments, using the employees that are ultimately expected to be transitioned to the Company. The Company is obligated to reimburse MPC for the compensation paid to MPC employees providing such operations services, plus the agreed burden rates. MPC is obligated to provide these services to the Company for twelve months from the Acquisition date, but the services may be extended for an additional six months beyond the initial twelve month period. The transition services agreement may be terminated by a mutual agreement of the parties, and the Company or MPC may also unilaterally terminate the agreement upon a material breach by the other party. For the nine months ended September 30, 2011, the Company has recognized expenses of approximately $14 million related to
F-12
Table of Contents
Index to Financial Statements
administrative and support services. The Company also has paid $6.7 million as of December 31, 2010 that is being amortized during 2011 as these services are incurred.
5. INCOME TAXES
For the period subsequent to the Acquisition, the Company is a pass-through entity for U.S. federal income tax purposes. As a result, there are no U.S. federal income taxes incurred. For the nine months ended September 30, 2011, the Company incurred state income taxes of less than $0.1 million.
For all periods prior to the Acquisition, the taxable results of the Predecessor were included in the consolidated U.S. federal and various state and local tax returns of Marathon Oil. Also, in certain state, local and foreign jurisdictions, the Predecessor filed on a stand-alone basis. The tax provisions and related balance sheet disclosures for the period prior to the closing of the Acquisition have been prepared assuming the Predecessor was a stand-alone taxpayer for the periods presented.
A reconciliation of the U.S. federal statutory income tax rate (35%) for the Predecessor applied to income before income taxes to the provision for income taxes is as follows:
| Predecessor | ||||
| (in millions) |
Nine Months Ended September 30, 2010 |
|||
| Statutory U.S. income tax rate |
35.0 | % | ||
| State and local income taxes, net of federal income tax effects |
6.3 | |||
| Domestic manufacturing deduction |
(1.5 | ) | ||
| Other, net |
(0.1 | ) | ||
|
|
|
|||
| Effective income tax rate |
39.7 | % | ||
|
|
|
|||
The results of Speedway, SuperMom’s LLC and the interest in MN PL LLC were included in the income tax returns of MPC LP prior to January 1, 2010. Beginning in 2010, the activity of these businesses was included in Marathon Oil’s income tax returns. MPC LP and Marathon Oil are continuously undergoing examination of their U.S. federal income tax returns by the Internal Revenue Service. MPC LP and Marathon Oil believe they have made adequate provision for U.S. federal income taxes and interest which may become payable for years not yet settled. Further, MPC LP and Marathon Oil are routinely involved in Minnesota tax audits. MPC LP and Marathon Oil believe all other audits will be resolved within the amounts paid and/or provided for these liabilities.
The Company (and previously, the Predecessor) follows the provisions of ASC 740 related to accounting for uncertainties in income taxes. No unrecognized tax benefits are recorded by the Company as of September 30, 2011 or December 31, 2010.
6. INVENTORIES
| (in millions) |
September 30, 2011 |
December 31, 2010 |
||||||
| Crude oil and refinery feedstocks |
$ | 11.7 | $ | 24.3 | ||||
| Refined products |
109.3 | 102.7 | ||||||
| Merchandise |
15.5 | 14.8 | ||||||
| Supplies and sundry items |
16.3 | 14.6 | ||||||
|
|
|
|
|
|||||
| Total |
$ | 152.8 | $ | 156.4 | ||||
|
|
|
|
|
|||||
F-13
Table of Contents
Index to Financial Statements
The LIFO method accounted for 88% and 90% of total inventory value at September 30, 2011 and December 31, 2010, respectively. Current acquisition costs were estimated to exceed the LIFO inventory value by $2.1 million at both September 30, 2011 and December 31, 2010, respectively.
7. EQUITY METHOD INVESTMENT
The Company (and previously, the Predecessor) has a 17% common interest in MN PL LLC. The carrying value of this equity method investment was $90.5 million and $92.4 million at September 30, 2011 and December 31, 2010, respectively.
As of September 30, 2011 and December 31, 2010, the carrying amount of the equity method investment was $7.0 million and $7.2 million higher than the underlying net assets of the investee, respectively. The Company is amortizing this difference over the remaining life of MN PL LLC’s primary asset (the fixed asset life of the pipeline).
Distributions received from MN PL LLC were $4.9 million and $6.0 million for the nine months ended September 30, 2011 and 2010, respectively.
8. PROPERTY, PLANT AND EQUIPMENT
Major classes of property, plant and equipment (“PP&E”) consisted of the following:
| (in millions) |
Estimated Useful Lives |
September 30, 2011 |
December 31, 2010 |
|||||||
| Land |
$ | 8.7 | $ | 8.7 | ||||||
| Retail stores and equipment |
2 -22 years | 62.5 | 61.2 | |||||||
| Refinery and equipment |
5 -24 years | 287.6 | 271.2 | |||||||
| Other equipment |
2 - 7 years | 1.9 | 1.8 | |||||||
| Precious metals |
10.5 | 10.5 | ||||||||
| Assets under construction |
44.3 | 35.1 | ||||||||
|
|
|
|
|
|||||||
| 415.5 | 388.5 | |||||||||
| Less: accumulated depreciation |
23.7 | 2.2 | ||||||||
|
|
|
|
|
|||||||
| Property, plant and equipment, net |
$ | 391.8 | $ | 386.3 | ||||||
|
|
|
|
|
|||||||
PP&E included gross assets acquired under capital leases of $12.5 million at both September 30, 2011 and December 31, 2010 with related amounts in accumulated depreciation and amortization of $0.1 million at September 30, 2011.
9. INTANGIBLE ASSETS
Intangible assets were ascribed value as a result of the Acquisition and are comprised of franchise rights amounting to $19.8 million and trademarks amounting to $15.6 million at both September 30, 2011 and December 31, 2010. These assets have an indefinite life and therefore are not amortized, but rather are tested for impairment annually or sooner if events or changes in circumstances indicate that the fair value of the intangible asset has been reduced below carrying value.
10. DERIVATIVES
The Company is subject to crude oil and refined product market price fluctuations caused by supply conditions, weather, economic conditions and other factors. In October 2010, at the request of the Company, MPC initiated a crack spread derivative strategy to mitigate refining margin risk on a portion of the business’ 2011 and 2012 projected refinery production. In connection with the Acquisition, derivative
F-14
Table of Contents
Index to Financial Statements
instruments executed pursuant to this strategy, along with all corresponding rights and obligations, were assumed by the Company. The Company also may periodically use futures contracts to manage price risks associated with inventory quantities above or below target levels.
Under the derivative strategy, the Company agrees to buy or sell an amount equal to a fixed price times a certain number of barrels, and to buy or sell in return an amount equal to a specified variable price times the same amount of barrels. Physical volumes are not exchanged and these contracts are net settled with cash. The contracts are not being accounted for as hedges for financial reporting purposes. The Company recognizes all derivative instruments as either assets or liabilities at fair value on the balance sheet and any related net gain or loss is recorded as a gain or loss in the derivative activity caption on the consolidated and combined statements of operations. Observable quoted prices for similar assets or liabilities in active markets (Level 2 as described in Note 12) are considered to determine the fair values for the purpose of marking to market the derivative instruments at each period end. At September 30, 2011, the Company had open commodity derivative instruments consisting of crude oil futures to buy 22 million barrels and refined products futures and swaps to sell 22 million barrels primarily to protect the value of refining margins through 2012.
For the nine months ended September 30, 2011, there were losses related to derivative activities of $580.9 million. Of these total losses, $246.4 million represented realized losses on settled contracts and $334.5 million represented unrealized losses on open contracts for the nine months ended September 30, 2011. There were no derivative contracts outstanding for the nine months ended September 30, 2010.
The following table summarizes the fair value amounts of the Company’s outstanding derivative instruments by location on the balance sheet as of September 30, 2011 and December 31, 2010:
| (in millions) |
Balance Sheet Classification | September 30, 2011 | December 31, 2010 | |||||||||
| Derivatives not designated as hedges: |
||||||||||||
| Commodity swaps and futures |
Current liabilities | $ | 346.2 | $ | 45.6 | |||||||
| Commodity swaps and futures |
Noncurrent liabilities | 56.5 | 22.4 | |||||||||
|
|
|
|
|
|||||||||
| $ | 402.7 | $ | 68.0 | |||||||||
|
|
|
|
|
|||||||||
The Company can be exposed to credit risk in the event of nonperformance by its counterparty on these derivative instruments. The counterparty is a large financial institution with a credit rating of at least A- by Standard and Poor’s and A1 by Moody’s. In the event of default, the Company would potentially be subject to losses on a derivative instrument’s mark-to-market gains. The Company does not expect nonperformance on any of its derivative instruments.
The Company has provided letters of credit for a fixed dollar amount under its asset-based revolving credit facility (as discussed in Note 11) to the counterparty on the derivative instruments utilized under the crack spread derivative strategy. The Company is not subject to any margin calls for these crack spread derivatives and the counterparty does not have the right to demand any additional collateral beyond the aforementioned fixed dollar letters of credit. Any outstanding collateral is released to the Company upon settlement of the related derivative instrument.
11. DEBT
In connection with the Acquisition, the Company entered into various financing arrangements including $290.0 million of 10.50% Senior Secured Notes due December 1, 2017 (“Secured Notes”) and a $300 million secured asset-based revolving credit facility (“ABL Facility”).
F-15
Table of Contents
Index to Financial Statements
Secured Notes
The Secured Notes are guaranteed, jointly and severally, on a senior secured basis by all of the Company’s existing and future direct and indirect subsidiaries; however, not on a full and unconditional basis as a result of subsidiaries being able to be released as guarantors under certain customary circumstances for such arrangements. A subsidiary guarantee can be released under customary circumstances, including (a) the sale of the subsidiary, (b) the subsidiary is declared “unrestricted,” (c) the legal or covenant defeasance or satisfaction and discharge of the indenture, or (d) liquidation or dissolution of the subsidiary. Separate condensed consolidating financial information is not included as NTE does not have independent assets or operations.
The Company is required to make interest payments on June 1 and December 1 of each year, commencing on June 1, 2011. There are no scheduled principal payments required prior to the notes maturing on December 1, 2017. Borrowings bear interest at 10.50%.
At any time prior to the maturity date of the notes, the Company may, at its option, redeem all or any portion of the notes for the outstanding principal amount plus unpaid interest and a make-whole premium as defined in the indenture. If the Company experiences a change in control or makes certain asset dispositions, as defined under the indenture, the Company may be required to repurchase all or part of the notes plus unpaid interest and in certain cases pay a redemption premium.
The Secured Notes contain a number of covenants that, among other things, restrict the ability, subject to certain exceptions, of the Company and its subsidiaries to sell or otherwise dispose of assets, including capital stock of subsidiaries, incur additional indebtedness or issue preferred stock, repay other indebtedness, pay dividends and distributions or repurchase capital stock, create liens on assets, make investments, loans or advances, make certain acquisitions, engage in mergers or consolidations, engage in certain transactions with affiliates, change the business conducted by itself and its subsidiaries, and enter into agreements that restrict dividends from restricted subsidiaries.
ABL Facility
The ABL Facility provides for revolving credit financing through December 1, 2015 in an aggregate principal amount of up to $300 million (of which $150 million may be utilized for the issuance of letters of credit and up to $30 million may be short-term borrowings upon same-day notice, referred to as swingline loans) and may be increased up to a maximum aggregate principal amount of $400 million, subject to borrowing base availability and lender approval. Availability under the ABL Facility at any time will be the lesser of (a) the aggregate commitments under the ABL Facility or (b) the borrowing base, less any outstanding borrowings and letters of credit. The borrowing base is calculated based on a percentage of eligible accounts receivable, petroleum inventory and other assets.
Borrowings under the ABL Facility bear interest, at the Company’s option, at either (a) an alternative base rate, plus an applicable margin (ranging between 1.75% and 2.25%) or (b) a LIBOR rate plus applicable margin (ranging between 2.75% and 3.25%). The alternate base rate is the greater of (a) the prime rate, (b) the Federal Funds Effective rate plus 50 basis points, or (c) one-month LIBOR rate plus 100 basis points and a spread of up to 225 basis points based upon percentage utilization of this facility. In addition to paying interest on outstanding borrowings, the Company is also required to pay an annual commitment fee ranging from 0.375% to 0.625% and letter of credit fees.
As of September 30, 2011, the availability under the ABL Facility was $137.5 million. This availability is net of $61.5 million in outstanding letters of credit. The Company had no borrowings under the ABL Facility at September 30, 2011 and December 31, 2010.
F-16
Table of Contents
Index to Financial Statements
The ABL Facility has a minimum fixed charge coverage ratio financial covenant requirement of at least 1.0 to 1.0. The covenant is operative when the Company’s availability under the facility is less than the greater of (a) 15% of the lesser of the $300 million commitment amount or the borrowing base or (b) $22.5 million.
12. NONCONTROLLING PREFERRED INTEREST IN SUBSIDIARY
As part of the Acquisition, Marathon was issued an $80 million perpetual payment-in-kind preferred interest in NT Holdings, a wholly owned subsidiary of the Company. The preferred interest must be redeemed upon the occurrence of certain events which may not necessarily be in the control of the Company. As such, the preferred interest has been classified outside of permanent equity.
The preferred interest has a 9% annual dividend. To the extent that dividends are not paid, the dividend increases the redemption value of the preferred interest. During the nine months ended September 30, 2011, NT Holdings accrued $5.5 million of payment-in-kind dividends on the preferred interest.
13. FAIR VALUE MEASUREMENTS
As defined in accounting guidance, fair value is the price that would be received for the sale of an asset or paid to transfer a liability in an orderly transaction between market participants at the measurement date. Accounting guidance describes three approaches to measuring the fair value of assets and liabilities: the market approach, the income approach and the cost approach, each of which includes multiple valuation techniques. The market approach uses prices and other relevant information generated by market transactions involving identical or comparable assets or liabilities. The income approach uses valuation techniques to measure fair value by converting future amounts, such as cash flows or earnings, into a single present value amount using current market expectations about those future amounts. The cost approach is based on the amount that would currently be required to replace the service capacity of an asset. This is often referred to as current replacement cost. The cost approach assumes that the fair value would not exceed what it would cost a market participant to acquire or construct a substitute asset of comparable utility, adjusted for obsolescence.
Accounting guidance does not prescribe which valuation technique should be used when measuring fair value and does not prioritize among the techniques. Accounting guidance establishes a fair value hierarchy that prioritizes the inputs used in applying the various valuation techniques. Inputs broadly refer to the assumptions that market participants use to make pricing decisions, including assumptions about risk. Level 1 inputs are given the highest priority in the fair value hierarchy while Level 3 inputs are given the lowest priority. The three levels of the fair value hierarchy are as follows:
| Ÿ | Level 1—Observable inputs that reflect unadjusted quoted prices for identical assets or liabilities in active markets as of the reporting date. Active markets are those in which transactions for the asset or liability occur in sufficient frequency and volume to provide pricing information on an ongoing basis. |
| Ÿ | Level 2—Observable market-based inputs or unobservable inputs that are corroborated by market data. These are inputs other than quoted prices in active markets included in Level 1, which are either directly or indirectly observable as of the reporting date. |
| Ÿ | Level 3—Unobservable inputs that are not corroborated by market data and may be used with internally developed methodologies that result in management’s best estimate of fair value. |
The Company uses a market or income approach for recurring fair value measurements and endeavors to use the best information available. Accordingly, valuation techniques that maximize the use of observable inputs are favored. The assessment of the significance of a particular input to the fair
F-17
Table of Contents
Index to Financial Statements
value measurement requires judgment and may affect the placement of assets and liabilities within the levels of the fair value hierarchy.
The Company’s current assets and liabilities accounts contain certain financial instruments, the most significant of which are trade accounts receivables and trade payables. The Company believes the carrying values of its current assets and liabilities approximate fair value. The Company’s fair value assessment incorporates a variety of considerations, including the short-term duration of the instruments, and the Company’s historical incurrence of and expected future insignificant bad debt expense, which includes an evaluation of counterparty credit risk.
The following table provides the assets and liabilities carried at fair value measured on a recurring basis at September 30, 2011 and December 31, 2010:
| (in millions) |
Balance at September 30, 2011 |
Quoted prices in active markets (Level 1) |
Significant other observable inputs (Level 2) |
Unobservable inputs (Level 3) |
||||||||||||
| ASSETS |
||||||||||||||||
| Cash and cash equivalents |
$ | 126.9 | $ | 126.9 | $ | — | $ | — | ||||||||
| Other current assets |
||||||||||||||||
| Contingent consideration—margin support |
29.7 | — | — | 29.7 | ||||||||||||
| Other assets |
||||||||||||||||
| Contingent consideration—margin support |
11.5 | — | — | 11.5 | ||||||||||||
|
|
|
|
|
|
|
|
|
|||||||||
| $ | 168.1 | $ | 126.9 | $ | — | $ | 41.2 | |||||||||
|
|
|
|
|
|
|
|
|
|||||||||
| LIABILITIES |
||||||||||||||||
| Derivative liability—current |
$ | 346.2 | $ | — | $ | 346.2 | $ | — | ||||||||
| Derivative liability—long-term |
56.5 | — | 56.5 | — | ||||||||||||
| Other liabilities |
||||||||||||||||
| Contingent consideration—earn-out |
40.1 | — | — | 40.1 | ||||||||||||
|
|
|
|
|
|
|
|
|
|||||||||
| $ | 442.8 | $ | — | $ | 402.7 | $ | 40.1 | |||||||||
|
|
|
|
|
|
|
|
|
|||||||||
| (in millions) |
Balance at December 31, 2010 |
Quoted prices in active markets (Level 1) |
Significant other observable inputs (Level 2) |
Unobservable inputs (Level 3) |
||||||||||||
| ASSETS |
||||||||||||||||
| Cash and cash equivalents |
$ | 74.3 | $ | 74.3 | $ | — | $ | — | ||||||||
| Other assets |
||||||||||||||||
| Contingent consideration—margin support |
17.3 | — | — | 17.3 | ||||||||||||
|
|
|
|
|
|
|
|
|
|||||||||
| $ | 91.6 | $ | 74.3 | $ | — | $ | 17.3 | |||||||||
|
|
|
|
|
|
|
|
|
|||||||||
| LIABILITIES |
||||||||||||||||
| Derivative liability—current |
$ | 45.6 | $ | — | $ | 45.6 | $ | — | ||||||||
| Derivative liability—long-term |
22.4 | — | 22.4 | — | ||||||||||||
| Other liabilities |
||||||||||||||||
| Contingent consideration—earn-out |
53.8 | — | — | 53.8 | ||||||||||||
|
|
|
|
|
|
|
|
|
|||||||||
| $ | 121.8 | $ | — | $ | 68.0 | $ | 53.8 | |||||||||
|
|
|
|
|
|
|
|
|
|||||||||
The Company determines the fair value of its contingent consideration arrangements (margin support and earn-out) based on a probability-weighted income approach derived from financial performance estimates. The impact of changes in the fair value of these arrangements are recorded in the statements of operations as contingent consideration income, net. Changes in the fair value of the Company’s level 3 contingent consideration arrangements during the nine months ended September 30, 2011 were due to updated financial performance estimates.
F-18
Table of Contents
Index to Financial Statements
Assets not recorded at fair value on a recurring basis, such as property, plant and equipment, intangible assets and cost method investments are recognized at fair value when they are impaired. During the nine months ended September 30, 2011, there were no adjustments to the fair value of such assets. The Company recorded assets acquired and liabilities assumed in the Acquisition at fair value.
The carrying value of debt, which is reported on the Company’s consolidated balance sheets, reflects the cash proceeds received upon its issuance, net of subsequent repayments. The fair value of the Secured Notes disclosed below was determined based on quoted prices in active markets.
| September 30, 2011 | December 31, 2010 | |||||||||||||||
| (in millions) |
Carrying Amount |
Fair Value |
Carrying Amount |
Fair Value |
||||||||||||
| Secured Notes |
$ | (290.0 | ) | $ | (306.1 | ) | $ | (290.0 | ) | $ | (299.4 | ) | ||||
14. ASSET RETIREMENT OBLIGATIONS
As a result of the Acquisition, the asset retirement obligation of the Predecessor was adjusted to a fair value of $2.1 million. Accretion expense for the nine months ended September 30, 2011 was $0.1 million.
15. STOCK-BASED COMPENSATION
An indirect parent of the Company sponsors an equity participation plan which provides for the grant of profit interest units to certain employees of the Company. The plan has reserved approximately 29 million units for issuance under the plan. The exercise price for a unit shall not be less than 100% of the fair market value of our equity units on the date of grant. Units vest in annual installments over a period of five years after the date of grant and expire ten years after the date of grant.
A summary of profit interest unit activity is set forth below:
| Number of Units (in millions) |
Weighted Average Exercise Price |
Weighted Average Remaining Contractual Term |
||||||||||
| Outstanding at inception |
— | $ | — | |||||||||
| Granted |
22.7 | 1.78 | ||||||||||
|
|
|
|||||||||||
| Outstanding at December 31, 2010 |
22.7 | 1.78 | 9.9 | |||||||||
| Granted |
1.3 | 1.86 | ||||||||||
|
|
|
|||||||||||
| Outstanding at September 30, 2011 |
24.0 | $ | 1.78 | 9.7 | ||||||||
|
|
|
|||||||||||
The estimated weighted average fair value as of grant date of units granted during 2011 and 2010 was $0.57 and $0.30, respectively, based upon the following assumptions:
| 2011 | 2010 | |||
| Expected life (years) |
6.5 | 6.5 | ||
| Expected volatility |
40.6% - 49.6% | 40.6% | ||
| Expected dividend yield |
0.0% | 0.0% | ||
| Risk-free interest rate |
2.5% - 2.7% | 2.7% |
The weighted average expected life for the grants is calculated using the simplified method, which defines the expected life as the average of the contractual term of the options and the weighted
F-19
Table of Contents
Index to Financial Statements
average vesting period. Expected volatility for the grants is based primarily on the historical volatility of a representative group of peer companies for a period consistent with the expected life of the awards.
For the nine months ended September 30, 2011 the Company incurred $1.1 million of stock-based compensation. As of September 30, 2011, the total unrecognized compensation cost for profit interest units was $6.4 million. This non-cash expense will be recognized on a straight line basis through 2016.
16. SUPPLEMENTAL CASH FLOW INFORMATION
Supplemental cash flow information is as follows:
| Successor | Predecessor | |||||||||
| (in millions) |
Nine Months Ended September 30, 2011 |
Nine Months Ended September 30, 2010 |
||||||||
| Net cash from operating activities included: |
||||||||||
| Interest paid |
$ | 15.2 | $ | — | ||||||
| Income taxes paid through MPC LP and Speedway |
— | 50.4 | ||||||||
| Noncash investing and financing activities include: |
||||||||||
| Capital expenditures included in accounts payable |
$ | 1.3 | $ | 2.3 | ||||||
17. LEASING ARRANGEMENTS
As described in Note 4, concurrent with the Acquisition, certain Marathon assets (including real property interests and land related to 135 of the SuperAmerica convenience stores and the SuperMom’s bakery) were sold to a third party equity real estate investment trust. In connection with the closing of the Acquisition, the Company has assumed the leasing of these properties from the real estate investment trust on a long-term basis.
In accordance with ASC 840-40, the Company has determined that it has a continuing involvement for a portion of these property interests due to potential environmental obligations or due to subleasing arrangements. For these respective properties, the fair value of the assets and the related financing obligation will remain on the Company’s consolidated balance sheet until the end of the lease term or until the continuing involvement is resolved. The assets are included in property, plant and equipment and are being depreciated over their remaining useful lives. The lease payments relating to these property interests are recognized as interest expense.
The remainder of properties sold to the third party real estate investment trust are treated as operating leases. The Company (and previously, the Predecessor) also leases a variety of facilities and equipment under other operating leases, including land and building space, office equipment, vehicles, rail tracks for storage of rail tank cars near the refinery and numerous rail tank cars.
18. CONTINGENCIES AND COMMITMENTS
The Company and the Predecessor are the subject of, or party to, contingencies and commitments involving a variety of matters. Certain of these matters are discussed below. The ultimate resolution of these contingencies could, individually or in the aggregate, be material to the Company’s consolidated and combined financial statements. However, management believes that the Company will remain a viable and competitive enterprise even though it is possible that these contingencies could be resolved unfavorably.
F-20
Table of Contents
Index to Financial Statements
Contingent Consideration
As described in Note 4, the Acquisition provides for contingent consideration, or earn-out payments, that could result in additional payments of up to a total of $125 million to MPC over an eight year period ending December 1, 2018 based on operating performance. See Note 13 for additional information relating to the fair value of contingent arrangements related to the Acquisition.
Environmental Matters
The Company and the Predecessor are subject to federal, state, local and foreign laws and regulations relating to the environment. These laws generally provide for control of pollutants released into the environment and require responsible parties to undertake remediation of hazardous waste disposal sites. Penalties may be imposed for noncompliance. At September 30, 2011 and December 31, 2010, liabilities for remediation totaled $4.3 million and $3.5 million, respectively. These liabilities are expected to be settled over at least the next 10 years. It is not presently possible to estimate the ultimate amount of all remediation costs that might be incurred or the penalties that may be imposed. Furthermore, environmental remediation costs may vary from estimates because of changes in laws, regulations and their interpretation; additional information on the extent and nature of site contamination; and improvements in technology. Receivables for recoverable costs from the state, under programs to assist companies in clean-up efforts related to underground storage tanks at retail marketing outlets, were $0.2 million at both September 30, 2011 and December 31, 2010.
Franchise Agreements
In the normal course of its business, SAF enters into ten year license agreements with the operators of franchised SuperAmerica brand retail outlets. These agreements obligate SAF or its affiliates to provide certain services including information technology support, maintenance, credit card processing and signage for specified monthly fees.
Guarantees
Over the years, the Predecessor has sold various assets in the normal course of business. Certain of the related agreements contain performance and general guarantees, including guarantees regarding inaccuracies in representations, warranties, covenants and agreements, and environmental and general indemnifications that require the Predecessor to perform upon the occurrence of a triggering event or condition. These guarantees and indemnifications are part of the normal course of selling assets. The Company has assumed these guarantees and indemnifications upon the Acquisition. However, in certain cases, MPC has also provided an indemnification in favor of the Company.
The Company is not typically able to calculate the maximum potential amount of future payments that could be made under such contractual provisions because of the variability inherent in the guarantees and indemnities. Most often, the nature of the guarantees and indemnities is such that there is no appropriate method for quantifying the exposure because the underlying triggering event has little or no past experience upon which a reasonable prediction of the outcome can be based. The Company is not currently making any payments relating to such guarantees or indemnifications.
19. SEGMENT INFORMATION
The Company has two reportable operating segments: Refining and Retail. Each of these segments is organized and managed based upon the nature of the products and services they offer. The segment disclosures reflect management’s current organizational structure.
| Ÿ | Refining —operates the St. Paul Park, Minnesota, refinery, terminal and related assets, including the Company’s interest in MPLI and MN PL LLC, and |
F-21
Table of Contents
Index to Financial Statements
| Ÿ | Retail —operates 166 convenience stores primarily in Minnesota and Wisconsin. The Retail segment also includes the operations of NTB and SAF. |
The Company’s interest in MPLI and MN PL LLC were previously presented within the “Other” segment by the Predecessor. Additionally, the Company has changed how they present certain sales to franchisees. All Predecessor period information has been recast to conform to the current Successor presentation.
Operating results for the Company’s operating segments are as follows:
| Nine months ended September 30, 2011 (Successor) | Refining | Retail | Other | Total | ||||||||||||
| (in millions) | ||||||||||||||||
| Revenues |
||||||||||||||||
| Customer |
$ | 2,026.4 | $ | 1,165.6 | — | $ | 3,192.0 | |||||||||
| Intersegment |
831.3 | — | — | 831.3 | ||||||||||||
| Related parties |
— | — | — | — | ||||||||||||
|
|
|
|
|
|
|
|
|
|||||||||
| Segment revenues |
2,857.7 | 1,165.6 | — | 4,023.3 | ||||||||||||
| Elimination of intersegment revenues |
— | — | (831.3 | ) | (831.3 | ) | ||||||||||
|
|
|
|
|
|
|
|
|
|||||||||
| Total revenues |
$ | 2,857.7 | $ | 1,165.6 | $ | (831.3 | ) | $ | 3,192.0 | |||||||
|
|
|
|
|
|
|
|
|
|||||||||
| Operating income |
$ | 330.0 | $ | 9.6 | $ | 7.5 | $ | 347.1 | ||||||||
| Income from equity method investment |
$ | 3.2 | $ | — | $ | — | $ | 3.2 | ||||||||
| Depreciation and amortization |
$ | 16.0 | $ | 6.0 | $ | 0.3 | $ | 22.3 | ||||||||
| Capital expenditures |
$ | 19.7 | $ | 2.6 | $ | 5.1 | $ | 27.4 | ||||||||
| Nine months ended September 30, 2010 (Predecessor) | Refining | Retail | Other | Total | ||||||||||||
| (in millions) | ||||||||||||||||
| Revenues |
||||||||||||||||
| Customer |
$ | 1,429.2 | $ | 982.7 | — | $ | 2,411.9 | |||||||||
| Intersegment |
660.6 | — | — | 660.6 | ||||||||||||
| Related parties |
170.4 | — | — | 170.4 | ||||||||||||
|
|
|
|
|
|
|
|
|
|||||||||
| Segment revenues |
2,260.2 | 982.7 | — | 3,242.9 | ||||||||||||
| Elimination of intersegment revenues |
— | — | (660.6 | ) | (660.6 | ) | ||||||||||
|
|
|
|
|
|
|
|
|
|||||||||
| Total revenues |
$ | 2,260.2 | $ | 982.7 | $ | (660.6 | ) | $ | 2,582.3 | |||||||
|
|
|
|
|
|
|
|
|
|||||||||
| Operating income |
$ | 102.9 | $ | 21.3 | $ | — | $ | 124.2 | ||||||||
| Income from equity method investment |
$ | 4.3 | $ | — | $ | — | $ | 4.3 | ||||||||
| Depreciation and amortization |
$ | 19.9 | $ | 10.1 | $ | — | $ | 30.0 | ||||||||
| Capital expenditures |
$ | 21.3 | $ | 0.3 | $ | — | $ | 21.6 | ||||||||
Intersegment sales from the Refining segment to the Retail segment consist primarily of sales of refined products which are recorded based on contractual prices that are market based. Revenues from external customers are nearly all in the United States.
F-22
Table of Contents
Index to Financial Statements
Total assets by segment were as follows:
| Refining | Retail | Other | Total | |||||||||||||
| (in millions) |
||||||||||||||||
| At September 30, 2011 |
||||||||||||||||
| Segment and other assets |
$ | 753.4 | $ | 179.1 | $ | 89.8 | $ | 1,022.3 | ||||||||
| Elimination of intersegment assets |
— | — | (29.8 | ) | (29.8 | ) | ||||||||||
|
|
|
|
|
|
|
|
|
|||||||||
| Total assets |
$ | 753.4 | $ | 179.1 | $ | 60.0 | $ | 992.5 | ||||||||
|
|
|
|
|
|
|
|
|
|||||||||
| At December 31, 2010 |
||||||||||||||||
| Segment and other assets |
$ | 667.7 | $ | 161.2 | $ | 129.1 | $ | 958.0 | ||||||||
| Elimination of intersegment assets |
— | — | (25.9 | ) | (25.9 | ) | ||||||||||
|
|
|
|
|
|
|
|
|
|||||||||
| Total assets |
$ | 667.7 | $ | 161.2 | $ | 103.2 | $ | 932.1 | ||||||||
|
|
|
|
|
|
|
|
|
|||||||||
All plant, property and equipment are located in the United States.
F-23
Table of Contents
Index to Financial Statements
Report of Independent Registered Public Accounting Firm
To the Board of Directors of Northern Tier Investors, LLC:
In our opinion, the accompanying consolidated balance sheet and the related consolidated statements of income, cash flows and noncontrolling preferred interest in subsidiary and member’s interest present fairly, in all material respects, the financial position of Northern Tier Investors, LLC and its subsidiaries at December 31, 2010, and the results of their operations and their cash flows for the period August 10, 2010 (inception date) to December 31, 2010 in conformity with accounting principles generally accepted in the United States of America. These financial statements are the responsibility of the Company’s management. Our responsibility is to express an opinion on these financial statements based on our audit. We conducted our audit of these statements in accordance with the standards of the Public Company Accounting Oversight Board (United States). Those standards require that we plan and perform the audit to obtain reasonable assurance about whether the financial statements are free of material misstatement. An audit includes examining, on a test basis, evidence supporting the amounts and disclosures in the financial statements, assessing the accounting principles used and significant estimates made by management, and evaluating the overall financial statement presentation. We believe that our audit provides a reasonable basis for our opinion.
| /s/ PricewaterhouseCoopers LLP |
| PricewaterhouseCoopers LLP |
Houston, Texas
December 12, 2011
F-24
Table of Contents
Index to Financial Statements
Report of Independent Registered Public Accounting Firm
To Marathon Oil Corporation:
In our opinion, the accompanying combined balance sheet and the related combined statements of income, cash flows and net investment present fairly, in all material respects, the financial position of the St. Paul Refinery & Retail Marketing Business, a component of Marathon Oil Corporation, at December 31, 2009, and the results of its operations and its cash flows for the eleven months ended November 30, 2010 and each of the two years in the period ended December 31, 2009 in conformity with accounting principles generally accepted in the United States of America. These combined financial statements are the responsibility of management. Our responsibility is to express an opinion on these combined financial statements based on our audits. We conducted our audits of these statements in accordance with the standards of the Public Company Accounting Oversight Board (United States). Those standards require that we plan and perform the audit to obtain reasonable assurance about whether the financial statements are free of material misstatement. An audit includes examining, on a test basis, evidence supporting the amounts and disclosures in the financial statements, assessing the accounting principles used and significant estimates made by management, and evaluating the overall financial statement presentation. We believe that our audits provide a reasonable basis for our opinion.
| /s/ PricewaterhouseCoopers LLP |
| PricewaterhouseCoopers LLP |
Houston, Texas
April 12, 2011, except for the change in the composition of reportable segments discussed in Note 19 to the combined financial statements, as to which the date is December 12, 2011.
F-25
Table of Contents
Index to Financial Statements
(FORMERLY KNOWN AS ST. PAUL PARK REFINERY & RETAIL MARKETING BUSINESS)
CONSOLIDATED AND COMBINED BALANCE SHEETS
As of December 31, 2010 and 2009
(in millions)
| Successor | Predecessor | |||||||||
| 2010 | 2009 | |||||||||
| ASSETS |
||||||||||
| CURRENT ASSETS |
||||||||||
| Cash and cash equivalents |
$ | 74.3 | $ | 6.0 | ||||||
| Receivables, less allowance for doubtful accounts |
100.2 | 78.6 | ||||||||
| Receivables from related parties |
— | 5.8 | ||||||||
| Inventories |
156.4 | 134.0 | ||||||||
| Other current assets |
28.7 | 0.4 | ||||||||
|
|
|
|
|
|||||||
| Total current assets |
359.6 | 224.8 | ||||||||
| NON-CURRENT ASSETS |
||||||||||
| Equity method investment |
92.4 | 88.0 | ||||||||
| Property, plant and equipment, net |
386.3 | 373.8 | ||||||||
| Goodwill |
— | 11.7 | ||||||||
| Intangible assets, net |
35.4 | — | ||||||||
| Other assets |
58.4 | 11.8 | ||||||||
|
|
|
|
|
|||||||
| Total Assets |
$ | 932.1 | $ | 710.1 | ||||||
|
|
|
|
|
|||||||
| LIABILITIES, PREFERRED INTEREST AND EQUITY |
||||||||||
| CURRENT LIABILITIES |
||||||||||
| Accounts payable |
$ | 183.7 | $ | 113.7 | ||||||
| Payables to related parties |
— | 120.4 | ||||||||
| Accrued liabilities |
22.5 | 12.5 | ||||||||
| Deferred income taxes |
— | 29.4 | ||||||||
| Derivative liability |
45.6 | — | ||||||||
|
|
|
|
|
|||||||
| Total current liabilities |
251.8 | 276.0 | ||||||||
| NON-CURRENT LIABILITIES |
||||||||||
| Long-term debt |
290.0 | — | ||||||||
| Deferred income taxes |
— | 59.4 | ||||||||
| Lease financing obligation |
24.5 | — | ||||||||
| Derivative liability |
22.4 | — | ||||||||
| Other liabilities |
59.2 | 8.5 | ||||||||
|
|
|
|
|
|||||||
| Total liabilities |
647.9 | 343.9 | ||||||||
|
|
|
|
|
|||||||
| Commitments and contingencies |
||||||||||
| Noncontrolling preferred interest in subsidiary |
80.6 | — | ||||||||
| EQUITY |
||||||||||
| Predecessor’s net investment |
— | 366.2 | ||||||||
| Member’s interest |
203.6 | — | ||||||||
|
|
|
|
|
|||||||
| Total Liabilities, Preferred Interest and Equity |
$ | 932.1 | $ | 710.1 | ||||||
|
|
|
|
|
|||||||
The accompanying notes are an integral part of these consolidated and combined financial statements.
F-26
Table of Contents
Index to Financial Statements
(FORMERLY KNOWN AS ST. PAUL PARK REFINERY & RETAIL MARKETING BUSINESS)
CONSOLIDATED AND COMBINED STATEMENTS OF INCOME
(in millions)
| Successor | Predecessor | |||||||||||||||||
| August 10, 2010 (inception date) to December 31, 2010 |
Eleven Months Ended November 30, 2010 |
Year Ended December 31, |
||||||||||||||||
| 2009 | 2008 | |||||||||||||||||
| REVENUE(a) |
$ | 344.9 | $ | 3,195.2 | $ | 2,940.5 | $ | 4,122.4 | ||||||||||
| COSTS, EXPENSES AND OTHER |
||||||||||||||||||
| Cost of sales(a) |
307.5 | 2,697.9 | 2,507.9 | 3,659.0 | ||||||||||||||
| Direct operating expenses |
21.4 | 227.0 | 238.3 | 252.7 | ||||||||||||||
| Turnaround and related expenses |
— | 9.5 | 0.6 | 3.7 | ||||||||||||||
| Depreciation and amortization |
2.2 | 37.3 | 40.2 | 39.2 | ||||||||||||||
| Selling, general and administrative |
6.4 | 59.6 | 64.7 | 67.7 | ||||||||||||||
| Formation costs |
24.3 | — | — | — | ||||||||||||||
| Other (income) expense, net |
0.1 | (5.4 | ) | (1.1 | ) | 1.2 | ||||||||||||
|
|
|
|
|
|
|
|
|
|||||||||||
| OPERATING (LOSS) INCOME |
(17.0 | ) | 169.3 | 89.9 | 98.9 | |||||||||||||
| Unrealized losses from derivative activities |
(27.1 | ) | (40.9 | ) | — | — | ||||||||||||
| Bargain purchase gain |
51.4 | — | — | — | ||||||||||||||
| Interest expense |
(3.2 | ) | (0.3 | ) | (0.4 | ) | (0.5 | ) | ||||||||||
|
|
|
|
|
|
|
|
|
|||||||||||
| EARNINGS BEFORE INCOME TAXES |
4.1 | 128.1 | 89.5 | 98.4 | ||||||||||||||
| Income tax provision |
— | (67.1 | ) | (34.8 | ) | (39.8 | ) | |||||||||||
|
|
|
|
|
|
|
|
|
|||||||||||
| NET EARNINGS |
4.1 | 61.0 | 54.7 | 58.6 | ||||||||||||||
| Less: net earnings attributable to noncontrolling preferred interest |
0.6 | — | — | — | ||||||||||||||
|
|
|
|
|
|
|
|
|
|||||||||||
| NET EARNINGS AVAILABLE TO MEMBERS |
$ | 3.5 | $ | 61.0 | $ | 54.7 | $ | 58.6 | ||||||||||
|
|
|
|
|
|
|
|
|
|||||||||||
| (a) Excise taxes included in revenue and cost of sales |
$ | 25.1 | $ | 271.8 | $ | 289.6 | $ | 271.6 | ||||||||||
The accompanying notes are an integral part of these consolidated and combined financial statements.
F-27
Table of Contents
Index to Financial Statements
(FORMERLY KNOWN AS ST. PAUL PARK REFINERY & RETAIL MARKETING BUSINESS)
CONSOLIDATED AND COMBINED STATEMENTS OF CASH FLOWS
(in millions)
| Successor | Predecessor | |||||||||||||||||
| August 10, 2010 (inception date) to December 31, 2010 |
Eleven Months Ended November 30, 2010 |
Year Ended December 31, |
||||||||||||||||
| Increase (decrease) in cash |
2009 | 2008 | ||||||||||||||||
| CASH FLOWS FROM OPERATING ACTIVITIES |
||||||||||||||||||
| Net earnings |
$ | 4.1 | $ | 61.0 | $ | 54.7 | $ | 58.6 | ||||||||||
| Adjustments to reconcile net earnings to net cash provided by operating activities: |
||||||||||||||||||
| Depreciation and amortization |
2.2 | 37.3 | 40.2 | 39.2 | ||||||||||||||
| Stock-based compensation expense |
0.1 | 0.3 | 0.3 | 0.3 | ||||||||||||||
| Bargain purchase gain |
(51.4 | ) | — | — | — | |||||||||||||
| Equity method investment, net |
0.6 | 0.6 | 0.3 | 1.2 | ||||||||||||||
| Unrealized loss from derivative activities |
27.1 | 40.9 | — | — | ||||||||||||||
| Deferred taxes |
— | (0.8 | ) | 0.5 | 10.0 | |||||||||||||
| Changes in assets and liabilities, net: |
||||||||||||||||||
| Accounts receivable |
(100.2 | ) | (16.3 | ) | (14.7 | ) | 70.2 | |||||||||||
| Inventories |
38.6 | 2.5 | (6.8 | ) | (3.5 | ) | ||||||||||||
| Other current assets |
(27.7 | ) | — | — | — | |||||||||||||
| Accounts payable and accrued expenses |
88.6 | 23.8 | 31.2 | (83.7 | ) | |||||||||||||
| Receivables from and payables to related parties |
— | (1.2 | ) | 23.8 | (45.6 | ) | ||||||||||||
| Other, net |
(0.5 | ) | (2.7 | ) | (0.1 | ) | 0.4 | |||||||||||
|
|
|
|
|
|
|
|
|
|||||||||||
| Net cash (used in) provided by operating activities |
(18.5 | ) | 145.4 | 129.4 | 47.1 | |||||||||||||
|
|
|
|
|
|
|
|
|
|||||||||||
| CASH FLOWS FROM INVESTING ACTIVITIES |
||||||||||||||||||
| Capital expenditures |
(2.5 | ) | (29.8 | ) | (29.0 | ) | (45.0 | ) | ||||||||||
| Disposals of assets |
— | 0.4 | 0.7 | 0.9 | ||||||||||||||
| Acquisition, net of cash acquired |
(360.8 | ) | — | — | — | |||||||||||||
| Contributions to equity method investment |
— | — | — | (40.5 | ) | |||||||||||||
| Return of capital from cost method investment |
— | 0.1 | 3.3 | — | ||||||||||||||
|
|
|
|
|
|
|
|
|
|||||||||||
| Net cash used in investing activities |
(363.3 | ) | (29.3 | ) | (25.0 | ) | (84.6 | ) | ||||||||||
|
|
|
|
|
|
|
|
|
|||||||||||
| CASH FLOWS FROM FINANCING ACTIVITIES |
||||||||||||||||||
| Financing costs |
(34.1 | ) | — | — | — | |||||||||||||
| Borrowings from senior secured notes |
290.0 | — | — | — | ||||||||||||||
| Investment from members |
200.2 | — | — | — | ||||||||||||||
| Contributions from (distributions to) Marathon, net |
— | (115.4 | ) | (103.9 | ) | 34.5 | ||||||||||||
|
|
|
|
|
|
|
|
|
|||||||||||
| Net cash provided by (used in) financing activities |
456.1 | (115.4 | ) | (103.9 | ) | 34.5 | ||||||||||||
|
|
|
|
|
|
|
|
|
|||||||||||
| CASH AND CASH EQUIVALENTS |
||||||||||||||||||
| Change in cash and cash equivalents |
74.3 | 0.7 | 0.5 | (3.0 | ) | |||||||||||||
| Cash and cash equivalents at beginning of period |
— | 6.0 | 5.5 | 8.5 | ||||||||||||||
|
|
|
|
|
|
|
|
|
|||||||||||
| Cash and cash equivalents at end of period |
$ | 74.3 | $ | 6.7 | $ | 6.0 | $ | 5.5 | ||||||||||
|
|
|
|
|
|
|
|
|
|||||||||||
The accompanying notes are an integral part of these consolidated and combined financial statements.
F-28
Table of Contents
Index to Financial Statements
(FORMERLY KNOWN AS ST. PAUL PARK REFINERY & RETAIL MARKETING BUSINESS)
CONSOLIDATED AND COMBINED STATEMENTS OF NONCONTROLLING PREFERRED INTEREST IN SUBSIDIARY, MEMBER’S INTEREST AND NET INVESTMENT
(in millions)
| Noncontrolling Preferred Interest in Subsidiary |
Equity | |||||||||||
| Net Investment |
Member’s Interest |
|||||||||||
| Balance at January 1, 2008 (Predecessor) |
$ | — | $ | 322.2 | $ | — | ||||||
| Net income |
— | 58.6 | — | |||||||||
| Contributions from Marathon, net |
— | 34.7 | — | |||||||||
|
|
|
|
|
|
|
|||||||
| Balance at December 31, 2008 (Predecessor) |
— | 415.5 | — | |||||||||
|
|
|
|
|
|
|
|||||||
| Net income |
— | 54.7 | — | |||||||||
| Distributions to Marathon, net |
— | (104.0 | ) | — | ||||||||
|
|
|
|
|
|
|
|||||||
| Balance at December 31, 2009 (Predecessor) |
— | 366.2 | — | |||||||||
|
|
|
|
|
|
|
|||||||
| Net income |
— | 61.0 | — | |||||||||
| Distributions to Marathon, net |
— | (114.8 | ) | — | ||||||||
|
|
|
|
|
|
|
|||||||
| Balance at November 30, 2010 (Predecessor) |
$ | — | $ | 312.4 | $ | — | ||||||
|
|
|
|
|
|
|
|||||||
|
Balance at August 10, 2010 (Successor Inception Date) |
$ | — | $ | — | $ | — | ||||||
| Capital contribution |
80.0 | — | 200.0 | |||||||||
| Stock based compensation |
— | — | 0.1 | |||||||||
| Net income |
0.6 | — | 3.5 | |||||||||
|
|
|
|
|
|
|
|||||||
| Balance at December 31, 2010 (Successor) |
$ | 80.6 | $ | — | $ | 203.6 | ||||||
|
|
|
|
|
|
|
|||||||
The accompanying notes are an integral part of these consolidated and combined financial statements.
F-29
Table of Contents
Index to Financial Statements
NOTES TO CONSOLIDATED AND COMBINED FINANCIAL STATEMENTS
1. DESCRIPTION OF THE BUSINESS AND BASIS OF PRESENTATION
Description of the Business
Northern Tier Investors, LLC (the “Company” or the “Successor”) is an independent downstream energy company with refining, retail and pipeline operations that serve the Petroleum Administration for Defense District II (“PADD II”) region of the United States. The Company is a Delaware limited liability company and wholly owns the common equity of Northern Tier Holdings LLC (“NT Holdings” or the “Member”). Additionally, NT Holdings has issued preferred stock that is solely owned by an indirect subsidiary of Marathon Petroleum Corporation (“Marathon Petroleum”). Marathon Petroleum was a wholly owned subsidiary of Marathon Oil Corporation (“Marathon Oil”) until June 30, 2011. NT Holdings wholly owns 100% of the common shares of Northern Tier Energy LLC (“NTE”). NTE, NT Holdings and the Company were formed by affiliates of ACON Investments, L.L.C. and TPG Capital L.P. and certain members of management (collectively, the “Investors”) during 2010.
Predecessor interests represent the St. Paul Park Refinery & Retail Marketing Business formerly owned and operated by subsidiaries of Marathon Oil. These subsidiaries, Marathon Petroleum Company LP (“MPC LP”), Speedway LLC (“Speedway”) and MPC Investments LLC are together referred to as “MPC” or “Marathon” and are subsidiaries of Marathon Petroleum as of June 30, 2011. Predecessor interests are hereinafter referred to as the “Predecessor.” Effective December 1, 2010, the Company acquired the Predecessor business from Marathon for approximately $608 million (the “Acquisition”).
The Company includes the operations of the St. Paul Park Refining Co. LLC (“SPPR”) and Northern Tier Retail LLC (“NTR”). The Company also includes Northern Tier Bakery LLC (“NTB”), SuperAmerica Franchising LLC (“SAF”), a 17% interest in MPL Investments Inc. (“MPLI”) and a 17% interest in Minnesota Pipe Line Company, LLC (“MN PL LLC”). MPLI owns 100% of the preferred interest in MN PL LLC which owns and operates the Minnesota Pipe Line, a 455,000 barrels per day crude oil pipeline.
SPPR, which is located in St. Paul Park, Minnesota, has total crude oil throughput capacity of 74,000 barrels per day. Refinery operations include crude fractionation, catalytic cracking, hydrotreating, reforming, alkylation, sulfur recovery and a hydrogen plant. The refinery processes predominately North Dakota and Canadian crude oils into products such as gasoline, diesel, jet fuel, kerosene, asphalt, propane, propylene and sulfur. The refined products are sold to markets primarily located in the Upper Great Plains of the United States.
NTR operates 166 convenience stores under the SuperAmerica brand. SAF supports 67 franchised stores which also utilize the SuperAmerica brand. The SuperAmerica stores are primarily located in Minnesota and Wisconsin and sell gasoline, merchandise, and in some locations, diesel fuel. There is a wide range of merchandise sold at the stores, including prepared foods, beverages and non-food items, as well as a significant number of proprietary items.
NTB prepares and distributes prepared food products under the SuperMom’s Bakery brand primarily to SuperAmerica branded retail outlets.
Basis of Presentation
The accompanying consolidated and combined financial statements present separately the financial position, results of operations, cash flows and changes in equity for both the Company and the Predecessor. In connection with the Acquisition, further described in Note 4, a new accounting basis was established for the Company as of the acquisition date based upon the fair value of the assets acquired and liabilities assumed, in accordance with the guidance for business combinations. Financial information for the pre- and post-acquisition periods have been separated by a line on the
F-30
Table of Contents
Index to Financial Statements
face of the consolidated and combined financial statements to highlight the fact that the financial information for such periods have been prepared under two different historical-cost bases of accounting. For all periods prior to the closing of the Acquisition, the accompanying combined financial statements reflect all assets, liabilities, revenues, expenses and cash flows directly attributable to the Predecessor.
Subsequent Events
Events and transactions subsequent to the balance sheet date have been evaluated through December 12, 2011, the date these consolidated and combined financial statements were issued, for potential recognition or disclosure in the financial statements.
2. SUMMARY OF PRINCIPAL ACCOUNTING POLICIES
Principles of Consolidation and Combination
Prior to the closing of the Acquisition, the Predecessor was legally held by multiple subsidiaries and affiliates of Marathon Oil. As such, the accompanying Predecessor financial statements present the combined accounts of such businesses for all periods prior to the Acquisition. The Company was incorporated on August 10, 2010 and entered into the Acquisition agreement with Marathon on October 6, 2010. After the closing of the Acquisition on December 1, 2010, the Company acquired the stock or net assets of those Predecessor businesses. Accordingly, the accompanying financial statements present the consolidated accounts of such acquired businesses for the period from December 1, 2010 to December 31, 2010. The Company had no operating activities between its August 10, 2010 inception date and the date the Predecessor businesses were acquired although it incurred various transaction and formation costs which have been included in the total successor period of August 10, 2010 through December 31, 2010 (the “Successor Period”).
All significant intercompany accounts have been eliminated in these consolidated and combined financial statements.
The Company’s and the Predecessor’s 17% common interest in MN PL LLC is accounted for using the equity method of accounting in accordance with Financial Accounting Standards Board (“FASB”) Accounting Standards Codification (“ASC”) Topic 323. Income from equity method investment represents the Company’s and the Predecessor’s proportionate share of net income available to common owners generated by MN PL LLC.
The equity method investment is assessed for impairment whenever changes in facts or circumstances indicate a loss in value has occurred. When the loss is deemed to be other than temporary, the carrying value of the equity method investment is written down to fair value, and the amount of the write-down is included in net income. See Note 7 for further information on the Company’s equity investment.
The investment in MPLI over which the Company (and previously, the Predecessor) does not have significant influence is accounted for as a cost method investment. The investment in MPLI is carried at a cost of $7.0 million and $4.7 million as of December 31, 2010 and 2009, respectively, and is included in other noncurrent assets on the consolidated and combined balance sheets. MPLI owns all of the preferred membership units of MN PL LLC. Dividends received from MPLI were $0.1 million, $0.8 million and $4.0 million for the Successor Period ended December 31, 2010, the eleven months ended November 30, 2010 and for the year ended December 31, 2009, respectively. For the eleven months ended November 30, 2010, $0.7 million was recorded in other income and $0.1 million was recorded as return of capital from cost method investment. For 2009, $3.3 million was recorded as return of capital from cost method investment and $0.7 million was recorded in other income. No dividends were received from MPLI for the year ended December 31, 2008.
F-31
Table of Contents
Index to Financial Statements
Use of Estimates
The preparation of financial statements in accordance with generally accepted accounting principles requires management to make estimates and assumptions that affect the reported amounts of assets and liabilities and the disclosure of contingent assets and liabilities as of the date of the consolidated and combined financial statements and the reported amounts of revenues and expenses during the respective reporting periods. Actual results could differ from those estimates. In addition, significant estimates were used in accounting for the Acquisition under the purchase method of accounting.
The Predecessor financial statements include allocations of general, administrative and overhead costs of Marathon that are attributable to the Predecessor’s operations. Management believes the assumptions and allocations underlying the combined financial statements are reasonable. However, these combined financial statements do not include all of the actual expenses that would have been incurred had the Predecessor been a stand-alone entity during the periods presented and do not reflect the Predecessor’s combined results of operations, financial position and cash flows had it been a stand-alone company during the periods presented.
Operating Segments
The Company has two reportable operating segments:
| Ÿ | Refining—operates the St. Paul Park, Minnesota, refinery, terminal and related assets, including the Company’s interest in MPLI and MN PL LLC, and |
| Ÿ | Retail—operates 166 convenience stores primarily in Minnesota and Wisconsin. The Retail segment also includes the operations of NTB and SAF. |
See Note 19 for further information on the Company’s operating segments.
Revenue Recognition
Revenues are recognized when products are shipped or services are provided to customers, title is transferred, the sales price is fixed or determinable and collectability is reasonably assured. Revenues are recorded net of discounts granted to customers. Shipping and other transportation costs billed to customers are presented on a gross basis in revenues and cost of sales.
Rebates from vendors are recognized as a reduction of cost of sales when the initiating transaction occurs. Incentives that are derived from contractual provisions are accrued based on past experience and recognized in cost of sales.
Excise Taxes
The Company (and previously, the Predecessor) is required by various governmental authorities, including federal and state, to collect and remit taxes on certain consumer products. Such taxes are presented on a gross basis in revenues and costs and expenses in the consolidated and combined statements of income. These taxes totaled $25.1 million, $271.8 million, $289.6 million and $271.6 million for the Successor Period ended December 31, 2010, eleven months ended November 30, 2010 and years ended December 31, 2009 and 2008, respectively.
Refined Product Exchanges
The Company (and previously, the Predecessor) enters into exchange contracts whereby it agrees to deliver a particular quantity and quality of refined products at a specified location and date to
F-32
Table of Contents
Index to Financial Statements
a particular counterparty and to receive from the same counterparty a particular quantity and quality of refined products at a specified location on the same or another specified date. The exchange receipts and deliveries are nonmonetary transactions, with the exception of associated grade or location differentials that are settled in cash. These transactions are not recorded as revenue because they involve the exchange of refined product inventories held for sale in the ordinary course of business to facilitate sales to customers. The exchange transactions are recognized at the carrying amount of the inventory transferred plus any cash settlement due to grade or location differentials.
Advertising
The Company (and previously, the Predecessor) expenses the costs of advertising as incurred. Advertising expense was less than $0.1 million for the Successor Period ended December 31, 2010, $2.6 million for the eleven months ended November 30, 2010, and $2.1 million and $1.7 million for the years ended December 31, 2009 and 2008, respectively.
Income Taxes
After the Acquisition, the Company and its subsidiaries are limited liability companies and are therefore pass-through entities for income tax purposes. As a result, the Company incurs no federal income taxes. The Predecessor’s taxable income has historically been included in the consolidated U.S. federal income tax returns of Marathon Oil and also in a number of state income tax returns, which are filed as consolidated returns.
For the Predecessor, the provision for income taxes was computed as if the Predecessor was a stand-alone tax-paying entity and as if it pays the amount of its current federal and state tax liabilities to Marathon in each period. As such, the accrual and payment of the current federal and state tax liabilities is recorded within the net investment in the combined financial statements in the period incurred.
Deferred tax assets and liabilities were recognized based on temporary differences between the financial statement carrying amounts of the Predecessor’s assets and liabilities and their tax bases as reported in Marathon Oil’s tax filings with the respective taxing authorities. The realization of deferred tax assets was assessed periodically based on several interrelated factors. These factors include the Predecessor’s expectation to generate sufficient future taxable income in order to utilize tax credits and operating loss carry-forwards.
Cash and Cash Equivalents
The Company (and previously, the Predecessor) considers all highly liquid investments with maturities of three months or less when purchased to be cash equivalents.
Accounts Receivable and Allowance for Doubtful Accounts
Accounts receivable of the Company and the Predecessor primarily consist of customer accounts receivable. The accounts receivable are due from a diverse base including companies in the petroleum industry, airlines and the federal government. The allowance for doubtful accounts is reviewed quarterly for collectability. All other customer receivables are recorded at the invoiced amounts and generally do not bear interest. Account balances for these customer receivables are charged directly to bad debt expense when it becomes probable the receivable will not be collected. The allowance for doubtful accounts was less than $0.1 million as of December 31, 2010.
The Predecessor’s accounts receivable also include proprietary credit card receivables. The Predecessor’s allowance for doubtful accounts includes the best estimate of the amount of probable
F-33
Table of Contents
Index to Financial Statements
credit losses in the Company’s proprietary credit card receivables. The allowance for doubtful accounts related to these receivables is based on historical write-off experience and the volume of proprietary credit card sales. The allowance for doubtful accounts was $0.3 million as of December 31, 2009.
Inventories
Inventories are carried at the lower of cost or market value. Cost of inventories is determined primarily under the last-in, first-out (“LIFO”) method. However, the Company (and previously, the Predecessor) maintains some inventories whose cost is primarily determined using the first-in, first-out method. The Refining segment has a LIFO pool for crude oil and refinery feedstocks and a separate LIFO pool for refined products.
The Retail segment has separate LIFO pools for refined products, beer and wine, cigarettes, soft drinks and general merchandise. The LIFO values for each pool are maintained at the store level through the allocation of LIFO costs based on the percentage of each store’s weighted moving average cost of inventory to the total weighted moving average inventory cost for the items in each LIFO pool.
Property, Plant and Equipment
Property, plant and equipment is recorded at cost and depreciated on a straight-line basis over the estimated useful lives of the assets. Such assets are reviewed for impairment whenever events or changes in circumstances indicate that the carrying amount of an asset may not be recoverable. If the sum of the expected undiscounted future cash flows from the use of the asset and its eventual disposition is less than the carrying amount of the asset, an impairment loss is recognized based on the fair value of the asset.
When property, plant and equipment depreciated on an individual basis are sold or otherwise disposed of, any gains or losses are reported in net income. Gains on the disposal of property, plant and equipment are recognized when earned, which is generally at the time of closing. If a loss on disposal is expected, such losses are generally recognized when the assets are classified as held for sale.
Expenditures for routine maintenance and repair costs are expensed when incurred. Refinery process units require periodic major maintenance and repairs that are commonly referred to as “turnarounds.” The required frequency of the maintenance varies by unit, but generally is every two to six years depending on the processing unit involved. Turnaround costs are expensed as incurred.
Internal-Use Software Development Costs
The Company capitalizes certain external and internal computer software costs incurred during the application development stage. The application development stage generally includes software design and configuration, coding, testing and installation activities. Training and maintenance costs are expensed as incurred, while upgrades and enhancements are capitalized if it is probable that such expenditures will result in additional functionality. Capitalized software costs are depreciated over the estimated useful life of the underlying project on a straight-line basis, generally not exceeding five years.
Goodwill
The Predecessor’s goodwill represents the excess of the purchase price over the estimated fair value of the net assets acquired in the acquisition of a business. Goodwill was allocated to the Retail segment based on the percentage of the Retail Segment’s store count to Speedway’s total store count at June 30, 2005. Such goodwill was not amortized, but rather was tested for impairment annually and
F-34
Table of Contents
Index to Financial Statements
when events or changes in circumstances indicated that the fair value of a reporting unit with goodwill has been reduced below carrying value. The fair value of the reporting unit is determined and compared to the book value. If the fair value is less than the book value, including goodwill, then the recorded goodwill is reduced to its implied fair value with a charge to operating expense.
In connection with the Acquisition, further described in Note 4, a new accounting basis was established for the Company as of the acquisition date based upon the fair value of the underlying net assets acquired and liabilities assumed. As a result of the Acquisition, a bargain purchase gain was recorded and there is no goodwill as of December 31, 2010.
Intangible Assets
Intangible assets primarily include a retail marketing trade name and franchise agreements. These assets have an indefinite life and therefore are not amortized, but rather are tested for impairment annually and when events or changes in circumstances indicate that the fair value of the intangible asset has been reduced below carrying value.
Financing Costs
Financing origination fees are deferred and classified within other assets on the consolidated balance sheet. Amortization is provided on a straight-line basis over the term of the agreement, which approximates the effective interest method.
Derivative Financial Instruments
The Company (and previously, the Predecessor) is exposed to earnings and cash flow volatility based on the timing and change in refined product prices versus crude oil prices. To manage these risks, the Company uses derivative instruments associated with the purchase or sale of crude oil and refined products. Crack spread option contracts are used to hedge the volatility of refining margins. The Company also may use futures contracts to manage price risks associated with inventory quantities above or below target levels. The Company does not enter into derivative contracts for speculative purposes. All derivative instruments are recorded in the consolidated balance sheet at fair value and are classified depending on the maturity date of the underlying contracts. Changes in the fair value of its contracts are accounted for by marking them to market and recognizing any resulting gains or losses in its statements of operations. These gains or losses are reported within operating activities on the consolidated statement of cash flows.
Environmental Costs
Environmental expenditures are capitalized if the costs mitigate or prevent future contamination or if the costs improve environmental safety or efficiency of the existing assets. The Company (and previously, the Predecessor) provides for remediation costs and penalties when the responsibility to remediate is probable and the amount of associated costs can be reasonably estimated. The timing of remediation accruals coincides with completion of a feasibility study or the commitment to a formal plan of action. Remediation liabilities are accrued based on estimates of known environmental exposure and are discounted when the estimated amounts are reasonably fixed and determinable. If recoveries of remediation costs from third parties are probable, a receivable is recorded and is discounted when the estimated amount is reasonably fixed and determinable.
Asset Retirement Obligations
The fair value of asset retirement obligations is recognized in the period in which the obligations are incurred if a reasonable estimate of fair value can be made. Conditional asset retirement
F-35
Table of Contents
Index to Financial Statements
obligations for removal and disposal of fire-retardant material from certain refining assets have been recognized. The amounts recorded for such obligations are based on the most probable current cost projections. Asset retirement obligations have not been recognized for the removal of materials and equipment from or the closure of certain refinery, pipeline, terminal and retail marketing assets because the fair value cannot be reasonably estimated since the settlement dates of the obligations are indeterminable.
Current inflation rates and credit-adjusted-risk-free interest rates are used to estimate the fair value of asset retirement obligations. Depreciation of capitalized asset retirement costs and accretion of asset retirement obligations are recorded over time. Depreciation is determined on a straight-line basis, while accretion escalates over the lives of the assets.
Employee Benefit Plans
The Predecessor’s employees participated in various employee benefit plans of Marathon. These plans include qualified, non-contributory defined benefit retirement plans, employee savings plans, employee and retiree medical and life insurance plans, dental plans and other such benefits. For the purposes of the combined financial statements, the Predecessor was considered to be participating in multi-employer benefit plans of Marathon. As a participant in multi-employer benefit plans, the Predecessor recognized as expense in each period the required allocations from Marathon, and it did not recognize any employee benefit plan liabilities.
Subsequent to the Acquisition, the majority of the Predecessor’s employees still participate in the employee benefit plans of Marathon under a transition services agreement. See Note 4 for a further description of this transition services agreement. Any employee not covered under an employee benefit plan of Marathon participates in medical and life insurance plans, dental plans and other such benefits sponsored by the Company.
Stock-Based Compensation
The Company recognizes compensation expense for stock-based awards issued over the requisite service period for each separately vesting tranche, as if multiple awards were granted. Stock-based compensation costs are measured at the date of grant, based on the fair value of the award. Stock-based compensation expense recognized was $0.1 million, $0.3 million, $0.3 million and $0.3 million for the Successor Period ended December 31, 2010, eleven months ended November 30, 2010, and years ended December 31, 2009 and 2008, respectively.
Net Investment
The net investment represents a net balance reflecting Marathon’s initial investment in the Predecessor and subsequent adjustments resulting from the operations of the Predecessor and various transactions between the Predecessor and Marathon. The balance is the result of the Predecessor’s participation in Marathon’s centralized cash management programs under which the Predecessor’s cash receipts were remitted to and all cash disbursements were funded by Marathon. Other transactions affecting the net investment include general, administrative and overhead costs incurred by Marathon that are allocated to the Predecessor. There are no terms of settlement or interest charges associated with the net investment balance.
Comprehensive Income
The Company and the Predecessor have reported no comprehensive income due to the absence of items of other comprehensive income in the periods presented.
F-36
Table of Contents
Index to Financial Statements
Concentrations of Risk
The Predecessor is exposed to related party risk as a portion of both sales revenues and costs are derived from transactions with Marathon Oil’s subsidiaries and affiliates. Sales to related parties for eleven months ended November 30, 2010 and for the years ended December 31, 2009 and 2008 were 7%, 7% and 11%, respectively, of total sales. For the eleven months ended November 30, 2010 and for the years ended December 31, 2009 and 2008 purchases from related parties were 45%, 45% and 48% of total costs and expenses, respectively.
The Company (and previously, the Predecessor) is exposed to credit risk in the event of nonpayment by customers. The creditworthiness of customers is subject to continuing review. No single non-related party customer accounts for more than 10% of annual revenues.
Crude oil is the principal raw material for the Company and the majority of the crude oil processed is delivered to the refinery through a pipeline that is owned by MN PL LLC, a related party. A prolonged disruption of that pipeline’s operations would materially impact the Company’s ability to economically obtain raw materials.
The Company (and previously, the Predecessor) is exposed to concentrated geographical risk as most of its operations are conducted in certain states.
Reclassifications
Certain reclassifications have been made to the predecessor’s financial information in order to conform to the Company’s current presentation.
Accounting Developments
Variable interest accounting standards were amended by the FASB in June 2009. The new accounting standards replace the existing quantitative-based risks and rewards calculation for determining which enterprise has a controlling financial interest in a variable interest entity with an approach focused on identifying which enterprise has the power to direct the activities of a variable interest entity. In addition, the concept of qualifying special-purpose entities has been eliminated and therefore, will now be evaluated for consolidation in accordance with the applicable consolidation guidance. Ongoing assessments of whether an enterprise is the primary beneficiary of a variable interest entity are also required. The amended variable interest accounting standard requires reconsideration for determining whether an entity is a variable interest entity when changes in facts and circumstances occur such that the holders of the equity investment at risk, as a group, lack the power from voting rights or similar rights to direct the activities of the entity. Enhanced disclosures are required for any enterprise that holds a variable interest in a variable interest entity. Application was prospective beginning in the first quarter of 2010, and for all interim and annual periods thereafter. The adoption of this standard did not have a significant impact on the consolidated and combined results of operations, financial position or cash flows.
A standard to improve disclosures about fair value measurements was issued by the FASB in January 2010. The additional disclosures required include: (1) the different classes of assets and liabilities measured at fair value, (2) the significant inputs and techniques used to measure Level 2 and Level 3 assets and liabilities for both recurring and nonrecurring fair value measurements, (3) the gross presentation of purchases, sales, issuances and settlements for Level 3 roll forward of activity, and (4) the transfers in and out of Levels 1 and 2. The new disclosures are effective for interim and annual reporting periods beginning after December 15, 2009, except for the gross presentation of purchases, sales, issuances, and settlements for Level 3 roll forward of activity. Those disclosures are effective for
F-37
Table of Contents
Index to Financial Statements
fiscal years beginning after December 15, 2010, and for interim periods thereafter. The adoption of this guidance did not have a material impact on our results of operations, financial condition because it provides enhanced disclosure requirements only.
3. RELATED PARTY TRANSACTIONS
The Investors which include affiliates of ACON Investments, L.L.C. and TPG Capital L.P. are related parties of the Company. MN PL LLC is also a related party of the Company. During the Successor Period, the Company had no direct purchases from MN PL LLC.
Related parties for the Predecessor include the following:
| Ÿ | Marathon Oil Company (“MOC”), which is a wholly owned subsidiary of Marathon Oil. MOC purchases or produces crude oil in the United States that is used at MPC’s refineries. |
| Ÿ | MPC LP, which changed its name from Marathon Petroleum Company LLC on October 1, 2010, was a wholly owned subsidiary of Marathon Oil. MPC LP refines, markets and transports crude oil and petroleum products, primarily in the Midwest, Upper Great Plains, Gulf Coast and southwestern regions of the United States. |
| Ÿ | Marathon Petroleum Company Canada, Ltd. (“MPC Canada”), which was a wholly owned subsidiary of MPC LP. MPC Canada purchases crude oil in Canada to be used at MPC LP’s refineries. |
| Ÿ | Marathon Petroleum Trading Canada LLC (“MP Trading Canada”), which was a wholly owned subsidiary of MPC LP. MP Trading Canada purchases crude oil in Canada to be used at MPC LP’s refineries. |
| Ÿ | MN PL LLC, in which MPC owned (and now the Company owns) a 17% interest. MN PL LLC owns and operates a crude oil pipeline running from Clearbrook, Minnesota to Pine Bend, Minnesota. |
| Ÿ | Pilot Travel Centers LLC (“PTC”), in which MPC sold its 50% interest in October 2008. PTC owns and operates travel centers in the United States. |
| Ÿ | Speedway, which changed its name from Speedway SuperAmerica LLC on February 15, 2011, was a wholly owned subsidiary of Marathon Oil. Under the Predecessor, Speedway was the owner of the SuperAmerica branded convenience stores that were sold to NTR as part of the Acquisition. |
Predecessor revenues from related parties were as follows:
| Predecessor | ||||||||||||
| (in millions) |
Eleven Months Ended November 30, 2010 |
Year Ended December 31, 2009 |
Year Ended December 31, 2008 |
|||||||||
| MPC LP |
$ | 210.1 | $ | 216.7 | $ | 396.9 | ||||||
| PTC |
— | — | 37.3 | |||||||||
|
|
|
|
|
|
|
|||||||
| Total |
$ | 210.1 | $ | 216.7 | $ | 434.2 | ||||||
|
|
|
|
|
|
|
|||||||
Related party sales to MPC LP and PTC consisted primarily of sales of refined products. Refined product sales to MPC LP were recorded at intercompany transfer prices that are market-based prices. Sales to PTC were recorded based on contractual prices that were market-based.
F-38
Table of Contents
Index to Financial Statements
Predecessor purchases from related parties were as follows:
| Predecessor | ||||||||||||
| (in millions) |
Eleven Months Ended November 30, 2010 |
Year Ended December 31, 2009 |
Year Ended December 31, 2008 |
|||||||||
| MOC |
$ | 276.9 | $ | 155.6 | $ | 162.9 | ||||||
| MPC LP |
67.5 | 64.2 | 92.1 | |||||||||
| MPC Canada |
— | — | 1,627.2 | |||||||||
| MP Trading Canada |
992.3 | 1,027.7 | — | |||||||||
| MN PL LLC |
25.3 | 26.4 | 16.3 | |||||||||
| Speedway |
16.3 | 16.4 | 15.4 | |||||||||
|
|
|
|
|
|
|
|||||||
| Total |
$ | 1,378.3 | $ | 1,290.3 | $ | 1,913.9 | ||||||
|
|
|
|
|
|
|
|||||||
Related party purchases from MOC, MPC LP Canada and MP Trading Canada consisted primarily of crude oil. Purchases from MOC were recorded at contracted prices that were market-based. Purchases from MPC Canada and MP Trading Canada were recorded at contracted prices based on MPC Canada’s and MP Trading Canada’s acquisition cost, plus an administrative fee. Related party purchases from MPC LP consisted primarily of purchases of refined products and refinery feedstocks, certain general and administrative costs, and costs associated with the Refining segment participating in MPC LP’s multi-employer benefit plans. Refined product and refinery feedstock purchases from MPC LP were recorded at intercompany transfer prices that were market-based prices. Related party purchases from MN PL LLC consisted primarily of crude oil transportation services which were based on published tariffs. Related party purchases from Speedway consisted of certain overhead costs and costs associated with the Retail segment participating in Speedway’s multi-employer benefit plans.
MPC LP and Speedway provided certain services to the Predecessor such as marketing, crude acquisition, engineering, human resources, insurance, treasury, accounting, tax, legal, procurement and information technology services. Charges for these services were allocated based on usage or other methods, such as headcount, capital employed or store count, which management believes to be reasonable. Related party purchases reflect charges for these services of $26.5 million, $29.1 million and $30.7 million for the eleven months ended November 30, 2010 and the years ended December 31, 2009 and 2008, respectively. The allocation methods included in the combined income statements were consistently applied.
The Predecessor participated in MPC LP and Speedway’s centralized cash management programs under which cash receipts are remitted to and cash disbursements are funded by MPC LP or Speedway. All intercompany activity associated with the transfer of cash is included in the net investment value.
For the purposes of the combined financial statements, the Predecessor was considered to participate in multi-employer benefit plans of MPC LP and Speedway. The Predecessor’s allocated share of MPC LP and Speedway’s employee benefit plan expenses, including costs related to stock-based compensation plans, is included in related party purchases and was $21.5 million, $20.3 million and $17.9 million for the eleven months ended November 30, 2010 and the years ended December 31, 2009 and 2008, respectively. Expenses for employee benefit plans other than stock-based compensation plans are allocated to the Predecessor primarily as a percentage of salary and wage expense. For the stock-based compensation plans, the Predecessor was charged with the expenses directly attributed to its employees which were $0.3 million for the eleven months ended November 30, 2010 as well as for the years ended December 31, 2009 and 2008, respectively.
Related party receivables from MPC LP were $5.8 million at December 31, 2009.
F-39
Table of Contents
Index to Financial Statements
Predecessor payables to related parties were as follows at December 31, 2009:
| Predecessor | ||||
| (in millions) |
December 31, 2009 |
|||
| MOC |
$ | 17.5 | ||
| MPC LP |
0.3 | |||
| MP Trading Canada |
101.0 | |||
| MN PL LLC |
1.6 | |||
|
|
|
|||
| Total |
$ | 120.4 | ||
|
|
|
|||
For the Predecessor, related party payables to MOC, MPC Canada and MP Trading Canada were based on contractual terms, which are comparable to those with unrelated third parties. Related party payables to MPC LP were based on standard purchase terms for refined products and refinery feedstocks. Related party payables to MN PL LLC were based on published tariffs from MN PL LLC. For purposes of the combined financial statements, obligations to MPC LP and Speedway related to general and administrative expense, overhead and benefit allocations were included as a component of the net investment.
The Predecessor distributed $0.1 million of property, plant and equipment to MPC LP and Speedway in 2009. MPC LP and Speedway contributed $0.6 million and $0.2 million of property, plant, and equipment to the Predecessor for the eleven months ended November 30, 2010 and the year ended December 31, 2008, respectively.
Upon completion of the Acquisition, the Company entered into a management services agreement with the Investors pursuant to which they provide the Company with ongoing management, advisory and consulting services. The Investors also receive quarterly management fees equal to 1% of NTE’s “Adjusted EBITDA” (as defined in the agreement) for the previous quarter (subject to a minimum annual fee of $2 million), as well as reimbursements for out-of pocket expenses incurred by them in connection with providing such management services. The Company also pays the Investors’ specified success fees in connection with advice they provide in relation with certain corporate transactions. For the Successor Period ended December 31, 2010, the Company incurred fees of $9.6 million related to these services. Of this amount, $7.9 million related to financing origination fees which have been classified in other assets on the consolidated balance sheet and $1.7 million related to expenses which have been classified in formation costs on the consolidated income statement.
4. ACQUISITION
As previously described in Note 1, effective December 1, 2010, the Company acquired the Predecessor business from Marathon for $608 million. Included in this amount is the estimated fair value of earn-out payments of $54 million. Of the $608 million purchase price, $361 million was paid in cash as of December 31, 2010 and $80 million was satisfied by issuing Marathon a perpetual payment in kind preferred interest in NT Holdings. The residual purchase price ($113 million plus the $54 million earn-out) remains unpaid as of December 31, 2010. The residual price excluding the earn-out must be paid within ninety days of the Acquisition.
The Company will be required to pay Marathon the earn-out payments if the Company’s Adjusted EBITDA (as defined in the agreement, the “Agreement Adjusted EBITDA”) exceeds $165 million less, among other things, any rental expense related to the real estate lease arrangement (described below) during any year in each of the next eight years following the Acquisition. Agreement Adjusted EBITDA adjusts for, among other items, (i) any unrealized gains or losses relating to derivative activities, (ii) any gains or losses generated by the liquidation of any LIFO inventory layers, (iii) any losses related to
F-40
Table of Contents
Index to Financial Statements
lower of cost or market inventory adjustments, and (iv) any gains on the sale of property, plant or equipment and certain other assets. Marathon will receive 40% of the amount by which Agreement Adjusted EBITDA exceeds the specified threshold in any year during the eight years following the Acquisition not to exceed $125 million over the eight years following the Acquisition. The Acquisition agreement also includes a margin support component that requires Marathon to pay the Company up to $30 million per year to the extent the Agreement Adjusted EBITDA is below $145 million less, among other things, any rental expense related to the real estate lease arrangement (described below), in either of the first two twelve month periods ending November 30, 2011 or 2012 up to a maximum of $60 million. Any such payments made by Marathon will increase the amount that we may be required to pay Marathon over the earn-out period.
The cash component of the purchase price along with acquisition related costs was financed by an approximate $200 million cash investment by the Investors and aggregate borrowings of $290 million. See Note 11 for a description of the Company’s financing arrangements.
Concurrent with the Acquisition, the following transactions also occurred:
| Ÿ | Certain Marathon assets (including real property interests and land related to 135 of the SuperAmerica convenience stores and the SuperMom’s bakery) were sold to a third party equity real estate investment trust. In connection with the closing of the Acquisition, the Company is leasing these properties from the real estate investment trust on a long-term basis. |
| Ÿ | A third-party purchased substantially all of the crude oil inventory associated with operations of the refinery directly from Marathon. |
The Acquisition was accounted for by the purchase method of accounting for business combinations. The excess of the estimated fair value of the net assets acquired over total purchase consideration was recorded as an estimated bargain purchase gain of approximately $51.4 million in the Successor Period ended December 31, 2010. This gain was a result of the market dynamics from the time the purchase price was agreed upon compared to the market as of the closing date of the Acquisition.
The accompanying consolidated financial statements as of and for the Successor Period ended December 31, 2010 include the following preliminary fair value allocation of the purchase of the net assets acquired:
| (in millions) |
||||
| Total consideration |
$ | 608.0 | ||
| Allocation of consideration: |
||||
| Store cash acquired |
0.6 | |||
| Inventory |
195.0 | |||
| Property, plant and equipment |
385.0 | |||
| MN PL LLC investment |
93.0 | |||
| MPLI investment |
7.0 | |||
| Intangible assets |
35.4 | |||
| Margin support contract |
17.3 | |||
| Derivative liability |
(40.9 | ) | ||
| Lease financing obligation |
(24.5 | ) | ||
| Other, net |
(8.5 | ) | ||
|
|
|
|||
| Bargain purchase gain |
$ | (51.4 | ) | |
|
|
|
|||
F-41
Table of Contents
Index to Financial Statements
At this time, the valuations and other studies needed to provide a final basis for estimating the fair value of the net assets acquired have been completed.
Subsequent to the Acquisition, Marathon has agreed to provide the Company with administrative and support services pursuant to a transition services agreement, including finance and accounting, human resources, and information systems services, as well as support services generally for a period of up to eighteen months in connection with the transition from being a part of Marathon’s systems and infrastructure to having its own systems and infrastructure. The transition services agreement requires the Company to pay Marathon for the provision of the transition services, as well as to reimburse Marathon for compensation paid to Marathon employees providing such transition services. In addition, under the agreement, Marathon will provide support services for the operation of the refining and retail business segments, using the employees that are ultimately expected to be transitioned to the Company. The Company is obligated to reimburse Marathon for the compensation paid to Marathon employees providing such operations services, plus the agreed burden rates. Marathon is obligated to provide these services to the Company for twelve months from the Acquisition date, but the services may be extended for up to eighteen months. The transition services agreement may be terminated by a mutual agreement of the parties, and the Company or Marathon may also unilaterally terminate the agreement upon a material breach by the other party. For the Successor Period ended December, 31, 2010, the Company has recognized expenses of $2.9 million related to administrative and support services. The Company also has paid $6.7 million as of December 31, 2010 that will be amortized during 2011 as these services are incurred.
5. INCOME TAXES
For the period subsequent to the Acquisition, the Company is a pass through entity for federal income tax purposes. As a result, there are no federal income taxes incurred. For the Successor Period ended December 31, 2010, the Company incurred state income taxes of less than $0.1 million.
For all periods prior to the Acquisition, the taxable results of the Predecessor were included in the consolidated U.S. federal and various state and local tax returns of Marathon Oil. Also, in certain state, local and foreign jurisdictions, the Predecessor filed on a stand-alone basis. The tax provisions and related balance sheet disclosures for the period prior to the closing of the Acquisition have been prepared assuming the Predecessor was a stand-alone taxpayer for the periods presented.
F-42
Table of Contents
Index to Financial Statements
The components of the Predecessor’s income tax provision are as follows:
| Predecessor | ||||||||||||
| (in millions) |
Eleven Months Ended November 30, 2010 |
Year Ended December 31, 2009 |
Year Ended December 31, 2008 |
|||||||||
| Income Tax Provision |
||||||||||||
| Federal |
||||||||||||
| Current |
$ | 51.2 | $ | 25.9 | $ | 22.5 | ||||||
| Deferred |
(0.6 | ) | 0.4 | 7.6 | ||||||||
|
|
|
|
|
|
|
|||||||
| $ | 50.6 | $ | 26.3 | $ | 30.1 | |||||||
| State and local |
||||||||||||
| Current |
$ | 16.7 | $ | 8.4 | $ | 7.3 | ||||||
| Deferred |
(0.2 | ) | 0.1 | 2.4 | ||||||||
|
|
|
|
|
|
|
|||||||
| $ | 16.5 | $ | 8.5 | $ | 9.7 | |||||||
| Total |
||||||||||||
| Current |
$ | 67.9 | $ | 34.3 | $ | 29.8 | ||||||
| Deferred |
(0.8 | ) | 0.5 | 10.0 | ||||||||
|
|
|
|
|
|
|
|||||||
| $ | 67.1 | $ | 34.8 | $ | 39.8 | |||||||
|
|
|
|
|
|
|
|||||||
follows:
A reconciliation of the federal statutory income tax rate (35%) for the Predecessor applied to income before income taxes to the provision for income taxes is as follows:
| Predecessor | ||||||||||||
| (in millions) |
Eleven Months Ended November 30, 2010 |
Year Ended December 31, 2009 |
Year Ended December 31, 2008 |
|||||||||
| Statutory rate applied to income before taxes |
$ | 44.8 | $ | 31.3 | $ | 34.4 | ||||||
| State and local income taxes, net of federal income tax effects |
10.7 | 5.5 | 6.3 | |||||||||
| Domestic manufacturing deduction |
(2.6 | ) | (1.2 | ) | (1.0 | ) | ||||||
| Valuation allowance for capital loss carryforward |
14.3 | — | — | |||||||||
| Dividend received deduction |
(0.2 | ) | (0.9 | ) | — | |||||||
| Other, net |
0.1 | 0.1 | 0.1 | |||||||||
|
|
|
|
|
|
|
|||||||
| Actual income tax provision |
$ | 67.1 | $ | 34.8 | $ | 39.8 | ||||||
|
|
|
|
|
|
|
|||||||
As further described in Note 10, net income for the eleven months ended November 30, 2010 included unrealized losses of $40.9 million related to derivative instruments held as of November 30, 2010. For income tax purposes, MPC must classify gains and losses on these instruments as capital gains and losses. These capital losses may only be deducted for tax purposes to the extent of capital gains. For the purposes of the combined financial statements, management believes it is more likely than not that the Predecessor will not generate sufficient future capital gains to realize the capital losses. As such, a valuation allowance has been provided for the full value of the tax benefits related to these unrealized losses.
F-43
Table of Contents
Index to Financial Statements
Deferred tax assets and liabilities resulted from the following:
| Predecessor | ||||
| (in millions) |
December 31, 2009 |
|||
| Deferred tax assets: |
||||
| Employee benefits |
$ | 3.6 | ||
| Other |
0.3 | |||
|
|
|
|||
| Total deferred tax assets |
$ | 3.9 | ||
|
|
|
|||
| Deferred tax liabilities: |
||||
| Property, plant and equipment |
53.1 | |||
| Inventories |
33.1 | |||
| Investments in affiliates |
6.5 | |||
|
|
|
|||
| Total deferred tax liabilities |
$ | 92.7 | ||
|
|
|
|||
| Net deferred tax liabilities |
$ | 88.8 | ||
|
|
|
|||
The results of Speedway, SuperMom’s LLC and MNPL LLC were included in the income tax returns of MPC LP prior to January, 2010. Beginning in 2010, the activity of these businesses was included in Marathon Oil’s income tax returns. MPC LP and Marathon Oil are continuously undergoing examination of its U.S. federal income tax returns by the Internal Revenue Service. Such audits have been completed through the 2007 tax year. MPC LP and Marathon Oil believe they have made adequate provision for federal income taxes and interest which may become payable for years not yet settled. Further, MPC LP and Marathon Oil are routinely involved in Minnesota tax audits. MPC LP and Marathon Oil believe all other audits will be resolved within the amounts paid and/or provided for these liabilities.
The Company (and previously, the Predecessor) follows the provisions of ASC 740 related to accounting for uncertainties in income taxes. No unrecognized tax benefits are recorded by the Company as of December 31, 2010 or the Predecessor as of December 31, 2009.
6. INVENTORIES
| Successor | Predecessor | |||||||||
| (in millions) |
December 31, 2010 |
December 31, 2009 |
||||||||
| Crude oil and refinery feedstocks |
$ | 24.3 | $ | 48.6 | ||||||
| Refined products |
102.7 | 61.1 | ||||||||
| Merchandise |
14.8 | 10.1 | ||||||||
| Supplies and sundry items |
14.6 | 14.2 | ||||||||
|
|
|
|
|
|||||||
| Total |
$ | 156.4 | $ | 134.0 | ||||||
|
|
|
|
|
|||||||
The LIFO method accounted for 90% and 87% of total inventory value at December 31, 2010 and 2009, respectively. Current acquisition costs were estimated to exceed the LIFO inventory value at December 31, 2010 and 2009 by $2.1 million and $120.3 million, respectively. As a result of LIFO inventory liquidations, cost of sales decreased and income from operations increased by $2.1 million, $2.1 million, $1.7 million and $7.9 million for the Successor Period ended December 31, 2010, the eleven months ended November 30, 2010, and the years ended December 31, 2009 and 2008, respectively.
F-44
Table of Contents
Index to Financial Statements
7. EQUITY METHOD INVESTMENT
The Company (and previously, the Predecessor) has a 17% common interest in MN PL LLC. The carrying value of this equity method investment was $92.4 million and $88.0 million at December 31, 2010 and 2009, respectively.
Summarized financial information for MN PL LLC is as follows:
| Successor | Predecessor | |||||||||||||||||
| (in millions) |
August 10, 2010 (inception date) to December 31, 2010 |
Eleven Months Ended November 30, 2010 |
Year Ended December 31, 2009 |
Year Ended December 31, 2008 |
||||||||||||||
| Revenues |
$ | 8.7 | $ | 101.6 | $ | 101.5 | $ | 58.0 | ||||||||||
| Operating costs and expenses |
7.4 | 36.8 | 55.6 | 41.5 | ||||||||||||||
| Income from operations |
1.3 | 42.4 | 18.4 | 4.2 | ||||||||||||||
| Net income |
1.3 | 42.4 | 18.4 | 4.4 | ||||||||||||||
| Net income (loss) available to common shareholders |
0.5 | 33.6 | 8.7 | (5.3 | ) | |||||||||||||
| Successor | Predecessor | |||||||||
| (in millions) |
December 31, 2010 |
December 31, 2009 |
||||||||
| Balance sheet data: |
||||||||||
| Current assets |
$ | 8.0 | $ | 16.2 | ||||||
| Noncurrent assets |
507.6 | 524.3 | ||||||||
|
|
|
|
|
|||||||
| Total assets |
$ | 515.6 | $ | 540.5 | ||||||
|
|
|
|
|
|||||||
| Current liabilities |
$ | 13.8 | $ | 25.9 | ||||||
| Noncurrent liabilities |
0.2 | — | ||||||||
|
|
|
|
|
|||||||
| Total liabilities |
$ | 14.0 | $ | 25.9 | ||||||
|
|
|
|
|
|||||||
| Members capital |
$ | 501.6 | $ | 514.6 | ||||||
|
|
|
|
|
|||||||
As of December 31, 2010 and 2009, the carrying amount of the equity method investment was $7.1 million and $9.0 million higher than the underlying net assets of the investee, respectively. The Company is amortizing this difference over the remaining life of MN PL LLC’s primary asset.
Distributions received from MN PL LLC were $0.7 million for the Successor Period ended December 31, 2010, $6.0 million for the eleven months ended November 30, 2010 and $1.4 million for the year ended December 31, 2009. There were no distributions in 2008.
F-45
Table of Contents
Index to Financial Statements
8. PROPERTY, PLANT AND EQUIPMENT
Major classes of property, plant and equipment (“PP&E”) consisted of the following:
| Successor | Predecessor | |||||||||||||||||
| (in millions) | Estimated Useful Lives |
December 31, 2010 |
Estimated Useful Lives |
December 31, 2009 |
||||||||||||||
| Land |
$ | 8.7 | $ | 58.0 | ||||||||||||||
| Retail stores and equipment |
2 - 22 years | 61.2 | 3 - 15 years | 226.3 | ||||||||||||||
| Refinery and equipment |
5 - 24 years | 271.2 | 15 - 20 years | 551.6 | ||||||||||||||
| Other equipment |
2 - 7 years | 1.8 | 4 - 25 years | 26.8 | ||||||||||||||
| Precious metals |
10.5 | 1.6 | ||||||||||||||||
| Assets under construction |
35.1 | 31.9 | ||||||||||||||||
|
|
|
|
|
|||||||||||||||
| 388.5 | 896.2 | |||||||||||||||||
| Less: accumulated depreciation |
2.2 | 522.4 | ||||||||||||||||
|
|
|
|
|
|||||||||||||||
| Property, plant and equipment, net |
$ | 386.3 | $ | 373.8 | ||||||||||||||
|
|
|
|
|
|||||||||||||||
PP&E included gross assets acquired under capital leases of $12.5 million and $8.5 million with related amounts in accumulated depreciation and amortization of less than $0.1 million and $4.1 million at December 31, 2010 and 2009, respectively.
9. GOODWILL AND OTHER INTANGIBLE ASSETS
As of December 31, 2009, the goodwill in the Retail segment and Refining segment amounted to $11.4 million and $0.3 million, respectively. Goodwill was tested annually for impairment in the fourth quarter of each year, or sooner, if events occurred or circumstances changed that would more likely than not reduce the fair value of a reporting unit below the carrying value as indications of impairment existed. No impairment in the carrying value of goodwill was identified. As part of the Acquisition purchase price allocation, no value was ascribed to goodwill.
Predecessor intangible assets (excluding goodwill) primarily include a retail marketing trade name and franchise rights which in total amounted to $6.6 million at December 31, 2009. Intangible assets (excluding goodwill) were ascribed value as a result of the Acquisition and are comprised of franchise rights amounting to $19.8 million and trademarks amounting to $15.6 million as of December 31, 2010. These assets have an indefinite life and therefore are not amortized, but rather are tested for impairment annually or sooner if events or changes in circumstances indicate that the fair value of the intangible asset has been reduced below carrying value.
10. DERIVATIVES
The Company is subject to crude oil and refined product market price fluctuations caused by supply conditions, weather, economic conditions and other factors. In October 2010, at the request of the Company, MPC initiated a crack spread derivative strategy to mitigate market price risk on a portion of the business’ 2011 and 2012 projected refinery production. In connection with the Acquisition, derivative instruments executed pursuant to this strategy, along with all corresponding rights and obligations, were assumed by the Company.
Under the crack spread derivative strategy, the Company agrees to buy or sell an amount equal to a fixed price times a certain number of barrels, and to buy or sell in return an amount equal to a specified variable price times the same amount of barrels. Physical volumes are not exchanged and these contracts are net settled with cash. The crack spread derivatives are not being accounted for as
F-46
Table of Contents
Index to Financial Statements
hedges for financial reporting purposes. The Company recognizes all derivative instruments as either assets or liabilities at fair value on the balance sheet and any related net gain or loss is recorded as a gain or loss in the derivative activity caption on the consolidated and combined statements of income. Observable quoted prices for similar assets or liabilities in active markets (Level 2 as described in Note 13) are considered to determine the fair values for the purposes of marking to market the derivative instruments at each period end. At December 31, 2010, the Company had open commodity derivative instruments consisting of crude oil futures and refined product swaps on 35 million barrels primarily to protect the value of refining margins through 2012.
For the Successor Period ended December 31, 2010 and for the eleven months ended November 30, 2010, there were unrealized losses related to derivative activities of $27.1 million and $40.9 million, respectively.
The following table summarizes the fair value amounts of the Company’s derivative instruments by location on the balance sheet for the Successor Period ended December 31, 2010:
| Successor | ||||||
| (in millions) | Balance Sheet Classification |
December 31, 2010 | ||||
| Derivatives not designated as hedges: |
||||||
| Crack spread derivative contracts |
Derivative liability (current) | $ | 45.6 | |||
| Crack spread derivative contracts |
Derivative liability (non-current) | 22.4 | ||||
|
|
|
|||||
| $ | 68.0 | |||||
|
|
|
|||||
The Company can be exposed to credit risk in the event of nonperformance by its counterparty on these derivative instruments. The counterparty is a large financial institution with a credit rating of at least A- by Standard and Poor’s and A1 by Moody’s. In the event of default, the Company would potentially be subject to losses on a derivative instrument’s mark-to-market gains. The Company does not expect nonperformance on any of its derivative instruments.
The Company has provided letters of credit under its asset-based revolving credit facility (as discussed in Note 11) to the counterparty on these derivative instruments. Any outstanding collateral is released to the Company upon settlement of the related derivative instrument.
11. DEBT
In connection with the Acquisition, NTE entered into various financing arrangements including $290.0 million of 10.50% Senior Secured Notes due December 1, 2017 (“Secured Notes”) and a $300 million secured asset-based revolving credit facility (“ABL Facility”).
Secured Notes
The Secured Notes are guaranteed, jointly and severally, on a senior secured basis by all of the NTE’s existing and future direct and indirect subsidiaries; however, not on a full and unconditional basis as a result of subsidiaries being able to be released as guarantors under certain customary circumstances for such arrangements. A subsidiary guarantee can be released under customary circumstances, including (a) the sale of the subsidiary, (b) the subsidiary is declared “unrestricted,” (c) the legal or covenant defeasance or satisfaction and discharge of the indenture, or (d) liquidation or dissolution of the subsidiary. Separate condensed consolidating financial information is not included as NTE does not have independent assets or operations.
F-47
Table of Contents
Index to Financial Statements
NTE is required to make interest payments on June 1 and December 1 of each year, commencing on June 1, 2011. There are no scheduled principal payments required prior to the notes maturing on December 1, 2017. Borrowings bear interest at 10.50%.
At any time prior to the maturity date of the notes, NTE may, at its option, redeem all or any portion of the notes for the outstanding principal amount plus unpaid interest and a make-whole premium as defined in the indenture. If NTE experiences a change in control or makes certain assets dispositions, as defined under the indenture, NTE may be required to repurchase all or part of the notes plus unpaid interest and in certain cases pay a redemption premium.
The Secured Notes contain a number of covenants that, among other things, restrict, subject to certain exceptions, NTE and the ability of its subsidiaries to sell or otherwise dispose of assets, including capital stock of subsidiaries, incur additional indebtedness or issue preferred stock, repay other indebtedness, pay dividends and distributions or repurchase capital stock, create liens on assets, make investments, loans or advances, make certain acquisitions, engage in mergers or consolidations, engage in certain transactions with affiliates, change the business conducted by itself and its subsidiaries, and enter into agreements that restrict dividends from restricted subsidiaries.
ABL Facility
The ABL Facility provides for revolving credit financing through December 1, 2015 in an aggregate principal amount of up to $300 million (of which $150 million may be utilized for the issuance of letters of credit and up to $30 million may be short-term borrowings upon same-day notice, referred to as swingline loans) and may be increased up to a maximum aggregate principal amount of $400 million, subject to borrowing base availability. Availability under the ABL Facility at any time will be the lesser of (a) the aggregate commitments under the ABL Facility or (b) the borrowing base, less any outstanding borrowings and letters of credit. The borrowing base is calculated based on a percentage of eligible accounts receivable, petroleum inventory and other assets.
Borrowings under the ABL Facility bear interest, at NTE’s option, at either (a) an alternative base rate, plus an applicable margin (ranging between 1.75% and 2.25%) or (b) a LIBOR rate plus applicable margin (ranging between 2.75% and 3.25%). The alternate base rate is the greater of (a) the prime rate, (b) the Federal Funds Effective rate plus 50 basis points, or (c) one-month LIBOR rate plus 100 basis points and a spread of up to 225 basis points based upon percentage utilization of this facility. In addition to paying interest on outstanding borrowings, NTE is also required to pay an annual commitment fee ranging from 0.375% to 0.625% and letter of credit fees.
As of December 31, 2010, the availability under the ABL Facility was $118 million. This availability is net of $52 million in outstanding letters of credit. NTE had no borrowings under the ABL Facility at December 31, 2010.
The ABL Facility has a minimum fixed charge coverage ratio financial covenant requirement of at least 1.0 to 1.0. The covenant is operative when NTE’s availability under the facility is less than the greater of (a) 15% of the lesser of the $300 million commitment amount or the borrowing base or (b) $22.5 million.
The ABL Facility also contains a number of covenants that, among other things, restrict, subject to certain exceptions, the ability of NTE and its subsidiaries to sell or otherwise dispose of assets, incur additional indebtedness or issue preferred stock, pay dividends and distributions or repurchase capital stock, create liens on assets, make investments, loans or advances, make certain acquisitions, engage in mergers or consolidations, and engage in certain transactions with affiliates.
F-48
Table of Contents
Index to Financial Statements
12. NONCONTROLLING PREFERRED INTEREST IN SUBSIDIARY
As part of the Acquisition, Marathon was issued an $80 million perpetual payment-in-kind preferred interest in NT Holdings, a wholly owned subsidiary of the Company. The preferred interest must be redeemed upon the occurrence of certain events which may not necessarily be in the control of the Company. As such, the preferred interest has been classified outside of permanent equity.
The preferred interest has a 9% annual dividend. To the extent that dividends are not paid, the dividend increases the redemption value of the preferred interest. During the successor period ended December 31, 2010, NT Holdings accrued $0.6 million of dividends which increased the redemption value of the preferred interest.
13. FAIR VALUE MEASUREMENTS
As defined in accounting guidance, fair value is the price that would be received to sell an asset or paid to transfer a liability in an orderly transaction between market participants at the measurement date. Accounting guidance describes three approaches to measuring the fair value of assets and liabilities: the market approach, the income approach and the cost approach, each of which includes multiple valuation techniques. The market approach uses prices and other relevant information generated by market transactions involving identical or comparable assets or liabilities. The income approach uses valuation techniques to measure fair value by converting future amounts, such as cash flows or earnings, into a single present value amount using current market expectations about those future amounts. The cost approach is based on the amount that would currently be required to replace the service capacity of an asset. This is often referred to as current replacement cost. The cost approach assumes that the fair value would not exceed what it would cost a market participant to acquire or construct a substitute asset of comparable utility, adjusted for obsolescence.
Accounting guidance does not prescribe which valuation technique should be used when measuring fair value and does not prioritize among the techniques. Accounting guidance establishes a fair value hierarchy that prioritizes the inputs used in applying the various valuation techniques. Inputs broadly refer to the assumptions that market participants use to make pricing decisions, including assumptions about risk. Level 1 inputs are given the highest priority in the fair value hierarchy while Level 3 inputs are given the lowest priority. The three levels of the fair value hierarchy are as follows.
| Ÿ | Level 1—Observable inputs that reflect unadjusted quoted prices for identical assets or liabilities in active markets as of the reporting date. Active markets are those in which transactions for the asset or liability occur in sufficient frequency and volume to provide pricing information on an ongoing basis. |
| Ÿ | Level 2—Observable market-based inputs or unobservable inputs that are corroborated by market data. These are inputs other than quoted prices in active markets included in Level 1, which are either directly or indirectly observable as of the reporting date. |
| Ÿ | Level 3—Unobservable inputs that are not corroborated by market data and may be used with internally developed methodologies that result in management’s best estimate of fair value. |
The Company uses a market or income approach for recurring fair value measurements and endeavors to use the best information available. Accordingly, valuation techniques that maximize the use of observable inputs are favored. The assessment of the significance of a particular input to the fair value measurement requires judgment and may affect the placement of assets and liabilities within the levels of the fair value hierarchy.
The Company’s current assets and liabilities accounts contain certain financial instruments, the most significant of which are trade accounts receivables, trade payables and payables to related
F-49
Table of Contents
Index to Financial Statements
parties (in the case of the Predecessor). The Company believes the carrying values of its current assets and liabilities approximate fair value. The Company’s fair value assessment incorporates a variety of considerations, including the short-term duration of the instruments, and the Company’s historical incurrence of and expected future insignificant bad debt expense, which includes an evaluation of counterparty credit risk.
The following table provides the assets and liabilities carried at fair value measured on a recurring basis at December 31, 2010:
| (in millions) | Balance at December 31, 2010 |
Quoted prices in active markets (Level 1) |
Significant other observable inputs (Level 2) |
Unobservable inputs (Level 3) |
||||||||||||
| ASSETS |
||||||||||||||||
| Cash and cash equivalents |
$ | 74.3 | $ | 74.3 | $ | — | $ | — | ||||||||
| Other assets |
||||||||||||||||
| Contingent consideration—margin support |
17.3 | — | — | 17.3 | ||||||||||||
|
|
|
|
|
|
|
|
|
|||||||||
| $ | 91.6 | $ | 74.3 | $ | — | $ | 17.3 | |||||||||
|
|
|
|
|
|
|
|
|
|||||||||
| LIABILITIES |
||||||||||||||||
| Derivative liability—current |
$ | 45.6 | $ | — | $ | 45.6 | $ | — | ||||||||
| Derivative liability—long-term |
22.4 | — | 22.4 | — | ||||||||||||
| Other liabilities |
||||||||||||||||
| Contingent consideration—earn-out |
53.8 | — | — | 53.8 | ||||||||||||
|
|
|
|
|
|
|
|
|
|||||||||
| $ | 121.8 | $ | — | $ | 68.0 | $ | 53.8 | |||||||||
|
|
|
|
|
|
|
|
|
|||||||||
As of December 31, 2009, there were no assets and liabilities carried at fair value measured on a recurring basis beyond cash and cash equivalents which amounted to $6.0 million.
The Company determines the fair value of its contingent consideration arrangements (margin support and earn-out) based on a probability-weighted income approach derived from financial performance estimates. The impact of changes in the fair value of these arrangements will be recorded in the statement of income. There were no changes in fair value from the date of the Acquisition through December 31, 2010.
Assets not recorded at fair value on a recurring basis, such as property, plant and equipment, intangible assets and cost method investments are recognized at fair value when they are impaired. The Company recorded assets acquired and liabilities assumed in the Acquisition at fair value.
The carrying value of debt, which is reported on the Company’s consolidated balance sheets, reflects the cash proceeds received upon its issuance, net of subsequent repayments. The fair value of the Secured Notes disclosed below was determined based on quoted prices in active markets.
| Successor | Predecessor | |||||||||||||||||
| December 31, 2010 |
December 31, 2009 |
|||||||||||||||||
| (in millions) | Carrying Amount |
Fair Value |
Carrying Amount |
Fair Value |
||||||||||||||
| Secured Notes |
$ | 290.0 | $ | 299.4 | $ | — | $ | — | ||||||||||
F-50
Table of Contents
Index to Financial Statements
14. ASSET RETIREMENT OBLIGATIONS
The following table summarizes the changes in asset retirement obligations:
| Successor | Predecessor | |||||||||||
| (in millions) |
Successor Period Ended December 31, 2010 |
Eleven Months Ended November 30, 2010 |
Year Ended December 31, 2009 |
|||||||||
| Asset retirement obligation balance at beginning of period |
$ | 2.1 | $ | 3.3 | $ | 3.3 | ||||||
| Revisions of previous estimates |
— | — | (0.1 | ) | ||||||||
| Accretion expense (included in depreciation and amortization) |
— | 0.2 | 0.2 | |||||||||
| Liabilities settled |
— | (0.1 | ) | (0.1 | ) | |||||||
|
|
|
|
|
|
|
|||||||
| Asset retirement obligation balance at end of period |
$ | 2.1 | $ | 3.4 | $ | 3.3 | ||||||
|
|
|
|
|
|
|
|||||||
As a result of the Acquisition, the asset retirement obligation of the Predecessor was adjusted to a fair value of $2.1 million. Accretion expense for the Successor Period ended December 31, 2010 was less than $0.1 million.
15. STOCK-BASED COMPENSATION
An indirect parent of the Company sponsors an equity participation plan which provides for the grant of profit interest units to certain employees of the Company. The plan has reserved approximately 29 million units for issuance under the plan. The exercise price for a unit shall not be less than 100% of the fair market value of our equity units on the date of grant. Units vest in annual installments over a period of five years after the date of grant and expire ten years after the date of grant.
During the Successor Period ended December 31, 2010, 22.7 million units were granted under the equity participation plan at a weighted average exercise price of $1.78. The estimated weighted average fair value of these grants was $0.30 per unit based upon the following assumptions:
| Expected life (years) |
6.5 | |||
| Expected volatility |
40.6 | % | ||
| Expected dividend yield |
0.0 | % | ||
| Risk-free interest rate |
2.7 | % |
The weighted average expected life for the 2010 grants are calculated using the simplified method, which defines the expected life as the average of the contractual term of the options and the weighted average vesting period. Expected volatility for the 2010 grants is based primarily on the historical volatility of a representative group of peer companies for a period consistent with the expected life of the awards.
For the Successor Period ended December 31, 2010, the Company recognized $0.1 million of compensation cost related to profit interest units. As of December 31, 2010, the total unrecognized compensation cost for profit interest units was $6.8 million. This non-cash expense will be recognized on a straight line basis through 2015.
F-51
Table of Contents
Index to Financial Statements
16. SUPPLEMENTAL CASH FLOW INFORMATION
Supplemental cash flow information is as follows:
| Successor | Predecessor | |||||||||||||||||
| (in millions) |
August 10, 2010 (inception date) to December 31, 2010 |
Eleven Months Ended November 30, 2010 |
Year Ended December 31, 2009 |
Year Ended December 31, 2008 |
||||||||||||||
| Net cash from operating activities included: |
||||||||||||||||||
| Interest paid |
$ | — | $ | — | $ | — | $ | 0.2 | ||||||||||
| Income taxes paid through MPC LP and Speedway |
— | 67.9 | 34.3 | 29.8 | ||||||||||||||
| Noncash investing and financing activities include: |
||||||||||||||||||
| Capital expenditures included in accounts payable |
$ | 0.9 | $ | 1.3 | $ | 1.7 | $ | 7.4 | ||||||||||
| PP&E capitalized in sale leaseback transaction |
24.5 | — | — | — | ||||||||||||||
| PP&E contributions by (distributions to) Marathon |
— | 0.6 | (0.1 | ) | 0.2 | |||||||||||||
| Acquisition consideration funded by Investors |
80.0 | — | — | — | ||||||||||||||
17. LEASING ARRANGEMENTS
As described in Note 4, concurrent with the Acquisition, certain Marathon assets (including real property interests and land related to 135 of the SuperAmerica convenience stores and a bakery store) were sold to a third party equity real estate investment trust. In connection with the closing of the Acquisition, the Company has assumed the leasing of these properties from the real estate investment trust on a long-term basis.
In accordance with ASC 840-40, the Company has determined that it has a continuing involvement for a portion of these property interests due to potential environmental obligations or due to subleasing arrangements. For these respective properties, the fair value of the assets and the related financing obligation will remain on the Company’s consolidated balance sheet until the end of the lease term or until the continuing involvement is resolved. The assets are included in property, plant and equipment and are being depreciated over their remaining useful lives. The lease payments relating to these property interests are recognized as interest expense.
The remaining properties sold to the third party real estate investment trust are treated as operating leases. The Company (and previously, the Predecessor) also leases a variety of facilities and equipment under other operating leases, including land and building space, office equipment, vehicles, rail tracks for storage of rail tank cars near the refinery and numerous rail tank cars.
F-52
Table of Contents
Index to Financial Statements
Future minimum commitments for operating lease obligations having initial or remaining non-cancelable lease terms in excess of one year are as follows:
| (in millions) |
||||
| 2011 |
$ | 22.4 | ||
| 2012 |
19.7 | |||
| 2013 |
19.4 | |||
| 2014 |
19.1 | |||
| 2015 |
18.7 | |||
| Thereafter |
183.3 | |||
|
|
|
|||
| Total noncancelable operating lease payments |
$ | 282.6 | ||
|
|
|
|||
Rental expense was $2.2 million, $5.3 million, $5.2 million and $5.1 million for the Successor Period ended December 31, 2010, eleven month period ended November 30, 2010, and for the years ended December 31, 2009 and 2008, respectively. Rental expense includes operating leases with initial or remaining non-cancelable terms of less than one year.
18. CONTINGENCIES AND COMMITMENTS
The Company and the Predecessor are the subject of, or party to, contingencies and commitments involving a variety of matters. Certain of these matters are discussed below. The ultimate resolution of these contingencies could, individually or in the aggregate, be material to the Company’s consolidated and combined financial statements. However, management believes that the Company will remain a viable and competitive enterprise even though it is possible that these contingencies could be resolved unfavorably.
Contingent Consideration
As described in Note 4, the Acquisition provides for contingent consideration, or earn-out payments, that could result in additional payments of up to a total of $125 million to Marathon over an eight year period ending December 1, 2018 based on operating performance. See Note 13 for additional information relating to the fair value of contingent arrangements related to the Acquisition.
Environmental Matters
The Company and the Predecessor are subject to federal, state, local and foreign laws and regulations relating to the environment. These laws generally provide for control of pollutants released into the environment and require responsible parties to undertake remediation of hazardous waste disposal sites. Penalties may be imposed for noncompliance. At December 31, 2010 and 2009, liabilities for remediation totaled $3.5 million and $3.4 million, respectively. These liabilities are expected to be settled over at least the next 10 years and are not discounted since the amounts are not reasonably fixed and determinable. It is not presently possible to estimate the ultimate amount of all remediation costs that might be incurred or the penalties that may be imposed. Furthermore, environmental remediation costs may vary from estimates because of changes in laws, regulations and their interpretation; additional information on the extent and nature of site contamination; and improvements in technology. Receivables for recoverable costs from the state, under programs to assist companies in clean-up efforts related to underground storage tanks at retail marketing outlets, were $0.2 million and $0.6 million at December 31, 2010 and 2009, respectively.
F-53
Table of Contents
Index to Financial Statements
Franchise Agreements
In the normal course of its business, SAF enters into ten year license agreements with the operators of franchised SuperAmerica brand retail outlets. These agreements obligate SAF or its affiliates to provide certain services including information technology support, maintenance, credit card processing and signage for specified monthly fees.
Guarantees
Over the years, the Predecessor has sold various assets in the normal course of business. Certain of the related agreements contain performance and general guarantees, including guarantees regarding inaccuracies in representations, warranties, covenants and agreements, and environmental and general indemnifications that require the Predecessor to perform upon the occurrence of a triggering event or condition. These guarantees and indemnifications are part of the normal course of selling assets. The Company has assumed these guarantees and indemnifications upon the Acquisition. However, in certain cases, Marathon has also provided an indemnification in favor of the Company.
The Company is not typically able to calculate the maximum potential amount of future payments that could be made under such contractual provisions because of the variability inherent in the guarantees and indemnities. Most often, the nature of the guarantees and indemnities is such that there is no appropriate method for quantifying the exposure because the underlying triggering event has little or no past experience upon which a reasonable prediction of the outcome can be based. The Company is not currently making any payments relating to such guarantees or indemnifications.
Contract Commitments
At December 31, 2010 and 2009, the Company’s and the Predecessor’s contractual commitments to acquire property, plant and equipment totaled $3.3 million and $4.1 million, respectively.
19. SEGMENT INFORMATION
The Company has two reportable operating segments: Refining and Retail. Each of these segments is organized and managed based upon the nature of the products and services they offer. The segment disclosures reflect management’s current organizational structure.
| Ÿ | Refining—operates the St. Paul Park, Minnesota, refinery, terminal and related assets, including the Company’s interest in MPLI and MN PL LLC, and |
| Ÿ | Retail—operates 166 convenience stores primarily in Minnesota and Wisconsin. The Retail segment also includes the operations of NTB and SAF. |
The Company’s interests in MPLI and MNPL LLC were previously presented within the “Other” segment by the Predecessor. Additionally, the Company has changed how they present certain sales to franchisees. All Predecessor period information has been recast to conform to the current Successor presentation.
F-54
Table of Contents
Index to Financial Statements
Operating results for the Company’s operating segments are as follows:
| (in millions) |
||||||||||||||||
| Refining | Retail | Other | Total | |||||||||||||
| Successor Period ended December 31, 2010 |
||||||||||||||||
| Revenues |
||||||||||||||||
| Customer |
$ | 242.0 | $ | 102.9 | $ | — | $ | 344.9 | ||||||||
| Intersegment |
70.2 | — | — | 70.2 | ||||||||||||
|
|
|
|
|
|
|
|
|
|||||||||
| Segment revenues |
312.2 | 102.9 | — | 415.1 | ||||||||||||
| Elimination of intersegment revenues |
— | — | (70.2 | ) | (70.2 | ) | ||||||||||
|
|
|
|
|
|
|
|
|
|||||||||
| Total revenues |
$ | 312.2 | $ | 102.9 | $ | (70.2 | ) | $ | 344.9 | |||||||
|
|
|
|
|
|
|
|
|
|||||||||
| Operating income |
$ | 9.1 | $ | 0.5 | $ | (26.6 | ) | $ | (17.0 | ) | ||||||
| Income from equity method investment |
$ | 0.1 | $ | — | $ | — | $ | 0.1 | ||||||||
| Depreciation and amortization |
$ | 1.7 | $ | 0.5 | $ | — | $ | 2.2 | ||||||||
| Capital expenditures |
$ | 2.5 | $ | — | $ | — | $ | 2.5 | ||||||||
| (in millions) |
||||||||||||||||
| Refining | Retail | Other | Total | |||||||||||||
| Eleven months ended November 30, 2010 (Predecessor) |
||||||||||||||||
| Revenues |
||||||||||||||||
| Customer |
$ | 1,778.3 | $ | 1,206.8 | $ | — | $ | 2,985.1 | ||||||||
| Intersegment |
811.4 | — | — | 811.4 | ||||||||||||
| Related parties |
210.1 | — | — | 210.1 | ||||||||||||
|
|
|
|
|
|
|
|
|
|||||||||
| Segment revenues |
2,799.8 | 1,206.8 | — | 4,006.6 | ||||||||||||
| Elimination of intersegment revenues |
— | — | (811.4 | ) | (811.4 | ) | ||||||||||
|
|
|
|
|
|
|
|
|
|||||||||
| Total revenues |
$ | 2,799.8 | $ | 1,206.8 | $ | (811.4 | ) | $ | 3,195.2 | |||||||
|
|
|
|
|
|
|
|
|
|||||||||
| Operating income |
$ | 142.8 | $ | 26.5 | $ | — | $ | 169.3 | ||||||||
| Income from equity method investment |
$ | 5.4 | $ | — | $ | — | $ | 5.4 | ||||||||
| Depreciation and amortization |
$ | 24.9 | $ | 12.4 | $ | — | $ | 37.3 | ||||||||
| Capital expenditures |
$ | 29.4 | $ | 0.4 | $ | — | $ | 29.8 | ||||||||
| (in millions) |
||||||||||||||||
| Refining | Retail | Other | Total | |||||||||||||
| Year ended December 31, 2009 (Predecessor) |
||||||||||||||||
| Revenues |
||||||||||||||||
| Customer |
$ | 1,594.6 | $ | 1,129.2 | $ | — | $ | 2,723.8 | ||||||||
| Intersegment |
719.4 | — | — | 719.4 | ||||||||||||
| Related parties |
216.7 | — | — | 216.7 | ||||||||||||
|
|
|
|
|
|
|
|
|
|||||||||
| Segment revenues |
2,530.7 | 1,129.2 | — | 3,659.9 | ||||||||||||
| Elimination of intersegment revenues |
— | — | (719.4 | ) | (719.4 | ) | ||||||||||
|
|
|
|
|
|
|
|
|
|||||||||
| Total revenues |
$ | 2,530.7 | $ | 1,129.2 | $ | (719.4 | ) | $ | 2,940.5 | |||||||
|
|
|
|
|
|
|
|
|
|||||||||
| Operating income |
$ | 70.6 | $ | 19.3 | $ | — | $ | 89.9 | ||||||||
| Income from equity method investment |
$ | 1.1 | $ | — | $ | — | $ | 1.1 | ||||||||
| Depreciation and amortization |
$ | 26.0 | $ | 14.2 | $ | — | $ | 40.2 | ||||||||
| Capital expenditures |
$ | 26.1 | $ | 2.9 | $ | — | $ | 29.0 | ||||||||
F-55
Table of Contents
Index to Financial Statements
| (in millions) |
||||||||||||||||
| Refining | Retail | Other | Total | |||||||||||||
| Year ended December 31, 2008 (Predecessor) |
||||||||||||||||
| Revenues |
||||||||||||||||
| Customer |
$ | 2,285.5 | $ | 1,402.7 | $ | — | $ | 3,688.2 | ||||||||
| Intersegment |
999.5 | — | — | 999.5 | ||||||||||||
| Related parties |
434.2 | — | — | 434.2 | ||||||||||||
|
|
|
|
|
|
|
|
|
|||||||||
| Segment revenues |
3,719.2 | 1,402.7 | — | 5,121.9 | ||||||||||||
| Elimination of intersegment revenues |
— | — | (999.5 | ) | (999.5 | ) | ||||||||||
|
|
|
|
|
|
|
|
|
|||||||||
| Total revenues |
$ | 3,719.2 | $ | 1,402.7 | $ | (999.5 | ) | $ | 4,122.4 | |||||||
|
|
|
|
|
|
|
|
|
|||||||||
| Operating income |
$ | 77.7 | $ | 21.2 | $ | — | $ | 98.9 | ||||||||
| Loss from equity method investment |
$ | (1.2 | ) | $ | — | $ | — | $ | (1.2 | ) | ||||||
| Depreciation and amortization |
$ | 24.4 | $ | 14.8 | $ | — | $ | 39.2 | ||||||||
| Capital expenditures |
$ | 41.1 | $ | 3.9 | $ | — | $ | 45.0 | ||||||||
Intersegment sales from the Refining segment to the Retail segment consist primarily of sales of refined products which are recorded based on contractual prices that are market based. Revenues from external customers are nearly all in the United States.
Total assets by segment were as follows:
| Refining | Retail | Other | Total | |||||||||||||
| (in millions) |
||||||||||||||||
| At December 31, 2010 (Successor) |
||||||||||||||||
| Segment and other assets |
$ | 667.7 | $ | 136.7 | $ | 153.6 | $ | 958.0 | ||||||||
| Elimination of intersegment assets |
— | — | (25.9 | ) | (25.9 | ) | ||||||||||
|
|
|
|
|
|
|
|
|
|||||||||
| Total assets |
$ | 667.7 | $ | 136.7 | $ | 127.7 | $ | 932.1 | ||||||||
|
|
|
|
|
|
|
|
|
|||||||||
| At December 31, 2009 (Predecessor) |
||||||||||||||||
| Segment and other assets |
$ | 567.1 | $ | 164.9 | $ | — | $ | 732.0 | ||||||||
| Elimination of intersegment assets |
— | — | (21.9 | ) | (21.9 | ) | ||||||||||
|
|
|
|
|
|
|
|
|
|||||||||
| Total assets |
$ | 567.1 | $ | 164.9 | $ | (21.9 | ) | $ | 710.1 | |||||||
|
|
|
|
|
|
|
|
|
|||||||||
All plant, property and equipment are located in the United States.
F-56
Table of Contents
Index to Financial Statements
GLOSSARY OF INDUSTRY TERMS USED IN THIS PROSPECTUS
The terms defined in this section are used throughout this prospectus:
“3:2:1 crack spread” represents the approximate refining margin resulting from processing three barrels of crude oil to produce two barrels of gasoline and one barrel of distillate;
“Barrel” refers to common unit of measure in the oil industry, which equates to 42 gallons;
“Barrels per stream day” as defined by the EIA, represents the maximum number of barrels of input that a distillation facility can process within a 24-hour period when running at full capacity under optimal crude and product slate conditions with no allowance for downtime.
“Blendstocks” refers to various compounds that are combined with gasoline or diesel from the crude oil refining process to make finished gasoline and diesel; these may include natural gasoline, fluid catalytic cracking unit or FCCU gasoline, ethanol, reformate or butane, among others;
“Bpd” refers to an abbreviation for barrels per calendar day, which is defined by the EIA as the amount of input that a distillation facility can process under usual operating conditions reduced for regular limitations that may delay, interrupt, or slow down production such as downtime due to such conditions as mechanical problems, repairs, and slowdowns;
“Catalyst” refers to a substance that alters, accelerates, or instigates chemical changes, but is neither produced, consumed nor altered in the process;
“Coke” refers to a coal-like substance that is produced during the refining process;
“Complexity” refers to the number, type and capacity of processing units at a refinery, measured by the Nelson index, which is often used as a measure of a refinery’s ability to process lower cost crude oils into higher value light refined products, including transportation fuels, such as gasoline and distillates;
“Crack spread” refers to a simplified calculation that measures the difference between the price for light products and crude oil;
“Distillates” refers to primarily diesel, kerosene and jet fuel;
“Ethanol” refers to a clear, colorless, flammable oxygenated hydrocarbon. Ethanol is typically produced chemically from ethylene, or biologically from fermentation of various sugars from carbohydrates found in agricultural crops and cellulosic residues from crops or wood. It is used in the United States as a gasoline octane enhancer and oxygenate;
“Feedstocks” refers to petroleum products, such as crude oil, that are processed and blended into refined products;
“Group 3 3:2:1 crack spread” refers to the 3:2:1 crack spread calculated using the market value of PADD II Group 3 conventional gasoline and ultra low sulfur diesel against the market value of NYMEX WTI;
“Light products” refers to the group of refined products with lower boiling temperatures, including gasoline and distillates;
“OSHA Recordable Rate” means the injury frequency rate reported by the Company to OSHA, which is equal to the number of recordable injures in a particular period multiplied by 200,000 and divided by the total hours worked in such period, including both employees and contractors;
A-1
Table of Contents
Index to Financial Statements
“PADD II” refers to the Petroleum Administration for Defense District II region of the United States, which covers the following states: Illinois, Indiana, Iowa, Kansas, Kentucky, Michigan, Minnesota, Missouri, Nebraska, North Dakota, South Dakota, Ohio, Oklahoma, Tennessee and Wisconsin;
“Refined products” refers to petroleum products, such as gasoline, diesel and jet fuel, which are produced by a refinery;
“Sour crude oil” refers to a crude oil that is relatively high in sulfur content, requiring additional processing to remove the sulfur. Sour crude oil is typically less expensive than sweet crude oil;
“Sweet crude oil” refers to a crude oil that is relatively low in sulfur content, requiring less processing to remove the sulfur. Sweet crude oil is typically more expensive than sour crude oil;
“Throughput” refers to the volume processed through a unit or a refinery;
“Turnaround” refers to a periodically required standard procedure to refurbish and maintain a refinery that involves the shutdown and inspection of major processing units and occurs every three to four years on industry average;
“Upper Great Plains” refers to a portion of PADD II region and includes Minnesota, North Dakota, South Dakota and Wisconsin;
“WTI” refers to West Texas Intermediate crude oil, a light, sweet crude oil, characterized by an American Petroleum Institute gravity, or API gravity, between 39 and 41 and a sulfur content of approximately 0.4 weight percent that is used as a benchmark for other crude oils; and
“Yield” refers to the percentage of refined products that is produced from crude oil and other feedstocks.
A-2
Table of Contents
Index to Financial Statements
Shares
Northern Tier Energy, Inc.
CLASS A COMMON STOCK
| Goldman, Sachs & Co. | ||||||||
| BofA Merrill Lynch | ||||||||
| Deutsche Bank Securities | ||||||||
| J.P. Morgan | ||||||||
| Macquarie Capital | ||||||||
Through and including , 2012 (the 25th day after the date of this prospectus), all dealers effecting transactions in these securities, whether or not participating in this offering, may be required to deliver a prospectus. This is in addition to a dealer’s obligation to deliver a prospectus when acting as an underwriter and with respect to an unsold allotment or subscription.
Table of Contents
Index to Financial Statements
Part II
INFORMATION NOT REQUIRED IN PROSPECTUS
ITEM 13. Other Expenses of Issuance and Distribution
The following table sets forth an itemized statement of the amounts of all expenses (excluding underwriting discounts and commissions) payable by us in connection with the registration of the Class A common stock offered hereby. With the exception of the registration fee, FINRA filing fee and NYSE listing fee), the amounts set forth below are estimates.
| SEC registration fee |
$ | 22,920 | ||
| FINRA filing fee |
20,500 | |||
| NYSE listing fee |
* | |||
| Accountants’ fees and expenses |
* | |||
| Legal fees and expenses |
* | |||
| Printing and engraving expenses |
* | |||
| Transfer agent and registrar fees |
3,500 | |||
| Miscellaneous |
* | |||
|
|
|
|||
| Total |
$ | * | ||
|
|
|
| * | To be provided by amendment. |
ITEM 14. Indemnification of Directors and Officers
Section 145(a) of the Delaware General Corporation Law provides, in general, that a corporation may indemnify any person who was or is a party or is threatened to be made a party to any threatened, pending, or completed action, suit, or proceeding, whether civil, criminal, administrative, or investigative (other than an action by or in the right of the corporation), because he or she is or was a director, officer, employee, or agent of the corporation, or is or was serving at the request of the corporation as a director, officer, employee, or agent of another corporation, partnership, joint venture, trust, or other enterprise, against expenses (including attorneys’ fees), judgments, fines, and amounts paid in settlement actually and reasonably incurred by the person in connection with such action, suit, or proceeding, if he or she acted in good faith and in a manner he or she reasonably believed to be in or not opposed to the best interests of the corporation and, with respect to any criminal action or proceeding, had no reasonable cause to believe his or her conduct was unlawful.
Section 145(b) of the Delaware General Corporation Law provides, in general, that a corporation may indemnify any person who was or is a party or is threatened to be made a party to any threatened, pending, or completed action or suit by or in the right of the corporation to procure a judgment in its favor because the person is or was a director, officer, employee, or agent of the corporation, or is or was serving at the request of the corporation as a director, officer, employee, or agent of another corporation, partnership, joint venture, trust, or other enterprise, against expenses (including attorneys’ fees) actually and reasonably incurred by the person in connection with the defense or settlement of such action or suit if he or she acted in good faith and in a manner he or she reasonably believed to be in or not opposed to the best interests of the corporation, except that no indemnification shall be made with respect to any claim, issue, or matter as to which he or she shall have been adjudged to be liable to the corporation unless and only to the extent that the Court of Chancery or other adjudicating court determines that, despite the adjudication of liability but in view of all of the circumstances of the case, he or she is fairly and reasonably entitled to indemnity for such expenses which the Court of Chancery or other adjudicating court shall deem proper.
II-1
Table of Contents
Index to Financial Statements
Section 145(e) of the Delaware General Corporation Law provides that expenses (including attorneys’ fees) incurred by an officer or director in defending any civil, criminal, administrative or investigative action, suit or proceeding may be paid by the corporation in advance of the final disposition of such action, suit or proceeding upon receipt of an undertaking by or on behalf of such director or officer to repay such amount if it shall ultimately be determined that such person is not entitled to be indemnified by the corporation as authorized by Section 145 of the Delaware General Corporation Law. Section 145(e) of the Delaware General Corporation Law further provides that such expenses (including attorneys’ fees) incurred by former directors and officers or other employees or agents of the corporation may be so paid upon such terms and conditions as the corporation deems appropriate.
Section 145(g) of the Delaware General Corporation Law provides, in general, that a corporation may purchase and maintain insurance on behalf of any person who is or was a director, officer, employee, or agent of the corporation, or is or was serving at the request of the corporation as a director, officer, employee, or agent of another corporation, partnership, joint venture, trust or other enterprise against any liability asserted against such person and incurred by such person in any such capacity, or arising out of his or her status as such, whether or not the corporation would have the power to indemnify the person against such liability under Section 145 of the Delaware General Corporation Law.
Our certificate of incorporation that will be in effect upon the closing of this offering will provide that we will indemnify and hold harmless, to the fullest extent permitted by the Delaware General Corporation Law, any person who was or is made or is threatened to be made a party or is otherwise involved in any threatened, pending or completed action, suit, or proceeding, whether civil, criminal, administrative, or investigative, by reason of the fact that he or she is or was one of our directors or officers or is or was serving at our request as a director or officer of another corporation, partnership, joint venture, trust or other enterprise. Our amended and restated bylaws that will be in effect upon the closing of this offering will further provide for the advancement of expenses to each of our officers and directors.
Our certificate of incorporation that will be in effect upon the closing of this offering will provide that, to the fullest extent permitted by the Delaware General Corporation Law, our directors shall not be personally liable to us or our stockholders for monetary damages for breach of fiduciary duty as a director. Under Section 102(b)(7) of the Delaware General Corporation Law, the personal liability of a director to the corporation or its stockholders for monetary damages for breach of fiduciary duty can be limited or eliminated except (1) for any breach of the director’s duty of loyalty to the corporation or its stockholders; (2) for acts or omissions not in good faith or which involve intentional misconduct or a knowing violation of law; (3) under Section 174 of the Delaware General Corporation Law (relating to unlawful payment of dividend or unlawful stock purchase or redemption); or (4) for any transaction from which the director derived an improper personal benefit.
We also intend to maintain a general liability insurance policy which covers certain liabilities of directors and officers of our company arising out of claims based on acts or omissions in their capacities as directors or officers, whether or not we would have the power to indemnify such person against such liability under the Delaware General Corporation Law or the provisions of our certificate of incorporation.
In connection with the sale of Class A common stock being registered hereby, we intend to enter into indemnification agreements with each of our directors and our executive officers. These agreements will provide that we will indemnify each of our directors and such officers to the fullest extent permitted by law and by our certificate of incorporation or bylaws.
II-2
Table of Contents
Index to Financial Statements
In any underwriting agreement we enter into in connection with the sale of Class A common stock being registered hereby, the underwriters will agree to indemnify, under certain conditions, us, our directors, our officers and persons who control us, within the meaning of the Securities Act, against certain liabilities.
ITEM 15. Recent Sales of Unregistered Securities
On October 24, 2011, Northern Tier Energy, Inc. issued 100 shares of common stock, par value $0.01 per share, to Northern Tier Investors, LLC for $1.00. The issuance of such shares of common stock was not registered under the Securities Act, because the shares were offered and sold in a transaction exempt from registration under Section 4(2) of the Securities Act.
ITEM 16. Exhibits and Financial Statement Schedules
| (a) | Exhibits |
| Exhibit |
Description | |||
| *1.1 | Form of Underwriting Agreement. | |||
| **2.1 | Formation Agreement, dated October 6, 2010, by and among Marathon Petroleum Company LP, Speedway SuperAmerica LLC and Northern Tier Investors LLC. | |||
| **2.2 | St. Paul Park Refining Co. LLC Contribution Agreement, dated October 6, 2010, by and among Marathon Petroleum Company LP, St. Paul Park Refining Co. LLC and Northern Tier Investors LLC. | |||
| **2.3 | Northern Tier Retail LLC Contribution Agreement, dated October 6, 2010, by and among Speedway SuperAmerica LLC, Northern Tier Retail LLC and Northern Tier Investors LLC. | |||
| **2.4 | Northern Tier Bakery LLC Contribution Agreement, dated October 6, 2010, by and among Speedway SuperAmerica LLC, SuperMom’s LLC, Northern Tier Retail LLC and Northern Tier Investors LLC. | |||
| *3.1 | Form of Amended and Restated Certificate of Incorporation of Northern Tier Energy, Inc. | |||
| *3.2 | Form of Amended and Restated Bylaws of Northern Tier Energy, Inc. | |||
| *4.1 | Form of Class A Common Stock Certificate. | |||
| **4.2 | Indenture, dated as of December 1, 2010, by and among Northern Tier Energy LLC, Northern Tier Finance Corporation, the subsidiary guarantors parties thereto and Deutsche Bank Trust Company Americas. | |||
| *5.1 | Opinion of Vinson & Elkins L.L.P. as to the legality of the securities being registered. | |||
| *10.1 | Form of Tax Receivable Agreement between Northern Tier Energy, Inc. and the persons named therein. | |||
| *10.2 | Form of Second Amended and Restated Limited Liability Company Agreement of Northern Tier Investors, LLC. | |||
| *10.3 | Form of Registration Rights and Shareholders’ Agreement. | |||
| **10.4 | Credit Agreement, dated December 1, 2010, by and among the financial institutions party thereto, J.P. Morgan Chase Bank, N.A., Bank of America, N.A., Macquarie Capital (USA) Inc., Royal Bank of Canada and SunTrust Bank, St. Paul Park Refining Co. LLC, Northern Tier Bakery LLC, Northern Tier Retail LLC, SuperAmerica Franchising LLC, Northern Tier Energy LLC and each other subsidiary of Northern Tier Energy LLC from time to time party thereto. | |||
II-3
Table of Contents
Index to Financial Statements
| Exhibit |
Description | |||
| **10.5 | Employment Agreement between Northern Tier Energy LLC and Mario Rodriguez. | |||
| **10.6 | Employment Agreement between Northern Tier Energy LLC and Hank Kuchta. | |||
| **10.7 | Offer Letter between Northern Tier Energy LLC and Neal Murphy, dated November 22, 2010. | |||
| **10.8 | Offer Letter between Northern Tier Energy LLC and Dave Bonczek, dated February 7, 2011. | |||
| **10.9 | NTI Management Company, L.P. Class C Profit Unit Grant between NTI GenPar LLC and Neal Murphy. | |||
| **10.10 | Limited Partnership Agreement of NTI Management Company, L.P. | |||
| 10.11 | Amended and Restated Management Services Agreement, dated as of January 1, 2012, by and among Northern Tier Energy, LLC, TPG VI Management, LLC and ACON Funds Management L.L.C. | |||
| **10.12 | Incentive Compensation Plan, Calendar Year 2011. | |||
| *10.13 | Form of Long-Term Incentive Plan of Northern Tier Energy, Inc. | |||
| *10.14 | Form of Indemnification Agreement between Northern Tier Energy, Inc. and each of the directors thereof. | |||
| *21.1 | List of subsidiaries of Northern Tier Energy, Inc. | |||
| 23.1 | Consent of PricewaterhouseCoopers LLP (pertaining to Northern Tier Investors, LLC). | |||
| 23.2 | Consent of PricewaterhouseCoopers LLP (pertaining to St. Paul Park Refinery and Retail Marketing Business). | |||
| *23.3 | Consent of Vinson & Elkins L.L.P. (included in Exhibit 5.1). | |||
| 24.1 | Power of Attorney (included on the signature page of the initial filing of this registration statement). | |||
| * | To be filed by amendment. |
| ** | Previously filed. |
ITEM 17. Undertakings
The undersigned registrant hereby undertakes to provide to the underwriters at the closing specified in the underwriting agreement certificates in such denominations and registered in such names as required by the underwriters to permit prompt delivery to each purchaser.
Insofar as indemnification for liabilities arising under the Securities Act may be permitted to directors, officers and controlling persons of the registrant pursuant to the foregoing provisions, or otherwise, the registrant has been advised that in the opinion of the Securities and Exchange Commission such indemnification is against public policy as expressed in the Securities Act and is, therefore, unenforceable. In the event that a claim for indemnification against such liabilities (other than the payment by the registrant of expenses incurred or paid by a director, officer or controlling person of the registrant in the successful defense of any action, suit or proceeding) is asserted by such director, officer or controlling person in connection with the securities being registered, the registrant will, unless in the opinion of its counsel the matter has been settled by controlling precedent, submit to a court of appropriate jurisdiction the question whether such indemnification by it is against public policy as expressed in the Securities Act and will be governed by the final adjudication of such issue.
II-4
Table of Contents
Index to Financial Statements
The undersigned registrant hereby undertakes that:
(1) For purposes of determining any liability under the Securities Act, the information omitted from the form of prospectus filed as part of this registration statement in reliance upon Rule 430A and contained in a form of prospectus filed by the registrant pursuant to Rule 424(b)(1) or (4) or 497(h) under the Securities Act shall be deemed to be part of this registration statement as of the time it was declared effective.
(2) For the purpose of determining any liability under the Securities Act, each post-effective amendment that contains a form of prospectus shall be deemed to be a new registration statement relating to the securities offered therein, and the offering of such securities at that time shall be deemed to be the initial bona fide offering thereof.
II-5
Table of Contents
Index to Financial Statements
SIGNATURES
Pursuant to the requirements of the Securities Act of 1933, the registrant has duly caused this Registration Statement to be signed on its behalf by the undersigned, thereunto duly authorized, in the City of Ridgefield, State of Connecticut, on February 10, 2012.
| NORTHERN TIER ENERGY, INC. | ||
| By: |
/S/ PETER T. GELFMAN | |
| Peter T. Gelfman | ||
| Vice President, General Counsel and Secretary | ||
Pursuant to the requirements of the Securities Act of 1933, as amended, this Registration Statement has been signed below by the following persons in the capacities and the dates indicated.
| Signature |
Title |
Date | ||
| * Mario E. Rodriguez |
Chief Executive Officer and Director (Principal Executive Officer) |
February 10, 2012 | ||
| * David Bonczek |
Chief Financial Officer (Principal Financial Officer and Principal Accounting Officer) |
February 10, 2012 | ||
| * |
President, Chief Operating Officer and Director |
February 10, 2012 | ||
| Hank Kutcha | ||||
| * |
Director and Chairman of the Board |
February 10, 2012 | ||
| Dan F. Smith | ||||
| * |
Director |
February 10, 2012 | ||
| Bernard W. Aronson | ||||
| * |
Director |
February 10, 2012 | ||
| Jonathan Ginns | ||||
| * |
Director |
February 10, 2012 | ||
| Thomas Hofmann | ||||
| * |
Director |
February 10, 2012 | ||
| Scott D. Josey | ||||
| * |
Director |
February 10, 2012 | ||
| Eric Liaw | ||||
| * |
Director |
February 10, 2012 | ||
| Michael MacDougall | ||||
| *By: |
/s/ Peter T. Gelfman | |
|
| ||
| Peter T. Gelfman | ||
| Attorney-in-Fact | ||
II-6
Table of Contents
Index to Financial Statements
INDEX TO EXHIBITS
| Exhibit |
Description | |||
| *1.1 | Form of Underwriting Agreement. | |||
| **2.1 | Formation Agreement, dated October 6, 2010, by and among Marathon Petroleum Company LP, Speedway SuperAmerica LLC and Northern Tier Investors LLC. | |||
| **2.2 | St. Paul Park Refining Co. LLC Contribution Agreement, dated October 6, 2010, by and among Marathon Petroleum Company LP, St. Paul Park Refining Co. LLC and Northern Tier Investors LLC. | |||
| **2.3 | Northern Tier Retail LLC Contribution Agreement, dated October 6, 2010, by and among Speedway SuperAmerica LLC, Northern Tier Retail LLC and Northern Tier Investors LLC. | |||
| **2.4 | Northern Tier Bakery LLC Contribution Agreement, dated October 6, 2010, by and among Speedway SuperAmerica LLC, SuperMom’s LLC, Northern Tier Retail LLC and Northern Tier Investors LLC. | |||
| *3.1 | Form of Amended and Restated Certificate of Incorporation of Northern Tier Energy, Inc. | |||
| *3.2 | Form of Amended and Restated Bylaws of Northern Tier Energy, Inc. | |||
| *4.1 | Form of Class A Common Stock Certificate. | |||
| **4.2 | Indenture, dated as of December 1, 2010, by and among Northern Tier Energy LLC, Northern Tier Finance Corporation, the subsidiary guarantors parties thereto and Deutsche Bank Trust Company Americas. | |||
| *5.1 | Opinion of Vinson & Elkins L.L.P. as to the legality of the securities being registered. | |||
| *10.1 | Form of Tax Receivable Agreement between Northern Tier Energy, Inc. and the persons named therein. | |||
| *10.2 | Form of Second Amended and Restated Limited Liability Company Agreement of Northern Tier Investors, LLC. | |||
| *10.3 | Form of Registration Rights and Shareholders’ Agreement. | |||
| **10.4 | Credit Agreement, dated December 1, 2010, by and among the financial institutions party thereto, J.P. Morgan Chase Bank, N.A., Bank of America, N.A., Macquarie Capital (USA) Inc., Royal Bank of Canada and SunTrust Bank, St. Paul Park Refining Co. LLC, Northern Tier Bakery LLC, Northern Tier Retail LLC, SuperAmerica Franchising LLC, Northern Tier Energy LLC and each other subsidiary of Northern Tier Energy LLC from time to time party thereto. | |||
| **10.5 | Employment Agreement between Northern Tier Energy LLC and Mario Rodriguez. | |||
| **10.6 | Employment Agreement between Northern Tier Energy LLC and Hank Kuchta. | |||
| **10.7 | Offer Letter between Northern Tier Energy LLC and Neal Murphy, dated November 22, 2010. | |||
| **10.8 | Offer Letter between Northern Tier Energy LLC and Dave Bonczek, dated February 7, 2011. | |||
| **10.9 | NTI Management Company, L.P. Class C Profit Unit Grant between NTI GenPar LLC and Neal Murphy. | |||
| **10.10 | Limited Partnership Agreement of NTI Management Company, L.P. | |||
| 10.11 | Amended and Restated Management Services Agreement, dated as of January 1, 2012, by and among Northern Tier Energy, LLC, TPG VI Management, LLC and ACON Funds Management L.L.C. | |||
II-7
Table of Contents
Index to Financial Statements
| Exhibit |
Description | |||
| *10.12 | Incentive Compensation Plan, Calendar Year 2011. | |||
| *10.13 | Form of Long-Term Incentive Plan of Northern Tier Energy, Inc. | |||
| *10.14 | Form of Indemnification Agreement between Northern Tier Energy, Inc. and each of the directors thereof. | |||
| *21.1 | List of subsidiaries of Northern Tier Energy, Inc. | |||
| 23.1 | Consent of PricewaterhouseCoopers LLP (pertaining to Northern Tier Investors, LLC). | |||
| 23.2 | Consent of PricewaterhouseCoopers LLP (pertaining to St. Paul Park Refinery and Retail Marketing Business). | |||
| *23.3 | Consent of Vinson & Elkins L.L.P. (included in Exhibit 5.1). | |||
| 24.1 | Power of Attorney (included on the signature page of the initial filing of this registration statement). | |||
| * | To be filed by amendment. |
| ** | Previously filed. |
II-8