Attached files
| file | filename |
|---|---|
| 8-K - FORM 8-K - LyondellBasell Industries N.V. | d297985d8k.htm |
| EX-99.1 - PRESS RELEASE - LyondellBasell Industries N.V. | d297985dex991.htm |
 Jim
Gallogly, Chief Executive Officer Karyn Ovelmen, Chief Financial Officer
Sergey Vasnetsov, SVP -
Strategic Planning and Transactions
Doug Pike, VP -
Investor Relations
February 10, 2012
Fourth-Quarter 2011 Earnings
Exhibit 99.2 |
 lyondellbasell.com
2
Fourth-Quarter 2011 Earnings
Information Related to Financial Measures
We have included EBITDA in this presentation, which is a non-GAAP measure, as we
believe that EBITDA is a measure commonly used by investors. However,
EBITDA, as presented herein, may not be comparable to a similarly titled
measure reported by other companies due to differences in the way the measure is calculated. For
purposes of this presentation, EBITDA for predecessor periods (prior to May 1, 2010)
means earnings before interest, taxes, depreciation, amortization and
restructuring costs, as adjusted for other items management does not believe
are indicative of the Company’s underlying results of operations such as impairment charges,
reorganization items, the effect of mark-to-market accounting on our warrants
and current cost inventory adjustments. EBITDA for successor periods (on or
after May 1, 2010) means earnings before interest, taxes, depreciation and
amortization, as adjusted for the same items, to the extent applicable in the successor periods.
EBITDA also includes dividends from joint ventures. EBITDA should not be
considered an alternative to profit or operating profit for any period as an
indicator of our performance, or as an alternative to operating cash flows as
a measure of our liquidity. See Table 9 of our accompanying earnings release
for reconciliations of EBITDA to net income.
While we also believe that net debt is a measure commonly used by investors, net
debt, as presented herein, may not be comparable to a similarly titled measure
reported by other companies due to differences in the way the measure is
calculated. For purposes of this presentation, net debt means short-term debt plus current maturities
of long-term debt plus long-term debt minus cash and cash equivalents and
minus restricted cash. In our predecessor period, we utilized a combination of
First In-First Out and Last In-First Out inventory methods for
financial reporting. For purposes of evaluating segment results, management reviewed operating results
using current cost, which approximates LIFO. As supplementary information, and for
our segment reporting, we also provide EBITDA information on a current cost
basis for predecessor periods. In our successor periods, we have utilized the
LIFO inventory methodology and EBITDA information for periods after our emergence is on a
LIFO basis. |
 lyondellbasell.com
3
Fourth-Quarter 2011 Earnings
Cautionary Statement
The information in this presentation includes forward-looking statements. These
statements relate to future events, such as anticipated revenues, earnings,
business strategies, competitive position or other aspects of our operations
or operating results. Actual outcomes and results may differ materially from
what is expressed or forecast in such forward-looking statements. These
statements are not guarantees of future performance and involve certain risks,
uncertainties and assumptions that are difficult to predict. Factors that could cause actual
results to differ from forward-looking statements include, but are not limited
to, availability, cost and price volatility of raw materials and utilities;
supply/demand balances; industry production capacities and operating rates;
uncertainties associated with worldwide economies; legal, tax and
environmental proceedings; cyclical nature of the chemical and refining
industries; operating interruptions; current and potential governmental
regulatory actions; terrorist acts; international political unrest; competitive
products and pricing; technological developments; the ability to comply with
the terms of our credit facilities and other financing arrangements; the
ability to implement business strategies; and other factors affecting our
business generally as set forth in the “Risk Factors”
section of our Form 10-K for the year ended December 31, 2010, which can be
found at www.lyondellbasell.com on the Investor Relations page and on
the Securities and Exchange Commission’s
website at www.sec.gov.
This presentation contains time sensitive information that is accurate only as of the
date hereof. Information contained in this presentation is unaudited and
is subject to change. We undertake no obligation to update the
information presented herein except as required by law.
|
 lyondellbasell.com
4
Fourth-Quarter 2011 Earnings
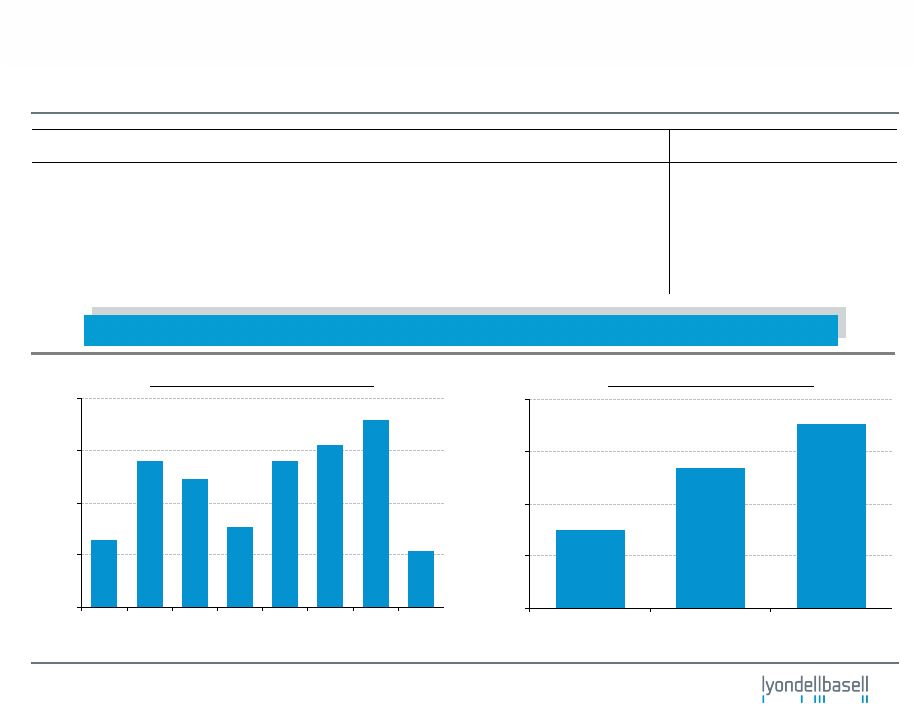
Highlights
EBITDA
(1)(2)
1Q’10 -
4Q’11
Annual
EBITDA
increase
of
31%
from
FY
2010
(1)(2)
($ in millions)
500
1,000
1,500
$2,000
1Q'10
2Q'10
3Q'10
4Q'10
1Q'11
2Q'11
3Q'11
4Q'11
1,500
3,000
4,500
$6,000
2009
2010
2011
EBITDA
(1)(2)
2009 -
2011
($ in millions, except per share data)
4Q'11
3Q'11
4Q'10
FY 2011
FY 2010
EBITDA
(1)(2)
$536
$1,788
$762
$5,279
$4,035
Net Income / (Loss)
($218)
$895
$766
$2,140
$10,084
Diluted Earnings ($ / share)
($0.38)
$1.51
$1.34
$3.74
NA
Net Debt / LTM EBITDA
(1)(2)
0.6x
(0.0x)
0.5x
0.6x
0.5x
1)
Represents a combination of predecessor (January 1, 2010 - April 30, 2010) and successor (May 1,
2010 and thereafter) periods. For periods prior to May 1, 2010, EBITDA is calculated on a current cost inventory basis. For periods
beginning on May 1, 2010, and thereafter, EBITDA is calculated using the LIFO method of inventory
accounting. All EBITDA figures include joint venture dividends.
2)
2Q’10, 3Q’10 and 4Q’10 EBITDA figures exclude LCM inventory charges / (gains) of $333
million, $32 million and $(323) million, respectively. FY 2010 EBITDA figure excludes LCM inventory charge of $42 million.
|
 lyondellbasell.com
5
Fourth-Quarter 2011 Earnings
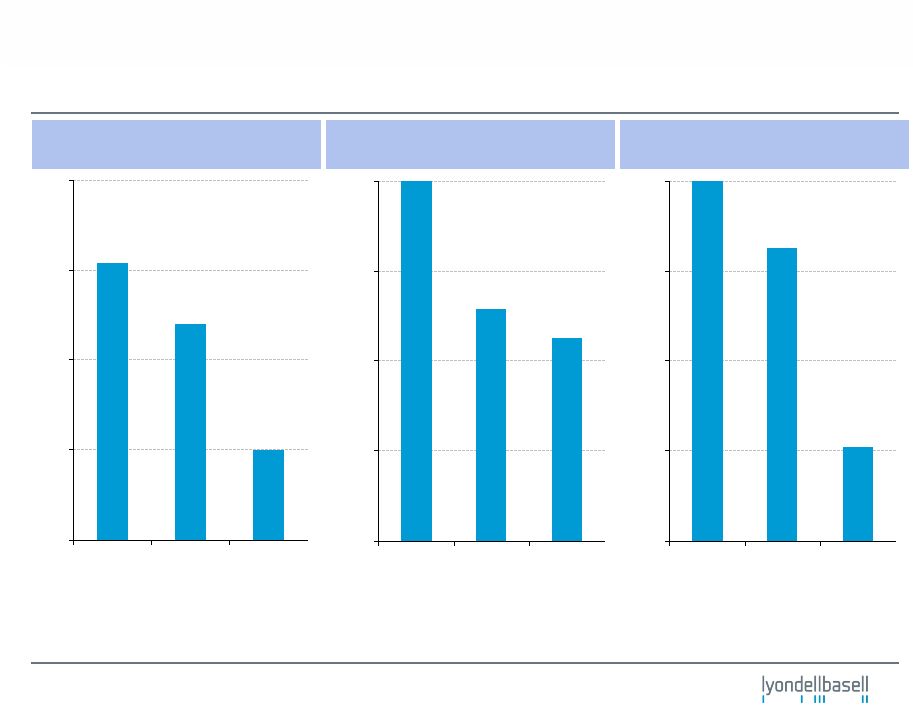
Health, Safety and Environmental Performance
•
2011 was a record year for health, safety and environmental performance
1)
Includes employees and contractors.
Injuries per 200,000 Hours
Worked
(1)
Indexed Environmental Incidents
Indexed Process Incidents
0.30
0.35
0.40
0.45
0.50
2009
2010
2011
0%
25%
50%
75%
100%
2009
2010
2011
0%
25%
50%
75%
100%
2009
2010
2011 |
 lyondellbasell.com
6
Fourth-Quarter 2011 Earnings
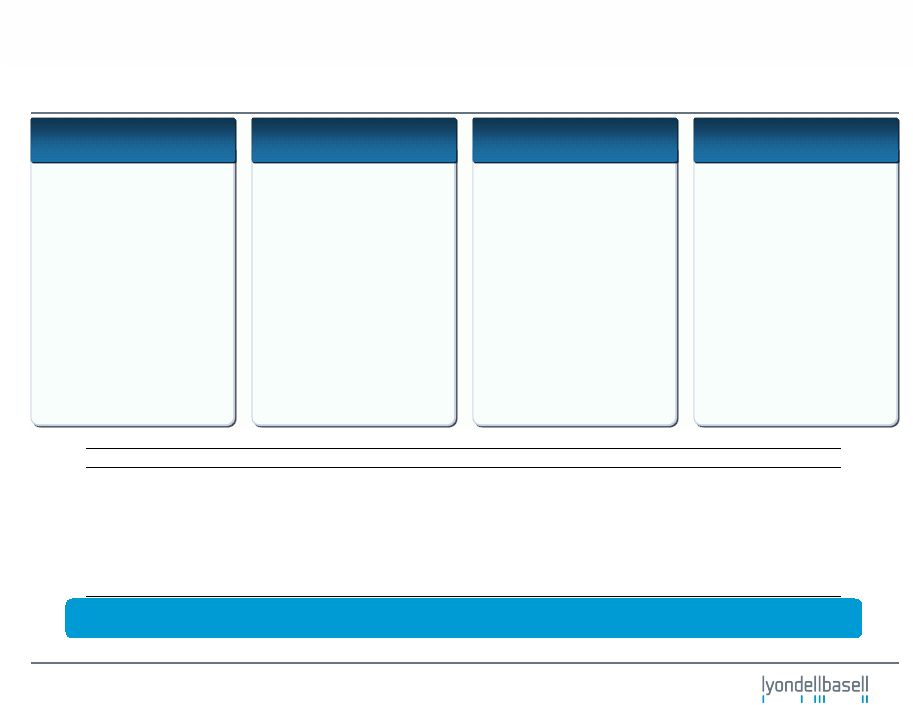
2011 Accomplishments
Significant progress made across the company
Segment EBITDA
2011 EBITDA
Y-o-Y Growth
(2)
Y-o-Y Growth, %
Olefins & Polyolefins - Americas
$2,142
$423
25%
Olefins & Polyolefins - EAI
931
113
14%
Intermediates & Derivatives
1,054
195
23%
Refining & Oxyfuels
972
520
115%
Technology
214
2
1%
($ in millions)
1)
Based on CapIQ dividend adjusted closing prices. Assumes dividend
reinvestment. 2)
2010 EBITDA figures excludes LCM inventory adjustments.
•
Defined North American
olefins expansion and feed
flexibility plans
•
Advanced China PO JV plans
•
Initiated methanol plant restart
efforts
•
Houston refinery crude
purchasing successes
•
Initiated European
organization restructuring
Commercial
•
Increased U.S. ethane
feedstock capabilities by
~5%
•
Production volume records
set at over 30 sites
•
Three key maintenance
turnarounds completed
•
Capital spending increased
to $1 billion with small high
return projects
•
Expanded crude mix at
Houston refinery
•
Improved Houston refinery
crude throughput
Manufacturing
•
Capital restructuring
•
$2.9 billion cash generated
from operations
•
$2.1 billion debt reduction
•
Paid $2.9 billion in
dividends
•
Received $206 million in JV
dividends
Finance and Legal
•
Expanded number of
Independent Supervisory
Board members
•
10% total return vs. 2% for
S&P 500
(1)
•
Outstanding HSE record
•
Record financial results
•
Normalized fixed costs
managed flat from 2009
Overall |
 lyondellbasell.com
7
Fourth-Quarter 2011 Earnings
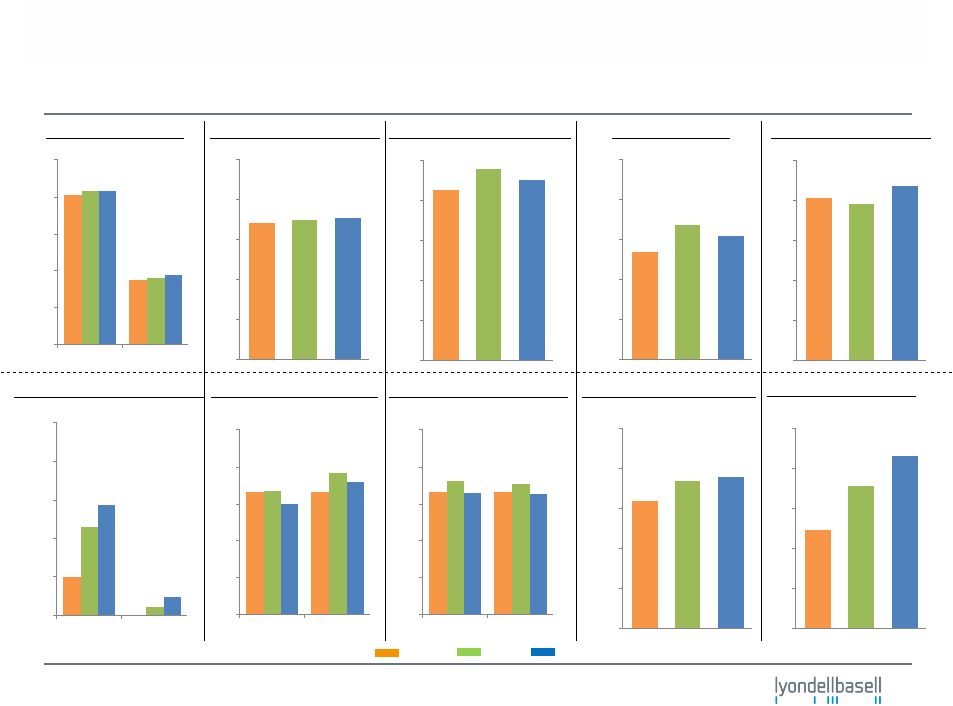
Key Volumes and Margins: 2009 -
2011
HRO Crude Oil Rates
Polyethylene Volumes
Polypropylene Volumes
Maya 2-1-1 Spreads
Polyethylene Spreads
Polypropylene Spreads
Ethylene Volumes
Ethylene Cash Margins
(1)
2009
2010
2011
PO&D Volumes
Intermediates Volumes
244
236
263
0
60
120
180
240
300
MBPD
$12
$18
$22
$0
$5
$10
$15
$20
$25
($/bbl)
8.1
3.5
8.4 8.4
3.6
3.7
0
2
4
6
8
10
US
EU
billion lbs
1.0
0.0
2.3
0.2
2.9
0.5
0
1
2
3
4
5
US
EU
2009=1.0
10.3
10.5
10.6
0
3
6
9
12
15
billion lbs
8.6
9.6
9.1
0
2
4
6
8
10
billion lbs
1.0 1.0
1.0
1.2
0.9
1.1
0.0
0.3
0.6
0.9
1.2
1.5
US
EU
1.0
1.0
1.1
1.1
1.0
1.0
0.0
0.3
0.6
0.9
1.2
1.5
US
EU
2009=1.0
2009=1.0
2.7
3.4
3.1
0.0
1.0
2.0
3.0
4.0
5.0
6.4
7.4
7.6
0.0
2.0
4.0
6.0
8.0
10.0
billion lbs
billion lbs
1)
EU ethylene cash margins normalized to 2009 US margins.
|
 lyondellbasell.com
8
Fourth-Quarter 2011 Earnings
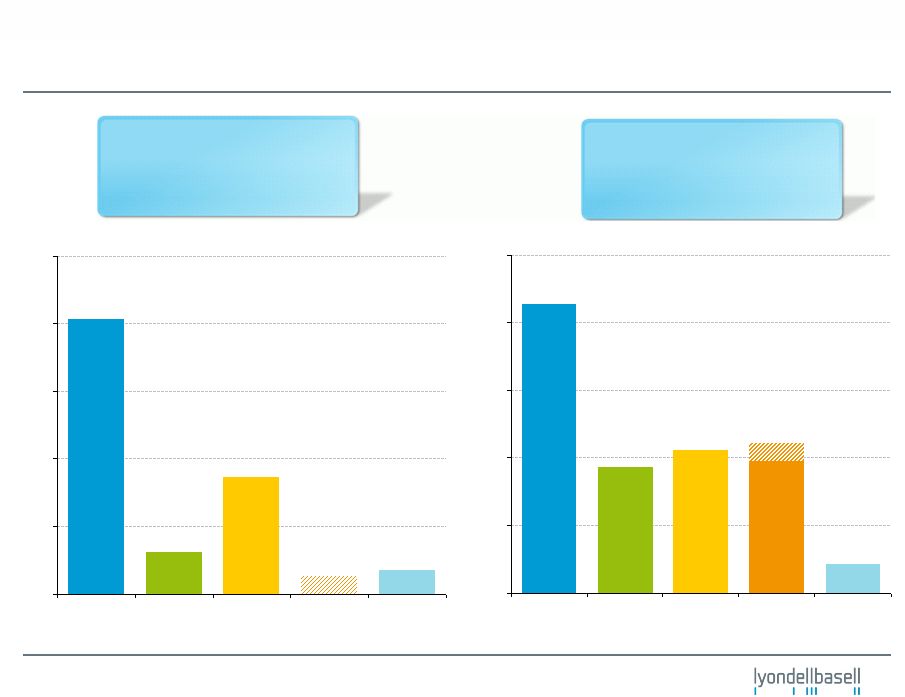
2011 EBITDA
2011 EBITDA
$5,279 million
2011 Operating Income
$3,998 million
4Q‘11 EBITDA
$536 million
4Q‘11 Operating Income
$201 million
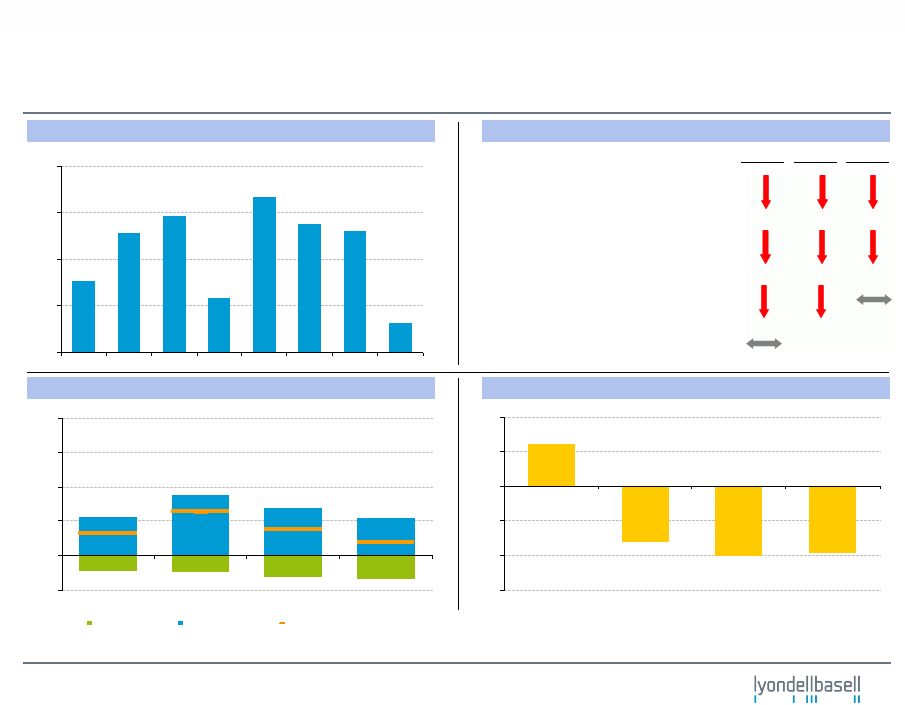
4Q’11 and 2011 Segment EBITDA
Fourth-Quarter 2011 EBITDA
($ in millions)
($ in millions)
100
200
300
400
$500
Olefins &
Polyolefins -
Americas
Olefins &
Polyolefins -
EAI
Intermediates
& Derivatives
Refining &
Oxyfuels
Technology
500
1,000
1,500
2,000
$2,500
Olefins &
Polyolefins -
Americas
Olefins &
Polyolefins -
EAI
Intermediates
& Derivatives
Refining &
Oxyfuels
Technology
Note: Shaded area for Refining & Oxyfuels represents EBITDA pro forma for $136
million Berre charge add back. |
 lyondellbasell.com
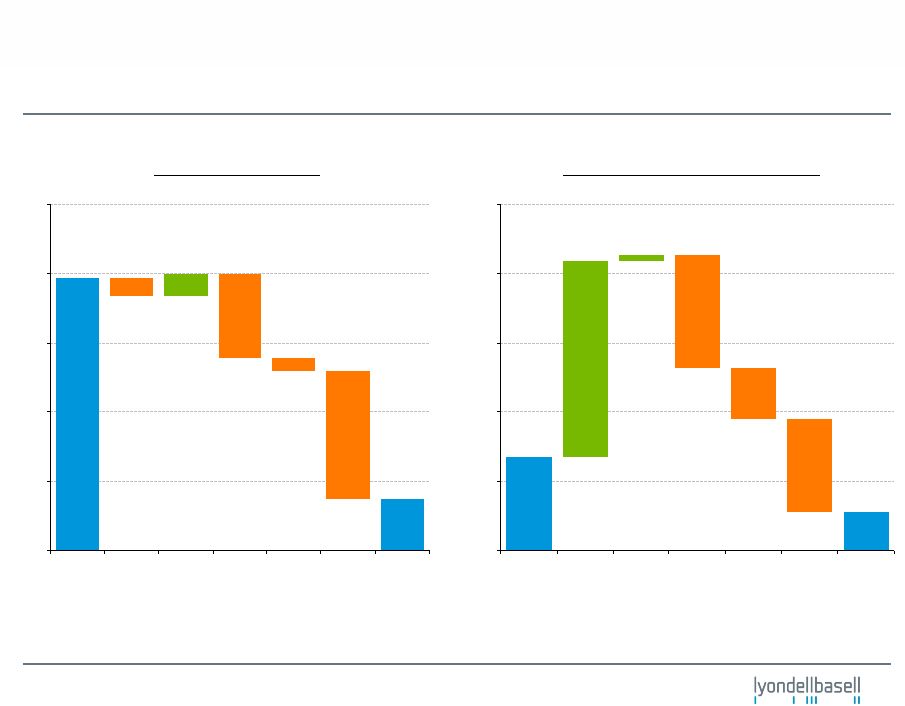
$5,901
$1,118
0
1,500
3,000
4,500
6,000
$7,500
4Q'11
Beginning
Cash
Balance
CF from
Operations
excl.
Working
Capital
Working
Capital
Changes
Net Debt
Repayment
Capex
Other
(Primarily
dividends)
4Q'11
Ending
Cash
Balance
$2,711
$1,118
0
2,000
4,000
6,000
8,000
$10,000
May 1, 2010
Beginning
Cash
Balance
CF from
Operations
excl.
Working
Capital
Working
Capital
Changes
Net Debt
Repayment
Capex
Other
(Primarily
dividends)
4Q'11
Ending
Cash
Balance
9
Fourth-Quarter 2011 Earnings
Cash Flow
1) Includes inventories, accounts payable and accounts receivable.
2) Includes capital and maintenance turnaround spending.
3) 4Q ’11 beginning and ending cash balance includes cash, cash
equivalents and restricted cash. Fourth-Quarter 2011
Since
Emergence
(May
1,
2010)
(2)
(1)
(3)
($ in millions)
(2)
(1)
(3) |
 lyondellbasell.com
10
Fourth-Quarter 2011 Earnings
Working Capital and Liquidity
1) Figures depicted represent end of quarter balances.
($ in billions)
($ in billions)
Working Capital
(1)
Liquidity and Cash Balance
($6)
($4)
($2)
$0
$2
$4
$6
$8
4Q'10
1Q'11
2Q'11
3Q'11
4Q'11
Total WC
Inventory
AR
AP
0
2
4
6
$8
4Q'10
1Q'11
2Q'11
3Q'11
4Q'11
Liquidity
Cash
Snapshot at December 31, 2011
Liquidity: $3.2 billion
Net Debt: $2.9 billion
Cash: $1.1 billion |
 lyondellbasell.com
11
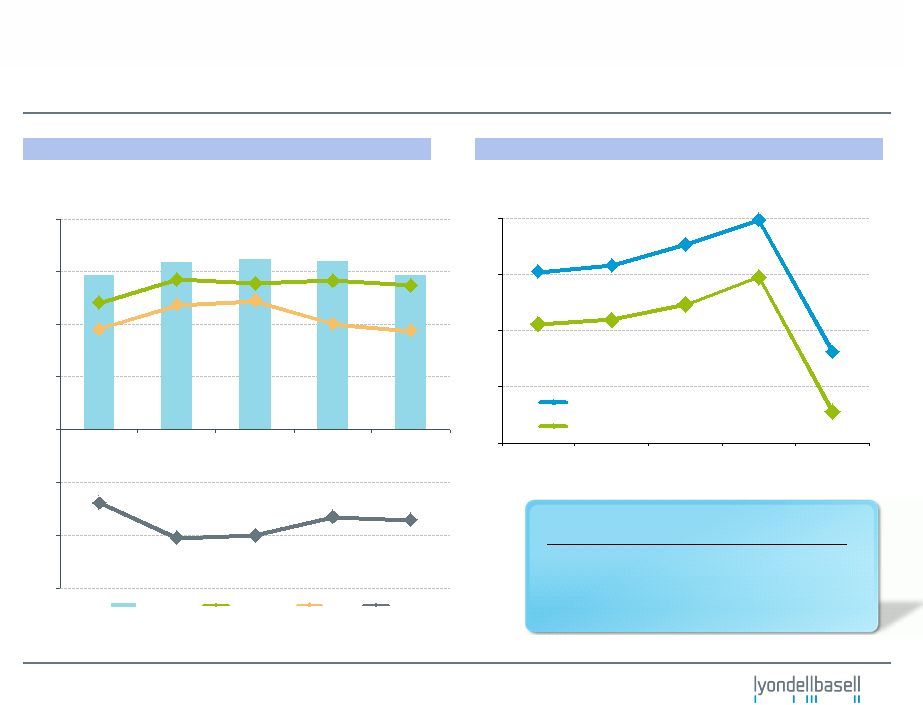
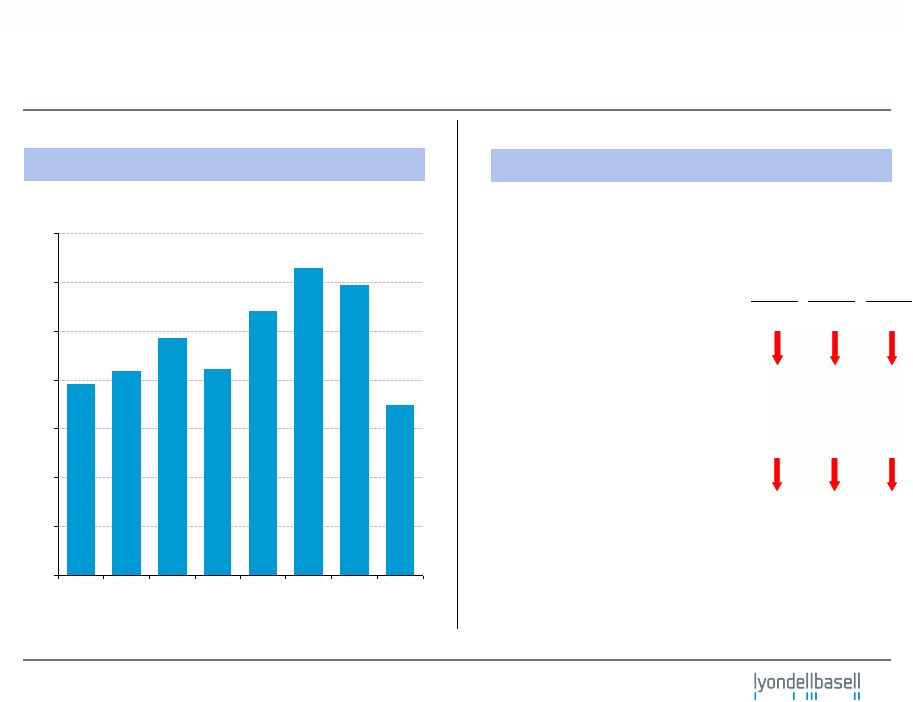
Fourth-Quarter 2011 Earnings
4Q’10
3Q’11
4Q’11
Jan-12
Olefins & Polyolefins -
Americas
Highlights
and
Business
Drivers
-
4Q’11
U.S. Olefins
•
Ethylene price down 2¢/lb
•
~78% of ethylene from NGLs
•
Lower co-product prices
Polyethylene
•
Margin compression from price
decline
Polypropylene (includes Catalloy)
•
Q4 results near breakeven
Ethylene Chain Margins (per CMAI)
EBITDA
(1)
Performance vs. 3Q’11
Polypropylene Margins (per CMAI)
1)
Represents
a
combination
of
predecessor
(January
1,
2010
-
April
30,
2010)
and
successor
(May
1,
2010
and
thereafter)
periods.
For
periods
prior
to
May
1,
2010,
EBITDA
is
calculated
on
a
current
cost
inventory
basis.
For
periods
beginning on May 1, 2010, and thereafter, EBITDA is calculated using the LIFO method
of inventory accounting. LCM charges / (gains) of $171 million, $26 million and $(163) million are excluded from 2Q’10, 3Q’10 and 4Q’10 EBITDA
figures, respectively.
EBITDA
Margin
Volume
($ in millions)
(cents / lb)
(cents / lb)
200
400
600
$800
1Q'10
2Q'10
3Q'10
4Q'10
1Q'11
2Q'11
3Q'11
4Q'11
0
1
2
3
4
5
4Q'10
3Q'11
4Q'11
Jan-12 |
 lyondellbasell.com
(10)
0
10
20
30
40
4Q'10
3Q'11
4Q'11
Jan-12
HDPE Margin
Naphtha Margin
Ethylene/HDPE Chain
12
Fourth-Quarter 2011 Earnings
Olefins & Polyolefins -
Europe, Asia, International
Highlights
and
Business
Drivers
-
4Q’11
EU Olefins
•
Q4 EBITDA near breakeven
•
13% volume decline
Polyethylene
•
Q4 Slightly below breakeven EBITDA
•
Volume down 10%
Polypropylene (includes Catalloy)
•
Commodity PP breakeven for Q4
•
PP compounds steady
JV dividends
•
Saudi JVs
European Ethylene Chain Margins (per CMAI)
EBITDA
(1)
Performance vs. 3Q’11
European Polypropylene Margins (per CMAI)
1)
Represents
a
combination
of
predecessor
(January
1,
2010
-
April
30,
2010)
and
successor
(May
1,
2010
and
thereafter)
periods.
For
periods
prior
to
May
1,
2010,
EBITDA
is
calculated
on
a
current
cost
inventory
basis.
For
periods
beginning on May 1, 2010, and thereafter, EBITDA is calculated using the LIFO method
of inventory accounting. LCM charges / (gains) of $5 million, $5 million and $(10) million are excluded from 2Q’10, 3Q’10 and 4Q’10 EBITDA
figures, respectively.
EBITDA
Margin
Volume
($ in millions)
(cents / lb)
(cents / lb)
100
200
300
$400
1Q'10
2Q'10
3Q'10
4Q'10
1Q'11
2Q'11
3Q'11
4Q'11
(6)
(4)
(2)
0
2
4
4Q'10
3Q'11
4Q'11
Jan-12 |
 lyondellbasell.com
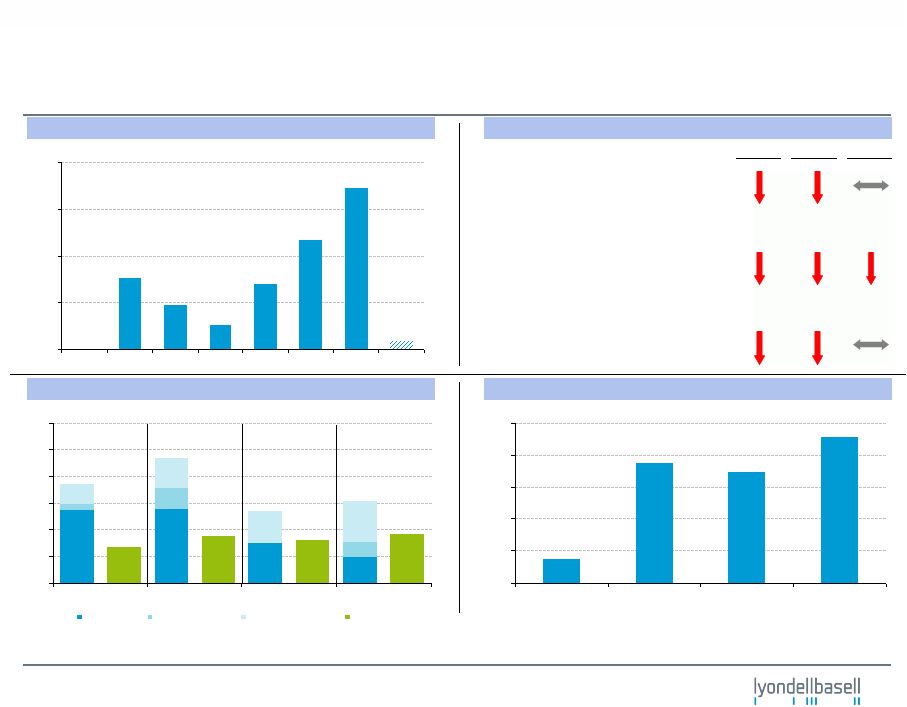
13
Fourth-Quarter 2011 Earnings
Intermediates & Derivatives
Highlights
and
Business
Drivers
-
4Q’11
1)
Represents
a
combination
of
predecessor
(January
1,
2010
-
April
30,
2010)
and
successor
(May
1,
2010
and
thereafter)
periods.
For
periods
prior
to
May
1,
2010,
EBITDA
is
calculated
on
a
current
cost
inventory
basis.
For periods
beginning on May 1, 2010, and thereafter, EBITDA is calculated using the LIFO method
of inventory accounting. LCM charges / (gains) of $25 million and $(17) million are excluded for 2Q’10 and 4Q’10, respectively.
EBITDA
(1)
Propylene Oxide and Derivatives
•
PO and BDO turnaround
•
Poor deicer volumes
•
Year-end slowdown
Intermediates
•
Acetyl turnaround
•
Lower ethylene glycol and acetyl
prices
EBITDA
Margin
Volume
Performance vs. 3Q’11
($ in millions)
50
100
150
200
250
300
$350
1Q'10
2Q'10
3Q'10
4Q'10
1Q'11
2Q'11
3Q'11
4Q'11 |
 lyondellbasell.com
0
5
10
15
20
25
30
Lt-Hvy
Lt-Gasoline
Lt-Heating Oil
Urals 4121
14
Fourth-Quarter 2011 Earnings
Refining & Oxyfuels
Highlights
and
Business
Drivers
-
4Q’11
Houston Refinery
•
Q4 crude throughput: 262 MBPD
•
Maya 2-1-1: $12.71 / bbl
Berre Refinery
•
Q4 crude throughput: 61 MBPD
•
Urals 4-1-2-1: $8.02 / bbl
•
Refinery suspended at year end
Oxyfuels
•
Less than typical seasonal margin
decline
Refining Spreads (per Platts)
(2)
EBITDA
(1)
Performance vs. 3Q’11
EU MTBE Raw Material Margins (per Platts)
1)
Represents
a
combination
of
predecessor
(January
1,
2010
-
April
30,
2010)
and
successor
(May
1,
2010
and
thereafter)
periods.
For
periods
prior
to
May
1,
2010,
EBITDA
is
calculated
on
a
current
cost
inventory
basis.
For
periods
beginning on May 1, 2010, and thereafter, EBITDA is calculated using the LIFO method
of inventory accounting. LCM charges of $132 million, $1 million and $(133) million are excluded from 2Q’10, 3Q’10 and 4Q’10 EBITDA figures,
respectively.
2) Light Louisiana Sweet (LLS) is the referenced light crude. Shaded area in
Q4 represents EBITDA pro forma for $136 million Berre charge add back. EBITDA
Margin
Volume
($ in millions)
($ / bbl)
4Q’10
3Q’11
4Q’11
Jan-12
(cents / gallon)
150
300
450
$600
1Q'10
2Q'10
3Q'10
4Q'10
1Q'11
2Q'11
3Q'11
4Q'11
0
25
50
75
100
125
4Q'10
3Q'11
4Q'11
Jan-12 |
 lyondellbasell.com
•
Margin improvement in N.A. olefins and
Houston refinery
•
Benefit from declining ethane and natural gas
costs, increasing co-product values
•
Positive momentum building in many
products:
-
Polyethylene price (December increase)
-
Ethylene and propylene
-
Co-products: butadiene, benzene
-
Maya 2-1-1
•
European olefins chain remains difficult
•
Benefit from reduced interest expense
15
Fourth-Quarter 2011 Earnings
Fourth-Quarter Summary and Outlook
Near-term Outlook
•
Business declines driven by:
-
Lower refinery spreads
-
Ethylene co-product price declines
-
Seasonal effects
-
I&D turnarounds
•
Minimal EBITDA generated in:
-
North American polyolefins
-
EAI olefins and commodity polyolefins
-
Houston refinery
•
Completed debt restructuring
-
Q4 includes debt repayment premiums
-
Reduced outstanding debt
-
Relieved bond covenants
•
Dividends
-
Regular dividend increased to $0.25/share
-
Paid $4.50/share special dividend
Fourth-Quarter Summary |
 lyondellbasell.com
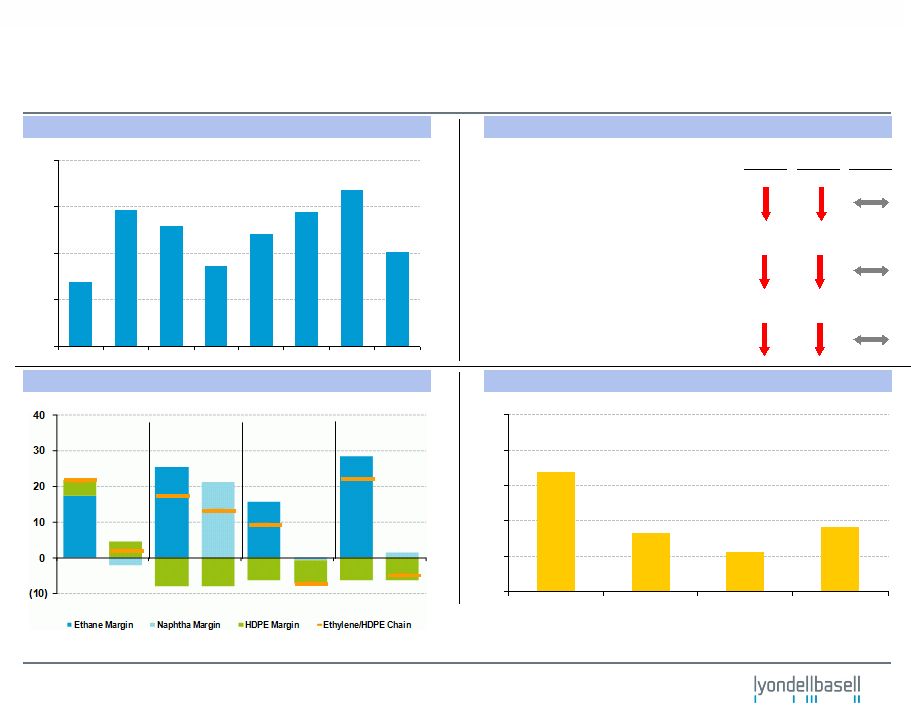
16
Fourth-Quarter 2011 Earnings
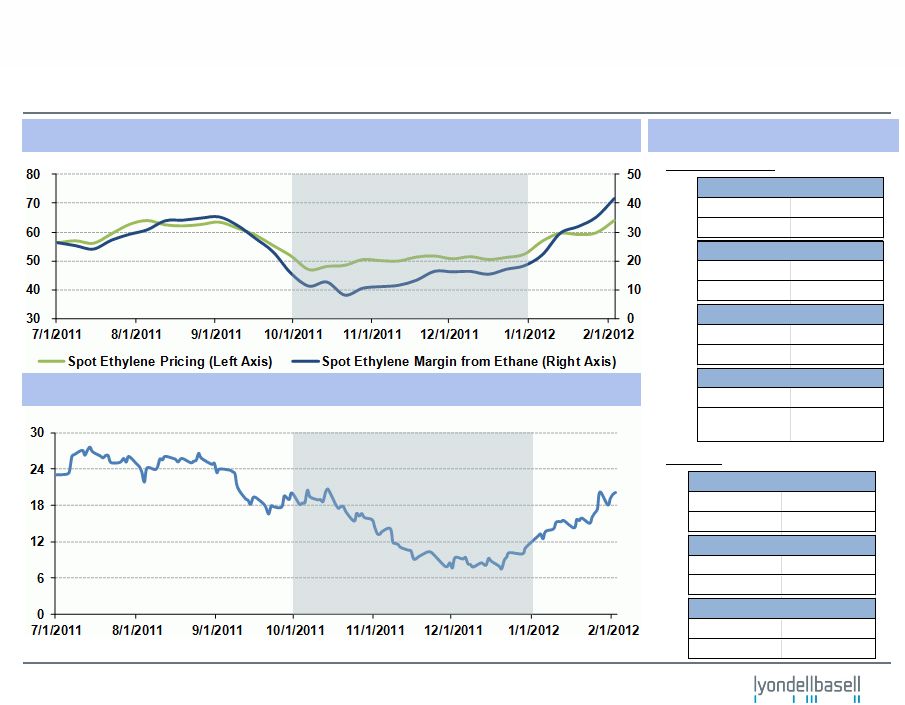
Price Increases Benefiting Certain Businesses
U.S. Gulf Coast Spot Ethylene Pricing and Margin
Maya 2-1-1 Crack Spread
(¢/lbs.)
Sources:
CMAI and Platts.
Recent Price Movements
North America
Contract Ethylene
Jan
Feb
+40 €/ton
+99 €/ton
Contract Propylene
Jan
Feb
+20 €/ton
+90 €/ton
Contract Butadiene
Jan
Feb
+50 €/ton
+235 €/ton
Europe
U.S. Gulf Coast Spot Ethylene Pricing and Margin
Maya 2-1-1 Crack Spread
Recent Price Movements
($/barrel)
Contract Propylene
Jan
Feb
-
+16.5 ¢/lb
Contract Butadiene
Jan
Feb
+7 ¢/lb
+14 ¢/lb
Contract Benzene
Jan
Feb
+70 ¢/gal
+50 ¢/gal
Contract PE
Dec
Feb
+5 ¢/lb
+6 ¢/lb
(nominated) |