Attached files
| file | filename |
|---|---|
| EX-10.1 - EX-10.1 - Laredo Petroleum, Inc. | a12-4467_1ex10d1.htm |
| EX-10.3 - EX-10.3 - Laredo Petroleum, Inc. | a12-4467_1ex10d3.htm |
| EX-10.2 - EX-10.2 - Laredo Petroleum, Inc. | a12-4467_1ex10d2.htm |
| 8-K - CURRENT REPORT OF MATERIAL EVENTS OR CORPORATE CHANGES - Laredo Petroleum, Inc. | a12-4467_18k.htm |
Exhibit 99.1
|
|
Corporate Presentation February 2012 NYSE: LPI www.laredopetro.com |
|
|
Forward-Looking / Cautionary Statements This presentation contains forward-looking statements within the meaning of Section 27A of the Securities Act of 1933 and Section 21E of the Securities Exchange Act of 1934. All statements, other than statements of historical fact, included in this presentation that address activities, events or developments that Laredo Petroleum Holdings, Inc. (the “Company”, “Laredo” or “LPI”) expects, believes or anticipates will or may occur in the future are forward-looking statements. The words “believe,” “expect,” “may,” “estimates,” “will,” “anticipate,” “plan,” “intend,” “foresee,” “should,” “would,” “could,” or other similar expressions are intended to identify forward-looking statements, which are generally not historical in nature. However, the absence of these words does not mean that the statements are not forward-looking. Without limiting the generality of the foregoing, forward-looking statements contained in this presentation specifically include the expectations of plans, strategies, objectives and anticipated financial and operating results of the Company, including as to the Company’s drilling program, production, hedging activities, capital expenditure levels and other guidance included in this presentation. These statements are based on certain assumptions made by the Company based on management’s expectations and perception of historical trends, current conditions, anticipated future developments and other factors believed to be appropriate. Such statements are subject to a number of assumptions, risks and uncertainties, many of which are beyond the control of the Company, which may cause actual results to differ materially from those implied or expressed by the forward-looking statements. These include the factors discussed or referenced in the “Risk Factors” section of the Company’s Prospectus dated December 14, 2011, risks relating to financial performance and results, current economic conditions and resulting capital restraints, prices and demand for oil and natural gas, availability of drilling equipment and personnel, availability of sufficient capital to execute the Company’s business plan, impact of compliance with legislation and regulations, successful results from our identified drilling locations, the Company’s ability to replace reserves and efficiently develop and exploit its current reserves and other important factors that could cause actual results to differ materially from those projected. Any forward-looking statement speaks only as of the date on which such statement is made and the Company undertakes no obligation to correct or update any forward-looking statement, whether as a result of new information, future events or otherwise, except as required by applicable law. The Securities and Exchange Commission (“SEC”) generally permits oil and gas companies, in filings made with the SEC, to disclose proved reserves, which are reserve estimates that geological and engineering data demonstrate with reasonable certainty to be recoverable in future years from known reservoirs under existing economic and operating conditions and certain probable and possible reserves that meet the SEC’s definitions for such terms. In this communication, the Company may use the term “unproved reserves” which the SEC guidelines restrict from being included in filings with the SEC without strict compliance with SEC definitions. The Company does not choose to include unproved reserve estimates in its filings with the SEC. “Unproved reserves” refers to the Company’s internal estimates of hydrocarbon quantities that may be potentially discovered through exploratory drilling or recovered with additional drilling or recovery techniques. Unproved reserves may not constitute reserves within the meaning of the Society of Petroleum Engineer’s Petroleum Resource Management System or SEC rules and does not include any proved reserves. Actual quantities that may be ultimately recovered from the Company’s interests will differ substantially. Factors affecting ultimate recovery include the scope of the Company’s ongoing drilling program, which will be directly affected by the availability of capital, drilling and production costs, availability of drilling services and equipment, drilling results, lease expirations, transportation constraints, regulatory approvals and other factors; and actual drilling results, including geological and mechanical factors affecting recovery rates. Estimates of unproved reserves may change significantly as development of the Company’s core assets provide additional data. In addition, our production forecasts and expectations for future periods are dependent upon many assumptions, including estimates of production decline rates from existing wells and the undertaking and outcome of future drilling activity, which may be affected by significant commodity price declines or drilling cost increases. This presentation includes financial measures that are not in accordance with generally accepted accounting principals (“GAAP”) including adjusted EBITDA. While management believes that such measures are useful for investors, they should not be used as a replacement for financial measures that are in accordance with GAAP. For a reconciliation of adjusted EBITDA to the nearest comparable measure in accordance with GAAP, please see the Appendix. 2 |
|
|
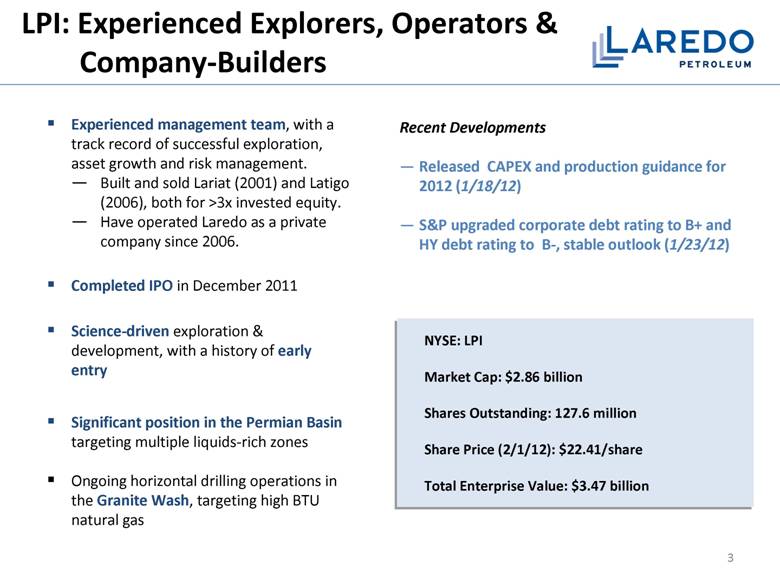
3 LPI: Experienced Explorers, Operators & Company-Builders Experienced management team, with a track record of successful exploration, asset growth and risk management. Built and sold Lariat (2001) and Latigo (2006), both for >3x invested equity. Have operated Laredo as a private company since 2006. Completed IPO in December 2011 Science-driven exploration & development, with a history of early entry Significant position in the Permian Basin targeting multiple liquids-rich zones Ongoing horizontal drilling operations in the Granite Wash, targeting high BTU natural gas Recent Developments Released CAPEX and production guidance for 2012 (1/18/12) S&P upgraded corporate debt rating to B+ and HY debt rating to B-, stable outlook (1/23/12) NYSE: LPI Market Cap: $2.86 billion Shares Outstanding: 127.6 million Share Price (2/1/12): $22.41/share Total Enterprise Value: $3.47 billion |
|
|
4 Midland Office Dallas Office Tulsa Headquarters 23,288 Boe/d average daily production during 2011 1 2 137 MMBoe proved reserves at June 30, 20111 2 ~464,300 gross / 336,000 net acres with over 6,100 gross identified potential drilling locations Significant production and reserve growth with multiple existing and additional emerging horizons Currently operating 16 drilling rigs Asset Overview Permian: Vertical Wolfberry, Horizontal Wolfcamp, Cline Shales >135,000 net acres, Oil and liquids-rich natural gas, >5,700 gross identified potential drilling locations Total Company Anadarko: Granite Wash 37,700 net acres, Liquids-rich natural gas, >350 gross identified potential drilling locations Other Areas Dalhart Basin – 74,000 net acres Central Texas Panhandle – 48,000 net acres Eastern Anadarko - 37,300 net acres 1 Production and proved reserves reported on a two-stream basis. Proved reserves are gas price adjusted to reflect NGL benefit. Proved reserves as of 6/30/11, Ryder Scott Company, L.P. evaluation SEC pricing. Production based on FY 2011 production guidance of 8.5 MMBoe. 2 Oil equivalents (“BOE”) are calculated using a conversion rate of six Mcf per one Bbl |
|
|
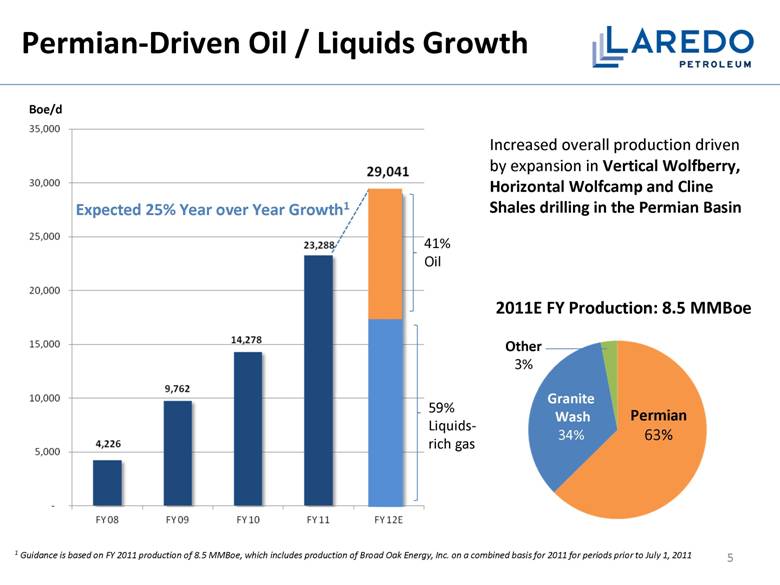
Permian-Driven Oil / Liquids Growth 59% Liquids-rich gas 41% Oil Expected 25% Year over Year Growth1 Increased overall production driven by expansion in Vertical Wolfberry, Horizontal Wolfcamp and Cline Shales drilling in the Permian Basin Boe/d 1 Guidance is based on FY 2011 production of 8.5 MMBoe, which includes production of Broad Oak Energy, Inc. on a combined basis for 2011 for periods prior to July 1, 2011 5 Permian 63% Granite Wash 34% Other 3% 2011E FY Production: 8.5 MMBoe |
|
|
Significant Permian Exposure, PDP Growth Potential Granite Wash 41 MMBoe 30% Permian 86 MMBoe 63% Other 10 MMBoe 7% 1 Proved reserves reported on a two-stream basis. Gas price is adjusted to reflect NGL benefit. Proved reserves and value as of 6/30/11, Ryder Scott evaluation, SEC pricing. 2011 Mid-Year Reserves: 137 MMBoe1 6 Oil (MBbl) Gas (MMcf) EQUIV (MBoe) % Total Proved Reserve Category PDP 15,828 200,752 49,286 36% PDNP 1,472 17,698 4,422 3% PUD 28,629 328,291 83,344 61% Total Proved 45,929 546,741 137,052 100% % Total Proved 34% 66% 100% |
|
|
7 Years of Growth Embedded in Extensive Drilling Inventory Permian Horizontal 2,250 locations Permian Vertical 3,514 locations Granite Wash 351 locations Total Gross Identified Locations1 = 6,115 (94% Permian) Laredo’s inventory of high-quality drilling locations is identified and de-risked through... Drilling Results: Laredo has drilled over 500 vertical & horizontal wells on its Permian acreage Core Samples: More than 2,200 ft of whole cores, 400+ sidewall cores taken 3D Seismic Library: Over 470 sq. miles of data in-house, another 250+ sq. miles being acquired Advanced logging / stimulation technologies employed Verification of upside potential supported by Industry activity 1 Company estimates. See page 22 and 23 for details. |
|
|
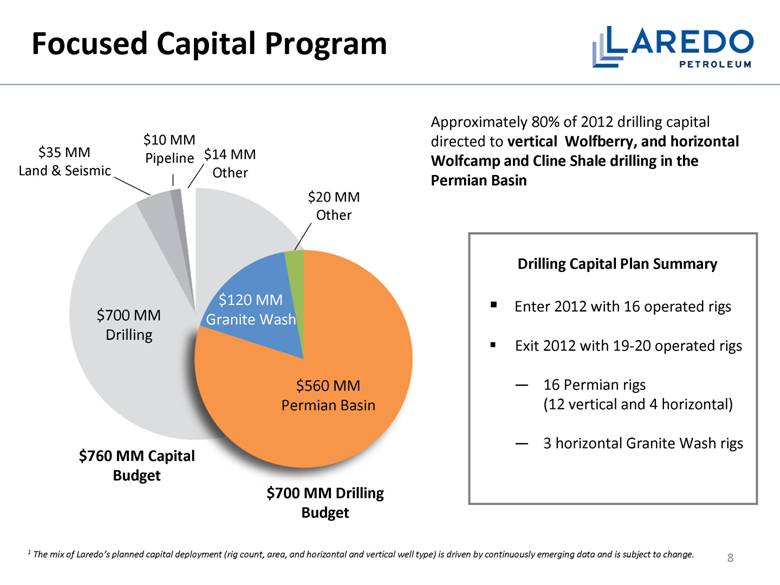
Focused Capital Program $760 MM Capital Budget $700 MM Drilling Budget $560 MM Permian Basin $120 MM Granite Wash $20 MM Other $700 MM Drilling $35 MM Land & Seismic $10 MM Pipeline $14 MM Other Approximately 80% of 2012 drilling capital directed to vertical Wolfberry, and horizontal Wolfcamp and Cline Shale drilling in the Permian Basin Drilling Capital Plan Summary Enter 2012 with 16 operated rigs Exit 2012 with 19-20 operated rigs 16 Permian rigs (12 vertical and 4 horizontal) 3 horizontal Granite Wash rigs 1 The mix of Laredo’s planned capital deployment (rig count, area, and horizontal and vertical well type) is driven by continuously emerging data and is subject to change. 8 |
|
|
Conservative Financial Profile 9 Liquidity and Capitalization ($ millions) 1 Q3 2011 Adjusted EBITDA. See reconciliation on page 25 2 Based on June 30, 2011 reserve report prepared by Ryder Scott 3 Total Enterprise Value includes Total Long Term Debt + public equity value based on 1/31/12 closing price Liquidity position of $685 million Funding flexibility for 2012 and beyond Rapidly growing cash flow from operations Availability under revolver expected to continue to grow Proven ability to access multiple capital market sources Flexible capital program 2012 Cap Ex program focused on liquids rich plays Drilling program provides high economic returns No near term debt maturities Revolver borrowing base increased to $712.5 million (10/28/11) S&P upgraded corporate debt rating to B+ and HY debt rating to B- with stable outlook Pro Forma IPO 9/30/2011 Cash and marketable securities 28.2 Current Borrowing Base Oil and Gas Component 712.5 Borrowings (55.6) Liquidity 685.1 Long Term Debt Senior Revolving Credit Facility 55.6 9.5% Senior Notes due 2019 552.0 Total Long Term Debt 607.6 Stockholder’s Equity 757.6 Total Book Capitalization 1,365.2 Credit Statistics Total Debt / LQA Adj. EBITDA 1 1.5x Total Debt / Proved Reserves ($/Boe) 2 $4.43 Total Debt / Total Book Capitalization 55% Total Debt / Total Enterprise Value3 18% |
|
|
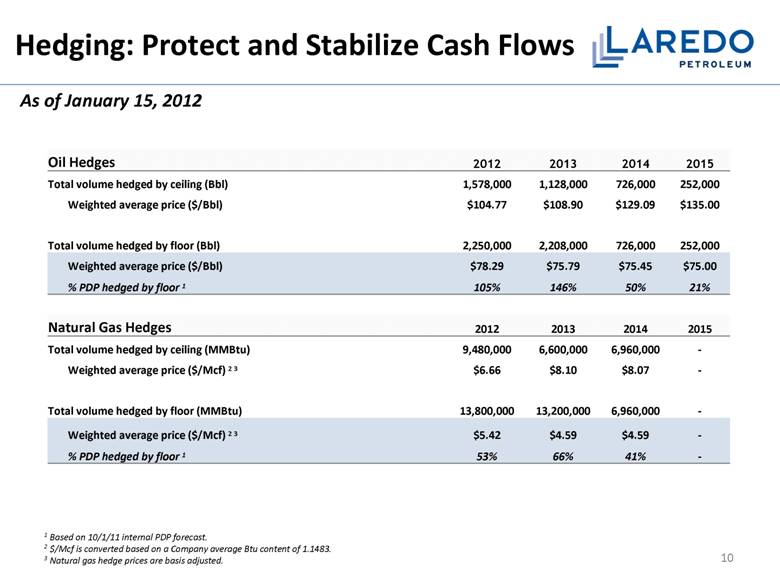
2012 2013 2014 2015 Total volume hedged by ceiling (Bbl) 1,578,000 1,128,000 726,000 252,000 Weighted average price ($/Bbl) $104.77 $108.90 $129.09 $135.00 Total volume hedged by floor (Bbl) 2,250,000 2,208,000 726,000 252,000 Weighted average price ($/Bbl) $78.29 $75.79 $75.45 $75.00 % PDP hedged by floor 1 105% 146% 50% 21% 2012 2013 2014 2015 Total volume hedged by ceiling (MMBtu) 9,480,000 6,600,000 6,960,000 - Weighted average price ($/Mcf) 2 3 $6.66 $8.10 $8.07 - Total volume hedged by floor (MMBtu) 13,800,000 13,200,000 6,960,000 - Weighted average price ($/Mcf) 2 3 $5.42 $4.59 $4.59 - % PDP hedged by floor 1 53% 66% 41% - Hedging: Protect and Stabilize Cash Flows 10 1 Based on 10/1/11 internal PDP forecast. 2 $/Mcf is converted based on a Company average Btu content of 1.1483. 3 Natural gas hedge prices are basis adjusted. Oil Hedges Natural Gas Hedges As of January 15, 2012 |
|
|
Permian Basin: Large, Quality Position multi-stacked plays in a prime geologic neighborhood 11 Target intervals include Vertical Wolfberry, Horizontal Wolfcamp Shale (Upper, Middle, Lower), Horizontal Cline Shale Interest in over 300 sections with ~135,000 net acres concentrated in Glasscock and Reagan Counties ~95% average working interest Pioneer Laredo Apache Exco Petrohawk / BHP EOG Approach COP El Paso |
|
|
Laredo’s Permian position consists of three distinct plays with multiple targets: Vertical Wolfberry Horizontal Wolfcamp Shale (Upper, Middle, Lower) Horizontal Cline Shale All three plays exist under Laredo’s acreage Permian Basin: 3 Plays, Multiple Targets 1 2 3 2 3 1 5,000’ – 7,500’ 6,000’ – 8,000’ 7,000’ – 8,300’ 9,000’ – 9,500’ 1 Formation depths are approximate. 3,900’ – 5,700’1 9,500’ – 10,000’ 12 |
|
|
Permian Basin Overview Multiple programs in varying phases of exploration / development 13 Early Stage Exploration Late Stage Exploration Early Stage Development Full Development Targeted Interval Concept confirmation, petrophysical / core research underway, small number of single well tests Multiple well tests, gaining well history, testing geological extent Confirmation of repeatability, optimizing drilling and completion techniques Focus on concept repeatability, cost reductions, efficiencies and further optimization Vertical Wolfberry (North) Approx. 110 wells completed Vertical Wolfberry (South) 1 Approx. 470 shallow and 21 deep wells completed Upper Wolfcamp 4 horizonal wells completed, 2 whole cores and 87 side wall cores analyzed Middle Wolfcamp Not yet tested, 38 side wall cores analyzed Lower Wolfcamp Individual zone tested in 3 wells; 2 whole cores and 39 side wall cores analyzed Cline 6+ single zone tests and over 140 cores and side wall cores analyzed 1 Includes properties acquired from Broad Oak Energy, Inc. on 7/1/11. 23 wells drilled and completed; add'l acreage delineation underway in 2012, testing 7,000'+ lateral lengths and increased # of frac stages |
|
|
GLASSCOCK HOWARD STERLING IRION REAGAN TOM GREEN MARTIN MITCHELL Vertical Wolfberry: Foundation for Growth LPI has completed over 600 gross vertical wells in the Wolfberry; 12 rigs currently running Large inventory of repeatable, highly economic development locations. Program accounted for 56% of FY 2011 production. Provides a technical and economic foundation for defining additional upside of horizontal shale drilling programs. Provides core information of individual targeted formations, single-zone testing, sub-surface control, assists to delineate and identify “sweet spots”, helps prioritize land efforts LPI acreage LPI vertical well 14 |
|
|
Wolfcamp Shale: Emerging Opportunity 15 The Wolfcamp Shale consists of three intervals: the Upper, Middle and Lower. Most industry drilling to date has been concentrated in the Upper Wolfcamp Shale interval and in the Middle interval to some extent. LPI has drilled and completed 4 gross horizontal wells in the Upper Wolfcamp Shale. Upside potential in Middle and Lower Wolfcamp identified based on petro-physical data and extensive vertical well control. Significant industry activity on trend by Pioneer, EOG, Approach, El Paso and others is indicative of industry interest in the play. 1,300 Wolfcamp Shale Horizontal Locations Identified IRION STERLING MARTIN HOWARD MITCHELL GLASSCOCK MIDLAND UPTON REAGAN TOM GREEN Non-op Wolfcamp hz well LPI acreage Laredo Wolfcamp hz well |
|
|
Repeatable horizontal resource play in the Cline Shale Laredo has been drilling and gathering data on Cline Shale since 2008 23 horizontal wells drilled and completed in the Cline Shale, a baseline of historical well performance Cline Shale has been identified across Laredo’s entire Permian acreage position Laredo has gathered extensive petrophysical data (utilizing in-house petrophysicist with multi-play shale reservoir expertise) on the Cline Shale that is currently proprietary Other industry activity: Apache and Range Laredo’s Cline Shale Play 950 Horizontal Cline Shale Potential Locations Identified GLASSCOCK HOWARD STERLING IRION REAGAN TOM GREEN MARTIN MITCHELL Late stage exploration Early stage development Cline whole core Laredo Cline hz well LPI acreage Early stage exploration 16 |
|
|
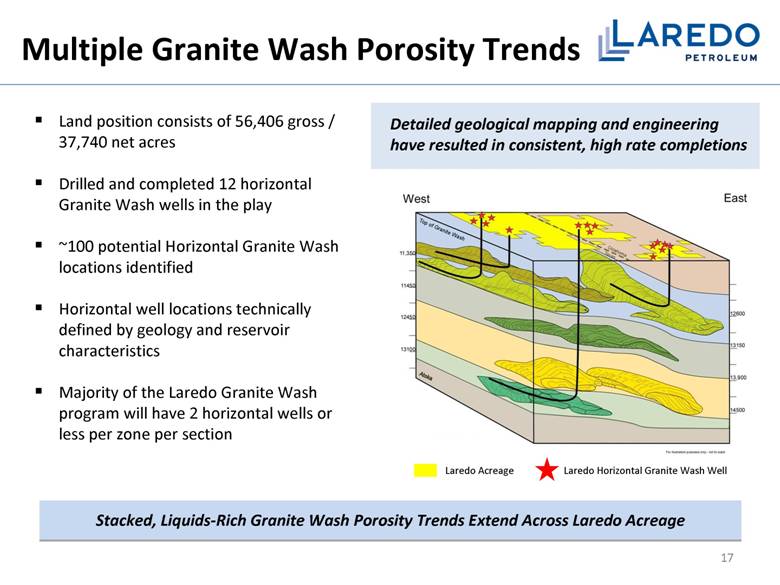
Multiple Granite Wash Porosity Trends 17 Stacked, Liquids-Rich Granite Wash Porosity Trends Extend Across Laredo Acreage Land position consists of 56,406 gross / 37,740 net acres Drilled and completed 12 horizontal Granite Wash wells in the play ~100 potential Horizontal Granite Wash locations identified Horizontal well locations technically defined by geology and reservoir characteristics Majority of the Laredo Granite Wash program will have 2 horizontal wells or less per zone per section Laredo Acreage Laredo Horizontal Granite Wash Well Detailed geological mapping and engineering have resulted in consistent, high rate completions |
|
|
Dalhart Basin – Exploration Program 74,000 net acres Characterized by conventional shallow oil plays and several potential liquids-rich shale plays Targeted intervals are oil plays at depths of less than 7,000 feet Exploration upside potential Acquired 155 square miles of 3D seismic data Central Texas Panhandle – Operating Area 48,000 net acres Laredo operated JV with ExxonMobil in Hansford County Relatively shallow (<9,500 feet) natural gas targets Positive operating cash flow Eastern Anadarko Basin – Operating Area 37,300 net acres Multiple targets with depths between 8,000 and 22,000 feet which are predominantly dry natural gas Positive operating cash flow 18 OKLAHOMA Laredo continues adding to inventory through early-entry exploration, i.e., Dalhart Basin Midland Office Dallas Office Tulsa Headquarters TEXAS Other Exploration & Operating Areas |
|
|
Appendix |
|
|
Established track record in mature basins A 20-Year History of Generating Significant Value for Investors 20 ($ millions) Anadarko Kansas Permian Anadarko Permian Arkoma Permian Anadarko Permian Anadarko Focus Areas: Laredo Petroleum Latigo Petroleum, Inc. Lariat Petroleum, Inc. Colt Resources Corp. Sold to JN Resources in 1996 for $33.5 million Sold to Newfield in 2001 for $333 million Sold to Pogo Producing in 2006 for $750 million Founded in October 2006 Equity Investor: First Reserve Equity Investor: Warburg Pincus Equity Investors : Warburg Pincus JPMorgan Equity Investor: Warburg Pincus 1991 1992 1993 2001 1994 1995 1996 1997 1998 1999 2000 2002 2003 2004 2005 2006 2007 2008 2009 2010 2011 2012 |
|
|
Name Title Years in E&P Industry Years with “L” Companies Randy A. Foutch Chairman of the Board & Chief Executive Officer 35 14 Jerry R. Schuyler Director, President & Chief Operating Officer 33 4 W. Mark Womble SVP & Chief Financial Officer 32 8 Patrick J. Curth SVP - Exploration & Land 35 13 John E. Minton SVP - Reservoir Engineering 36 10 Rodney S. Myers SVP - Permian 33 5 Kenneth E. Dornblaser SVP & General Counsel 31 1 Experienced Leadership 21 Name Professional Association Peter R. Kagan Warburg Pincus, Managing Director James R. Levy Warburg Pincus, Principal B.Z. (Bill) Parker1 Phillips Petroleum Company, Former Executive Vice President Pamela S. Pierce1 Ztown Investments, Inc., Partner Ambassador Francis Rooney1 Rooney Holdings, Inc. & Manhattan Construction Group, Chief Executive Officer Edmund P. Segner, III1 EOG Resources, Former President, Chief of Staff & Director Donald D. Wolf1 Quantum Resources Management, LLC, Chairman 1Independent board members Non-Management Board Members Management |
|
|
Permian Basin: Identified Potential Drilling Locations 22 Large Inventory of Unbooked Potential Locations 1 PUD locations as identified in third party reserve report prepared by Ryder Scott for 6/30/11 2 IPD locations are recognized based on a combination of available geological, production and engineering data 3 Booked % represents PUD Locations as a proportion of Total Identified Potential Drilling Locations 4 Vertical wells assume 40 acre spacing 5 Horizontal wells assume 160 acre spacing + = Permian Basin PUD Locations in Ryder Scott Report Additional Identified Potential Drilling Locations (IPD) Total IPD Locations WELL TYPE FORMATION NAME DEPTH PUD LOCATIONS1 ADDITIONAL IPD LOCATIONS2 TOTAL IPD LOCATIONS %BOOKED3 Vertical4 Wolfberry 7,500-10,000’ 790 2,724 3,514 22% Horizontal5 Upper Wolfcamp 7,200-7,6000’ 0 500 500 Middle Wolfcamp 7,800-8,100’ 0 800 800 Cline 9,000-9,500’ 14 936 950 <1% Cline 9,000-9,500’ 14 936 950 Total Horizontal 14 2,236 2,250 Total 804 4,960 5,764 Development Phase Evauation Phase Development/Evaulation Phase As of 9/30/11 |
|
|
Anadarko Basin: Identified Potential Drilling Locations 23 Additional Inventory of Unbooked Horizontal Locations 1 PUD locations as identified in third party reserve report prepared by Ryder Scott for 6/30/11 2 IPD locations are recognized based on a combination of available geological, production and engineering data 3 Booked % represents PUD Locations as a proportion of Total Identified Potential Drilling Locations 4 Locations assume 40 acre spacing for the Granite Wash Vertical Program 5 The majority of the technically identified horizontal locations have 2 or less wells/zone/section Anadarko Locations PUD Locations in Ryder Scott Report Additional Identified Potential Drilling Locations (IPD) = Totall IPD Location WELL TYPE FORMATIONS NAME DEPTH PUD LOCATIONS1 + ADDITIONAL IPD LOCATIONS2 TOTAL IPD LOCATIONS % BOOKED3 Vertical4 Granite Wash 13800 184 59 243 76% Upper Morrow 14750 0 7 7 Horizontal5 Granite Wash 11,800-13,100 5 96 101 5% Total 189 162 351 Development Phase Evaluations Phase Development Phase/Evaluations Phase As of 09/30/11 |
|
|
$ millions, except per unit data 1 Prices included realized hedge revenue 2 See page 25 for a reconciliation of Adjusted EBITDA 3 Excludes nonrecurring fees related to the Broad Oak Energy, Inc. acquisition and the related increase in equity based compensation Financial & Operating Data 24 3 2008 2009 2010 Nine months ended 9/30/11 Key data: Realized oil price ($/Bbl)1 $91.93 $65.42 $77.26 $88.79 Realized natural gas price ($/Mcf)1 $7.83 $6.17 $6.32 $6.75 Average daily production (Boe/d) 4,226 9,762 14,278 22,842 Adjusted EBITDA2 $49.3 $104.9 $194.5 $283.9 Capital expenditures ($309.6) ($363.7) ($460.6) ($519.3) Per unit metrics ($/Boe): Lease operating expenses $4.16 $3.52 $4.16 $4.69 Production & ad valorem taxes $3.55 $1.72 $3.01 $3.74 Depreciation, depletion & amortization $21.41 $16.28 $18.69 $18.44 General & administrative $15.04 $6.31 $5.93 $4.15 |
|
|
($ thousands, unaudited) Adjusted EBITDA Reconciliation 25 For the years ended December 31, For the three months ended September 30, For the nine months ended September 30, 2008 2009 2010 2010 2011 2010 2011 Net income (loss) ($192,047) ($184,495) $86,248 $16,663 $58,246 $51,158 $103,988 Plus: Interest expense 4,410 7,464 18,482 5,941 12,810 11,869 35,062 Depreciation, depletion & amortization 33,102 58,005 97,411 23,724 39,059 60,363 114,976 Impairment of long-lived assets 282,587 246,669 – – – – 243 Write-off of deferred loan costs – – – – 2,949 – 6,195 Loss on disposal of assets 2 85 30 (2) – 30 35 Unrealized losses (gains) on derivative financial instruments (27,174) 46,003 11,648 580 (51,239) (12,023) (44,047) Realized losses (gains) on interest rate derivatives 278 3,764 5,238 1,306 1,176 3,929 3,732 Non-cash equity-based compensation 1,864 1,419 1,257 335 4,211 1,023 5,087 Income tax expense (benefit) (53,717) (74,006) (25,812) 1,390 32,842 7,170 58,579 Adjusted EBITDA $49,305 $104,908 $194,502 $49,907 $100,054 $123,519 $283,850 |
|
|
2012 Production and Expense Guidance 26 Production (MMBoe) 10.6 Lease Operating Expenses ($/Boe) $4.75 - $5.25 General and Administrative Expenses ($/Boe) $4.75 - $5.25 Production Taxes (% of oil and natural gas revenues) 7.50% Depreciation, Depletion and Amortization ($/Boe) $18.50 - $19.50 Price Realizations (pre-hedge, two-stream basis, % of NYMEX): Crude oil 95% Natural gas, including natural gas liquids 175% |
|
|
NYSE: LPI www.laredopetro.com |