Attached files
| file | filename |
|---|---|
| EX-99.1 - PRESS RELEASE - DCT Industrial Trust Inc. | d297948dex991.htm |
| 8-K - FORM 8-K - DCT Industrial Trust Inc. | d297948d8k.htm |
Exhibit 99.2

Fourth Quarter 2011
Supplemental Reporting Package
|
|
|
Table of Contents
| Quarterly Highlights |
2 | |||
| Consolidated Statements of Operations |
3 | |||
| Consolidated Balance Sheets |
4 | |||
| Funds from Operations |
5 | |||
| Selected Financial Data |
6 | |||
| Property Overview |
7-8 | |||
| Consolidated Leasing Summary |
9 | |||
| Acquisition and Disposition Summary |
10 | |||
| Development Overview |
11 | |||
| Indebtedness |
12 | |||
| Capitalization and Fixed Charge Coverage |
13 | |||
| Institutional Capital Management Summary |
14 | |||
| Definitions |
15-17 |
Forward Looking Statement
We make statements in this report that are considered “forward-looking statements” within the meaning of Section 27A of the Securities Act of 1933, as amended, or the Securities Act, and Section 21E of the Securities Exchange Act of 1934, as amended, or the Exchange Act, which are usually identified by the use of words such as “anticipates,” “believes,” “estimates,” “expects,” “intends,” “may,” “plans,” “projects,” “seeks,” “should,” “will,” and variations of such words or similar expressions. We intend these forward-looking statements to be covered by the safe harbor provisions for forward-looking statements contained in the Private Securities Litigation Reform Act of 1995 and are including this statement for purposes of complying with those safe harbor provisions. These forward-looking statements reflect our current views about our plans, intentions, expectations, strategies and prospects, which are based on the information currently available to us and on assumptions we have made. Although we believe that our plans, intentions, expectations, strategies and prospects as reflected in or suggested by those forward-looking statements are reasonable, we can give no assurance that the plans, intentions, expectations or strategies will be attained or achieved. Furthermore, actual results may differ materially from those described in the forward-looking statements and will be affected by a variety of risks and factors that are beyond our control including, without limitation:
| • | national, international, regional and local economic conditions, including, in particular, the continuing impact of the economic downturn and the strength of the economic recovery and the impact of the financial crisis in Europe; |
| • | the general level of interest rates and the availability of capital; |
| • | the competitive environment in which we operate; |
| • | real estate risks, including fluctuations in real estate values and the general economic climate in local markets and competition for tenants in such markets; |
| • | decreased rental rates or increasing vacancy rates; |
| • | defaults on or non-renewal of leases by tenants; |
| • | acquisition and development risks, including failure of such acquisitions and development projects to perform in accordance with projections; |
| • | the timing of acquisitions and dispositions; |
| • | natural disasters such as fires, tornadoes, hurricanes and earthquakes; |
| • | energy costs; |
| • | the terms of governmental regulations that affect us and interpretations of those regulations, including the cost of compliance with those regulations, changes in real estate and zoning laws and increases in real property tax rates; |
| • | financing risks, including the risk that our cash flows from operations may be insufficient to meet required payments of principal, interest and other commitments; |
| • | lack of or insufficient amounts of insurance; |
| • | litigation, including costs associated with prosecuting or defending claims and any adverse outcomes; |
| • | the consequences of future terrorist attacks or civil unrest; |
| • | environmental liabilities, including costs, fines or penalties that may be incurred due to necessary remediation of contamination of properties presently owned or previously owned by us; and |
| • | other risks and uncertainties detailed from time to time in our filings with the Securities and Exchange Commission. |
In addition, our current and continuing qualification as a real estate investment trust, or REIT, involves the application of highly technical and complex provisions of the Internal Revenue Code of 1986, or the Code, and depends on our ability to meet the various requirements imposed by the Code through actual operating results, distribution levels and diversity of stock ownership.
| Fourth Quarter 2011 |

|
Page 1 | ||
| Supplemental Reporting Package |
Quarterly Highlights
| (1) | Based on annualized base rent as of December 31, 2011. |
| (2) | Amounts are based on gross purchase price and include noncontrolling interests share of $9.8 million and land purchases totaling $25.7 million. |
| (3) | Amounts are as previously reported and not restated for current quarter same store pool. |
| Fourth Quarter 2011 |
|
Page 2 | ||
| Supplemental Reporting Package |
Consolidated Statements of Operations
(amounts in thousands, except per share data)
| Three Months Ended | Twelve Months Ended | |||||||||||||||
| December 31, | December 31, | |||||||||||||||
| 2011 | 2010 | 2011 | 2010 | |||||||||||||
| (unaudited) | (unaudited) | |||||||||||||||
| REVENUES: |
||||||||||||||||
| Rental revenues |
$ | 64,995 | $ | 56,780 | $ | 249,158 | $ | 225,699 | ||||||||
| Institutional capital management and other fees |
1,138 | 1,082 | 4,291 | 4,133 | ||||||||||||
|
|
|
|
|
|
|
|
|
|||||||||
| Total revenues |
66,133 | 57,862 | 253,449 | 229,832 | ||||||||||||
|
|
|
|
|
|
|
|
|
|||||||||
| OPERATING EXPENSES: |
||||||||||||||||
| Rental expenses |
8,702 | 7,862 | 34,217 | 32,389 | ||||||||||||
| Real estate taxes |
8,808 | 7,655 | 36,200 | 34,915 | ||||||||||||
| Real estate related depreciation and amortization |
31,106 | 28,186 | 124,244 | 110,373 | ||||||||||||
| General and administrative |
5,459 | 6,734 | 25,925 | 25,262 | ||||||||||||
| Impairment losses |
448 | 4,100 | 448 | 8,656 | ||||||||||||
| Casualty gains |
(33 | ) | — | (33 | ) | — | ||||||||||
|
|
|
|
|
|
|
|
|
|||||||||
| Total operating expenses |
54,490 | 54,537 | 221,001 | 211,595 | ||||||||||||
|
|
|
|
|
|
|
|
|
|||||||||
| Operating income |
11,643 | 3,325 | 32,448 | 18,237 | ||||||||||||
| OTHER INCOME AND EXPENSE: |
||||||||||||||||
| Equity in income (loss) of unconsolidated joint ventures, net |
894 | (786 | ) | (2,556 | ) | (2,986 | ) | |||||||||
| Impairment losses on investments in unconsolidated joint ventures |
(19 | ) | (216 | ) | (1,953 | ) | (216 | ) | ||||||||
| Loss on business combinations |
— | — | — | (395 | ) | |||||||||||
| Interest expense |
(17,104 | ) | (15,333 | ) | (63,941 | ) | (56,548 | ) | ||||||||
| Interest and other income (expense) |
(53 | ) | 245 | (310 | ) | 357 | ||||||||||
| Income tax benefit (expense) and other taxes |
(38 | ) | 137 | (144 | ) | (918 | ) | |||||||||
|
|
|
|
|
|
|
|
|
|||||||||
| Loss from continuing operations |
(4,677 | ) | (12,628 | ) | (36,456 | ) | (42,469 | ) | ||||||||
| Discontinued operations: |
||||||||||||||||
| Operating income and other expenses |
36 | 335 | 3,342 | 782 | ||||||||||||
| Gain (loss) on dispositions of real estate interests from discontinued operations |
4,271 | (600 | ) | 4,271 | (1,379 | ) | ||||||||||
|
|
|
|
|
|
|
|
|
|||||||||
| Income (loss) from discontinued operations |
4,307 | (265 | ) | 7,613 | (597 | ) | ||||||||||
|
|
|
|
|
|
|
|
|
|||||||||
| Loss before gain on dispositions of real estate interests |
(370 | ) | (12,893 | ) | (28,843 | ) | (43,066 | ) | ||||||||
| Gain on dispositions of real estate interests |
— | — | — | 13 | ||||||||||||
|
|
|
|
|
|
|
|
|
|||||||||
| Consolidated net loss of DCT Industrial Trust Inc. |
(370 | ) | (12,893 | ) | (28,843 | ) | (43,053 | ) | ||||||||
| Net loss attributable to noncontrolling interests |
207 | 1,698 | 3,593 | 5,223 | ||||||||||||
|
|
|
|
|
|
|
|
|
|||||||||
| Net loss attributable to common stockholders |
(163 | ) | (11,195 | ) | (25,250 | ) | (37,830 | ) | ||||||||
|
|
|
|
|
|
|
|
|
|||||||||
| Distributed and undistributed earnings allocated to participating securities |
(93 | ) | (117 | ) | (443 | ) | (480 | ) | ||||||||
|
|
|
|
|
|
|
|
|
|||||||||
| Adjusted net loss attributable to common stockholders |
$ | (256 | ) | $ | (11,312 | ) | $ | (25,693 | ) | $ | (38,310 | ) | ||||
|
|
|
|
|
|
|
|
|
|||||||||
| EARNINGS PER COMMON SHARE – BASIC AND DILUTED: |
||||||||||||||||
| Loss from continuing operations |
$ | (0.02 | ) | $ | (0.05 | ) | $ | (0.14 | ) | $ | (0.18 | ) | ||||
| Income (loss) from discontinued operations |
0.02 | (0.00 | ) | 0.03 | (0.00 | ) | ||||||||||
|
|
|
|
|
|
|
|
|
|||||||||
| Net loss attributable to common stockholders |
$ | (0.00 | ) | $ | (0.05 | ) | $ | (0.11 | ) | $ | (0.18 | ) | ||||
|
|
|
|
|
|
|
|
|
|||||||||
| WEIGHTED AVERAGE COMMON SHARES OUTSTANDING: |
||||||||||||||||
| Basic and diluted |
245,939 | 218,723 | 242,591 | 212,412 | ||||||||||||
|
|
|
|
|
|
|
|
|
|||||||||
| Fourth Quarter 2011 |
|
Page 3 | ||
| Supplemental Reporting Package |
Consolidated Balance Sheets
(amounts in thousands)
| December 31, 2011 |
December 31, 2010 |
|||||||
| (unaudited) | ||||||||
| ASSETS: |
||||||||
| Operating properties |
$ | 3,100,172 | $ | 2,954,754 | ||||
| Properties under development |
9,525 | 55,698 | ||||||
| Properties under redevelopment |
4,284 | 3,316 | ||||||
| Pre-development and land held for development |
47,082 | 23,668 | ||||||
|
|
|
|
|
|||||
| Total investment in properties |
3,161,063 | 3,037,436 | ||||||
| Less accumulated depreciation and amortization |
(589,314 | ) | (528,705 | ) | ||||
|
|
|
|
|
|||||
| Net investment in properties |
2,571,749 | 2,508,731 | ||||||
| Investments in and advances to unconsolidated joint ventures |
139,278 | 138,455 | ||||||
|
|
|
|
|
|||||
| Net investment in real estate |
2,711,027 | 2,647,186 | ||||||
| Cash and cash equivalents |
12,834 | 17,330 | ||||||
| Notes receivable |
1,053 | 1,222 | ||||||
| Deferred loan costs, net |
8,567 | 5,883 | ||||||
| Straight-line rent and other receivables, net |
42,349 | 33,278 | ||||||
| Other assets, net |
17,468 | 14,990 | ||||||
|
|
|
|
|
|||||
| Total assets |
$ | 2,793,298 | $ | 2,719,889 | ||||
|
|
|
|
|
|||||
| LIABILITIES AND EQUITY: |
||||||||
| Accounts payable and accrued expenses |
$ | 45,785 | $ | 38,354 | ||||
| Distributions payable |
19,057 | 17,458 | ||||||
| Tenant prepaids and security deposits |
22,864 | 20,759 | ||||||
| Other liabilities |
29,797 | 12,373 | ||||||
| Intangible lease liability, net |
18,897 | 18,748 | ||||||
| Line of credit |
— | 51,000 | ||||||
| Senior unsecured notes |
935,000 | 735,000 | ||||||
| Mortgage notes |
317,783 | 425,359 | ||||||
|
|
|
|
|
|||||
| Total liabilities |
1,389,183 | 1,319,051 | ||||||
| Total stockholders’ equity |
1,207,969 | 1,196,102 | ||||||
| Noncontrolling interests |
196,146 | 204,736 | ||||||
|
|
|
|
|
|||||
| Total liabilities and equity |
$ | 2,793,298 | $ | 2,719,889 | ||||
|
|
|
|
|
|||||
| Fourth Quarter 2011 |
|
Page 4 | ||
| Supplemental Reporting Package |
Funds From Operations
(unaudited, amounts in thousands, except per share and unit data)
| Three Months Ended | Twelve Months Ended | |||||||||||||||
| December 31, | December 31, | |||||||||||||||
| 2011 | 2010 | 2011 | 2010 | |||||||||||||
| Reconciliation of net loss attributable to common stockholders to FFO: |
||||||||||||||||
| Net loss attributable to common stockholders |
$ | (163 | ) | $ | (11,195 | ) | $ | (25,250 | ) | $ | (37,830 | ) | ||||
| Adjustments: |
||||||||||||||||
| Real estate related depreciation and amortization |
32,149 | 29,386 | 128,989 | 115,904 | ||||||||||||
| Equity in (income) loss of unconsolidated joint ventures, net |
(894 | ) | 786 | 2,556 | 2,986 | |||||||||||
| Equity in FFO of unconsolidated joint ventures |
2,613 | 921 | 4,732 | 4,001 | ||||||||||||
| Loss on business combinations |
— | — | — | 395 | ||||||||||||
| Impairment losses on depreciable real estate |
8,226 | 599 | 10,160 | 8,012 | ||||||||||||
| Gain on dispositions of real estate interests |
(12,030 | ) | — | (12,030 | ) | (2,091 | ) | |||||||||
| Gain on dispositions of non-depreciable real estate |
— | — | — | 13 | ||||||||||||
| Noncontrolling interest in the operating partnership’s share of the above adjustments |
(3,399 | ) | (3,283 | ) | (14,252 | ) | (13,426 | ) | ||||||||
| FFO attributable to unitholders |
2,965 | 1,941 | 9,901 | 8,678 | ||||||||||||
|
|
|
|
|
|
|
|
|
|||||||||
| FFO attributable to common stockholders and unitholders, basic and diluted (1) |
29,467 | 19,155 | 104,806 | 86,642 | ||||||||||||
|
|
|
|
|
|
|
|
|
|||||||||
| Adjustments: |
||||||||||||||||
| Acquisition costs(2) |
493 | 706 | 1,902 | 1,228 | ||||||||||||
| Debt modification costs |
— | — | — | 1,136 | ||||||||||||
| Impairment losses on non-depreciable real estate(2) |
— | 3,992 | — | 3,992 | ||||||||||||
|
|
|
|
|
|
|
|
|
|||||||||
| FFO, as adjusted, attributable to common stockholders and unitholders, basic and diluted |
$ | 29,960 | $ | 23,853 | $ | 106,708 | $ | 92,998 | ||||||||
|
|
|
|
|
|
|
|
|
|||||||||
| FFO per common share and unit, basic and diluted |
$ | 0.11 | $ | 0.08 | $ | 0.39 | $ | 0.36 | ||||||||
|
|
|
|
|
|
|
|
|
|||||||||
| FFO, as adjusted, per common share and unit, basic and diluted |
$ | 0.11 | $ | 0.10 | $ | 0.40 | $ | 0.39 | ||||||||
|
|
|
|
|
|
|
|
|
|||||||||
| FFO weighted average common shares and units outstanding: |
||||||||||||||||
| Common shares for earnings per share – basic |
245,939 | 218,723 | 242,591 | 212,412 | ||||||||||||
| Participating securities |
1,368 | 1,722 | 1,601 | 1,689 | ||||||||||||
| Units |
25,626 | 25,721 | 25,310 | 26,351 | ||||||||||||
|
|
|
|
|
|
|
|
|
|||||||||
| FFO weighted average common shares, participating securities and units outstanding - basic |
272,933 | 246,166 | 269,502 | 240,452 | ||||||||||||
| Dilutive common stock equivalents |
431 | 401 | 449 | 357 | ||||||||||||
|
|
|
|
|
|
|
|
|
|||||||||
| FFO weighted average common shares, participating securities and units outstanding - diluted |
273,364 | 246,567 | 269,951 | 240,809 | ||||||||||||
|
|
|
|
|
|
|
|
|
|||||||||
| (1) | Funds from operations, FFO, as defined by the National Association of Real Estate Investment Trusts (NAREIT). |
| (2) | Excluding amounts attributable to noncontrolling interests. |
| Fourth Quarter 2011 |
|
Page 5 | ||
| Supplemental Reporting Package |
Selected Financial Data
(unaudited, amounts in thousands)
| Three Months Ended | Twelve Months Ended | |||||||||||||||
| December 31, | December 31, | |||||||||||||||
| 2011 | 2010 | 2011 | 2010 | |||||||||||||
| NET OPERATING INCOME:(1) |
||||||||||||||||
| Rental revenues |
$ | 64,995 | $ | 56,780 | $ | 249,158 | $ | 225,699 | ||||||||
| Rental expenses and real estate taxes |
(17,510 | ) | (15,517 | ) | (70,417 | ) | (67,304 | ) | ||||||||
|
|
|
|
|
|
|
|
|
|||||||||
| Net operating income(2) |
$ | 47,485 | $ | 41,263 | $ | 178,741 | $ | 158,395 | ||||||||
|
|
|
|
|
|
|
|
|
|||||||||
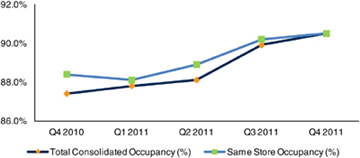
| TOTAL CONSOLIDATED PROPERTIES:(3) |
||||||||||||||||
| Square feet as of period end |
58,255 | 57,777 | 58,255 | 57,777 | ||||||||||||
| Average occupancy |
90.1 | % | 86.1 | % | 88.6 | % | 82.9 | % | ||||||||
| Occupancy as of period end |
90.5 | % | 87.4 | % | 90.5 | % | 87.4 | % | ||||||||
| CONSOLIDATED OPERATING PROPERTIES:(3) |
||||||||||||||||
| Square feet as of period end |
58,099 | 56,652 | 58,099 | 56,652 | ||||||||||||
| Average occupancy |
90.0 | % | 88.0 | % | 88.8 | % | 87.0 | % | ||||||||
| Occupancy as of period end |
90.6 | % | 88.9 | % | 90.6 | % | 88.9 | % | ||||||||
| SAME STORE OPERATING PROPERTIES:(1) |
||||||||||||||||
| Square feet as of period end |
51,957 | 51,957 | 49,713 | 49,713 | ||||||||||||
| Average occupancy |
90.3 | % | 88.0 | % | 89.0 | % | 86.8 | % | ||||||||
| Occupancy as of period end |
90.9 | % | 88.8 | % | 90.5 | % | 88.3 | % | ||||||||
| Rental revenues |
$ | 56,900 | $ | 55,765 | $ | 216,341 | $ | 217,561 | ||||||||
| Rental expenses and real estate taxes |
(15,510 | ) | (14,753 | ) | (61,619 | ) | (62,712 | ) | ||||||||
|
|
|
|
|
|
|
|
|
|||||||||
| Same store net operating income |
41,390 | 41,012 | 154,722 | 154,849 | ||||||||||||
| Less: revenue from lease terminations |
(179 | ) | (96 | ) | (616 | ) | (426 | ) | ||||||||
|
|
|
|
|
|
|
|
|
|||||||||
| Net operating income (excluding revenue from lease terminations) |
41,211 | 40,916 | 154,106 | 154,423 | ||||||||||||
|
|
|
|
|
|
|
|
|
|||||||||
| Less: straight-line rents, net of related bad debt expense |
(1,460 | ) | (1,610 | ) | (5,092 | ) | (4,291 | ) | ||||||||
| Add back: amortization of above/(below) market rents |
(168 | ) | (17 | ) | (467 | ) | 85 | |||||||||
|
|
|
|
|
|
|
|
|
|||||||||
| Cash net operating income (excluding revenue from lease terminations) |
$ | 39,583 | $ | 39,289 | $ | 148,547 | $ | 150,217 | ||||||||
|
|
|
|
|
|
|
|
|
|||||||||
| Net operating income growth (excluding revenue from lease terminations) |
0.7 | % | — | (0.2 | )% | — | ||||||||||
| Cash net operating income growth (excluding revenue from lease terminations) |
0.7 | % | — | (1.1 | )% | — | ||||||||||
| SUPPLEMENTAL CONSOLIDATED CASH FLOW AND OTHER INFORMATION: |
||||||||||||||||
| Straight-line rents - increase to revenue, net of related bad debt expense(3) |
$ | 2,567 | $ | 1,849 | $ | 9,519 | $ | 5,687 | ||||||||
| Straight-line rent receivable (balance sheet)(3) |
$ | 35,300 | $ | 27,138 | $ | 35,300 | $ | 27,138 | ||||||||
| Net amortization of above/(below) market rents – increase (decrease) to revenue(3) |
$ | 242 | $ | 28 | $ | 617 | $ | (211 | ) | |||||||
| Capitalized interest |
$ | 537 | $ | 359 | $ | 2,670 | $ | 2,162 | ||||||||
| Stock-based compensation amortization |
$ | 831 | $ | 1,246 | $ | 4,587 | $ | 4,828 | ||||||||
| Revenue from lease terminations(3) |
$ | 179 | $ | 104 | $ | 636 | $ | 674 | ||||||||
| Bad debt expense, excluding bad debt expense related to straight-line rents(3) |
$ | 137 | $ | 163 | $ | 828 | $ | 1,117 | ||||||||
| CONSOLIDATED CAPITAL EXPENDITURES:(3) |
||||||||||||||||
| Development and acquisition capital |
$ | 8,855 | $ | 7,515 | $ | 19,319 | $ | 22,775 | ||||||||
| Building and land improvements |
5,204 | 6,101 | 11,231 | 14,925 | ||||||||||||
| Tenant improvements and leasing costs |
13,529 | 11,107 | 37,968 | 23,513 | ||||||||||||
|
|
|
|
|
|
|
|
|
|||||||||
| Total capital expenditures |
$ | 27,588 | $ | 24,723 | $ | 68,518 | $ | 61,213 | ||||||||
|
|
|
|
|
|
|
|
|
|||||||||
| (1) | Excludes discontinued operations. |
| (2) | See Definitions for reconciliation of net operating income to loss from continuing operations. |
| (3) | Includes discontinued operations. |
| Fourth Quarter 2011 |
|
Page 6 | ||
| Supplemental Reporting Package |
Property Overview
As of December 31, 2011
| Markets |
Number of Buildings |
Percent Owned (1) |
Square Feet |
Percentage of Total Square Feet |
Occupancy Percentage |
Annualized Base Rent(2) |
Percentage of Total Annualized Base Rent |
|||||||||||||||||||||
| (in thousands) | (in thousands) | |||||||||||||||||||||||||||
| CONSOLIDATED OPERATING |
||||||||||||||||||||||||||||
| Atlanta |
52 | 100.0 | % | 6,592 | 11.4 | % | 95.3 | % | $ | 19,318 | 9.8 | % | ||||||||||||||||
| Baltimore/Washington D.C |
17 | 100.0 | % | 2,057 | 3.5 | % | 87.6 | % | 9,185 | 4.7 | % | |||||||||||||||||
| Central Pennsylvania |
8 | 100.0 | % | 1,453 | 2.5 | % | 74.0 | % | 4,282 | 2.2 | % | |||||||||||||||||
| Charlotte |
1 | 100.0 | % | 80 | 0.1 | % | 0.0 | % | — | 0.0 | % | |||||||||||||||||
| Chicago |
19 | 100.0 | % | 3,570 | 6.1 | % | 97.5 | % | 10,436 | 5.3 | % | |||||||||||||||||
| Cincinnati |
32 | 100.0 | % | 4,491 | 7.7 | % | 86.9 | % | 12,031 | 6.1 | % | |||||||||||||||||
| Columbus |
14 | 100.0 | % | 4,301 | 7.4 | % | 84.6 | % | 9,505 | 4.8 | % | |||||||||||||||||
| Dallas |
46 | 100.0 | % | 4,288 | 7.4 | % | 84.9 | % | 13,998 | 7.1 | % | |||||||||||||||||
| Denver |
2 | 100.0 | % | 278 | 0.5 | % | 100.0 | % | 1,247 | 0.6 | % | |||||||||||||||||
| Houston |
49 | 100.0 | % | 3,414 | 5.9 | % | 96.4 | % | 17,462 | 8.8 | % | |||||||||||||||||
| Indianapolis |
7 | 100.0 | % | 2,299 | 4.0 | % | 99.2 | % | 6,938 | 3.5 | % | |||||||||||||||||
| Louisville |
4 | 100.0 | % | 1,330 | 2.3 | % | 99.3 | % | 4,195 | 2.1 | % | |||||||||||||||||
| Memphis |
11 | 100.0 | % | 5,218 | 9.0 | % | 97.8 | % | 13,871 | 7.1 | % | |||||||||||||||||
| Mexico |
15 | 100.0 | % | 1,653 | 2.8 | % | 93.3 | % | 6,472 | 3.3 | % | |||||||||||||||||
| Miami |
6 | 100.0 | % | 762 | 1.3 | % | 94.0 | % | 4,972 | 2.5 | % | |||||||||||||||||
| Nashville |
4 | 100.0 | % | 1,839 | 3.2 | % | 77.0 | % | 3,253 | 1.6 | % | |||||||||||||||||
| New Jersey |
12 | 100.0 | % | 1,669 | 2.9 | % | 79.3 | % | 7,161 | 3.6 | % | |||||||||||||||||
| Northern California |
25 | 100.0 | % | 2,784 | 4.8 | % | 87.2 | % | 13,835 | 7.0 | % | |||||||||||||||||
| Orlando |
20 | 100.0 | % | 1,864 | 3.2 | % | 79.9 | % | 5,704 | 2.9 | % | |||||||||||||||||
| Phoenix |
14 | 100.0 | % | 1,718 | 3.0 | % | 83.0 | % | 4,989 | 2.5 | % | |||||||||||||||||
| San Antonio |
13 | 100.0 | % | 1,176 | 2.0 | % | 97.8 | % | 3,868 | 2.0 | % | |||||||||||||||||
| Seattle |
9 | 100.0 | % | 1,421 | 2.4 | % | 86.3 | % | 5,607 | 2.9 | % | |||||||||||||||||
| Southern California |
28 | 89.0 | % | 3,842 | 6.6 | % | 99.2 | % | 18,992 | 9.6 | % | |||||||||||||||||
|
|
|
|
|
|
|
|
|
|
|
|
|
|
|
|||||||||||||||
| Total/weighted average—operating properties |
408 | 99.3 | % | 58,099 | 100.0 | % | 90.6 | % | 197,321 | 100.0 | % | |||||||||||||||||
|
|
|
|
|
|
|
|
|
|
|
|
|
|
|
|||||||||||||||
| CONSOLIDATED REDEVELOPMENT PROPERTIES: |
||||||||||||||||||||||||||||
| Chicago |
1 | 100.0 | % | 156 | 100.0 | % | 78.7 | % | 100 | N/A | ||||||||||||||||||
|
|
|
|
|
|
|
|
|
|
|
|
|
|
|
|||||||||||||||
| Total/weighted average – redevelopment properties |
1 | 100.0 | % | 156 | 100.0 | % | 78.7 | % | 100 | N/A | ||||||||||||||||||
|
|
|
|
|
|
|
|
|
|
|
|
|
|
|
|||||||||||||||
| Total/weighted average—consolidated properties |
409 | 99.3 | % | 58,255 | 100.0 | % | 90.5 | % | $ | 197,421 | (3) | N/A | ||||||||||||||||
|
|
|
|
|
|
|
|
|
|
|
|
|
|
|
|||||||||||||||
Continued on next page
See footnote definitions on next page.
| Fourth Quarter 2011 |
|
Page 7 | ||
| Supplemental Reporting Package |
Property Overview
(continued)
As of December 31, 2011
| Markets |
Number of Buildings |
Percent Owned (1) |
Square Feet | Percentage of Total Square Feet |
Occupancy Percentage |
Annualized Base Rent(2) |
Percentage of Total Annualized Base Rent |
|||||||||||||||||||||
| (in thousands) | (in thousands) | |||||||||||||||||||||||||||
| UNCONSOLIDATED OPERATING PROPERTIES |
|
|||||||||||||||||||||||||||
| IDI (Chicago, Nashville, Savannah) |
3 | 50.0 | % | 1,423 | 41.8 | % | 44.9 | % | — | — | ||||||||||||||||||
| Southern California Logistics Airport(4) |
6 | 50.0 | % | 1,983 | 58.2 | % | 95.4 | % | 3,632 | 100.0 | % | |||||||||||||||||
|
|
|
|
|
|
|
|
|
|
|
|
|
|
|
|||||||||||||||
| Total/weighted average |
9 | 50.0 | % | 3,406 | 100.0 | % | 74.3 | % | 3,632 | 100.0 | % | |||||||||||||||||
|
|
|
|
|
|
|
|
|
|
|
|
|
|
|
|||||||||||||||
| OPERATING PROPERTIES IN FUNDS |
||||||||||||||||||||||||||||
| Atlanta |
2 | 17.2 | % | 703 | 5.3 | % | 80.4 | % | 1,391 | 3.3 | % | |||||||||||||||||
| Central Pennsylvania |
4 | 8.6 | % | 1,210 | 9.1 | % | 96.7 | % | 4,836 | 11.3 | % | |||||||||||||||||
| Charlotte |
1 | 4.4 | % | 472 | 3.5 | % | 100.0 | % | 1,510 | 3.5 | % | |||||||||||||||||
| Chicago |
4 | 18.1 | % | 1,525 | 11.5 | % | 100.0 | % | 6,009 | 14.1 | % | |||||||||||||||||
| Cincinnati |
4 | 15.6 | % | 1,243 | 9.3 | % | 94.7 | % | 3,761 | 8.8 | % | |||||||||||||||||
| Columbus |
2 | 6.3 | % | 451 | 3.4 | % | 100.0 | % | 1,318 | 3.1 | % | |||||||||||||||||
| Dallas |
4 | 16.8 | % | 1,726 | 13.0 | % | 86.0 | % | 4,914 | 11.5 | % | |||||||||||||||||
| Denver |
5 | 20.0 | % | 773 | 5.8 | % | 89.3 | % | 3,171 | 7.4 | % | |||||||||||||||||
| Indianapolis |
1 | 11.4 | % | 475 | 3.6 | % | 100.0 | % | 1,785 | 4.2 | % | |||||||||||||||||
| Louisville |
5 | 10.0 | % | 900 | 6.7 | % | 100.0 | % | 2,557 | 6.0 | % | |||||||||||||||||
| Memphis |
1 | 20.0 | % | 1,039 | 7.8 | % | 74.1 | % | 2,331 | 5.5 | % | |||||||||||||||||
| Minneapolis |
3 | 4.4 | % | 472 | 3.5 | % | 100.0 | % | 2,339 | 5.5 | % | |||||||||||||||||
| Nashville |
2 | 20.0 | % | 1,020 | 7.7 | % | 44.7 | % | 1,373 | 3.2 | % | |||||||||||||||||
| New Jersey |
2 | 10.7 | % | 216 | 1.6 | % | 96.3 | % | 968 | 2.2 | % | |||||||||||||||||
| Northern California |
1 | 4.4 | % | 396 | 3.0 | % | 100.0 | % | 1,758 | 4.1 | % | |||||||||||||||||
| Orlando |
2 | 20.0 | % | 696 | 5.2 | % | 100.0 | % | 2,688 | 6.3 | % | |||||||||||||||||
|
|
|
|
|
|
|
|
|
|
|
|
|
|
|
|||||||||||||||
| Total/weighted average – fund operating properties |
43 | 14.6 | % | 13,317 | 100.0 | % | 89.4 | % | 42,709 | 100.0 | % | |||||||||||||||||
|
|
|
|
|
|
|
|
|
|
|
|
|
|
|
|||||||||||||||
| Total/weighted average – unconsolidated properties |
52 | 21.8 | % | 16,723 | 100.0 | % | 86.3 | % | $ | 46,341 | 100.0 | % | ||||||||||||||||
|
|
|
|
|
|
|
|
|
|
|
|
|
|
|
|||||||||||||||
| OPERATING PROPERTIES ASSET-MANAGED ONLY |
||||||||||||||||||||||||||||
| Atlanta |
1 | — | 491 | 100.0 | % | 100.0 | % | N/A | N/A | |||||||||||||||||||
|
|
|
|
|
|
|
|
|
|
|
|
|
|
|
|||||||||||||||
| SUMMARY |
||||||||||||||||||||||||||||
| Total/weighted average—consolidated/ unconsolidated operating properties |
460 | 82.0 | % | 74,822 | 99.1 | % | 89.6 | % | $ | 243,662 | N/A | |||||||||||||||||
| Total/weighted average—consolidated redevelopment properties |
1 | 100.0 | % | 156 | 0.2 | % | 78.7 | % | 100 | N/A | ||||||||||||||||||
| Total/weighted average—asset managed only properties |
1 | — | 491 | 0.7 | % | 100.0 | % | N/A | N/A | |||||||||||||||||||
|
|
|
|
|
|
|
|
|
|
|
|
|
|
|
|||||||||||||||
| Total/weighted average—all properties |
462 | 81.5 | % | 75,469 | 100.0 | % | 89.7 | % | $ | 243,762 | N/A | |||||||||||||||||
|
|
|
|
|
|
|
|
|
|
|
|
|
|
|
|||||||||||||||
| (1) | Percent owned is based on equity ownership weighted by square feet. |
| (2) | Excludes future contractual rent increases and decreases. |
| (3) | Excludes total annualized base rent associated with tenants in free rent periods of $5.6 million based on the first month’s cash base rent. |
| (4) | Although we contributed 100% of the initial cash equity capital required by the venture, after return of certain preferential distributions on capital invested, profits and losses are generally split 50/50. |
| Fourth Quarter 2011 |
|
Page 8 | ||
| Supplemental Reporting Package |
Consolidated Leasing Summary
Leasing Statistics(1)
| Number of Leases Signed |
Square Feet Signed |
Cash Basis Rent Growth |
GAAP Basis Rent Growth |
Weighted Average Lease Term(2) |
Turnover Costs |
Turnover Costs Per Square Foot |
||||||||||||||||||||||
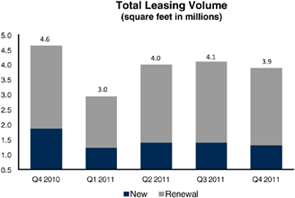
| FOURTH QUARTER 2011 |
||||||||||||||||||||||||||||
| New |
43 | 1,248 | -12.5 | % | -5.2 | % | 66 | $ | 4,468 | $ | 3.58 | |||||||||||||||||
| Renewal |
31 | 2,558 | -7.5 | % | 4.9 | % | 78 | 3,428 | 1.34 | |||||||||||||||||||
| Development and redevelopment |
1 | 54 | N/A | N/A | 63 | N/A | N/A | |||||||||||||||||||||
|
|
|
|
|
|
|
|
|
|
|
|
|
|
|
|||||||||||||||
| Total/Weighted Average |
75 | 3,860 | -8.1 | % | 3.8 | % | 74 | $ | 7,896 | $ | 2.09 | |||||||||||||||||
|
|
|
|
|
|
|
|
|
|
|
|
|
|
|
|||||||||||||||
| Weighted Average Retention |
75.7 | % | ||||||||||||||||||||||||||
|
|
|
|||||||||||||||||||||||||||
| YEAR TO DATE |
||||||||||||||||||||||||||||
| New |
159 | 5,030 | -14.9 | % | -8.3 | % | 68 | $ | 14,839 | $ | 2.95 | |||||||||||||||||
| Renewal |
170 | 9,565 | -7.3 | % | 0.1 | % | 51 | 11,095 | 1.16 | |||||||||||||||||||
| Development and redevelopment |
4 | 315 | N/A | N/A | 56 | N/A | N/A | |||||||||||||||||||||
|
|
|
|
|
|
|
|
|
|
|
|
|
|
|
|||||||||||||||
| Total/Weighted Average |
333 | 14,910 | -8.3 | % | -0.9 | % | 57 | $ | 25,934 | $ | 1.78 | |||||||||||||||||
|
|
|
|
|
|
|
|
|
|
|
|
|
|
|
|||||||||||||||
| Weighted Average Retention |
74.1 | % | ||||||||||||||||||||||||||
|
|
|
|||||||||||||||||||||||||||
Lease Expirations for Consolidated Properties as of December 31, 2011(2)
| Year |
Square Feet Related to Expiring Leases |
Annualized Base Rent of Expiring Leases(3) |
Percentage of Total Annualized Base Rent |
|||||||||
| (in thousands) | (in thousands) | |||||||||||
|
2012(4) |
10,591 | $ | 40,551 | 20.3 | % | |||||||
| 2013 |
8,986 | 38,535 | 19.2 | % | ||||||||
| 2014 |
8,218 | 31,882 | 15.9 | % | ||||||||
| 2015 |
6,936 | 25,319 | 12.7 | % | ||||||||
| 2016 |
6,527 | 25,222 | 12.6 | % | ||||||||
| Thereafter |
11,482 | 38,569 | 19.3 | % | ||||||||
|
|
|
|
|
|
|
|||||||
| Total occupied |
52,740 | $ | 200,078 | 100.0 | % | |||||||
|
|
|
|
|
|
|
|||||||
| Available or leased not occupied |
5,515 | |||||||||||
|
|
|
|||||||||||
| Total consolidated properties |
58,255 | |||||||||||
|
|
|
|||||||||||
| (1) | Does not include month-to-month leases. |
| (2) | Assumes no exercise of lease renewal options, if any. |
| (3) | Includes contractual rent changes. |
| (4) | Includes month-to-month leases. |
| Fourth Quarter 2011 |
|
Page 9 | ||
| Supplemental Reporting Package |
Acquisition and Disposition Summary
For the Twelve Months Ended December 31, 2011
| Property Name |
Size | Occupancy at Acquisition/ Disposition |
Occupancy at December 31, 2011 |
Market | ||||||||||||
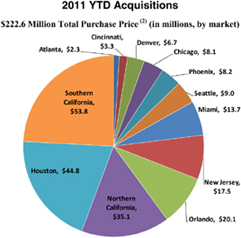
| ACQUISITIONS: |
||||||||||||||||
| January |
Palmyrita (2 buildings)(1) | 191,000 sq. ft. | 88.5 | % | 88.5 | % | Southern California | |||||||||
| January |
6th & Rochester(1) | 173,000 sq. ft. | 100.0 | % | 100.0 | % | Southern California | |||||||||
| January |
101 Railroad Avenue | 330,000 sq. ft. | 100.0 | % | 100.0 | % | New Jersey | |||||||||
| January |
13780 Central Avenue(2) | 190,000 sq. ft. | — | 100.0 | % | Southern California | ||||||||||
| February |
8551 NW 30th Terrace | 100,000 sq. ft. | 100.0 | % | 100.0 | % | Miami | |||||||||
| March |
3001 Directors Row | 50,000 sq. ft. | 100.0 | % | 100.0 | % | Orlando | |||||||||
| April |
450 S Lombard Road(2) | 156,000 sq. ft. | 35.0 | % | 78.7 | % | Chicago | |||||||||
| April |
8190 Byron Rd. | 72,000 sq. ft. | 100.0 | % | 100.0 | % | Southern California | |||||||||
| June |
4625 N 45th Ave. | 245,000 sq. ft. | 100.0 | % | 100.0 | % | Phoenix | |||||||||
| July |
1700 DeSoto Place | 82,000 sq. ft. | 100.0 | % | 100.0 | % | Southern California | |||||||||
| July |
2440 Pleasantdale | 77,000 sq. ft. | 100.0 | % | 75.0 | % | Atlanta | |||||||||
| July |
Pan American Land (Phase 1) | 7.3 acres | N/A | N/A | Miami | |||||||||||
| July |
Slover Land | 28.3 acres | N/A | N/A | Southern California | |||||||||||
| August |
5330 Pecos Street | 118,000 sq. ft. | 100.0 | % | 100.0 | % | Denver | |||||||||
| August |
Beltway Portfolio (7 buildings) | 383,000 sq. ft. | 95.2 | % | 100.0 | % | Houston | |||||||||
| August |
DCT Port Union Land (Phase 2) | 46.3 acres | N/A | N/A | Cincinnati | |||||||||||
| September |
Orlando Portfolio (3 buildings) | 421,000 sq. ft. | 60.5 | % | 60.5 | % | Orlando | |||||||||
| October |
1110 SW 27th Street | 121,000 sq. ft. | 100.0 | % | 100.0 | % | Seattle | |||||||||
| November |
1625 Rollins Road | 255,000 sq. ft. | 100.0 | % | 100.0 | % | Northern California | |||||||||
| December |
1045 Greens Parkway | 69,000 sq. ft. | 100.0 | % | 100.0 | % | Houston | |||||||||
| December |
Airtex Land | 13.0 acres | N/A | N/A | Houston | |||||||||||
| December |
2201 Arthur Avenue | 107,000 sq. ft. | 100.0 | % | 100.0 | % | Chicago | |||||||||
| December |
Pan American Land (Phase 2) | 7.3 acres | N/A | N/A | Miami | |||||||||||
| Total YTD Purchase Price—$222.6 million(3) |
||||||||||||||||
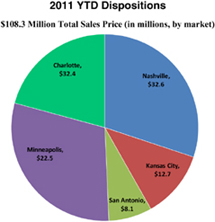
| DISPOSITIONS (4): |
||||||||||||||||
| November |
Minneapolis Portfolio (3 buildings) | 356,000 sq. ft. | 100.0 | % | N/A | Minneapolis | ||||||||||
| November |
2440-50 Midpoint Drive | 225,000 sq. ft. | 100.0 | % | N/A | Kansas City | ||||||||||
| December |
201 Bridgestone Parkway | 988,000 sq. ft. | 100.0 | % | N/A | Nashville | ||||||||||
| December |
San Antonio Portfolio (2 buildings) | 172,000 sq. ft. | 77.0 | % | N/A | San Antonio | ||||||||||
| December |
Charlotte Portfolio (9 buildings) | 925,000 sq. ft. | 74.0 | % | N/A | Charlotte | ||||||||||
| Total YTD Sales Price—$108.3 million |
||||||||||||||||
| (1) | DCT consolidates these properties with a 52.6% weighted average ownership. |
| (2) | Acquisition of redevelopment property. |
| (3) | Amounts are based on gross purchase price and include $9.8 million of noncontrolling interest. |
| (4) | Properties included are consolidated properties and do not include dispositions made by our joint venture funds. |
| Fourth Quarter 2011 |
|
Page 10 | ||
| Supplemental Reporting Package |
Development Overview
As of December 31, 2011
| Project |
Market | Acres | Number
of Buildings |
Square Feet | Percent Owned |
Costs Incurred | Total Projected Investment |
Expected Completion |
Percentage Leased |
|||||||||||||||||||||||||||||||
| Q4 2011 | Cumulative | |||||||||||||||||||||||||||||||||||||||
| (in thousands) | (in thousands) | (in thousands) | ||||||||||||||||||||||||||||||||||||||
| UNDER CONSTRUCTION: |
||||||||||||||||||||||||||||||||||||||||
| Dulles Summit Distribution Phase 2 |
|
Baltimore/ Washington D.C. |
|
13 | 2 | 178 | 95 | % | $ | 4,599 | $ | 9,525 | $ | 17,712 | Q1-2012 | — | ||||||||||||||||||||||||
| Northwest 8 Distribution Center (1) |
Houston | 16 | 1 | 267 | — | 15 | 38 | 13,565 | Q2-2012 | — | ||||||||||||||||||||||||||||||
|
|
|
|
|
|
|
|
|
|
|
|
|
|||||||||||||||||||||||||||||
| TOTAL | 29 | 3 | 445 | $ | 4,614 | $ | 9,563 | $ | 31,277 | |||||||||||||||||||||||||||||||
|
|
|
|
|
|
|
|
|
|
|
|
|
|||||||||||||||||||||||||||||
| Yield – Under Construction (projected): |
9.0 | % | ||||||||||||||||||||||||||||||||||||||
|
|
|
|||||||||||||||||||||||||||||||||||||||
| PREDEVELOPMENT: |
||||||||||||||||||||||||||||||||||||||||
| 8th & Vineyard |
So. California | 19 | 91 | % | $ | 202 | $ | 5,518 | ||||||||||||||||||||||||||||||||
| Slover |
So. California | 28 | 100 | % | 276 | 14,359 | ||||||||||||||||||||||||||||||||||
| Pan American Land Phase 1 & 2 |
Miami | 15 | 100 | % | 3,591 | 7,207 | ||||||||||||||||||||||||||||||||||
| DCT Airtex Industrial Center |
Houston | 13 | 100 | % | 2,633 | 2,633 | ||||||||||||||||||||||||||||||||||
| Southern California Logistics Airport |
So. California | 209 | 50 | % | 125 | 3,602 | ||||||||||||||||||||||||||||||||||
|
|
|
|
|
|
|
|||||||||||||||||||||||||||||||||||
| TOTAL | 284 | $ | 6,827 | $ | 33,139 | |||||||||||||||||||||||||||||||||||
|
|
|
|
|
|
|
|||||||||||||||||||||||||||||||||||
| (1) | This project is a forward purchase commitment with an unrelated third party to acquire an industrial facility upon its completion. |
| Fourth Quarter 2011 |
|
Page 11 | ||
| Supplemental Reporting Package |
Indebtedness
(dollar amounts in thousands)
As of December 31, 2011
| Description |
Stated Interest Rate |
Effective Interest Rate |
Maturity Date | Balance as of 12/31/2011 |
||||||||||
| SENIOR UNSECURED NOTES: |
||||||||||||||
| 2013 Notes, fixed rate |
6.11 | % | 6.36 | % | June 2013 | $ | 175,000 | |||||||
| 2014 Notes, fixed rate |
5.68 | % | 6.03 | % | January 2014 | 50,000 | ||||||||
| 2015 Notes, fixed rate |
5.63 | % | 5.63 | % | June 2015 | 40,000 | ||||||||
| 2015 Notes, variable rate(1) |
2.63 | % | 2.63 | % | June 2015 | 175,000 | ||||||||
| 2016 Notes, fixed rate |
4.90 | % | 4.89 | % | April & August 2016 | 99,000 | ||||||||
| 2017 Notes, fixed rate |
6.31 | % | 6.31 | % | June 2017 | 51,000 | ||||||||
| 2018 Notes, fixed rate |
5.62 | % | 5.62 | % | June & August 2018 | 81,500 | ||||||||
| 2019 Notes, fixed rate |
4.97 | % | 4.97 | % | August 2019 | 46,000 | ||||||||
| 2020 Notes, fixed rate |
5.43 | % | 5.43 | % | April 2020 | 50,000 | ||||||||
| 2021 Notes, fixed rate |
6.70 | % | 6.70 | % | June & August 2021 | 92,500 | ||||||||
| 2022 Notes, fixed rate |
5.50 | % | 5.50 | % | August 2022 | 40,000 | ||||||||
| 2023 Notes, fixed rate |
5.57 | % | 5.57 | % | August 2023 | 35,000 | ||||||||
|
|
|
|||||||||||||
| 935,000 | ||||||||||||||
|
|
|
|||||||||||||
| MORTGAGE NOTES: |
||||||||||||||
| Fixed rate secured debt |
5.91 | % | 5.69 | % | Sept. 2012 – Aug. 2025 | 315,192 | ||||||||
| Premiums (discounts), net of amortization |
2,591 | |||||||||||||
|
|
|
|||||||||||||
| 317,783 | ||||||||||||||
|
|
|
|||||||||||||
| UNSECURED CREDIT FACILITY: |
||||||||||||||
| Senior unsecured revolving credit facility(2) |
N/A | N/A | June 2015 | — | ||||||||||
|
|
|
|||||||||||||
| Total carrying value of consolidated debt |
$ | 1,252,783 | ||||||||||||
|
|
|
|||||||||||||
| Fixed rate debt |
5.81 | % | 5.80 | % | 86% | |||||||||
| Variable rate debt |
2.63 | % | 2.63 | % | 14% | |||||||||
|
|
|
|||||||||||||
| Weighted average interest rate |
5.36 | % | 5.35 | % | 100 | % | ||||||||
|
|
|
|||||||||||||
| DCT PROPORTIONATE SHARE OF UNCONSOLIDATED JOINT VENTURE DEBT(3) |
||||||||||||||
| Institutional Funds |
$ | 31,085 | ||||||||||||
| SCLA |
30,621 | |||||||||||||
|
|
|
|||||||||||||
| $ | 61,706 | |||||||||||||
|
|
|
|||||||||||||
Scheduled Principal Payments of Debt as of December 31, 2011 (excluding premiums)
| Senior Unsecured | Mortgage | Unsecured | ||||||||||||||
| Year |
Notes | Notes | Credit Facility | Total | ||||||||||||
| 2012 |
$ | — | $ | 57,659 | $ | — | $ | 57,659 | ||||||||
| 2013 |
175,000 | 44,295 | — | 219,295 | ||||||||||||
| 2014 |
50,000 | 9,975 | — | 59,975 | ||||||||||||
| 2015 |
215,000 | 48,343 | — | 263,343 | ||||||||||||
| 2016 |
99,000 | 5,724 | — | 104,724 | ||||||||||||
| 2017 |
51,000 | 6,090 | — | 57,090 | ||||||||||||
| 2018 |
81,500 | 6,172 | — | 87,672 | ||||||||||||
| 2019 |
46,000 | 50,768 | — | 96,768 | ||||||||||||
| 2020 |
50,000 | 62,625 | — | 112,625 | ||||||||||||
| 2021 |
92,500 | 18,256 | — | 110,756 | ||||||||||||
| Thereafter |
75,000 | 5,285 | — | 80,285 | ||||||||||||
|
|
|
|
|
|
|
|
|
|||||||||
| Total |
$ | 935,000 | $ | 315,192 | $ | — | $ | 1,250,192 | ||||||||
|
|
|
|
|
|
|
|
|
|||||||||
| (1) | The $175 million term loan agreement bears interest at either 0.80% to 1.65% over prime or 1.80% to 2.65% over LIBOR, per annum at our election, depending on our leverage ratio. |
| (2) | The $300 million senior unsecured revolving credit facility expires on June 3, 2015 and bears interest at either 0.65% to 1.35% over prime or 1.65% to 2.35% over LIBOR, per annum at our election, depending upon our leverage ratio. We have issued two letters of credit secured by the unsecured revolving credit facility totaling, $9.8 million; therefore there was $290.2 million available under the unsecured revolving credit facility as of December 31, 2011. |
| (3) | Based on DCT’s ownership as of December 31, 2011. |
Hedges: As of December 31, 2011, we had one forward-starting interest rate swap in place to hedge the variability of cash flows associated with forecasted issuances of debt in 2012. This swap has a notional value of $90 million, a LIBOR based strike rate of 5.43%, an effective date of June 2012 and a maturity date of September 2012.
| Fourth Quarter 2011 |
|
Page 12 | ||
| Supplemental Reporting Package |
Capitalization and Fixed Charge Coverage
(dollar amounts in thousands, except share price)
Capitalization at December 31, 2011
| Description |
Shares or Units (1) | Share Price | Market Value | |||||||||
| (in thousands) | ||||||||||||
| Common shares outstanding |
245,943 | $ | 5.12 | $ | 1,259,228 | |||||||
| Operating partnership units outstanding |
25,097 | $ | 5.12 | 128,497 | ||||||||
|
|
|
|||||||||||
| Total equity market capitalization |
1,387,725 | |||||||||||
|
|
|
|||||||||||
| Consolidated debt |
1,252,783 | |||||||||||
| Less: Noncontrolling interests’ share of consolidated debt(2) |
(6,603 | ) | ||||||||||
| Proportionate share of debt related to unconsolidated joint ventures |
61,706 | |||||||||||
|
|
|
|||||||||||
| DCT share of total debt |
1,307,886 | |||||||||||
|
|
|
|||||||||||
| Total market capitalization |
$ | 2,695,611 | ||||||||||
|
|
|
|||||||||||
| DCT share of total debt to total market capitalization |
|
48.5 | % | |||||||||
|
|
|
|||||||||||
Fixed Charge Coverage
| Three Months Ended | Twelve Months Ended | |||||||||||||||
| December 31, | December 31, | |||||||||||||||
| 2011 | 2010 | 2011 | 2010 | |||||||||||||
| Net loss attributable to common stockholders |
$ | (163 | ) | $ | (11,195 | ) | $ | (25,250 | ) | $ | (37,830 | ) | ||||
| Interest expense(3) |
17,347 | 15,446 | 64,254 | 56,998 | ||||||||||||
| Proportionate share of interest expense from unconsolidated joint ventures |
722 | 973 | 3,077 | 3,230 | ||||||||||||
| Real estate related depreciation and amortization(3) |
32,149 | 29,386 | 128,989 | 115,904 | ||||||||||||
| Proportionate share of real estate related depreciation and amortization from unconsolidated joint ventures |
1,390 | 1,470 | 6,177 | 5,901 | ||||||||||||
| Income tax expense (benefit) and other taxes(3) |
38 | (131 | ) | 144 | 937 | |||||||||||
| Stock-based compensation amortization |
831 | 1,246 | 4,587 | 4,828 | ||||||||||||
| Noncontrolling interests(3) |
(207 | ) | (1,698 | ) | (3,593 | ) | (5,223 | ) | ||||||||
| Loss on business combinations |
— | — | — | 395 | ||||||||||||
| Non-FFO gains on dispositions of real estate interests |
(12,030 | ) | — | (12,030 | ) | (2,079 | ) | |||||||||
| Impairment losses (3)(4) |
8,226 | 4,916 | 10,160 | 12,329 | ||||||||||||
|
|
|
|
|
|
|
|
|
|||||||||
| Adjusted EBITDA |
$ | 48,303 | $ | 40,413 | $ | 176,515 | $ | 155,390 | ||||||||
|
|
|
|
|
|
|
|
|
|||||||||
| CALCULATION OF FIXED CHARGES |
||||||||||||||||
| Interest expense (3) |
$ | 17,347 | $ | 15,446 | $ | 64,254 | $ | 56,998 | ||||||||
| Capitalized interest |
537 | 359 | 2,670 | 2,162 | ||||||||||||
| Amortization of loan costs and debt premium/discount |
(277 | ) | (252 | ) | (1,015 | ) | (1,240 | ) | ||||||||
| Proportionate share of interest expense from unconsolidated joint ventures |
722 | 973 | 3,077 | 3,230 | ||||||||||||
|
|
|
|
|
|
|
|
|
|||||||||
| Total fixed charges |
$ | 18,329 | $ | 16,526 | $ | 68,986 | $ | 61,150 | ||||||||
|
|
|
|
|
|
|
|
|
|||||||||
| Fixed charge coverage |
2.6 | 2.4 | 2.6 | 2.5 | ||||||||||||
|
|
|
|
|
|
|
|
|
|||||||||
| (1) | Excludes 1.0 million unvested Long-Term Incentive Plan Units, 0.4 million shares of unvested Restricted Stock and 0.1 million unvested Phantom Shares outstanding as of December 31, 2011. |
| (2) | Amount includes only the portion of consolidated property level debt related to properties in which we do not have a 100% ownership. |
| (3) | Includes amounts related to discontinued operations. |
| (4) | Includes impairment losses on investments in unconsolidated joint ventures. |
| Fourth Quarter 2011 |
|
Page 13 | ||
| Supplemental Reporting Package |
Institutional Capital Management Summary
(dollar amounts in thousands)
Statements of Operations
| For the Twelve Months Ended December 31, 2011 | ||||||||||||||||||||
| Boubyan Fund I | TRT-DCT JV I | TRT-DCT JV II | TRT-DCT JV III | JP Morgan | ||||||||||||||||
| REVENUES: |
||||||||||||||||||||
| Total rental revenues |
$ | 9,649 | $ | $16,332 | $ | 7,898$ | 3,094 | $ | 20,350 | |||||||||||
| EXPENSES: |
||||||||||||||||||||
| Rental expenses |
818 | 1,266 | 723 | 366 | 2,044 | |||||||||||||||
| Real estate taxes |
1,473 | 2,328 | 1,214 | 291 | 2,820 | |||||||||||||||
| Depreciation and amortization |
4,566 | 7,834 | 3,391 | 1,431 | 12,937 | |||||||||||||||
| General and administrative |
627 | 73 | 16 | 7 | 825 | |||||||||||||||
| Total expenses |
7,484 | 11,501 | 5,344 | 2,095 | 18,626 | |||||||||||||||
| Interest expense |
5,457 | 7,572 | 3,436 | 920 | — | |||||||||||||||
| Interest and other income |
— | (296 | ) | (382 | ) | — | — | |||||||||||||
| Taxes |
64 | 15 | 31 | 21 | 5 | |||||||||||||||
|
|
|
|
|
|
|
|
|
|
|
|||||||||||
| Net income (loss) |
$ | (3,356 | ) | $ | (2,460 | ) | $ | (531 | ) | $ | 58 | $ | 1,719 | |||||||
|
|
|
|
|
|
|
|
|
|
|
|||||||||||
| Rental revenues |
$ | 9,469 | $ | 16,332 | $ | 7,898 | $ | 3,094 | $ | 20,350 | ||||||||||
| Rental expenses and real estate taxes |
2,291 | 3,594 | 1,937 | 657 | 4,864 | |||||||||||||||
|
|
|
|
|
|
|
|
|
|
|
|||||||||||
| Net operating income |
$ | 7,178 | $ | 12,738 | $ | 5,961 | $ | 2,437 | $ | 15,486 | ||||||||||
|
|
|
|
|
|
|
|
|
|
|
|||||||||||
Balance Sheets
| Data by Fund as of December 31, 2011: |
Number of Buildings |
Square Feet (In thousands) |
Occupancy | DCT Ownership |
||||||||||||
| Boubyan Fund I |
6 | 2,647 | 84.6 | % | 20.0 | % | ||||||||||
| TRT-DCT JV I |
13 | 3,070 | 96.3 | % | 4.4 | % | ||||||||||
| TRT-DCT JV II |
5 | 1,744 | 95.3 | % | 11.4 | % | ||||||||||
| TRT-DCT JV III |
5 | 900 | 100.0 | % | 10.0 | % | ||||||||||
| JP Morgan |
14 | 4,956 | 83.7 | % | 20.0 | % | ||||||||||
|
|
|
|
|
|
|
|
|
|||||||||
| Total/weighted average |
43 | 13,317 | 89.4 | % | 14.6 | % | ||||||||||
|
|
|
|
|
|
|
|
|
|||||||||
Balance Sheets
| As of December 31, 2011 | ||||||||||||||||||||
| Boubyan Fund I | TRT-DCT JV I | TRT-DCT JV II | TRT-DCT JV III | JP Morgan Venture | ||||||||||||||||
| Total investment in properties |
$ | 125,667 | $ | 183,262 | $ | 90,198 | $ | 31,354 | $ | 286,441 | ||||||||||
| Accumulated depreciation and amortization |
(27,798 | ) | (37,871 | ) | (16,760 | ) | (4,957 | ) | (45,630 | ) | ||||||||||
|
|
|
|
|
|
|
|
|
|
|
|||||||||||
| Net investment in properties |
97,869 | 145,391 | 73,438 | 26,397 | 240,811 | |||||||||||||||
| Cash and cash equivalents |
1,878 | 1,386 | 927 | 389 | 3,225 | |||||||||||||||
| Other assets |
2,969 | 2,741 | 1,805 | 520 | 4,128 | |||||||||||||||
|
|
|
|
|
|
|
|
|
|
|
|||||||||||
| Total assets |
$ | 102,716 | $ | 149,518 | $ | 76,170 | $ | 27,306 | $ | 248,164 | ||||||||||
|
|
|
|
|
|
|
|
|
|
|
|||||||||||
| Other liabilities |
$ | 2,291 | $ | 3,660 | $ | 1,598 | $ | 604 | $ | 4,601 | ||||||||||
| Secured debt maturities – 2014 |
— | — | 39,725 | (3) | — | — | ||||||||||||||
| Secured debt maturities – 2015 |
— | 31,986 | (2) | 10,206 | (3) | — | — | |||||||||||||
| Secured debt maturities thereafter |
95,500 | (1) | 85,000 | (2) | — | 11,892 | (4) | — | ||||||||||||
|
|
|
|
|
|
|
|
|
|
|
|||||||||||
| Total secured debt |
95,500 | 116,986 | 49,931 | 11,892 | — | |||||||||||||||
|
|
|
|
|
|
|
|
|
|
|
|||||||||||
| Total liabilities |
97,791 | 120,646 | 51,529 | 12,496 | 4,601 | |||||||||||||||
| Partners or members’ capital |
4,925 | 28,872 | 24,641 | 14,810 | 243,563 | |||||||||||||||
|
|
|
|
|
|
|
|
|
|
|
|||||||||||
| Total liabilities and Partners or members’ capital |
$ | 102,716 | $ | 149,518 | $ | 76,170 | $ | 27,306 | $ | 248,164 | ||||||||||
|
|
|
|
|
|
|
|
|
|
|
|||||||||||
| (1) | $95.5 million has a stated interest rate of 5.6% and requires interest only payments until April 2012 at which time it has a new stated interest rate of 7.6% and becomes fully amortizing through maturity in 2036. |
| (2) | $85.0 million of debt requires interest only payments until 2017 and has a stated interest rate of 5.7%. $32.0 million of debt requires principal and interest payments through 2015 and has a stated interest rate of 6.6%. |
| (3) | $39.7 million of debt requires interest only payments until 2014 and has a stated interest rate of 6.2%. $10.2 million of debt requires principal and interest payments through 2015 and has a stated interest rate of 6.6%. |
| (4) | $11.9 million of debt requires principal and interest payments until 2016 and has a stated interest rate of 7.4%. |
| Fourth Quarter 2011 |
|
Page 14 | ||
| Supplemental Reporting Package |
Definitions
| Fourth Quarter 2011 |
|
Page 15 | ||
| Supplemental Reporting Package |
Definitions
(continued)
Net Operating Income (“NOI”):
NOI is defined as rental revenues, including expense reimbursements, less rental expenses and real estate taxes, and excludes depreciation, amortization, impairment, general and administrative expenses and interest expense. DCT Industrial considers NOI to be an appropriate supplemental performance measure because NOI reflects the operating performance of DCT Industrial’s properties and excludes certain items that are not considered to be controllable in connection with the management of the property such as amortization, depreciation, impairment, interest expense, interest income and general and administrative expenses. Additionally, lease termination revenue is excluded as it is not considered to be indicative of recurring operating performance. However, NOI should not be viewed as an alternative measure of DCT Industrial’s financial performance since it excludes expenses which could materially impact our results of operations. Further, DCT Industrial’s NOI may not be comparable to that of other real estate companies, as they may use different methodologies for calculating NOI. Therefore, DCT Industrial believes net income, as defined by GAAP, to be the most appropriate measure to evaluate DCT Industrial’s overall financial performance (in thousands).
| Consolidated Operating Data | ||||||||||||||||
| Three Months Ended December 31, |
Twelve Months Ended December 31, |
|||||||||||||||
| 2011 | 2010 | 2011 | 2010 | |||||||||||||
| Reconciliation of loss from continuing operations to NOI: |
||||||||||||||||
| Loss from continuing operations |
$ | (4,677 | ) | $ | (12,628 | ) | $ | (36,456 | ) | $ | (42,469 | ) | ||||
| Income tax (benefit) expense and other taxes |
38 | (137 | ) | 144 | 918 | |||||||||||
| Interest and other (income) expense |
53 | (245 | ) | 310 | (357 | ) | ||||||||||
| Interest expense |
17,104 | 15,333 | 63,941 | 56,548 | ||||||||||||
| Equity in (income) loss of unconsolidated joint ventures, net |
(894 | ) | 786 | 2,556 | 2,986 | |||||||||||
| General and administrative |
5,459 | 6,734 | 25,925 | 25,262 | ||||||||||||
| Real estate related depreciation and amortization |
31,106 | 28,186 | 124,244 | 110,373 | ||||||||||||
| Loss on business combinations |
— | — | — | 395 | ||||||||||||
| Impairment losses |
448 | 4,100 | 448 | 8,656 | ||||||||||||
| Impairment losses on investments in unconsolidated joint ventures |
19 | 216 | 1,953 | 216 | ||||||||||||
| Casualty gains |
(33 | ) | — | (33 | ) | — | ||||||||||
| Institutional capital management and other fees |
(1,138 | ) | (1,082 | ) | (4,291 | ) | (4,133 | ) | ||||||||
|
|
|
|
|
|
|
|
|
|||||||||
| Total net operating income |
47,485 | 41,263 | 178,741 | 158,395 | ||||||||||||
| Less net operating income- non-same store properties |
(6,095 | ) | (251 | ) | (24,019 | ) | (3,546 | ) | ||||||||
|
|
|
|
|
|
|
|
|
|||||||||
| Same store GAAP net operating income |
41,390 | 41,012 | 154,722 | 154,849 | ||||||||||||
| Less revenue from lease terminations |
(179 | ) | (96 | ) | (616 | ) | (426 | ) | ||||||||
|
|
|
|
|
|
|
|
|
|||||||||
| Same store GAAP net operating income, excluding revenue from lease terminations |
41,211 | 40,916 | 154,106 | 154,423 | ||||||||||||
| Less straight-line rents, net of related bad debt expense |
(1,460 | ) | (1,610 | ) | (5,092 | ) | (4,291 | ) | ||||||||
| Add back amortization of above/(below) market rents |
(168 | ) | (17 | ) | (467 | ) | 85 | |||||||||
|
|
|
|
|
|
|
|
|
|||||||||
| Same store cash net operating income, excluding revenue from lease terminations |
$ | 39,583 | $ | 39,289 | $ | 148,547 | $ | 150,217 | ||||||||
|
|
|
|
|
|
|
|
|
|||||||||
Ratio of Consolidated Debt to Book Value of Total Assets (Before Depreciation):
Calculated as (total consolidated debt) / (total assets with accumulated depreciation and amortization added back).
Redevelopment:
Represents assets acquired with the intention to reposition or redevelop. May include buildings taken out of service for redevelopment where we generally expect to spend more than 20% of the building's book value on capital improvements, if applicable.
Retention:
Calculated as (retained square feet + relocated square feet) / ((retained square feet + relocated square feet + expired square feet)—(square feet of vacancies anticipated at acquisition + month-to-month square feet + bankruptcy square feet + early terminations)).
Sales Price:
Contractual price of real estate sold before closing adjustments.
Same Store Population:
The same store population is determined independently for each period presented, quarter-to-date and year-to-date, by including all consolidated operating properties that have been owned and stabilized for the entire current and prior periods presented. Properties Held for Sale are excluded.
| Fourth Quarter 2011 |
|
Page 16 | ||
| Supplemental Reporting Package |
Definitions
(continued)
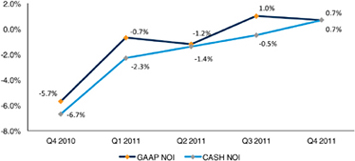
Same Store Net Operating Income Growth:
The change in same store net operating income growth is calculated by dividing the change in NOI, year over year, by the preceding period NOI, based on a same store population for the quarter most recently presented. A reconciliation of NOI and cash NOI by period is provided below; amounts are not restated for current period discontinued operations (in thousands).
| Consolidated operating data, as previously reported, for the three months ended: | ||||||||||||||||||||
| Reconciliation of Loss from continuing operations to NOI: | December 31, 2010 |
March 31, 2011 |
June 30, 2011 |
September 30, 2011 |
December 31, 2011 |
|||||||||||||||
| Loss from continuing operations |
$ | (12,146 | ) | (9,803 | ) | (9,614 | ) | (9,142 | ) | (4,677 | ) | |||||||||
| Income tax expense (benefit) and other taxes |
(138 | ) | 40 | 121 | (56 | ) | 38 | |||||||||||||
| Interest and other (income) expense |
(244 | ) | (85 | ) | (14 | ) | 356 | 53 | ||||||||||||
| Interest expense |
15,423 | 15,511 | 14,768 | 16,628 | 17,104 | |||||||||||||||
| Equity in (income) loss of unconsolidated joint ventures, net |
786 | 1,357 | 1,126 | 967 | (894 | ) | ||||||||||||||
| General and administrative |
6,735 | 7,056 | 7,063 | 6,346 | 5,459 | |||||||||||||||
| Real estate related depreciation and amortization |
29,368 | 31,143 | 32,298 | 33,398 | 31,106 | |||||||||||||||
| Impairment losses |
4,100 | — | — | — | 448 | |||||||||||||||
| Impairment losses on investments in unconsolidated joint ventures |
216 | — | 1.934 | — | 19 | |||||||||||||||
| Casualty gains |
— | — | (1,244 | ) | (54 | ) | (33 | ) | ||||||||||||
| Institutional capital management and other fees |
(1,082 | ) | (1,019 | ) | (1,129 | ) | (1,004 | ) | (1,138 | ) | ||||||||||
|
|
|
|
|
|
|
|
|
|
|
|||||||||||
| Total GAAP net operating income |
43,018 | 44,200 | 45,309 | 47,439 | 47,485 | |||||||||||||||
| Less net operating income- non-same store properties |
(2,107 | ) | (4,397 | ) | (5,082 | ) | (5,877 | ) | (6,095 | ) | ||||||||||
|
|
|
|
|
|
|
|
|
|
|
|||||||||||
| Same store GAAP net operating income |
40,911 | 39,803 | 40,227 | 41,562 | 41,390 | |||||||||||||||
| Less revenue from lease terminations |
(104 | ) | (55 | ) | (134 | ) | (262 | ) | (179 | |||||||||||
|
|
|
|
|
|
|
|
|
|
|
|||||||||||
| Same store GAAP net operating income, excluding revenue from lease terminations |
40,807 | 39,748 | 40,093 | 41,300 | 41,211 | |||||||||||||||
| Less straight-line rents, net of related bad debt expense |
(824 | ) | (1,991 | ) | (1,264 | ) | (875 | ) | (1,460 | ) | ||||||||||
| Add back amortization of above/(below) market rents |
(38 | ) | (91 | ) | (97 | ) | (190 | ) | (168 | ) | ||||||||||
|
|
|
|
|
|
|
|
|
|
|
|||||||||||
| Same store cash net operating income, excluding revenue from lease terminations |
$ | 39,945 | $ | 37,666 | $ | 38,732 | $ | 40,235 | $ | 39,583 | ||||||||||
|
|
|
|
|
|
|
|
|
|
|
|||||||||||
| Consolidated operating data, as previously reported, for the three months ended: | ||||||||||||||||||||
| Reconciliation of Loss from continuing operations to NOI: | December 31, 2009 |
March 31, 2010 |
June 30, 2010 |
September 30, 2010 |
December 31, 2010 |
|||||||||||||||
| Loss from continuing operations |
$ | (3,811 | ) | $ | (7,704 | ) | $ | (11,490 | ) | $ | (8,836 | ) | $ | (12,628 | ) | |||||
| Income tax expense (benefit) and other taxes |
(178 | ) | 238 | 582 | 235 | (137 | ) | |||||||||||||
| Interest and other (income) expense |
(364 | ) | 469 | (353 | ) | (227 | ) | (245 | ) | |||||||||||
| Interest expense |
12,576 | 12,763 | 13,225 | 15,493 | 15,333 | |||||||||||||||
| Equity in (income) loss of unconsolidated joint ventures, net |
(533 | ) | 558 | 349 | 1,293 | 786 | ||||||||||||||
| General and administrative |
8,221 | 6,032 | 6,362 | 6,134 | 6,734 | |||||||||||||||
| Real estate related depreciation and amortization |
28,516 | 28,281 | 28,948 | 28,526 | 28,186 | |||||||||||||||
| Loss on business combinations |
169 | 395 | — | — | — | |||||||||||||||
| Impairment losses |
— | — | 4,556 | — | 4,100 | |||||||||||||||
| Impairment losses on investments in unconsolidated joint ventures |
— | — | — | — | 216 | |||||||||||||||
| Institutional capital management and other fees |
(653 | ) | (967 | ) | (1,038 | ) | (1,046 | ) | (1,082 | ) | ||||||||||
|
|
|
|
|
|
|
|
|
|
|
|||||||||||
| Total GAAP net operating income |
43,943 | 40,065 | 41,141 | 41,572 | 41,263 | |||||||||||||||
| Less net operating income- non-same store properties |
(490 | ) | (4 | ) | (545 | ) | (425 | ) | (251 | ) | ||||||||||
|
|
|
|
|
|
|
|
|
|
|
|||||||||||
| Same store GAAP net operating income |
43,453 | 40,061 | 40,596 | 41,147 | 41,012 | |||||||||||||||
| Less revenue from lease terminations |
(167 | ) | (34 | ) | (23 | ) | (273 | ) | (96 | ) | ||||||||||
|
|
|
|
|
|
|
|
|
|
|
|||||||||||
| Same store GAAP net operating income, excluding revenue from lease terminations |
43,286 | 40,027 | 40,573 | 40,874 | 40,916 | |||||||||||||||
| Less straight-line rents, net of related bad debt expense |
(579 | ) | (1,574 | ) | (1,360 | ) | (344 | ) | (1,610 | ) | ||||||||||
| Add back amortization of above/(below) market rents |
87 | 108 | 80 | (90 | ) | (17 | ) | |||||||||||||
|
|
|
|
|
|
|
|
|
|
|
|||||||||||
| Same store cash net operating income, excluding revenue from lease terminations |
$ | 42,794 | $ | 38,561 | $ | 39,293 | $ | 40,440 | $ | 39,289 | ||||||||||
|
|
|
|
|
|
|
|
|
|
|
|||||||||||
| Change in (GAAP) same store NOI |
(5.7 | )% | (0.7 | )% | (1.2 | )% | 1.0 | % | 0.7 | % | ||||||||||
|
|
|
|
|
|
|
|
|
|
|
|||||||||||
| Change in cash same store NOI |
(6.7 | )% | (2.3 | )% | (1.4 | )% | (0.5 | )% | 0.7 | % | ||||||||||
|
|
|
|
|
|
|
|
|
|
|
|||||||||||
| Square Feet:
Represents square feet in building that are available for lease.
Stabilized:
Buildings are generally considered stabilized when 95% occupied.
Stock-based Compensation Amortization Expense:
Represents the non-cash amortization of the cost of employee services received in exchange for an award of an equity instrument based on the award’s fair value on the grant date and amortized over the vesting period.
Total Project Investment:
An estimate of total expected capital expenditures on development properties in accordance with GAAP. |
Turnover Costs:
Turnover costs are comprised of the costs incurred or capitalized for improvements of vacant and renewal spaces, as well as the commissions paid or costs capitalized for leasing transactions. The amount indicated for leasing statistics represents the total turnover costs expected to be incurred on the leases signed during the period and does not reflect actual expenditures for the period.
Yield – Under Construction (Projected):
Calculated as projected stabilized Net Operating Income divided by total projected investment. |
| Fourth Quarter 2011 |
|
Page 17 | ||
| Supplemental Reporting Package |