Attached files
| file | filename |
|---|---|
| 8-K - FORM 8-K - SUPERIOR ENERGY SERVICES INC | d296383d8k.htm |
| EX-99.2 - PRESS RELEASE - SUPERIOR ENERGY SERVICES INC | d296383dex992.htm |
 Superior Energy Services
Credit Suisse Energy Summit
February 8, 2012
Exhibit 99.1 |
 Company Overview
 |
 Rationale for Superior
•
Diversified family of products
–
Serving the drilling, completion, production and decommissioning
needs of the oil and gas
industry in the U.S. with a growing presence in select international
markets •
Globally focused and not market share constrained
•
Opportunity to expand platform to new geographic markets
•
Well-positioned company
–
Competitive advantages: Quality, innovation and integrated solutions
–
Healthy balance sheet
–
High margins and returns on capital relative to peers
3 |
 4 |
 Participate in $90 billion of Global Market segments
5
Sources: Spears & Associates, Inc. Oilfield Market Report: 1999-2012,
Intervention & Coiled Tubing Association (1)
Excludes accommodations
(2)
#1 U.S. market share based on unit count
SPN
Rank
Drilling Products and Services (1)
Onshore Completion and Workover Services
Well Servicing
Pressure Pumping
Production Services
Coiled Tubing Services (2)
Wireline Logging
Production Testing
Subsea and Technical Solutions
Completion Tools and Products
6
th
5
th
5
th
4
th
4
th
11
th
3
rd |
 Among U.S. Coiled Tubing Leaders
6
Estimated U.S. Coiled Tubing Unit Count
Source: Intervention & Coiled Tubing Association
23
34
39
49
51
73
84
Archer
RES
HAL
KEG
BHI
SLB
SPN
Includes ~66 highly-capable units (2”+) |
 Pro Forma Superior Revenue by Product for TTM Ended September 30, 2011
7
Balanced Contribution from Diversified Product Mix
North America Land Revenue
Total Company Revenue
(1) Includes Snubbing, Pressure Control and Well Servicing
|
 Strategic Overview
 |
 Strategy Execution: U.S. Land Markets
•
Leveraged to wellbore
geometry and oil prices
–
Horizontal drilling has stressed
the supply chain
•
Multi-basin, multi-product
line approach
–
Deploy assets to basins with
greatest demand and service
intensity
•
Focused on undersupplied
products and services
–
Downhole drilling tools
–
Completion and production
services
9
Horizontal/Directional
Vertical
Service Intensity
(2)
(1) Source: Spears & Associates, Drilling & Production Outlook
Report, December 2011 (2) Service Intensity assumes: 1.0x intensity for
vertical wells, 1.6x intensity for directional wells and 7.0x intensity for horizontal wells
U.S. Active Rigs by Commodity
(1)
U.S. Active Rigs by Type
(1) |
 •
Markets slowly recovering
from 2008 financial crisis
•
Geomarket approach
–
Maximize opportunities through
centralized diversified product
offering
•
Offer higher technology and
innovative solutions
–
Sand control completion tools
–
Subsea well containment
•
Expand into growing and
mature markets with similar
U.S. margin profile
10
Strategy Execution: International
International Revenue Since 2003 ($ MM)
(1) Annualized actual 2011 international revenue of $385 million through
9/30/2011. |
 International Expansion: South America
11 |
 International Expansion: UK, Middle East and Africa
12 |
 International Expansion: Asia Pacific
13 |
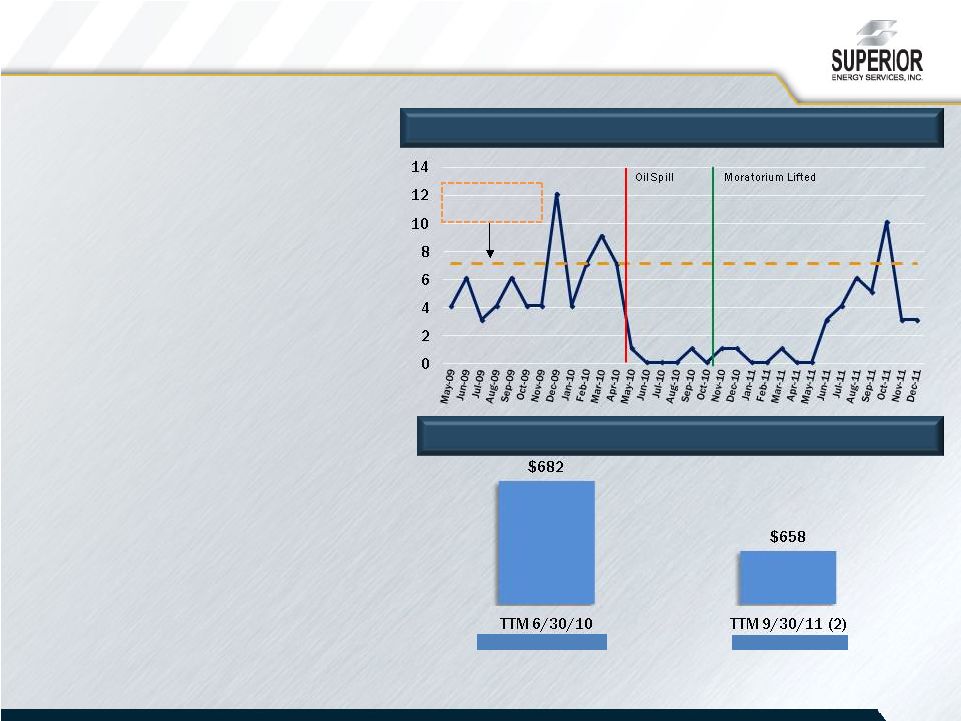 Strategy Execution: Gulf of Mexico
•
Upside to rig count
recovery in deep water
•
Maintain high share of
deep water rig count
•
Incremental exposure
through completion tools
and services
•
Primary shallow water
focus remains on well
maintenance and end-of-
life services
14
Monthly
Deep
Water
Permits
to
Drill
New
Wells
(1)
SPN Gulf of Mexico Revenue ($ in millions)
Pre-Macondo
Post-Macondo
(1)
A new well is defined as an operator drilling an original wellbore hole in the
seafloor to a geological target. Excludes permits for bypass, sidetracks, completions, interventions and end-of-life services
(2)
Content difference from TTM 6/30/10. Includes revenue from the completion
tools and products product line acquired in August of 2010.
3-year pre-spill
average:
7/mo
. |
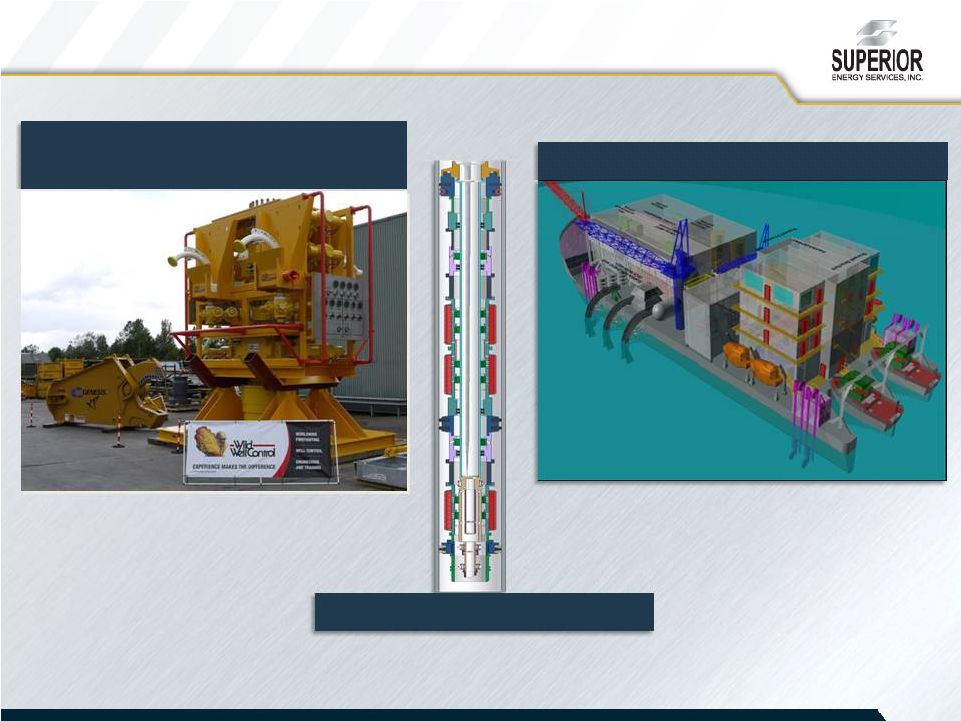 Strategy Execution: Innovation and Technical Solutions
15
Multi-zone Single Trip System
Global Subsea Containment
Capping Stack
Arctic Subsea Containment System |
 Flexible Capital Expenditures Program
Estimated Lead Time for Key Capital Items (Years)
16 |
 Investment Highlights
•
Diversified product line with multi-basin, multi-product offering
approach •
Small share of large, fragmented global markets provides growth potential
•
Geographic growth strategy in place
•
Positioned to benefit from continued recovery in deepwater Gulf of Mexico
•
Strong balance sheet to execute growth strategy
–
History of disciplined investments that yield high returns on capital
17 |
 Forward-Looking Statements
18
This presentation contains forward-looking statements, including, in
particular, statements about Superior Energy’s plans, strategies
and prospects. These statements are based on the Company’s
current assumptions, expectations and projections about future events,
which are subject to a wide range of business risks. Although the Company
believes that the assumptions reflected in these forward-looking
statements are reasonable, the Company can give no assurance that these
assumptions will prove to be correct or that financial or market
forecasts, savings or other benefits anticipated in the
forward-looking statements will be achieved. Forward-looking
statements are not guarantees of future performance and actual results
may differ materially from those projected. The information contained in
this presentation is only current as of February 7, 2012, and the
Company undertakes no obligation to update this presentation.
|