Attached files
| file | filename |
|---|---|
| 8-K - FORM 8-K - PEABODY ENERGY CORP | btu8k20120207.htm |
Exhibit 99.1

Credit Suisse Energy Summit 2012
Michael C. Crews
Executive Vice President and Chief Financial Officer
February 7-8, 2012
Peabody Energy
Energizing The World One BTU At A Time

Statement on Forward-Looking Information
Some of the following information contains forward-looking statements within the meaning of Section 27A of the Securities Act of 1933 and Section 21E of the Securities Exchange Act of 1934, as amended, and is intended to come within the safe-harbor protection provided by those sections.
Some of the following information contains forward-looking statements within the meaning of Section 27A of the Securities Act of 1933 and Section 21E of the Securities Exchange Act of 1934, as amended, and is intended to come within the safe-harbor protection provided by those sections. Our forward-looking statements are based on numerous assumptions that the company believes are reasonable, but they are open to a wide range of uncertainties and business risks that may cause actual results to differ materially from expectations as of Jan. 24, 2012. These factors are difficult to accurately predict and may be beyond the company's control. The company does not undertake to update its forward-looking statements. Factors that could affect the company's results include, but are not limited to: demand for coal in the United States and the seaborne thermal and metallurgical coal markets; price volatility and demand, particularly in higher-margin products and in our trading and brokerage businesses; impact of weather on demand, production and transportation; reductions and/or deferrals of purchases by major customers and ability to renew sales contracts; credit and performance risks associated with customers, suppliers, co-shippers, trading, banks and other financial counterparties; geologic, equipment, permitting and operational risks related to mining; transportation availability, performance and costs; availability, timing of delivery and costs of key supplies, capital equipment or commodities such as diesel fuel, steel, explosives and tires; successful integration and management of the newly acquired Macarthur Coal operations; successful implementation of business strategies, including our Btu Conversion and generation development initiatives; negotiation of labor contracts, employee relations and workforce availability; changes in postretirement benefit and pension obligations and funding requirements; replacement and development of coal reserves; access to capital and credit markets and availability and costs of credit, margin capacity, surety bonds, letters of credit, and insurance; effects of changes in interest rates and currency exchange rates (primarily the Australian dollar); effects of acquisitions or divestitures; economic strength and political stability of countries in which we have operations or serve customers; legislation, regulations and court decisions or other government actions, including new environmental and mine safety requirements; changes in income tax regulations or other regulatory taxes; litigation, including claims not yet asserted; and other risks detailed in the company's reports filed with the Securities and Exchange Commission (SEC). The use of “Peabody,” “the company,” and “our” relate to Peabody, its subsidiaries and majority-owned affiliates.
EBITDA (also called Adjusted EBITDA) is defined as income from continuing operations before deducting net interest expense, income taxes, asset retirement obligation expense and depreciation, depletion and amortization. EBITDA, which is not calculated identically by all companies, is not a substitute for operating income, net income or cash flow as determined in accordance with United States generally accepted accounting principles. Management uses EBITDA as a key measure of operating performance and also believes it is a useful indicator of the company's ability to meet debt service and capital expenditure requirements.
Adjusted Income from Continuing Operations and Adjusted EPS are defined as income from continuing operations and diluted earnings per share excluding the impact of the remeasurement of foreign income tax accounts. Management has included these measures because, in management's opinion, excluding such impact is a better indicator of the company's ongoing effective tax rate and diluted earnings per share, and is therefore more useful in comparing the company's results with prior and future periods.
2

Peabody Energy (NYSE: BTU) Well Positioned for Near and Long Term
Record safety and financial results in 2011
Expected growth of 8 - 11 million tons of Australian met and thermal volumes in 2012
Reshaped portfolio targets highest growth regions
Well positioned in U.S.; Fully contracted 2012 volumes and a leader in low-cost growth regions
3

Peabody's Global Transformation Leads to Record Financial Results
Increasing Revenues, EBITDA and Operating Cash Flow
+80% Revenues $ in Millions 2007 $4,422 2008 2009 2010 2011 $7,974
+122% EBITDA $ in Millions 2007 $958 2008 2009 2010 2011 $2,129
+258% Operating Cash Flow $ in Millions 2007 $463 2008 2009 2010 2011 $1,657
Financials include Macarthur acquisition and exclude discontinued operations. Operating cash flows are from continuing operations.
4

Global Markets Continue to Grow
5

Near-Term Global Coal Markets Marked by Opportunities and Challenges
Opportunities
World tops 1 billion tonnes of seaborne coal imports
China and India continue to import at record levels
Asia markets provide support for seaborne coal
Global gas and oil prices remain strong
Global steel demand projected to increase 5% in 2012
Japan and Germany continue to shift away from nuclear power
Challenges
U.S. challenged by:
Natural gas oversupply
Sluggish economy
Recent stockpile building
European economies flat overall
Steel projections based on World Steel Association outlook.
6

PRB and Illinois Basin Expected to Grow as Appalachia Declines
PRB, Illinois Basin Expected to Grow By 15-20% Over Next 5 Years
Additional near-term coal-to-gas switching projected
CAPP most impacted; challenged by costs, permitting, geology
U.S. basins expected to see significant demand shift
Lower-cost PRB and ILB regions growing from new plants, increasing exports and backfill to Eastern plants
Ultra-low sulfur PRB demand likely to increase from new regulations
Estimates based on Peabody analysis and industry reports.
7

Seaborne Markets Continue to Import Record Volumes: China
World's Largest Coal Consumer Increasing Demand and Imports
China Net Coal Imports
Tonnes in Millions
2009 2010 2011 2012P 2016P Met Thermal
China's 2011 coal-fueled generation up 14%
Net coal imports rise 14% to record 168 million tonnes
GDP projected to grow 8.2% in 2012, 8.8% in 2013
100 GW of coal-fueled generation coming on line over next two years
> $1 trillion investments expected in rail and power sector in next five years
Source: GDP growth based on International Monetary Fund projections; Forecasted imports and new coal generation based on Peabody estimates and other industry sources.
8

Seaborne Markets Continue to Import Record Volumes: India
India's Needs Growing Significantly, Bolstering Asia Demand
India's 2011 coal-fueled generation rises 9%
Thermal imports rise 35% to 85 million tonnes
GDP projected to grow 7.0% in 2012, 7.3% in 2013
Nearly 40 GW of coal-fueled generation expected to come on line in next two years alone
$1 trillion in infrastructure spending in five-year plan
India Coal Imports
Tonnes in Millions
2009 2010 2011 2012P 2016P Met Thermal
Source: GDP growth based on International Monetary Fund projections; Forecasted imports and new coal generation based on Peabody estimates and other industry sources.
9

Major Build Out of Global Coal Generation Continues
New Coal-Fueled Generating Capacity 2011-2016
Gigawatts
Rest of World
India
China
Coal-fueled generation expected to grow 370+ GW by 2016
Additional 1.2+ billion tonnes of coal demand anticipated
Vast majority of growth in China and India, driving higher seaborne demand
Many new Chinese plants built along coast
India domestic production struggling to meet demand
Source: Platts Worldwide Power Plant Database and Peabody analysis.
10

Steel Production Growth Expected to Drive Ongoing Met Coal Increases
40% Steel Increase by 2020 = ~400 Million Tonnes Added Met Coal
Global Steel Production
Steel Production (million tonnes)
2010 2015P 2020P
Seaborne met volumes expected to rise as much as
10 - 15% in 2012; could reach 300 million tonnes
Met coal prices continue to rebase at higher levels
Tighter supply for high quality coking coals and low vol PCI
China, India and Brazil to drive demand through increased urbanization and economic growth
Global steel production source: Raw Materials Group, 2011 Global Commodity Forum for UN Committee on Trade and Development
11

Australia to Supply Half the Growth in Seaborne Market Demand in 2012
Global Seaborne Supply Growth 2011 - 2016 (Projected)
Tonnes in Millions
Other U.S. Colombia Mongolia Indonesia Australia
0 50 100 150 200
Why Australia?
Top global coal exporting nation
Predominant met coal supplier
Delivers high-quality thermal and metallurgical products
Better proximity to growing Asian demand centers
Favorable mine-to-port and port-to-customer economics
Mining strongly supported
How Australia?
Major port expansions continue in Queensland and
New South Wales
Projects to improve utilization of existing ports continue
Rail improvements expected to keep pace with port and mine expansions
450 - 500 MTPA throughput expected by 2015
Projected supply based on Peabody estimates; Mongolia exports by land.
12
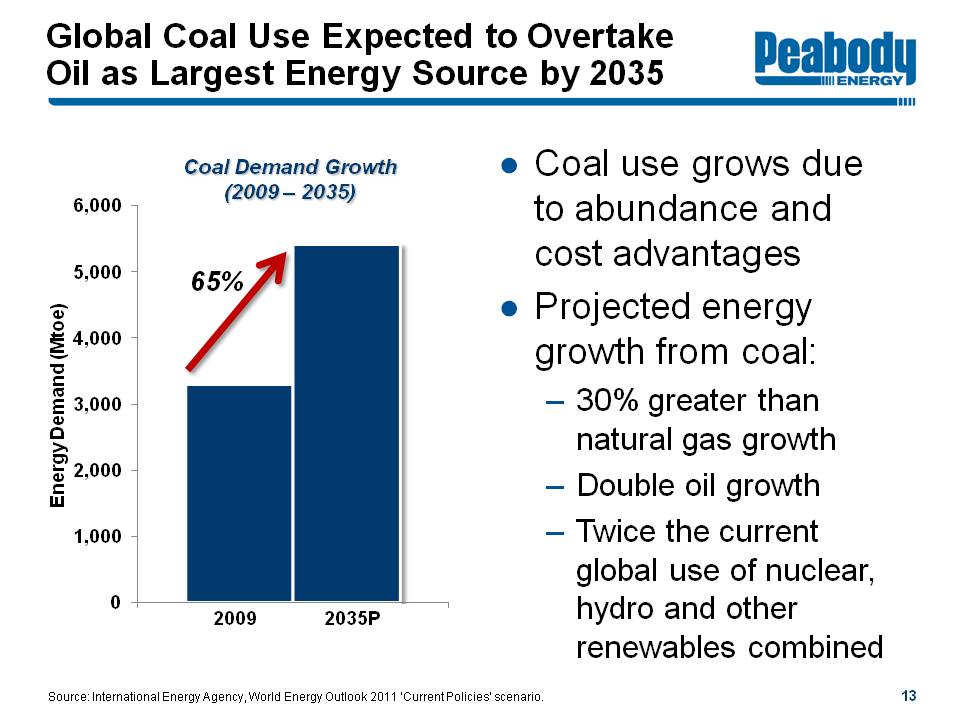
Global Coal Use Expected to Overtake Oil as Largest Energy Source by 2035
Coal Demand Growth (2009 - 2035)
Energy Demand (Mtoe)
65% 2009 2035P
Coal use grows due to abundance and cost advantages
Projected energy growth from coal:
30% greater than natural gas growth
Double oil growth
Twice the current global use of nuclear, hydro and other renewables combined
Source: International Energy Agency, World Energy Outlook 2011 'Current Policies' scenario.
13

World's Fastest-Growing Economies Fueled by Coal
Asia Represents 90% of 4.5 Billion Tonne Expected Demand Growth
+315 +50 +1,080 +2,220 +100 +710
Coal Demand Growth 2009 - 2035 (Tonnes in Millions)
U.S. growth presented in short tons.
Source: World Energy Outlook 2011, International Energy Agency; Annual Energy Outlook 2011, Energy Information Administration; Peabody analysis.
14
Peabody's Global Platform Drives Results

Peabody Continues Global Expansion to Serve High-Growth Regions
World's Only Global Pure-Play Coal Investment
International Offices
Brisbane New Delhi Newcastle Beijing London Urumqi Ulaanbaatar Singapore Essen Jakarta Balikpapan
London Essen New Delhi Urumqi Ulaanbaatar Beijing Singapore Jakarta Balikpapan NCIG St. Louis DTA
Mining Operations
Position S. PRB #1 Midwest #1 Southwest #1 Colorado #1 Australia #5
Sales S. PRB 148 Midwest 30 Southwest 18 Colorado 7 Australia 25
Reserves S. PRB 2.7 Midwest 3.7 Southwest 1.1 Colorado 0.2 Australia 1.2
Mining Sales represent 2011 reported sales volumes in millions of tons. Position based on 2011 sales tons. Reserves based on 2010 10-K filing in billions of tons, and do not reflect recently-acquired Macarthur reserves.
16
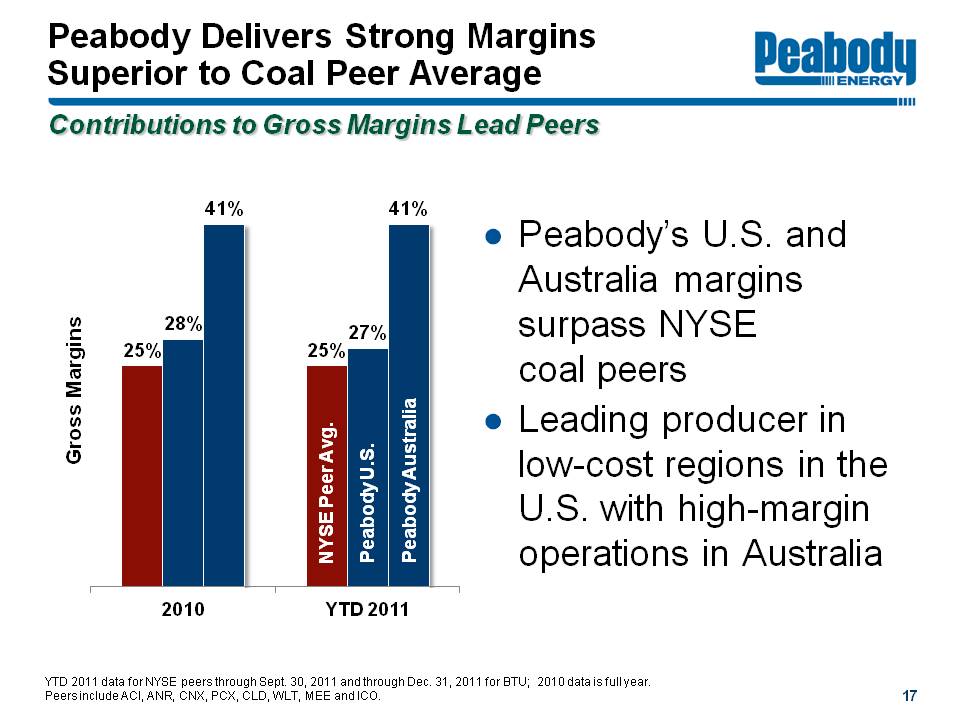
Peabody Delivers Strong Margins Superior to Coal Peer Average
Contributions to Gross Margins Lead Peers
Gross Margins
2010 25% 28% 41% YTD 2011 NYSE Peer Avg. 25% Peabody U.S. 27% Peabody Australia 41%
Peabody's U.S. and Australia margins surpass NYSE coal peers
Leading producer in low-cost regions in the U.S. with high-margin operations in Australia
YTD 2011 data for NYSE peers through Sept. 30, 2011 and through Dec. 31, 2011 for BTU; 2010 data is full year. Peers include ACI, ANR, CNX, PCX, CLD, WLT, MEE and ICO.
17

Multiple Catalysts Driving Value Creation in 2012
Increasing metallurgical coal output
2012 sales target: 14-15 million tons
Rising Australian thermal coal exports
2012 sales target: 12-13 million tons
Delivering on multiple expansion projects
Significant pipeline for future opportunities
Fully committed U.S. position
Strong cash flows and balance sheet
18
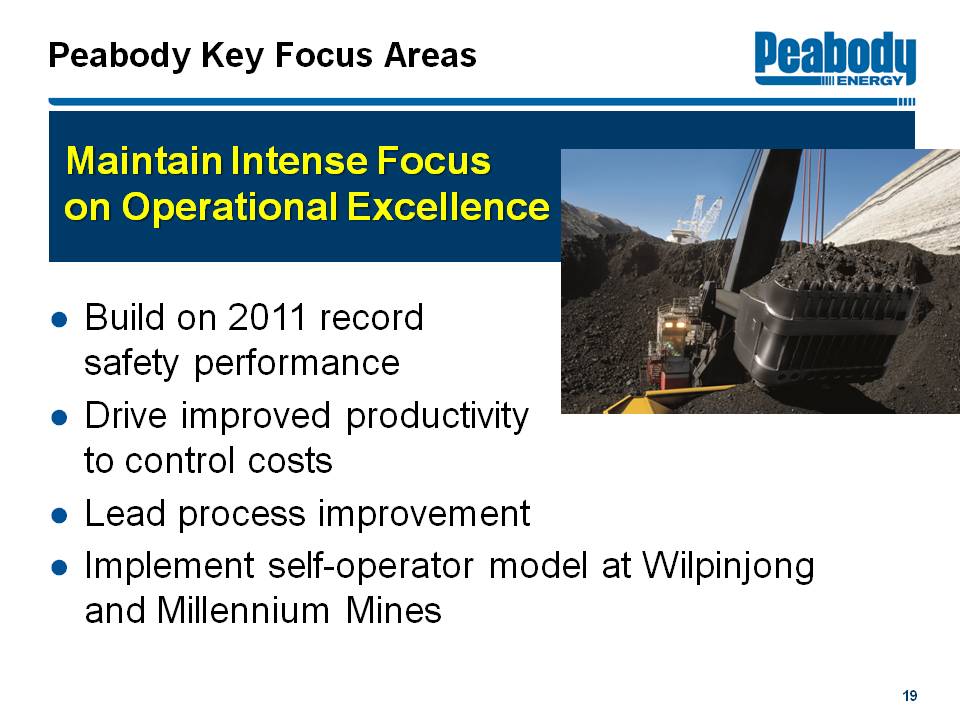
Peabody Key Focus Areas
Maintain Intense Focus on Operational Excellence
Build on 2011 record safety performance
Drive improved productivity to control costs
Lead process improvement
Implement self-operator model at Wilpinjong and Millennium Mines
19
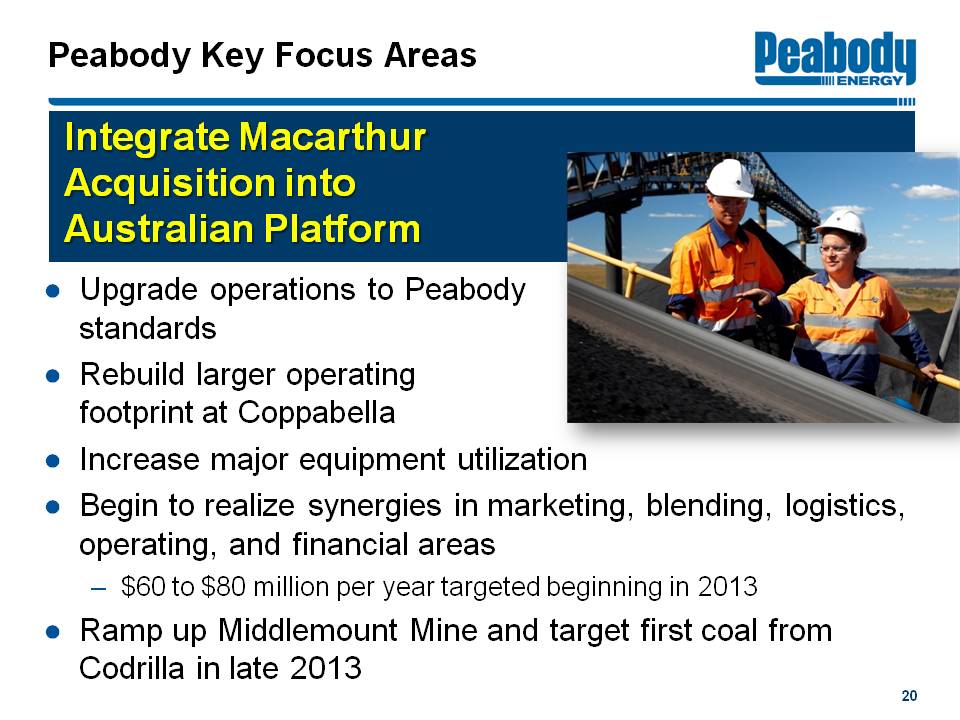
Peabody Key Focus Areas
Integrate Macarthur Acquisition into Australian Platform
Upgrade operations to Peabody standards
Rebuild larger operating footprint at Coppabella
Increase major equipment utilization
Begin to realize synergies in marketing, blending, logistics, operating, and financial areas
$60 to $80 million per year targeted beginning in 2013
Ramp up Middlemount Mine and target first coal from Codrilla in late 2013
20

Peabody Key Focus Areas
Advance Organic Growth Projects
Ramp up from expansions at Wilpinjong, Millennium and Wambo Open-Cut
Target first coal from Burton extension by year-end 2012
Advance projects in U.S. to meet demand for coal in fastest-growing regions

Australia Platform Expanding Through Organic Growth, Macarthur Acquisition
Queensland
Port Abbot Point Dalrymple Bay Gladstone Brisbane
BTU Met Burton N. Goonyella Eaglefield Millennium
MCC Mine Coppabella Moorvale Middlemount
MCC Project Olive Downs Codrilla Vermont East/Wilunga
New South Wales
Port PWCS NCIG Port Kembla
BTU Thermal Wilpinjong Wambo Underground Wambo Open Cut
BTU Met Metropolitan
Expected Australia Volumes
Tons in Millions
2005 Seaborne Thermal 2.5 Met 5.8 Total 8.3
2011 Domestic Thermal 5.9 Seaborne Thermal 10.1 Met 9.3 Total 25.3
2012P Domestic Thermal 7-8 Seaborne Thermal 12-13 Met 14-15 Total 33-36
2015P Domestic Thermal ~8 Seaborne Thermal 15-17 Met 22-25 Total 45-50
22

Australia Organic Pipeline To Deliver Growth in 2012 and Beyond
2011 2012 2013 2014 2015
Wilpinjong 2 - 3 MTPY Thermal
Millennium 1 - 2 MTPY SHCC/PCI Capex of ~ $275M
Wambo Open-Cut 2 - 3 MTPY Thermal/PCI
Middlemount ~2 MTPY SHCC/PCI
Burton ~1MTPY HCC
Metropolitan 1 MTPY HCC Capex of ~ $70M for expansion and $200M for modernization
N. Goonyella LTCC 1 - 2 MTPY HQHCC
Codrilla ~2 - 3 MTPY PCI
Developmental Opportunities MDL 162 Goonyella Corridor Burton North Olive Downs Moorevale West Moorevale Underground Willunga
Projections based on tonnage attributable to Peabody. Capital projections listed for selected operations based on full project estimates.
23

Peabody Key Focus Areas
Pursue Continued Deleveraging
Target selective capital investments
Ongoing review of growth capital to focus on high-return projects
Sustaining capital remains low at $1.25 to $1.75 per ton
Continue to evaluate asset portfolio
Sale process announced for Wilkie Creek
Emphasize cash generation and margin enhancement
Debt-to-Capital Ratio %
2006* 57
2007 52
2008 47
2009 42
2010 37
2011 55
* Debt to capital percentage following the Excel transaction
24
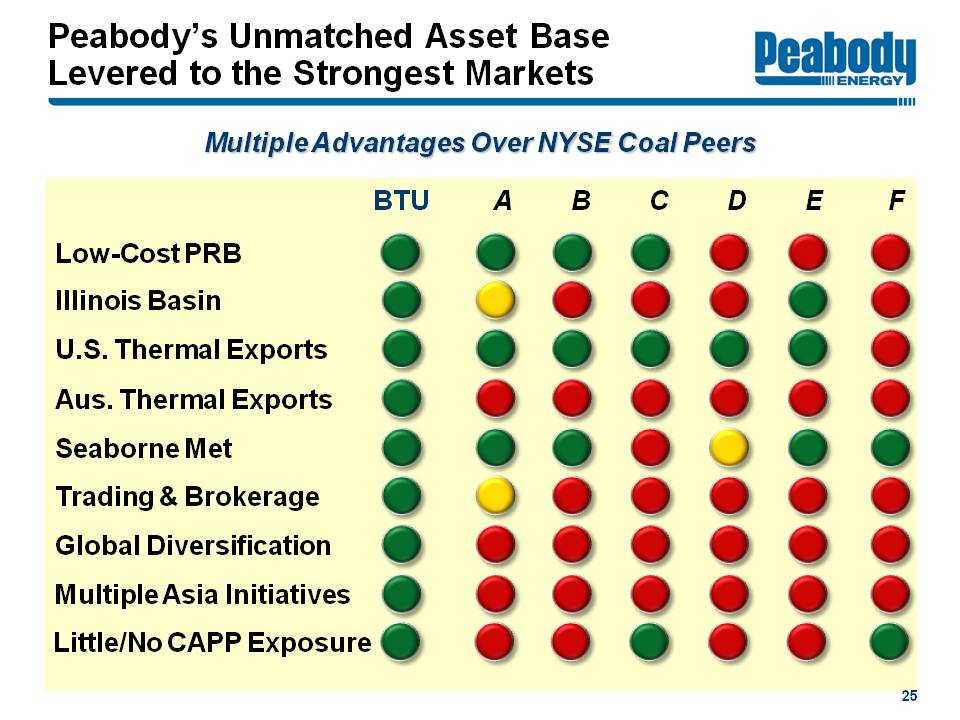
Peabody's Unmatched Asset Base Levered to the Strongest Markets
Multiple Advantages Over NYSE Coal Peers
BTU A B C D E F
Low-Cost PRB
Illinois Basin
U.S. Thermal Exports
Aus. Thermal Exports
Seaborne Met
Trading & Brokerage
Global Diversification
Multiple Asia Initiatives
Little/No CAPP Exposure
25
Credit Suisse Energy Summit 2012
Michael C. Crews
Executive Vice President and Chief Financial Officer
February 7-8, 2012
Peabody Energy
Energizing The World One BTU At A Time