Attached files
| file | filename |
|---|---|
| 8-K - GLU MOBILE INC. 8-K - GLU MOBILE INC | a50159634.htm |
| EX-99.01 - EXHIBIT 99.01 - GLU MOBILE INC | a50159634_ex99-01.htm |
Exhibit 99.02
Glu Mobile Q4 2011 Update © Glu Mobile Inc. – Proprietary
This presentation contains "forward-looking" statements including those regarding expected growth in smartphone and tablet penetration, anticipated growth in worldwide app downloads, our expectations for global, developer-accessible gaming revenues in 2011 and 2012, our guidance for the first quarter of 2012 and the full fiscal year, and our target non-GAAP operating model. These forward-looking statements are subject to material risks and uncertainties that could cause actual results to differ materially from those in the forward-looking statements. Investors should consider important risk factors, which include: the risk that Glu will be unable to successfully integrate the companies that it acquired in August 2011, Griptonite and Blammo Games, and its employees and achieve expected synergies, the risk that Glu will have difficulty retaining key employees of the acquired companies; the risk that consumer demand for smartphones, tablets and next-generation platforms does not grow as significantly as we anticipate or that we will be unable to capitalize on any such growth; the risk that we do not realize a sufficient return on our investment with respect to our efforts to develop social, freemium games for smartphones and tablets, the risk that our development expenses for games for smartphones are greater than we anticipate; the risk that our recently and newly launched games are less popular than anticipated; the risk that our newly released games will be of a quality less than desired by reviewers and consumers; the risk that the mobile games market, particularly with respect to social, freemium gaming, is smaller than anticipated; and other risks detailed under the caption "Risk Factors" in our Form 10-Q filed with the Securities and Exchange Commission on November 14, 2011 and our other SEC filings. You can locate these reports through our website at http://www.glu.com/investors. These "forward-looking" statements are based on estimates and information available to us on February 7, 2012 and we are under no obligation, and expressly disclaim any obligation, to update or alter our forward-looking statements whether as a result of new information, future events or otherwise.© Glu Mobile Inc. – Proprietary
Use of Non-GAAP Financial Measures Glu uses in this presentation certain non-GAAP measures of financial performance. The presentation of these non-GAAP financial measures is not intended to be considered in isolation from, as a substitute for, or superior to, the financial information prepared and presented in accordance with GAAP, and may be different from non-GAAP financial measures used by other companies. In addition, these non-GAAP measures have limitations in that they do not reflect all of the amounts associated with Glu's results of operations as determined in accordance with GAAP. The non-GAAP financial measures used by Glu include non-GAAP revenues, non-GAAP smartphone revenues, non-GAAP freemium revenues, non-GAAP gross margins, non-GAAP operating margin and Adjusted EBITDA. These non-GAAP financial measures exclude the following items from Glu's unaudited consolidated statements of operations: Change in deferred revenues and royalties;Amortization of intangible assets; Stock-based compensation expense; Restructuring charges; Change in fair value of Blammo earnout; Transitional costs; andForeign currency exchange gains and losses primarily related to the revaluation of assets and liabilities. In addition, Glu has included in this presentation “Adjusted EBITDA” figures which are used to evaluate Glu’s operating performance and is defined as non-GAAP net income/(loss) excluding interest, taxes and depreciation.Glu believes that these non-GAAP financial measures, when taken together with the corresponding GAAP financial measures, provide meaningful supplemental information regarding Glu's performance by excluding certain items that may not be indicative of Glu's core business, operating results or future outlook. Glu's management uses, and believes that investors benefit from referring to, these non-GAAP financial measures in assessing Glu's operating results, as well as when planning, forecasting and analyzing future periods. These non-GAAP financial measures also facilitate comparisons of Glu's performance to prior periods. For a reconciliation of these non-GAAP financial measures to their most directly comparable GAAP financial measures, please refer to the tables attached to Glu’s earnings press release for the quarter ended December 31, 2011, which is available on our website at http://www.glu.com/investors. © Glu Mobile Inc. – Proprietary

Agenda Who is GluGrowth opportunityBusiness modelUpcoming product launchesFinancials & Guidance © Glu Mobile Inc. – Proprietary

Who is Glu? © Glu Mobile Inc. – Proprietary
Intersection of Two Rising Tides: Growth in gaming on mobile devicesGrowth in freemium & social gaming © Glu Mobile Inc. – Proprietary Gaming Company of Tomorrow
Experienced Management Niccolo de Masi, Chief Executive Officer and President Former CEO of Hands-On Mobile Former CEO of Monstermob Group Cambridge University (M.A. and Msci degrees) Eric R. Ludwig, Chief Financial Officer and EVP Former CFO of Instill Corporation Former Controller of Camstar Systems Price Waterhouse L.L.P. Santa Clara University (B.S. in Commerce) and CPA (inactive) © Glu Mobile Inc. – Proprietary
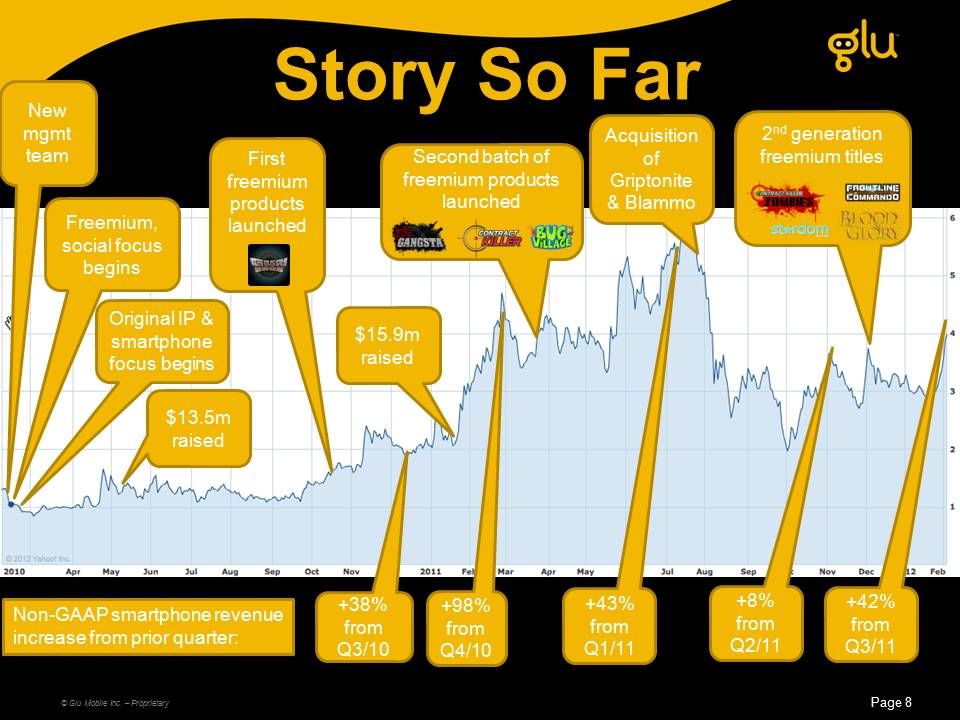
New mgmt team Freemium, social focus begins $13.5m raised $15.9m raised First freemium products launched Original IP & smartphone focus begins Second batch of freemium products launched +38% from Q3/10 +98% from Q4/10 +43% from Q1/11 Acquisition of Griptonite & Blammo 2nd generation freemium titles Non-GAAP smartphone revenue increase from prior quarter: +42% from Q3/11 +8% from Q2/11 Story So Far © Glu Mobile Inc. – Proprietary

Growth Opportunity © Glu Mobile Inc. – Proprietary
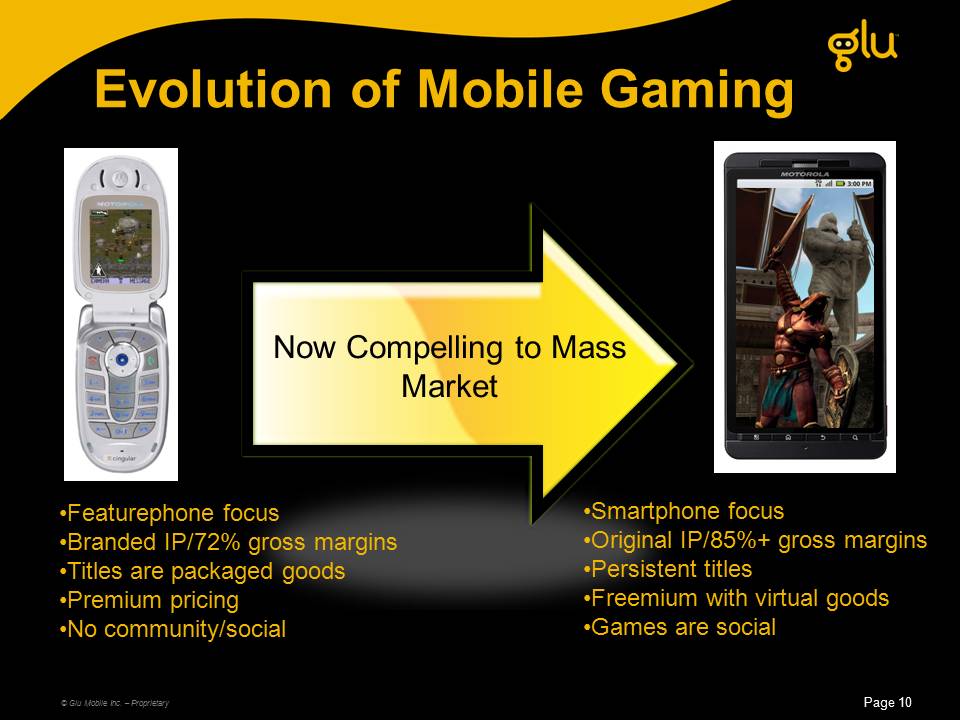
Now Compelling to Mass Market Featurephone focusBranded IP/72% gross marginsTitles are packaged goodsPremium pricingNo community/social Smartphone focusOriginal IP/85%+ gross marginsPersistent titlesFreemium with virtual goodsGames are social Evolution of Mobile Gaming © Glu Mobile Inc. – Proprietary
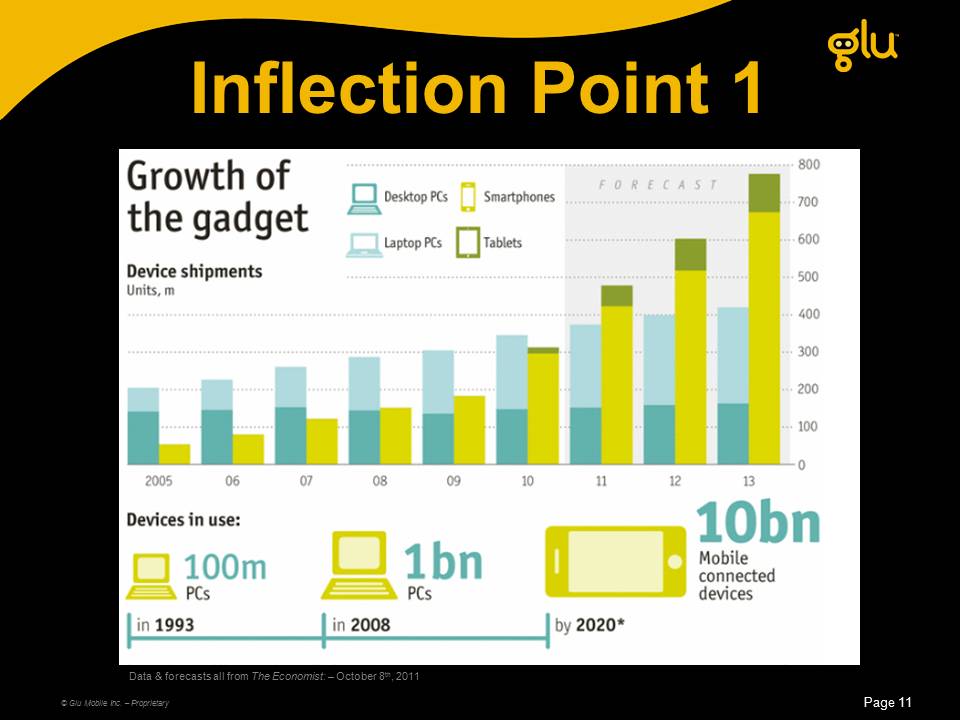
Inflection Point 1 © Glu Mobile Inc. – Proprietary Data & forecasts all from The Economist: – October 8th, 2011
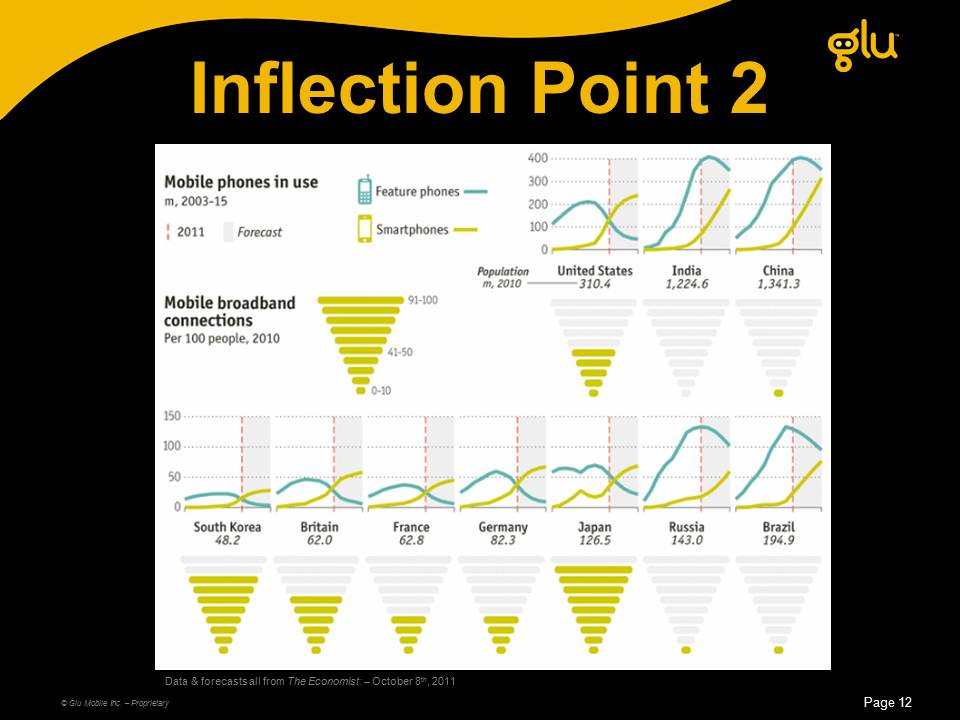
Inflection Point 2 © Glu Mobile Inc. – Proprietary Data & forecasts all from The Economist: – October 8th, 2011
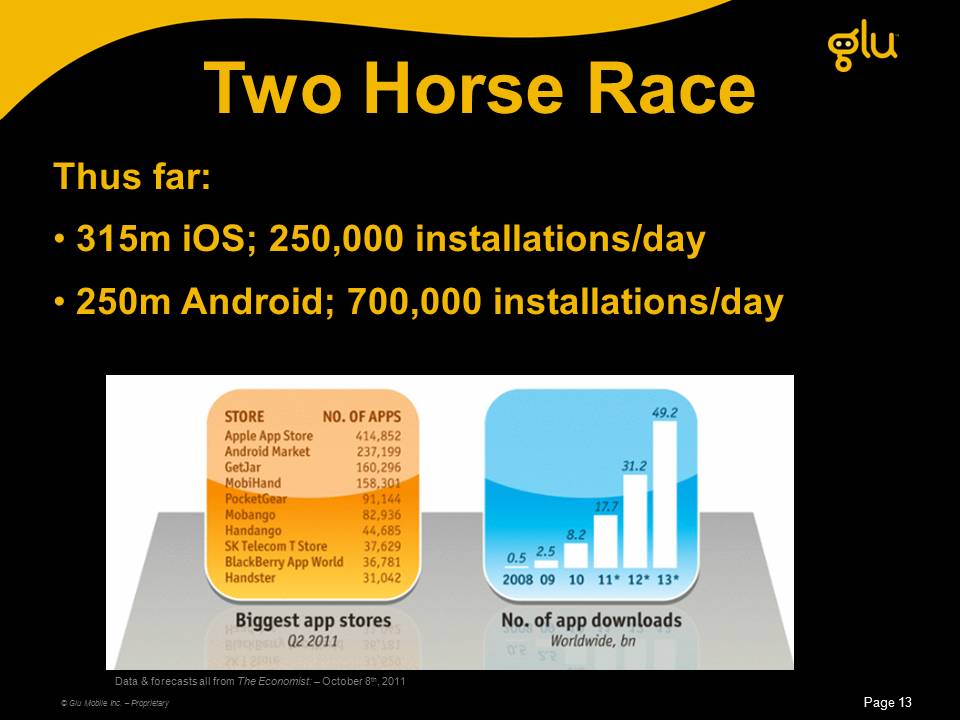
Two Horse Race Thus far: 315m iOS; 250,000 installations/day 250m Android; 700,000 installations/day © Glu Mobile Inc. – Proprietary Data & forecasts all from The Economist: – October 8th, 2011
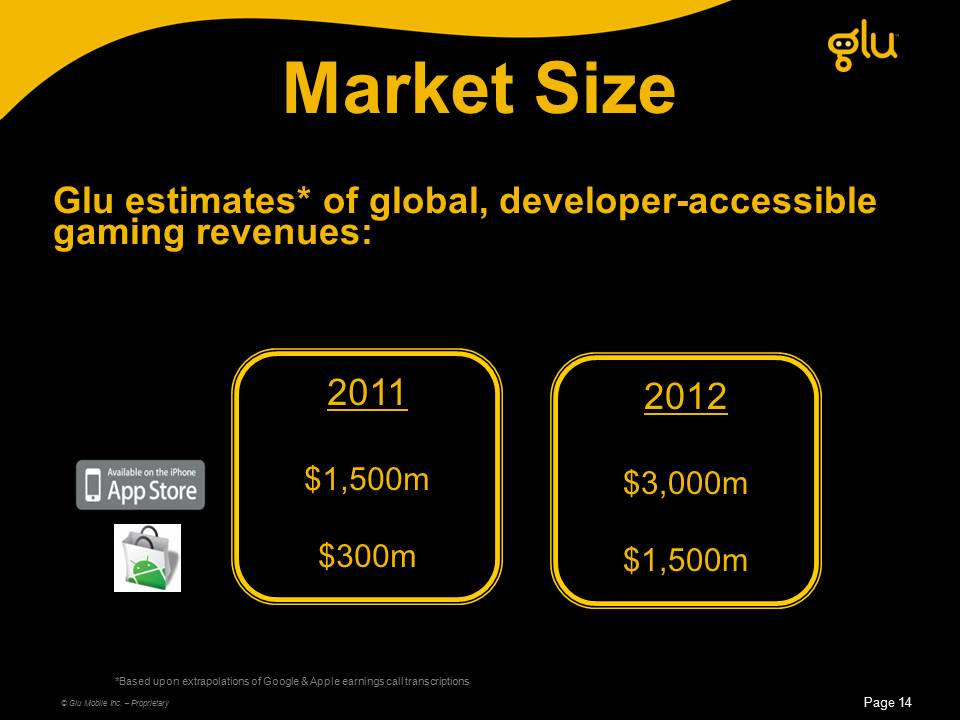
2011$1,500m$300m Market Size Glu estimates* of global, developer-accessible gaming revenues: © Glu Mobile Inc. – Proprietary 2012$3,000m$1,500m *Based upon extrapolations of Google & Apple earnings call transcriptions

Business Model © Glu Mobile Inc. – Proprietary
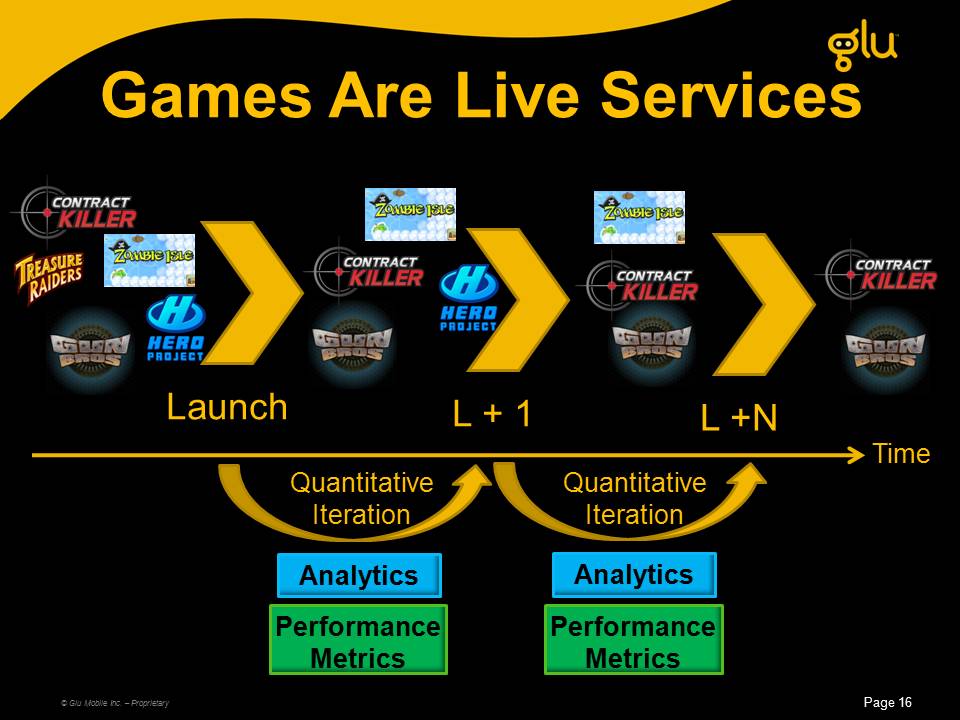
Games Are Live Services © Glu Mobile Inc. – Proprietary Launch L + 1 L +N Analytics Performance Metrics Analytics Performance Metrics Time Quantitative Iteration Quantitative Iteration
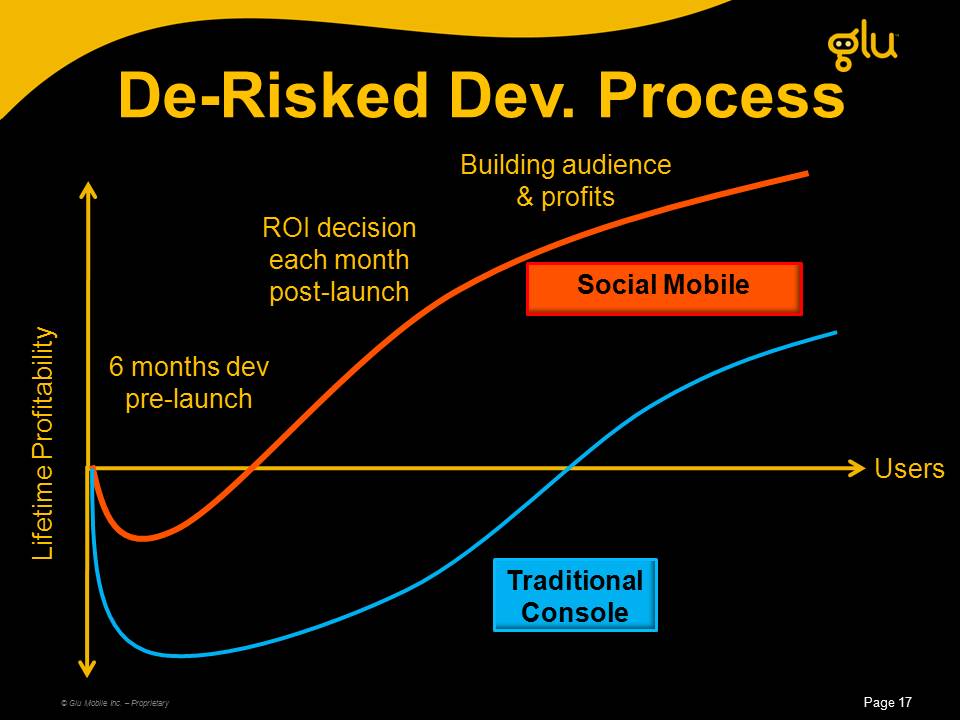
De-Risked Dev. Process © Glu Mobile Inc. – Proprietary Users Lifetime Profitability Traditional Console Social Mobile 6 months dev pre-launch ROI decision each month post-launch Building audience & profits
© Glu Mobile Inc. – Proprietary Why Freemium Equivalent or better short term revenues to premiumSimultaneously add users to long-term Glu audience – a cross marketing assetBrand equity/recognition built faster than premium due to rapid & larger audience exposure
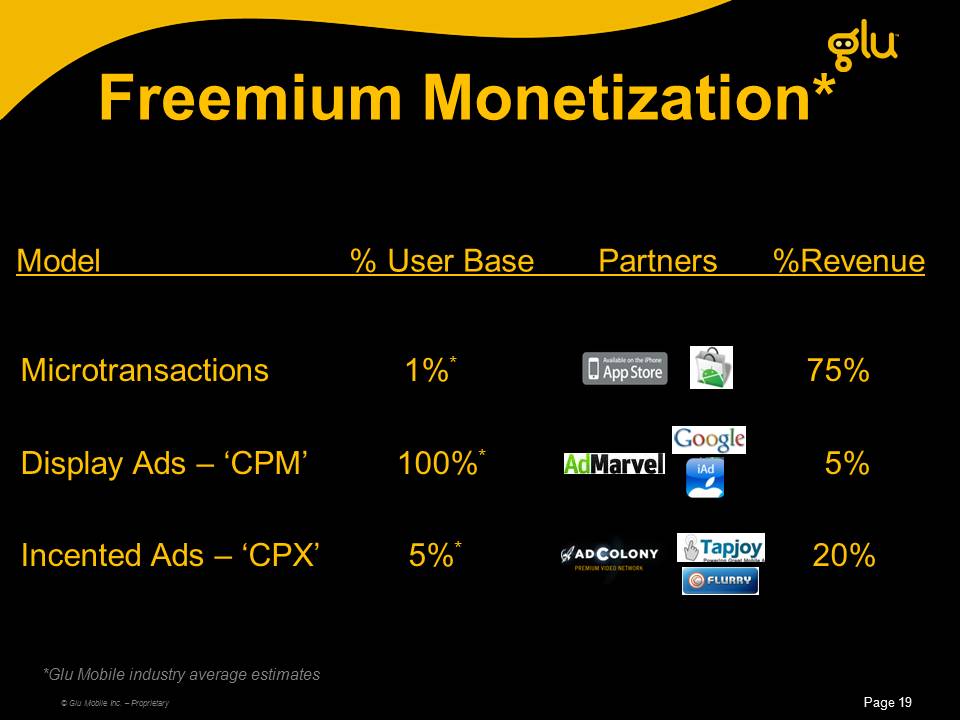
Freemium Monetization* Microtransactions 1%* 75% Display Ads – ‘CPM’ 100%* 5% Incented Ads – ‘CPX’ 5%* 20% Model % User Base Partners %Revenue *Glu Mobile industry average estimates © Glu Mobile Inc. – Proprietary
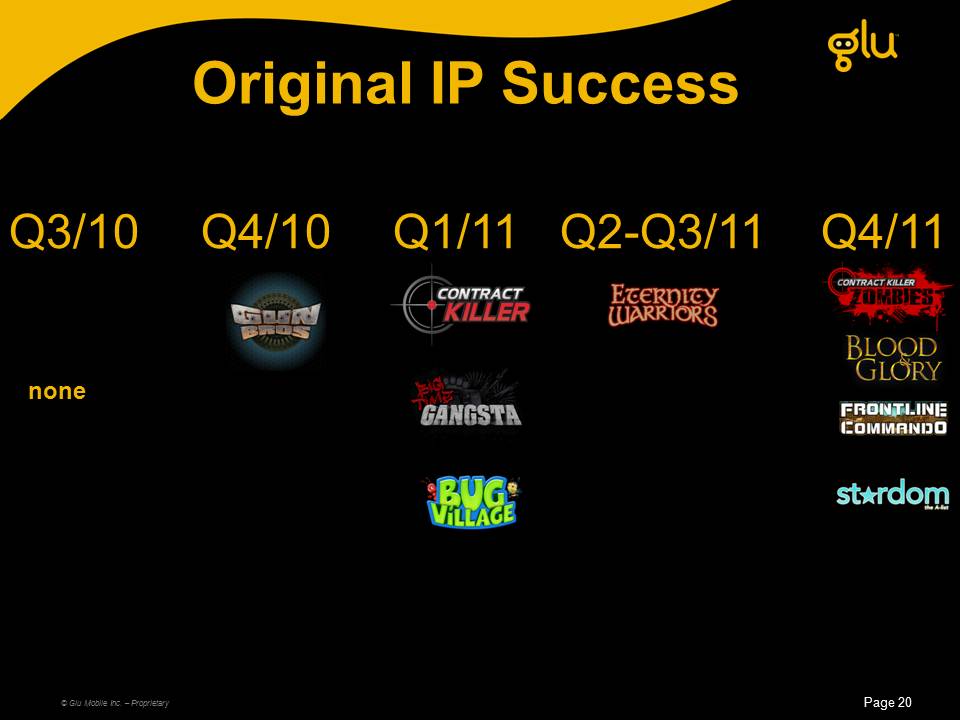
Original IP Success © Glu Mobile Inc. – Proprietary Q3/10 Q4/10 Q1/11 Q2-Q3/11 Q4/11 none
A Rising Tide Upon Us © Glu Mobile Inc. – Proprietary Android now installing > iOS handsets/dayFirst titles launched on AndroidAmong first titles launched with IAP and HoneycombExtensive OEM and carrier relationships
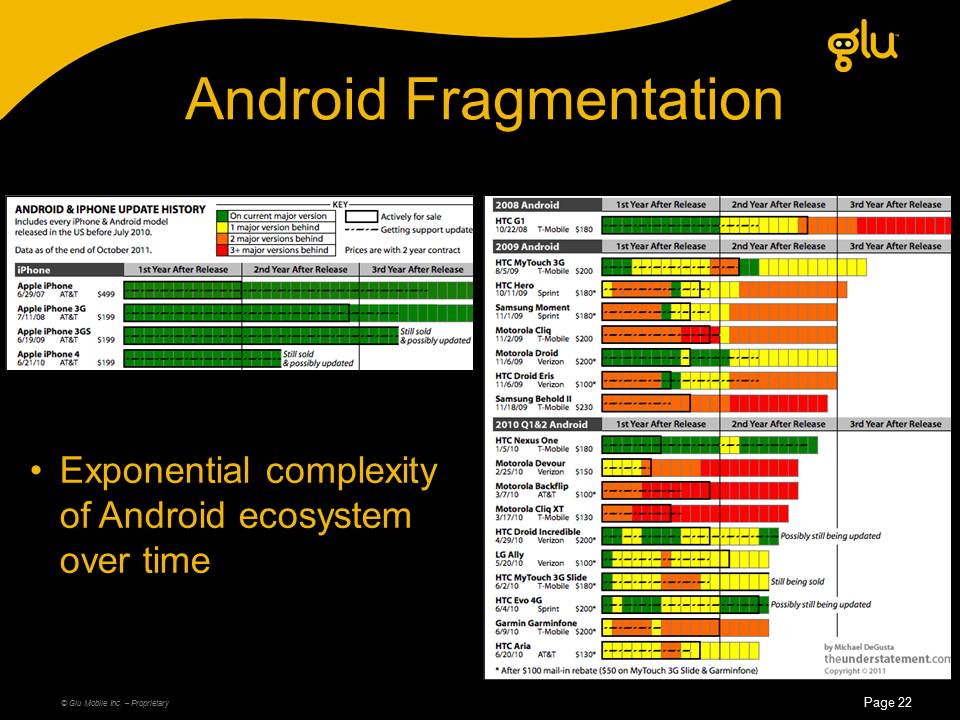
Android Fragmentation © Glu Mobile Inc. – Proprietary Exponential complexity of Android ecosystem over time
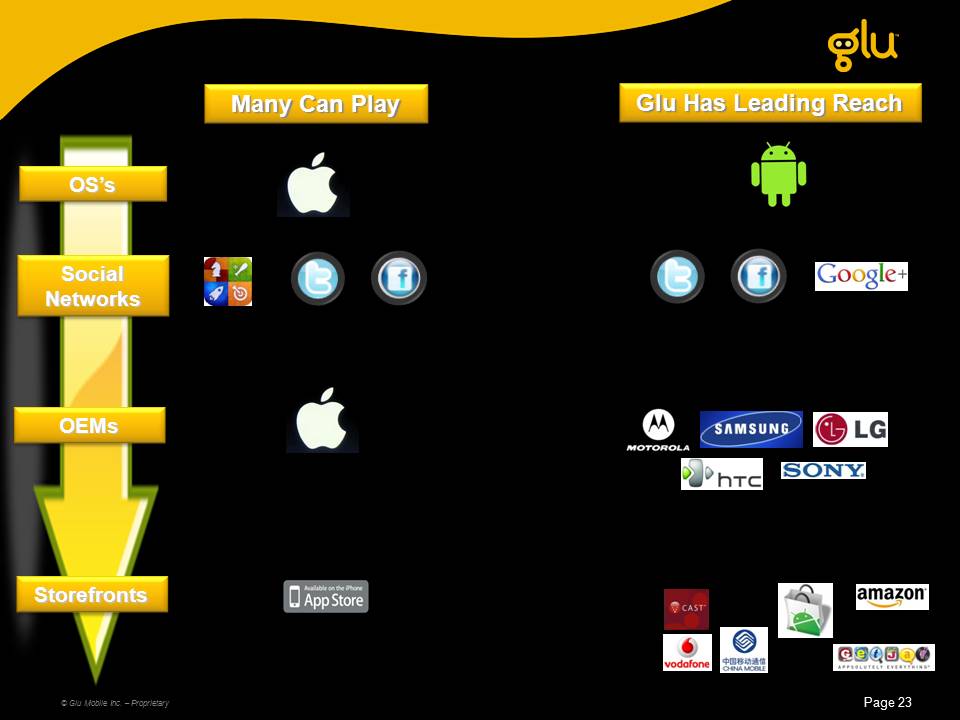
Many Can Play OS’s OEMs Storefronts Social Networks Glu Has Leading Reach © Glu Mobile Inc. – Proprietary

© Glu Mobile Inc. – Proprietary Freemium Product Strategy Gameplay Depth HTML 5 <20MB thin client >100MB thick client
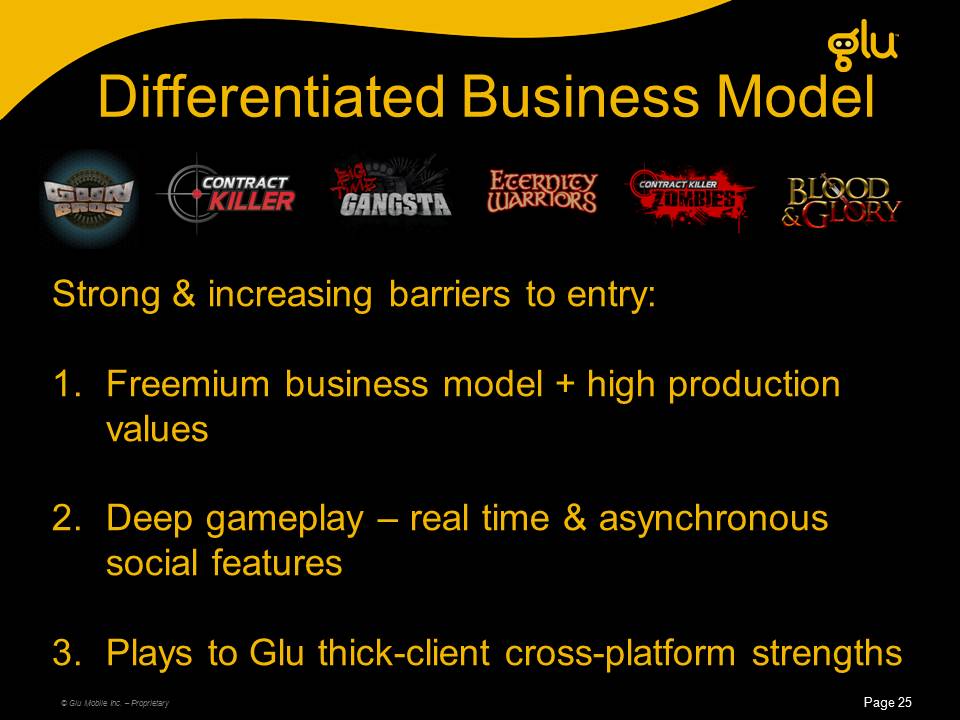
© Glu Mobile Inc. – Proprietary Strong & increasing barriers to entry:Freemium business model + high production valuesDeep gameplay – real time & asynchronous social featuresPlays to Glu thick-client cross-platform strengths Differentiated Business Model
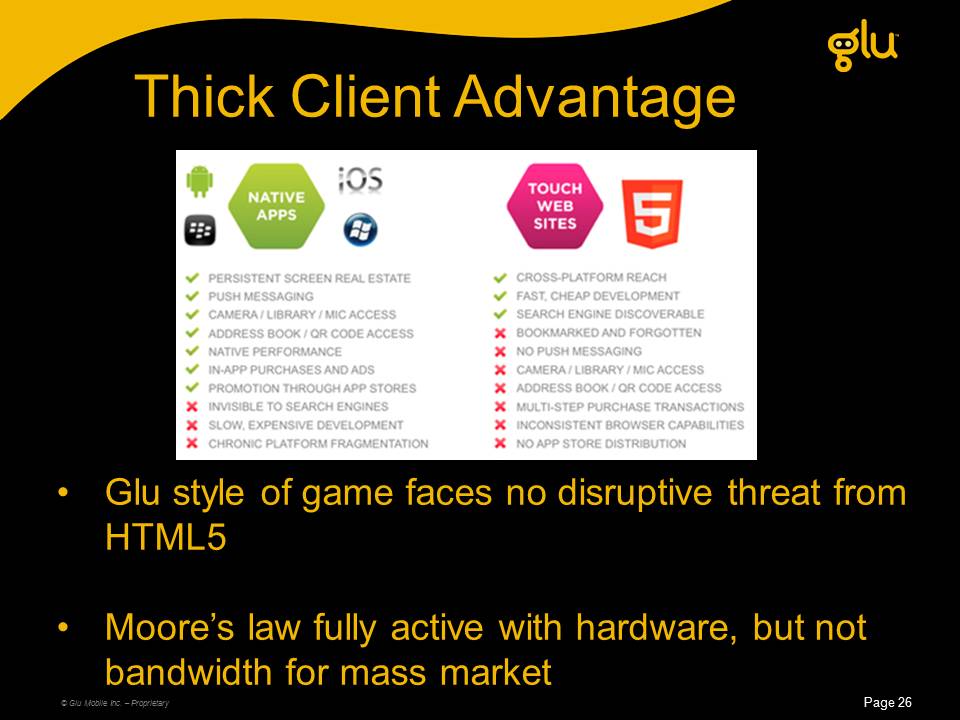
© Glu Mobile Inc. – Proprietary Glu style of game faces no disruptive threat from HTML5Moore’s law fully active with hardware, but not bandwidth for mass market Thick Client Advantage

Q1 2012 Line Up © Glu Mobile Inc. – Proprietary
© Glu Mobile Inc. – Proprietary Solving Discovery: Pt 1 Ensure game runs on all significant devices Ensure game is available through all significant storefronts with billing Build differentiated gameplay experience
© Glu Mobile Inc. – Proprietary Solving Discovery: Pt 2 Partner closely with ecosystem for featured storefront placement & preloadsCross-sell to existing Glu audience
© Glu Mobile Inc. – Proprietary Solving Discovery: Pt 3 Update game frequentlyMerchandising – promotions, prizes, etc.Direct & social marketing

Financials © Glu Mobile Inc. – Proprietary
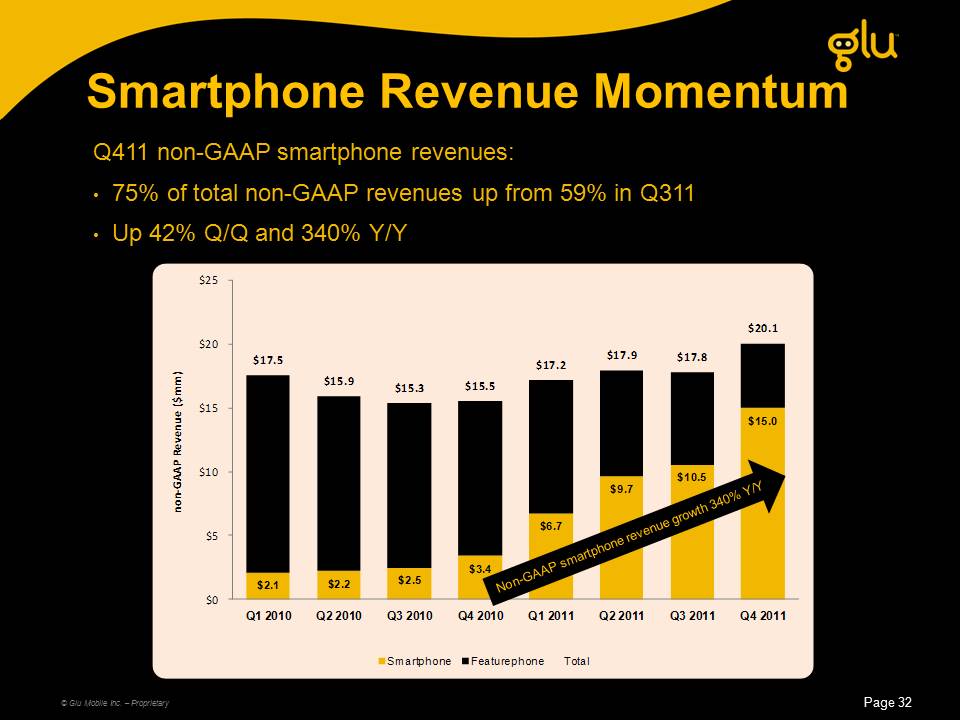
Q411 non-GAAP smartphone revenues: 75% of total non-GAAP revenues up from 59% in Q311Up 42% Q/Q and 340% Y/Y Smartphone Revenue Momentum © Glu Mobile Inc. – Proprietary (in millions of dollars) Non-GAAP smartphone revenue growth 340% Y/Y
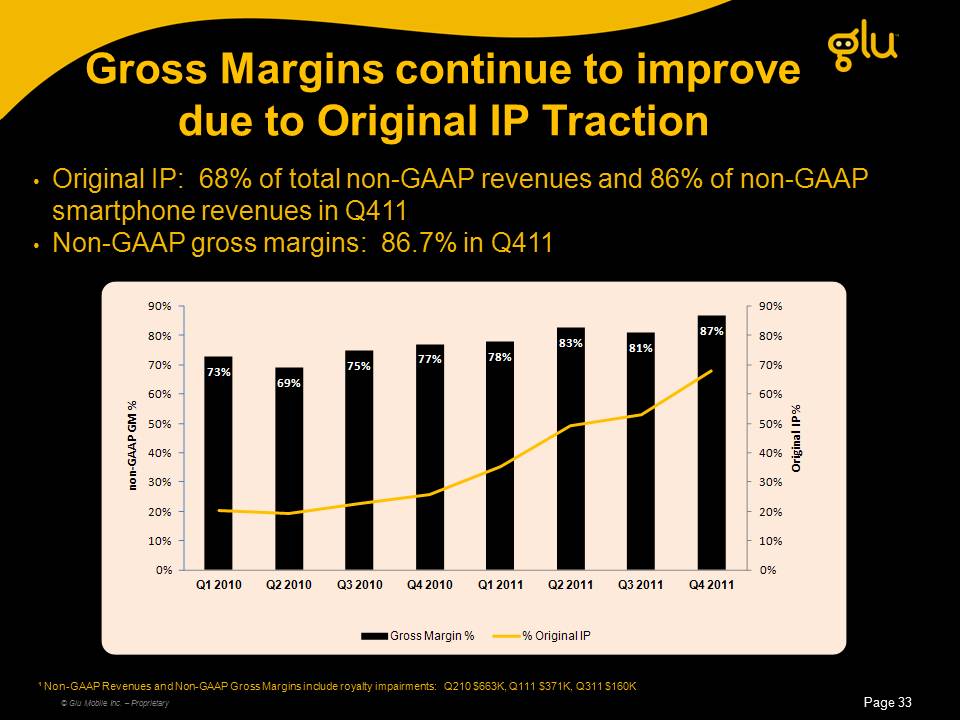
Gross Margins continue to improvedue to Original IP Traction Original IP: 68% of total non-GAAP revenues and 86% of non-GAAP smartphone revenues in Q411Non-GAAP gross margins: 86.7% in Q411 ¹ Non-GAAP Revenues and Non-GAAP Gross Margins include royalty impairments: Q210 $663K, Q111 $371K, Q311 $160K © Glu Mobile Inc. – Proprietary
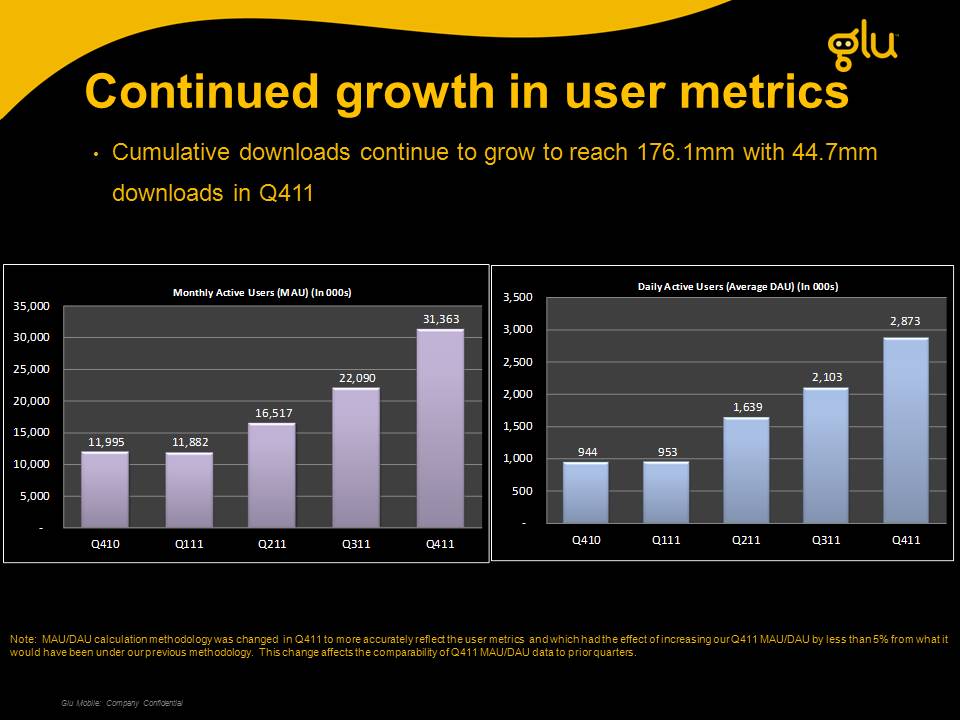
Glu Mobile: Company Confidential Cumulative downloads continue to grow to reach 176.1mm with 44.7mm downloads in Q411 Continued growth in user metrics Note: MAU/DAU calculation methodology was changed in Q411 to more accurately reflect the user metrics and which had the effect of increasing our Q411 MAU/DAU by less than 5% from what it would have been under our previous methodology. This change affects the comparability of Q411 MAU/DAU data to prior quarters.
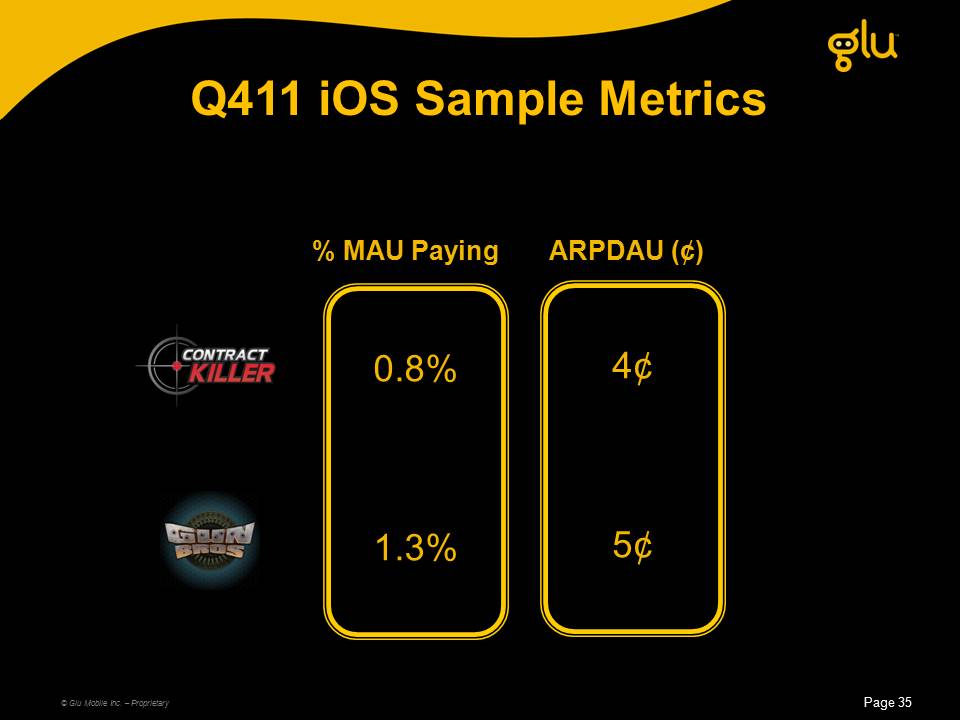
Q411 iOS Sample Metrics © Glu Mobile Inc. – Proprietary 0.8%1.3% 4¢5¢ % MAU Paying ARPDAU (¢)
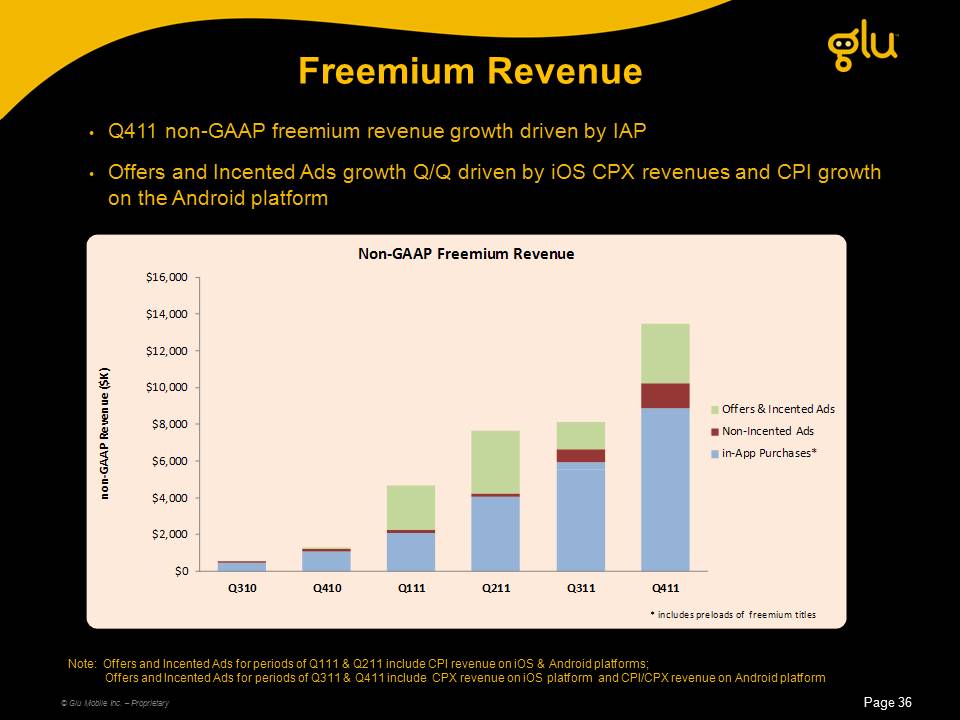
Q411 non-GAAP freemium revenue growth driven by IAPOffers and Incented Ads growth Q/Q driven by iOS CPX revenues and CPI growth on the Android platform Freemium Revenue (in thousands of dollars) © Glu Mobile Inc. – Proprietary Note: Offers and Incented Ads for periods of Q111 & Q211 include CPI revenue on iOS & Android platforms; Offers and Incented Ads for periods of Q311 & Q411 include CPX revenue on iOS platform and CPI/CPX revenue on Android platform

Q112 & 2012 Guidance Long Term Model © Glu Mobile Inc. – Proprietary
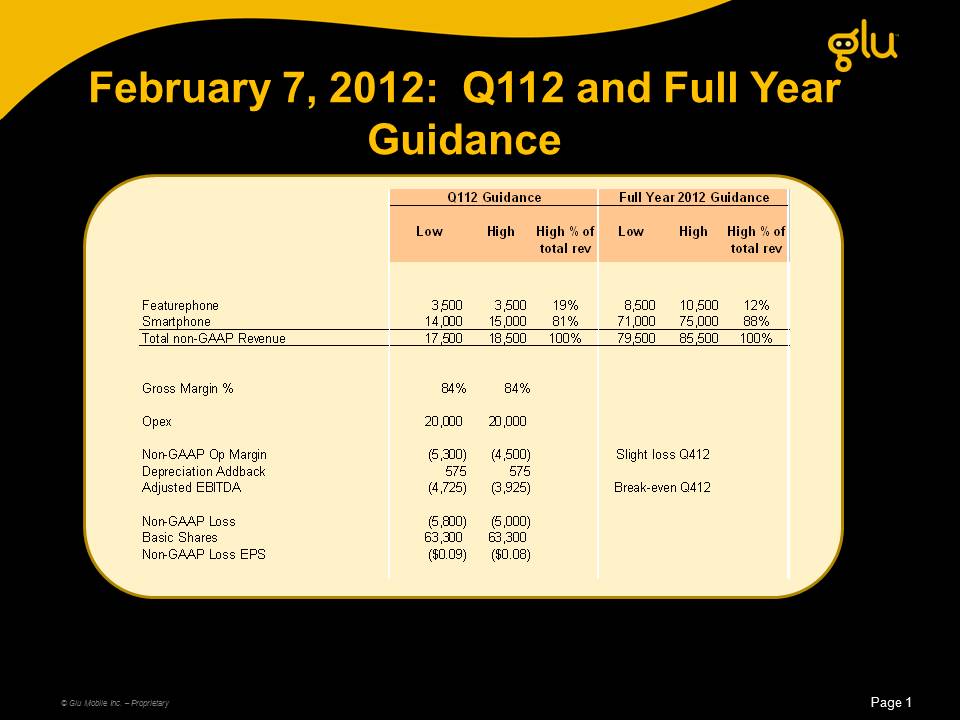
February 7, 2012: Q112 and Full Year Guidance © Glu Mobile Inc. – Proprietary
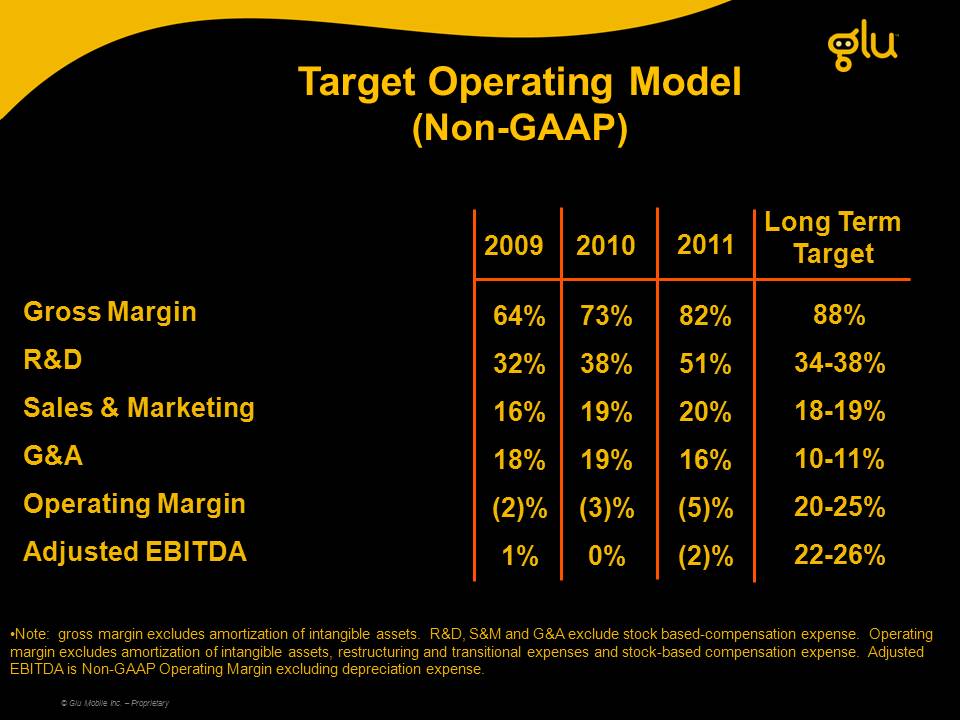
Target Operating Model(Non-GAAP) Gross MarginR&DSales & MarketingG&A Operating MarginAdjusted EBITDA (Gp:) 88%34-38%18-19%10-11%20-25%22-26% (Gp:) Long Term Target Note: gross margin excludes amortization of intangible assets. R&D, S&M and G&A exclude stock based-compensation expense. Operating margin excludes amortization of intangible assets, restructuring and transitional expenses and stock-based compensation expense. Adjusted EBITDA is Non-GAAP Operating Margin excluding depreciation expense. (Gp:) 73%38%19%19%(3)%0% (Gp:) 2010 (Gp:) 82%51%20%16%(5)%(2)% (Gp:) 2011 (Gp:) 64%32%16%18%(2)%1% (Gp:) 2009 © Glu Mobile Inc. – Proprietary
Glu Mobile: Investment Overview Leading freemium, social mobile gaming companyOriginal IP titles driving gross margin improvementsAcquired two companies to approximately double development capacity © Glu Mobile Inc. – Proprietary