Attached files
| file | filename |
|---|---|
| 8-K - FORM 8-K - Bridge Capital Holdings | v301470_8k.htm |
Bridge Capital Holdings Investor Update February 2012 Daniel P. Myers President Chief Executive Officer Director Thomas A. Sa Executive Vice President Chief Financial Officer Chief Strategy Officer NASDAQ: BBNK WWW.BRIDGECAPITALHOLDINGS.COM
Forward Looking Statements Certain matters discussed herein constitute forward - looking statements within the meaning of the Private Securities Litigation Reform Act of 1995, and are subject to the safe harbors created by that Act. Forward - looking statements describe future plans, strategies, and expectations, and are based on currently available information, expectations, assumptions, projections, and management's judgment about the Bank, the banking industry and general economic conditions. These forward looking statements are subject to certain risks and uncertainties that could cause the actual results, performance or achievements to differ materially from those expressed, suggested or implied by the forward looking statements. These risks and uncertainties include, but are not limited to: (1) competitive pressures in the banking industry; (2) changes in interest rate environment; (3) general economic conditions, nationally, regionally, and in operating markets; (4) changes in the regulatory environment; (5) changes in business conditions and inflation; (6) changes in securities markets; (7) future credit loss experience; (8) the ability to satisfy requirements related to the Sarbanes - Oxley Act and other regulation on internal control; (9) civil disturbances or terrorist threats or acts, or apprehension about the possible future occurrences of acts of this type; and (10) the involvement of the United States in war or other hostilities. The reader should refer to the more complete discussion of such risks in Bridge Capital Holdings reports on Forms 10 - K and 10 - Q on file with the SEC. 2
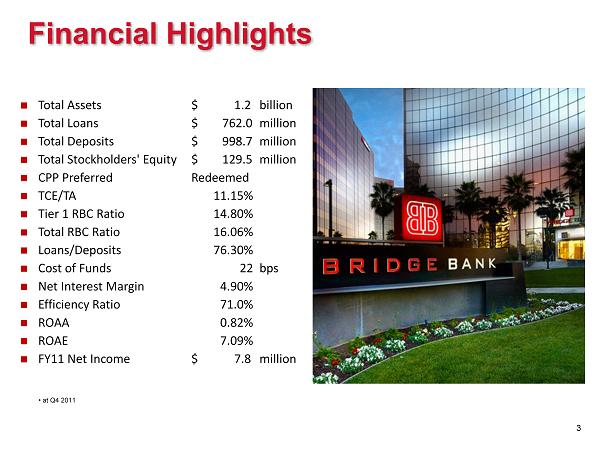
■ Total Assets $ 1.2 billion ■ Total Loans $ 762.0 million ■ Total Deposits $ 998.7 million ■ Total Stockholders' Equity $ 129.5 million ■ CPP Preferred Redeemed ■ TCE/TA 11.15% ■ Tier 1 RBC Ratio 14.80% ■ Total RBC Ratio 16.06% ■ Loans/Deposits 76.30% ■ Cost of Funds 22 bps ■ Net Interest Margin 4.90% ■ Efficiency Ratio 71.0% ■ ROAA 0.82% ■ ROAE 7.09% ■ FY11 Net Income $ 7.8 million Financial Highlights 3 • at Q4 2011

Bridge Bank Franchise ▪ Operating in attractive Silicon Valley and tech centric markets ▪ 2 regional business centers + 6 business offices ▪ Full range of corporate banking products delivered through experienced advisors ▪ Unique & effective use of banking technology ▪ Core funding - driven approach to building the business ▪ Surpassed $1 billion in assets at end of 2010 ▪ Experienced board and management ▪ Disciplined execution of our business plan Limited exposure to real estate Continued core growth through crisis 4
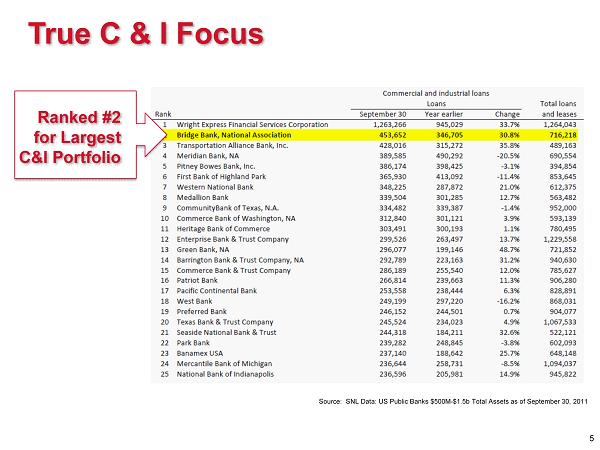
Ranked #2 for Largest C&I Portfolio Source: SNL Data: US Public Banks $500M - $1.5b Total Assets as of September 30, 2011 5 True C & I Focus
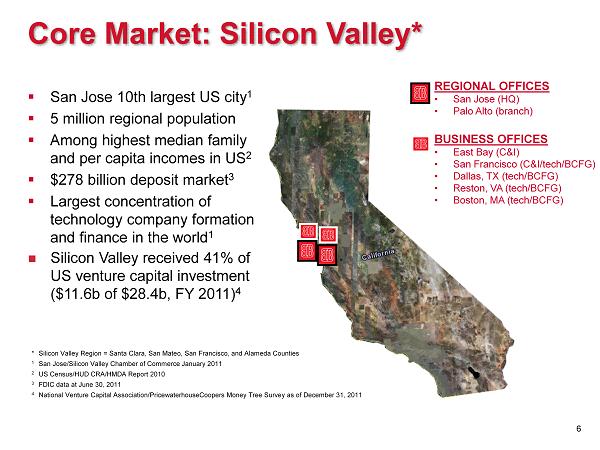
Core Market: Silicon Valley* ▪ San Jose 10th largest US city 1 ▪ 5 million regional population ▪ Among highest median family and per capita incomes in US 2 ▪ $278 billion deposit market 3 ▪ Largest concentration of technology company formation and finance in the world 1 Silicon Valley received 41% of US venture capital investment ($11.6b of $28.4b, FY 2011) 4 REGIONAL OFFICES • San Jose (HQ) • Palo Alto (branch) BUSINESS OFFICES • East Bay (C&I) • San Francisco (C&I/tech/BCFG) • Dallas, TX (tech/BCFG) • Reston, VA (tech/BCFG) • Boston, MA (tech/BCFG) * Silicon Valley Region = Santa Clara, San Mateo, San Francisco, and Alameda Counties 1 San Jose/Silicon Valley Chamber of Commerce January 2011 2 US Census/HUD CRA/HMDA Report 2010 3 FDIC data at June 30, 2011 4 National Venture Capital Association/PricewaterhouseCoopers Money Tree Survey as of December 31, 2011 6
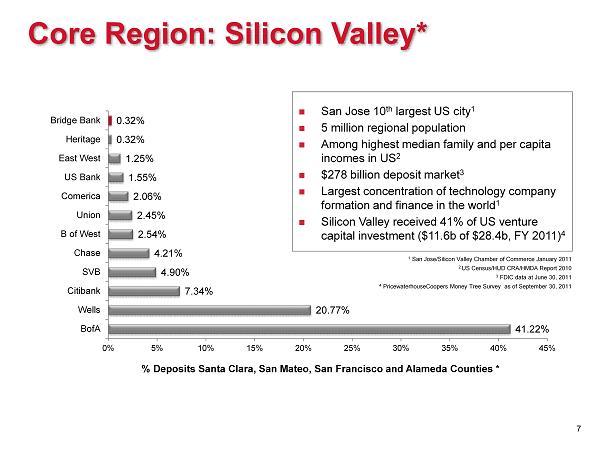
Core Region: Silicon Valley* 41.22% 20.77% 7.34% 4.90% 4.21% 2.54% 2.45% 2.06% 1.55% 1.25% 0.32% 0.32% 0% 5% 10% 15% 20% 25% 30% 35% 40% 45% BofA Wells Citibank SVB Chase B of West Union Comerica US Bank East West Heritage Bridge Bank % Deposits Santa Clara , San Mateo , San Francisco and Alameda Counties * San Jose 10 th largest US city 1 5 million regional population Among highest median family and per capita incomes in US 2 $278 billion deposit market 3 Largest concentration of technology company formation and finance in the world 1 Silicon Valley received 41% of US venture capital investment ($11.6b of $28.4b, FY 2011) 4 7 1 San Jose/Silicon Valley Chamber of Commerce January 2011 2 US Census/HUD CRA/HMDA Report 2010 3 FDIC data at June 30, 2011 4 PricewaterhouseCoopers Money Tree Survey as of September 30, 2011
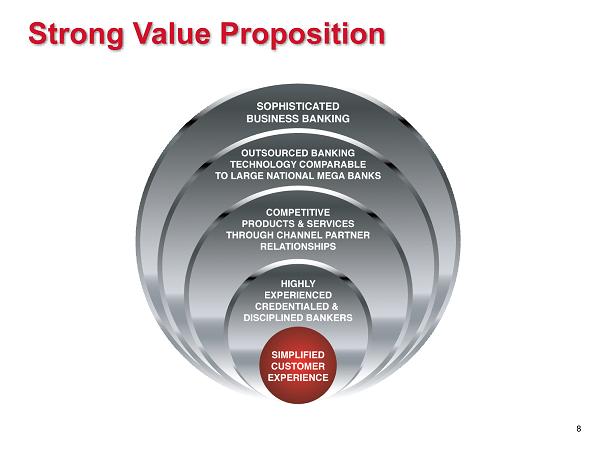
Strong Value Proposition 8
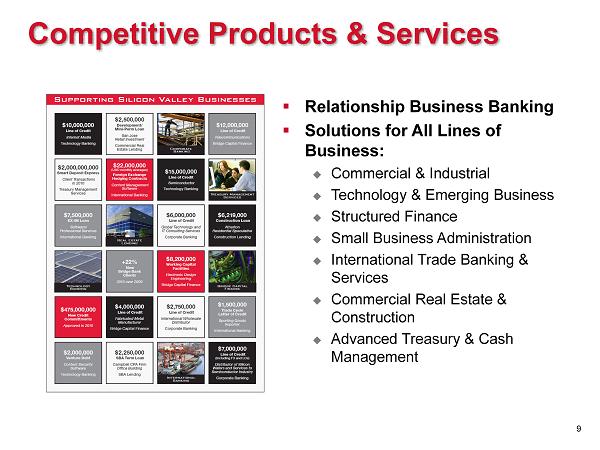
Competitive Products & Services ▪ Relationship Business Banking ▪ Solutions for All Lines of Business: Commercial & Industrial Technology & Emerging Business Structured Finance Small Business Administration I nternational Trade Banking & Services Commercial Real Estate & Construction Advanced Treasury & Cash Management 9
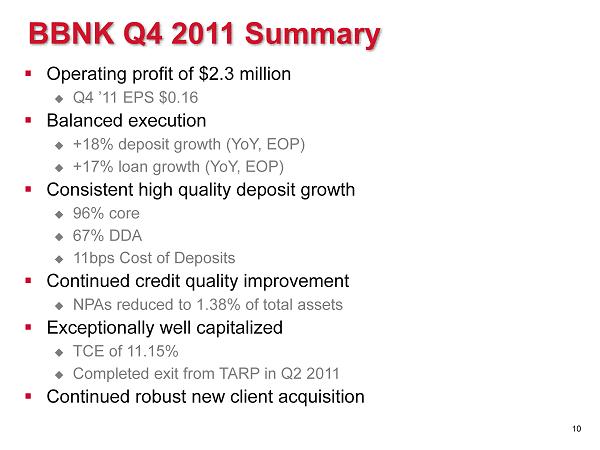
BBNK Q4 2011 Summary ▪ Operating profit of $2.3 million Q4 ’11 EPS $0.16 ▪ Balanced execution +18% deposit growth (YoY, EOP) +17% loan growth (YoY, EOP) ▪ Consistent high quality deposit growth 96% core 67% DDA 11bps Cost of Deposits ▪ Continued credit quality improvement NPAs reduced to 1.38% of total assets ▪ Exceptionally well capitalized TCE of 11.15% Completed exit from TARP in Q2 2011 ▪ Continued robust new client acquisition 10
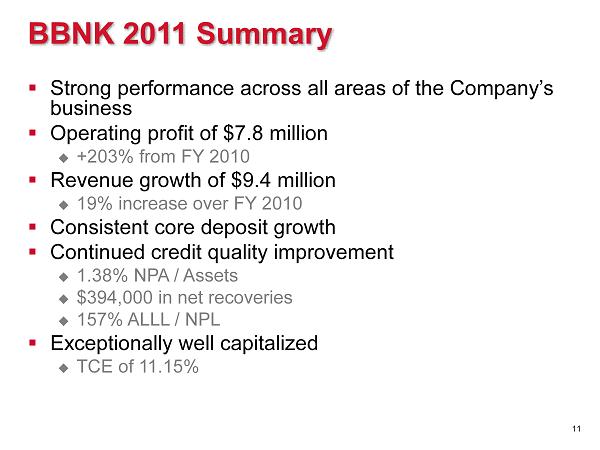
BBNK 2011 Summary ▪ Strong performance across all areas of the Company’s business ▪ Operating profit of $7.8 million +203% from FY 2010 ▪ Revenue growth of $9.4 million 19% increase over FY 2010 ▪ Consistent core deposit growth ▪ Continued credit quality improvement 1.38% NPA / Assets $394,000 in net recoveries 157% ALLL / NPL ▪ Exceptionally well capitalized TCE of 11.15% 11
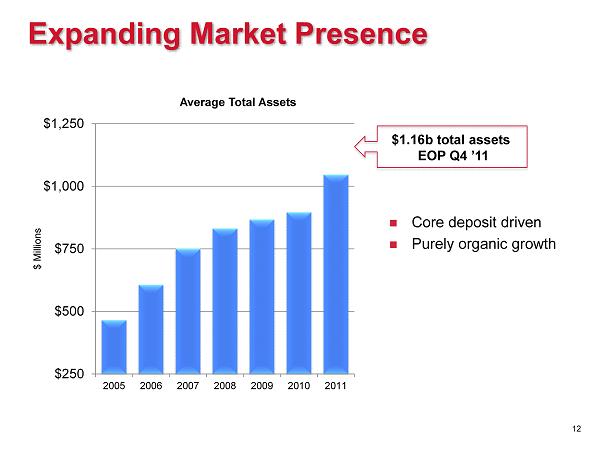
Expanding Market Presence $250 $500 $750 $1,000 $1,250 2005 2006 2007 2008 2009 2010 2011 $ Millions Average Total Assets Core deposit driven Purely organic growth $1.16b total assets EOP Q4 ’11 12
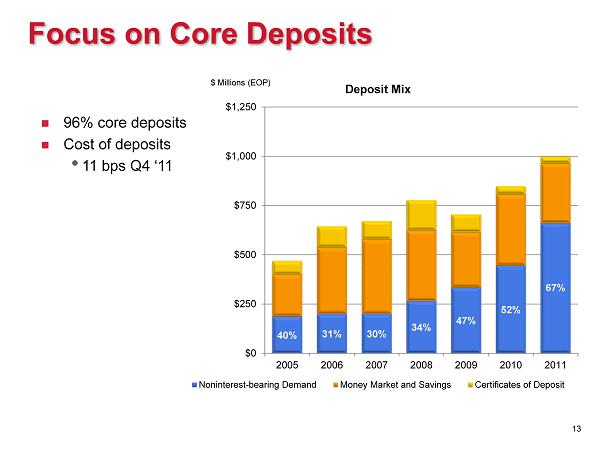
Focus on Core Deposits 40% 31% 30% 34% 47% 52% 67% $0 $250 $500 $750 $1,000 $1,250 2005 2006 2007 2008 2009 2010 2011 $ Millions (EOP) Deposit Mix Noninterest-bearing Demand Money Market and Savings Certificates of Deposit 96% core deposits Cost of deposits • 11 bps Q4 ‘11 13
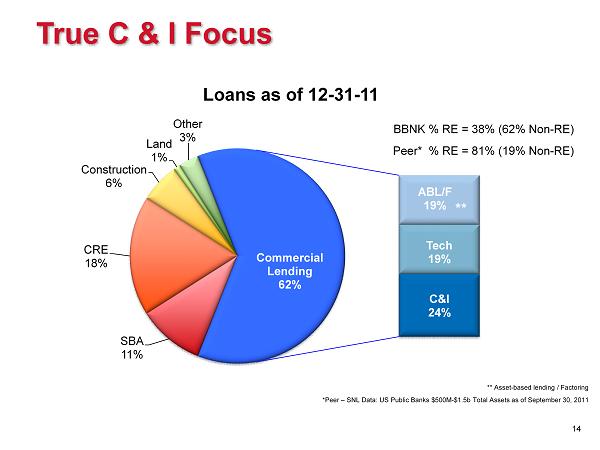
SBA 11% CRE 18% Construction 6% Land 1% Other 3% ABL/F 19% Tech 19% C&I 24% Commercial Lending 62% Loans as of 12 - 31 - 11 True C & I Focus BBNK % RE = 38% ( 62% Non - RE) Peer* % RE = 81% (19% Non - RE) * Peer – SNL Data: US Public Banks $500M - $1.5b Total Assets as of September 30, 2011 ** Asset - based lending / Factoring 14 **
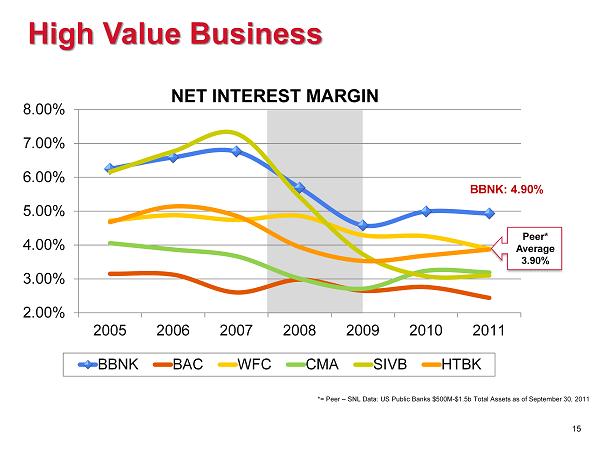
2.00% 3.00% 4.00% 5.00% 6.00% 7.00% 8.00% 2005 2006 2007 2008 2009 2010 2011 NET INTEREST MARGIN BBNK BAC WFC CMA SIVB HTBK High Value Business Peer* Average 3.90% BBNK: 4.90% 15 *= Peer – SNL Data: US Public Banks $500M - $1.5b Total Assets as of September 30, 2011
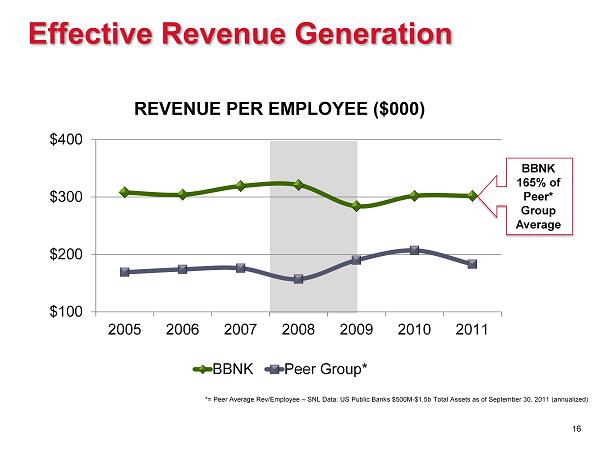
$100 $200 $300 $400 2005 2006 2007 2008 2009 2010 2011 REVENUE PER EMPLOYEE ($000) BBNK Peer Group* Effective Revenue Generation *= Peer Average Rev/Employee – SNL Data: US Public Banks $500M - $1.5b Total Assets as of September 30, 2011 (annualized) BBNK 165% of Peer* Group Average 16

$- $10 $20 $30 $40 $50 $60 $70 2005 2006 2007 2008 2009 2010 2011 $MM Improving Operating Leverage REVENUE Non - Interest Expense 17
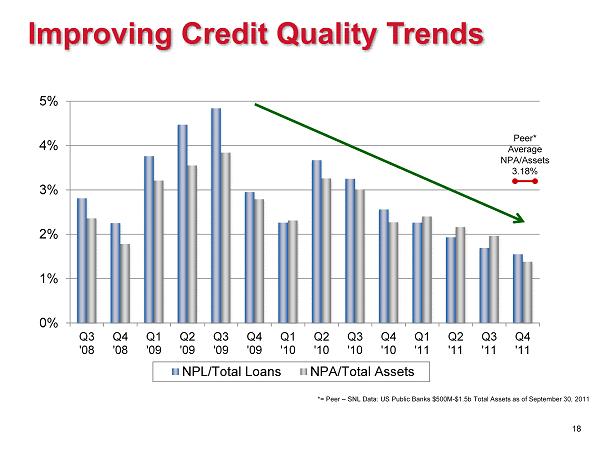
Improving Credit Quality Trends 0% 1% 2% 3% 4% 5% Q3 '08 Q4 '08 Q1 '09 Q2 '09 Q3 '09 Q4 '09 Q1 '10 Q2 '10 Q3 '10 Q4 '10 Q1 '11 Q2 '11 Q3 '11 Q4 '11 NPL/Total Loans NPA/Total Assets Peer* Average NPA/Assets 3.18% *= Peer – SNL Data: US Public Banks $500M - $1.5b Total Assets as of September 30, 2011 18
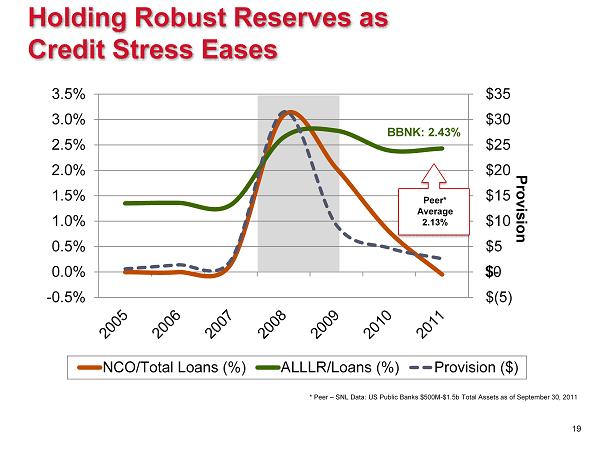
$(5) $- $5 $10 $15 $20 $25 $30 $35 -0.5% 0.0% 0.5% 1.0% 1.5% 2.0% 2.5% 3.0% 3.5% Provision NCO/Total Loans (%) ALLLR/Loans (%) Provision ($) Holding Robust Reserves as Credit Stress Eases BBNK: 2.43% * Peer – SNL Data: US Public Banks $500M - $1.5b Total Assets as of September 30, 2011 19 $0 Peer* Average 2.13%
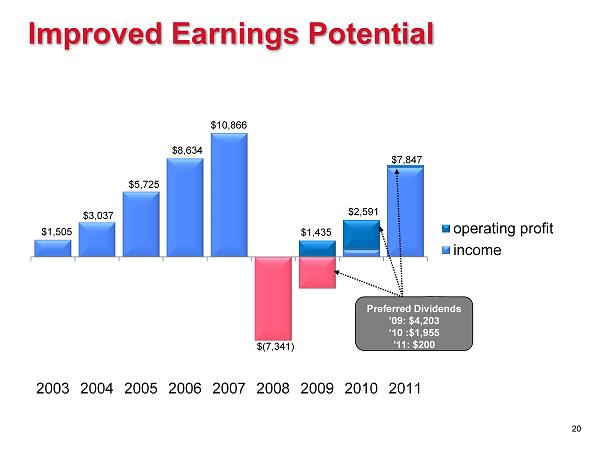
Improved Earnings Potential $1,505 $3,037 $5,725 $8,634 $10,866 $(7,341) $7,847 $1,435 $2,591 2003 2004 2005 2006 2007 2008 2009 2010 2011 operating profit income 20 Preferred Dividends ’09: $4,203 ‘10 :$ 1,955 ’11: $200

Capital for Growth and Opportunity * Peer – SNL Data: US Public Banks $500M - $1.5b Total Assets as of September 30, 2011 TCE Ratio Leverage Total RBC Regulatory Minimum 6.00% 10.00% Peer* 8.21% 10.06% 15.84% BBNK 11.15% 13.36% 16.06% 0% 5% 10% 15% 20% As of December 31, 2011 21
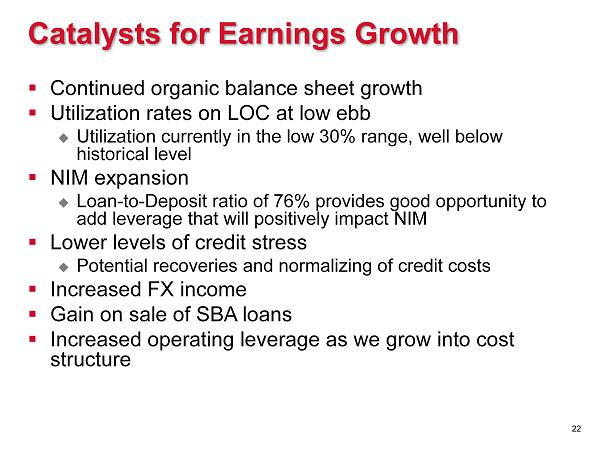
Catalysts for Earnings Growth ▪ Continued organic balance sheet growth ▪ Utilization rates on LOC at low ebb Utilization currently in the low 30% range, well below historical level ▪ NIM expansion Loan - to - Deposit ratio of 76% provides good opportunity to add leverage that will positively impact NIM ▪ Lower levels of credit stress Potential recoveries and normalizing of credit costs ▪ Increased FX income ▪ Gain on sale of SBA loans ▪ Increased operating leverage as we grow into cost structure 22

Maintain COMPETITIVE Value Proposition Attract and ACQUIRE NEW CLIENTS Generate CORE DEPOSIT Balances LEND to Creditworthy Borrowers Maintain EXCELLENT ASSET QUALITY Aggressively MANAGE EXPENSES Leverage CAPITAL FOR GROWTH FOCUS ON BU SINESS BANKING Markets and Lines of Business We Know Well Straightforward Growth Strategy 23
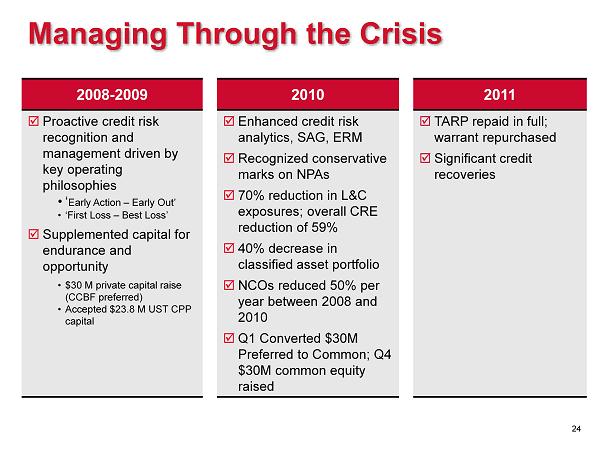
Managing Through the Crisis 2008 - 2009 2010 2011 Proactive credit risk recognition and management driven by key operating philosophies • ‘ Early Action – Early Out’ • ‘First Loss – Best Loss’ Supplemented capital for endurance and opportunity • $30 M private capital raise (CCBF preferred) • Accepted $23.8 M UST CPP capital Enhanced credit risk analytics, SAG, ERM Recognized conservative marks on NPAs 70% reduction in L&C exposures; overall CRE reduction of 59% 40% decrease in classified asset portfolio NCOs reduced 50% per year between 2008 and 2010 Q1 Converted $30M Preferred to Common; Q4 $30M common equity raised TARP repaid in full; warrant repurchased Significant credit recoveries 24
Contact Information Investor Relations Contact Thomas A. Sa Bridge Capital Holdings 55 Almaden Blvd., Suite 200 San Jose, CA 95113 (408) 423 - 8500 ir@bridgebank.com 25
26
Thank You / Q & A 27