Attached files
| file | filename |
|---|---|
| 8-K - FORM 8-K - ASTORIA FINANCIAL CORP | v301542_8k.htm |

Investor Presentation Fourth Quarter Ended December 31, 2011 www.astoriafederal.com
Astoria Financial Corporation 2 Forward Looking Statement This presentation may contain a number of forward - looking statements within the meaning of Section 27 A of the Securities Act of 1933 , as amended, and Section 21 E of the Securities Exchange Act of 1934 , as amended . These statements may be identified by the use of the words “anticipate,” “believe,” “could,” “estimate,” “expect,” “intend,” “may,” “outlook,” “plan,” “potential,” “predict,” “project,” “should,” “will,” “would,” and similar terms and phrases, including references to assumptions . Forward - looking statements are based on various assumptions and analyses made by us in light of our management’s experience and perception of historical trends, current conditions and expected future developments, as well as other factors we believe are appropriate under the circumstances . These statements are not guarantees of future performance and are subject to risks, uncertainties and other factors (many of which are beyond our control) that could cause actual results to differ materially from future results expressed or implied by such forward - looking statements . These factors include, without limitation, the following : the timing and occurrence or non - occurrence of events may be subject to circumstances beyond our control ; there may be increases in competitive pressure among financial institutions or from non - financial institutions ; changes in the interest rate environment may reduce interest margins or affect the value of our investments ; changes in deposit flows, loan demand or real estate values may adversely affect our business ; changes in accounting principles, policies or guidelines may cause our financial condition to be perceived differently ; general economic conditions, either nationally or locally in some or all areas in which we do business, or conditions in the real estate or securities markets or the banking industry may be less favorable than we currently anticipate ; legislative or regulatory changes, including the implementation of the Dodd - Frank Wall Street Reform and Consumer Protection Act of 2010 , or the Reform Act, and any actions regarding foreclosures, may adversely affect our business ; transition of our regulatory supervisor from the Office of Thrift Supervision to the Office of the Comptroller of the Currency ; effects of changes in existing U . S . government or government - sponsored mortgage programs ; technological changes may be more difficult or expensive than we anticipate ; success or consummation of new business initiatives may be more difficult or expensive than we anticipate ; or litigation or other matters before regulatory agencies, whether currently existing or commencing in the future, may be determined adverse to us or may delay occurrence or non - occurrence of events longer than we anticipate . We have no obligation to update any forward - looking statements to reflect events or circumstances after the date of this document .
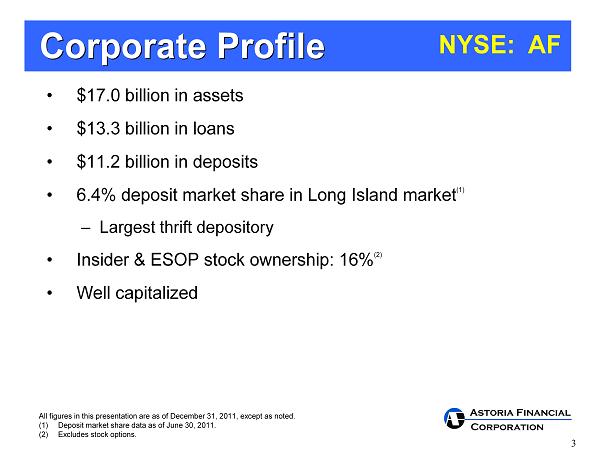
Astoria Financial Corporation 3 NYSE: AF Corporate Profile • $17.0 billion in assets • $13.3 billion in loans • $11.2 billion in deposits • 6.4% deposit market share in Long Island market (1) – Largest thrift depository • Insider & ESOP stock ownership: 16% (2) • Well capitalized All figures in this presentation are as of December 31, 2011, except as noted. (1) Deposit market share data as of June 30, 2011. (2) Excludes stock options.
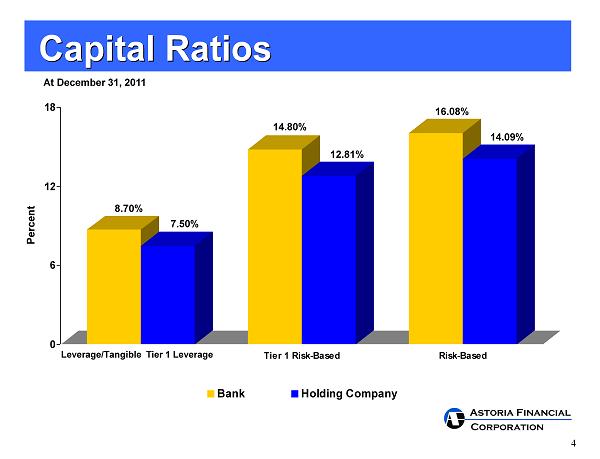
Astoria Financial Corporation 4 0 6 12 18 Percent Tier 1 Risk-Based Risk-Based Bank Holding Company Capital Ratios Leverage/Tangible Tier 1 Leverage At December 31, 2011 8.70% 7.50% 14.80% 12.81% 16.08% 14.09%
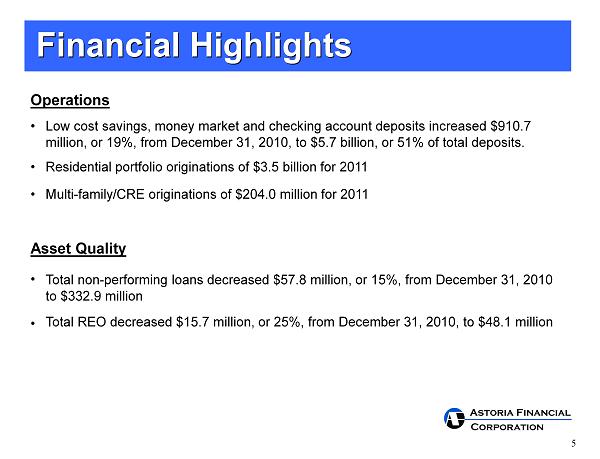
Astoria Financial Corporation 5 Financial Highlights Operations • Low cost savings, money market and checking account deposits increased $910.7 million, or 19%, from December 31, 2010, to $5.7 billion, or 51% of total deposits. • Residential portfolio originations of $3.5 billion for 2011 • Multi - family/CRE originations of $204.0 million for 2011 Asset Quality • Total non - performing loans decreased $57.8 million, or 15%, from December 31, 2010 to $332.9 million • Total REO decreased $15.7 million, or 25%, from December 31, 2010, to $48.1 million

Astoria Financial Corporation 6 Core Competency x Mortgage Lending • Portfolio lender, not a mortgage banker Residential lending expertise Multi - family and CRE lending expertise • Solid asset quality x Retail Banking • Premier community bank on Long Island • Dominant deposit market share • #1 thrift depository in core market, #4 among all banks
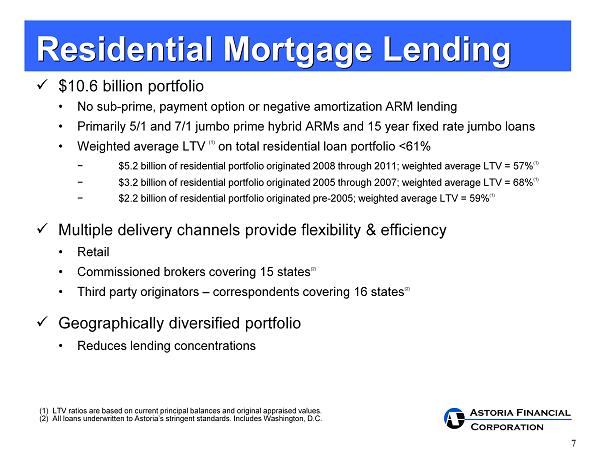
Astoria Financial Corporation 7 x $10.6 billion portfolio • No sub - prime, payment option or negative amortization ARM lending • Primarily 5/1 and 7/1 jumbo prime hybrid ARMs and 15 year fixed rate jumbo loans • Weighted average LTV (1) on total residential loan portfolio <61% − $5.2 billion of residential portfolio originated 2008 through 2011; weighted average LTV = 57% (1) − $3.2 billion of residential portfolio originated 2005 through 2007; weighted average LTV = 68% (1) − $2.2 billion of residential portfolio originated pre - 2005; weighted average LTV = 59% (1) x Multiple delivery channels provide flexibility & efficiency • Retail • Commissioned brokers covering 15 states (2) • T hird party originators – correspondents covering 16 states (2) x Geographically diversified portfolio • Reduces lending concentrations Residential Mortgage Lending (1) LTV ratios are based on current principal balances and original appraised values. (2) All loans underwritten to Astoria’s stringent standards. Includes Washington, D.C.
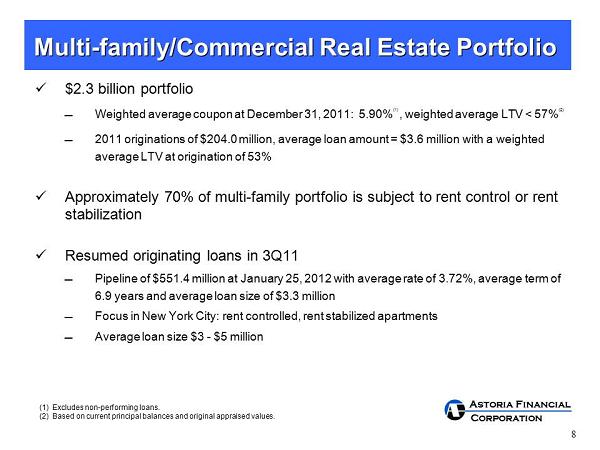
Astoria Financial Corporation 8 x $2.3 billion portfolio Weighted average coupon at December 31, 2011: 5.90% (1) , weighted average LTV < 57% (2) 2011 originations of $204.0 million, average loan amount = $3.6 million with a weighted average LTV at origination of 53% x Approximately 70% of multi - family portfolio is subject to rent control or rent stabilization x Resumed originating loans in 3Q11 Pipeline of $551.4 million at January 25, 2012 with average rate of 3.72%, average term of 6.9 years and average loan size of $3.3 million Focus in New York City: rent controlled, rent stabilized apartments Average loan size $3 - $5 million Multi - family/Commercial Real Estate Portfolio (1) Excludes non - performing loans. (2) Based on current principal balances and original appraised values.
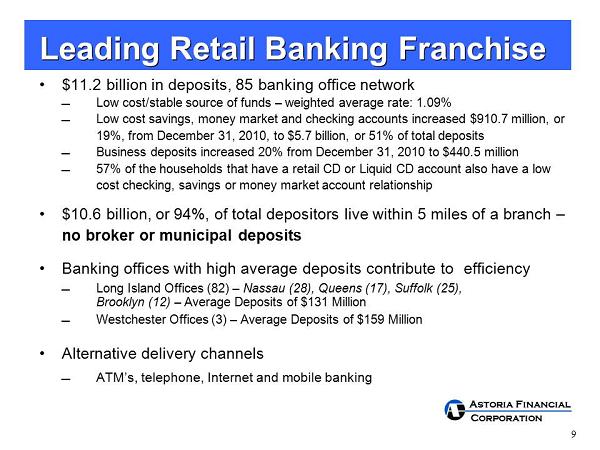
Astoria Financial Corporation 9 • $11.2 billion in deposits, 85 banking office network Low cost/stable source of funds – weighted average rate: 1.09% Low cost savings, money market and checking accounts increased $910.7 million, or 19%, from December 31, 2010, to $5.7 billion, or 51% of total deposits Business deposits increased 20% from December 31, 2010 to $440.5 million 57% of the households that have a retail CD or Liquid CD account also have a low cost checking, savings or money market account relationship • $10.6 billion, or 94%, of total depositors live within 5 miles of a branch – no broker or municipal deposits • Banking offices with high average deposits contribute to efficiency Long Island Offices (82) – Nassau (28), Queens (17), Suffolk (25), Brooklyn (12) – Average Deposits of $131 Million Westchester Offices (3) – Average Deposits of $159 Million • Alternative delivery channels ATM’s, telephone, Internet and mobile banking Leading Retail Banking Franchise

Astoria Financial Corporation 10 • Organic growth vs. de - novo branching • Differentiation from competition – Maintain pricing discipline – Pro - active sales culture – PEAK Process – Focus on customer service – High customer satisfaction – Community involvement – Support over 700 local organizations and not - for - profit agencies Astoria Federal is an integral part of the fabric of the communities it serves Retail Banking Philosophy
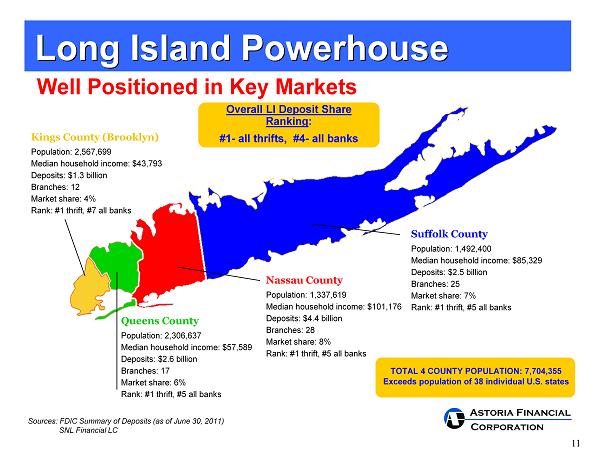
Astoria Financial Corporation 11 TOTAL 4 COUNTY POPULATION: 7,704,355 Exceeds population of 38 individual U.S. states Overall LI Deposit Share Ranking : #1 - all thrifts, #4 - all banks Sources: FDIC Summary of Deposits (as of June 30, 2011) SNL Financial LC Kings County (Brooklyn) Population: 2,567,699 Median household income: $43,793 Deposits: $1.3 billion Branches: 12 Market share: 4% Rank: #1 thrift, #7 all banks Queens County Population: 2,306,637 Median household income: $57,589 Deposits: $2.6 billion Branches: 17 Market share: 6% Rank: #1 thrift, #5 all banks Nassau County Population: 1,337,619 Median household income: $101,176 Deposits: $4.4 billion Branches: 28 Market share: 8% Rank: #1 thrift, #5 all banks Suffolk County Population: 1,492,400 Median household income: $85,329 Deposits: $2.5 billion Branches: 25 Market share: 7% Rank: #1 thrift, #5 all banks Long Island Powerhouse Well Positioned in Key Markets
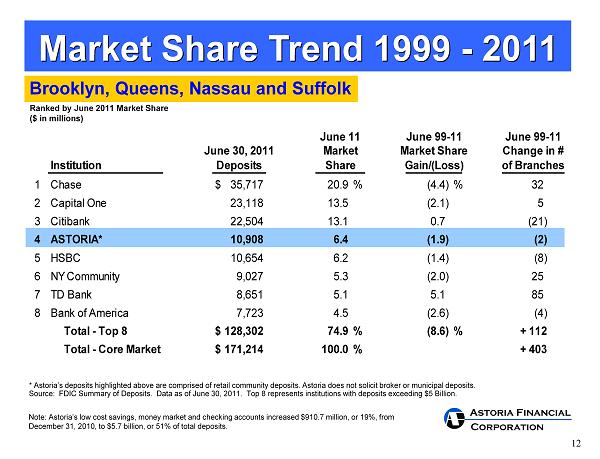
Astoria Financial Corporation 12 Brooklyn, Queens, Nassau and Suffolk Market Share Trend 1999 - 2011 June 11 June 99-11 June 99-11 June 30, 2011 Market Market Share Change in # Institution Deposits Share Gain/(Loss) of Branches 1 Chase $ 35,717 20.9% (4.4)% 32 2 Capital One 23,118 13.5 (2.1) 5 3 Citibank 22,504 13.1 0.7 (21) 4 ASTORIA* 10,908 6.4 (1.9) (2) 5 HSBC 10,654 6.2 (1.4) (8) 6 NY Community 9,027 5.3 (2.0) 25 7 TD Bank 8,651 5.1 5.1 85 8 Bank of America 7,723 4.5 (2.6) (4) Total - Top 8 $128,302 74.9% (8.6)% + 112 Total - Core Market $171,214 100.0% + 403 Ranked by June 2011 Market Share ($ in millions) * Astoria’s deposits highlighted above are comprised of retail community deposits. Astoria does not solicit broker or municip al deposits. Source: FDIC Summary of Deposits. Data as of June 30, 2011. Top 8 represents institutions with deposits exceeding $5 Billion. Note: Astoria’s low cost savings, money market and checking accounts increased $910.7 million, or 19%, from December 31, 2010, to $5.7 billion, or 51% of total deposits.

Astoria Financial Corporation 13 • Operating Efficiency • Credit • Margin • Interest Rate Risk Current Focus • Growth

Astoria Financial Corporation 14 • Assets: − Residential loan originations totaled $3.5 billion for the year − Residential loan pipeline totaled $1.1 billion at December 31, 2011 − Multi - family/CRE lending resumed in the third quarter; multi - family/CRE loan originations totaled $204.0 million for the year − Multi - family/CRE loan pipeline totaled $551.4 million at January 25, 2012 • Liabilities: − Low cost savings, money market and checking account deposits increased $910.7 million, or 19%, from December 31, 2010, to $5.7 billion, or 51% of total deposits. Growth to accelerate as loan portfolio and balance sheet grow. Poised for Growth

Astoria Financial Corporation 15 • Growth • Credit • Margin • Interest Rate Risk Current Focus • Operating Efficiency
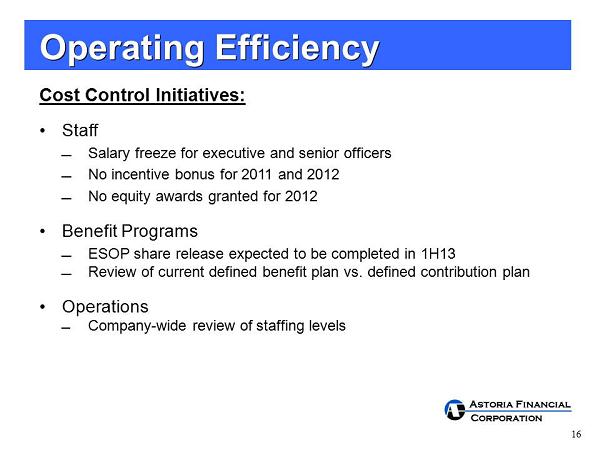
Astoria Financial Corporation 16 Operating Efficiency Cost Control Initiatives: • Staff Salary freeze for executive and senior officers No incentive bonus for 2011 and 2012 No equity awards granted for 2012 • Benefit Programs ESOP share release expected to be completed in 1H13 Review of current defined benefit plan vs. defined contribution plan • Operations Company - wide review of staffing levels
Astoria Financial Corporation 17 • Growth • Operating Efficiency • Credit • Margin • Interest Rate Risk Current Focus • Credit
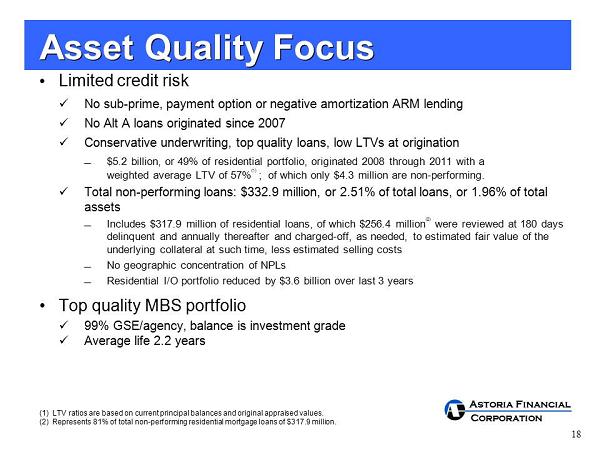
Astoria Financial Corporation 18 • Limited credit risk x No sub - prime, payment option or negative amortization ARM lending x No Alt A loans originated since 2007 x Conservative underwriting, top quality loans, low LTVs at origination $5.2 billion, or 49% of residential portfolio, originated 2008 through 2011 with a weighted average LTV of 57% (1) ; of which only $4.3 million are non - performing. x Total non - performing loans: $332.9 million, or 2.51% of total loans, or 1.96% of total assets Includes $317.9 million of residential loans, of which $256.4 million (2) were reviewed at 180 days delinquent and annually thereafter and charged - off, as needed, to estimated fair value of the underlying collateral at such time, less estimated selling costs No geographic concentration of NPLs Residential I/O portfolio reduced by $3.6 billion over last 3 years • Top quality MBS portfolio x 99% GSE/agency, balance is investment grade x Average life 2.2 years Asset Quality Focus (1) LTV ratios are based on current principal balances and original appraised values. (2) Represents 81% of total non - performing residential mortgage loans of $317.9 million.
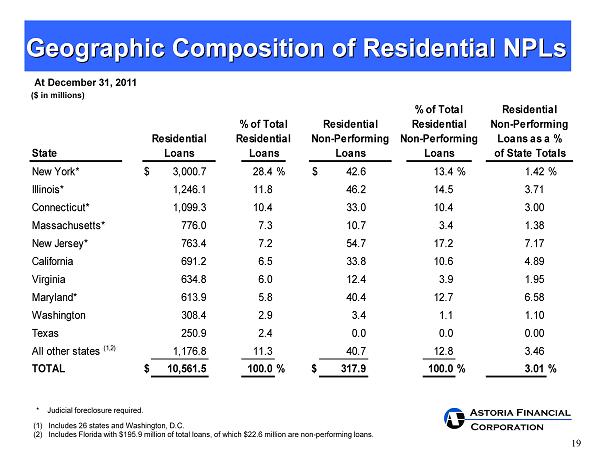
Astoria Financial Corporation 19 Geographic Composition of Residential NPLs % of Total % of Total Residential Residential Non-Performing Residential Non-Performing Non-Performing Loans as a % State Loans Loans Loans of State Totals New York* $ 3,000.7 28.4% $ 42.6 13.4% 1.42% Illinois* 1,246.1 11.8 46.2 14.5 3.71 Connecticut* 1,099.3 10.4 33.0 10.4 3.00 Massachusetts* 776.0 7.3 10.7 3.4 1.38 New Jersey* 763.4 7.2 54.7 17.2 7.17 California 691.2 6.5 33.8 10.6 4.89 Virginia 634.8 6.0 12.4 3.9 1.95 Maryland* 613.9 5.8 40.4 12.7 6.58 Washington 308.4 2.9 3.4 1.1 1.10 Texas 250.9 2.4 0.0 0.0 0.00 All other states (1,2) 1,176.8 11.3 40.7 12.8 3.46 TOTAL $ 10,561.5 100.0% $ 317.9 100.0% 3.01% Residential Loans Residential ($ in millions) At December 31, 2011 (1) Includes 26 states and Washington, D.C. (2) Includes Florida with $195.9 million of total loans, of which $22.6 million are non - performing loans. * Judicial foreclosure required.
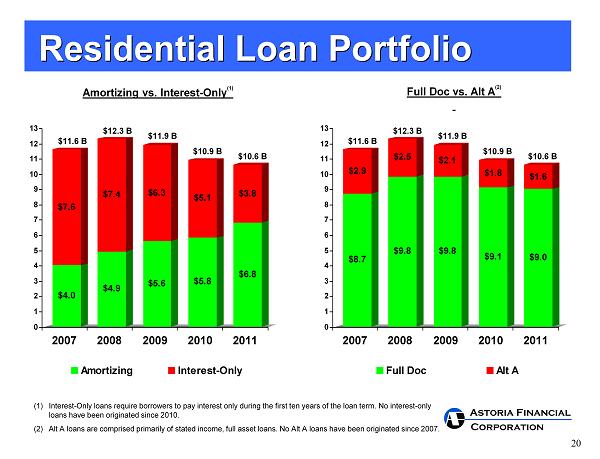
Astoria Financial Corporation 20 $4.0 $7.6 $4.9 $7.4 $5.6 $6.3 $5.8 $5.1 $6.8 $3.8 0 1 2 3 4 5 6 7 8 9 10 11 12 13 2007 2008 2009 2010 2011 Amortizing Interest-Only $8.7 $2.9 $9.8 $2.5 $9.8 $2.1 $9.1 $1.8 $9.0 $1.6 0 1 2 3 4 5 6 7 8 9 10 11 12 13 2007 2008 2009 2010 2011 Full Doc Alt A Amortizing vs. Interest - Only (1) Full Doc vs. Alt A (2) Residential Loan Portfolio $11.6 B $12.3 B $11.9 B $10.9 B $10.6 B $11.6 B $12.3 B $11.9 B $10.9 B $10.6 B (1) Interest - Only loans require borrowers to pay interest only during the first ten years of the loan term. No interest - only loans have been originated since 2010. (2) Alt A loans are comprised primarily of stated income, full asset loans. No Alt A loans have been originated since 2007.
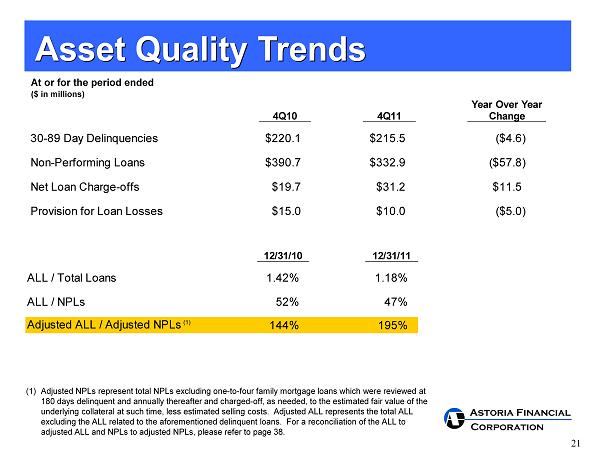
Astoria Financial Corporation 21 Asset Quality Trends 30-89 Day Delinquencies $220.1 $215.5 ($4.6) Non-Performing Loans $390.7 $332.9 ($57.8) Net Loan Charge-offs $19.7 $31.2 $11.5 Provision for Loan Losses $15.0 $10.0 ($5.0) Year Over Year Change4Q10 4Q11 ($ in millions) ALL / Total Loans 1.42% 1.18% ALL / NPLs 52% 47% Adjusted ALL / Adjusted NPLs (1) 144% 195% 12/31/10 12/31/11 (1) Adjusted NPLs represent total NPLs excluding one - to - four family mortgage loans which were reviewed at 180 days delinquent and annually thereafter and charged - off, as needed, to the estimated fair value of the underlying collateral at such time, less estimated selling costs. Adjusted ALL represents the total ALL excluding the ALL related to the aforementioned delinquent loans. For a reconciliation of the ALL to adjusted ALL and NPLs to adjusted NPLs, please refer to page 38. At or for the period ended
Astoria Financial Corporation 22 • Growth • Operating Efficiency • Credit • Interest Rate Risk Current Focus • Margin
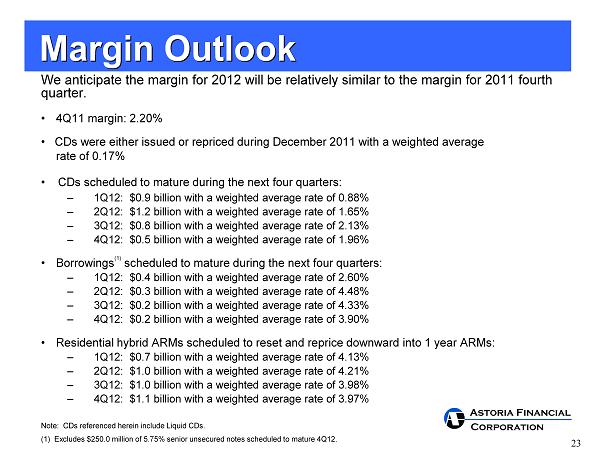
Astoria Financial Corporation 23 We anticipate the margin for 2012 will be relatively similar to the margin for 2011 fourth quarter. • 4Q11 margin: 2.20% • CDs were either issued or repriced during December 2011 with a weighted average rate of 0.17% • CDs scheduled to mature during the next four quarters: – 1Q12: $0.9 billion with a weighted average rate of 0.88% – 2Q12: $1.2 billion with a weighted average rate of 1.65% – 3Q12: $0.8 billion with a weighted average rate of 2.13% – 4Q12: $0.5 billion with a weighted average rate of 1.96% • Borrowings (1) scheduled to mature during the next four quarters: – 1Q12: $0.4 billion with a weighted average rate of 2.60% – 2 Q 12 : $ 0 . 3 billion with a weighted average rate of 4 . 48 % – 3 Q 12 : $ 0 . 2 billion with a weighted average rate of 4 . 33 % – 4 Q 12 : $ 0 . 2 billion with a weighted average rate of 3 . 90 % • Residential hybrid ARMs scheduled to reset and reprice downward into 1 year ARMs: – 1Q12: $0.7 billion with a weighted average rate of 4.13% – 2Q12: $1.0 billion with a weighted average rate of 4.21% – 3Q12: $1.0 billion with a weighted average rate of 3.98% – 4Q12: $1.1 billion with a weighted average rate of 3.97% Margin Outlook Note: CDs referenced herein include Liquid CDs. (1) Excludes $250.0 million of 5.75% senior unsecured notes scheduled to mature 4Q12.
Astoria Financial Corporation 24 • Growth • Operating Efficiency • Credit • Margin Current Focus • Interest Rate Risk
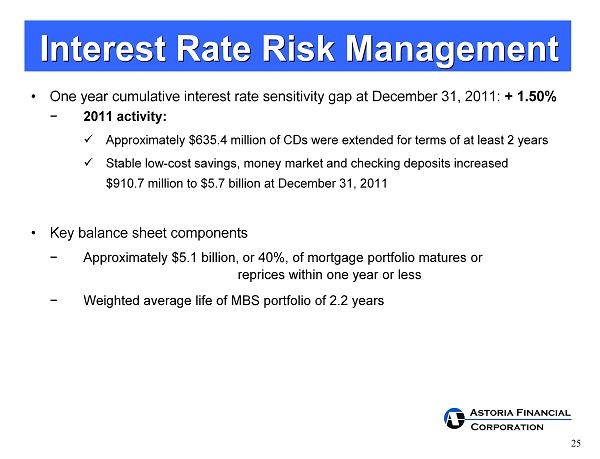
Astoria Financial Corporation 25 • One year cumulative interest rate sensitivity gap at December 31, 2011: + 1.50% − 2011 activity: x Approximately $635.4 million of CDs were extended for terms of at least 2 years x Stable low - cost savings, money market and checking deposits increased $910.7 million to $5.7 billion at December 31, 2011 • Key balance sheet components − Approximately $5.1 billion, or 40%, of mortgage portfolio matures or reprices within one year or less − Weighted average life of MBS portfolio of 2.2 years Interest Rate Risk Management
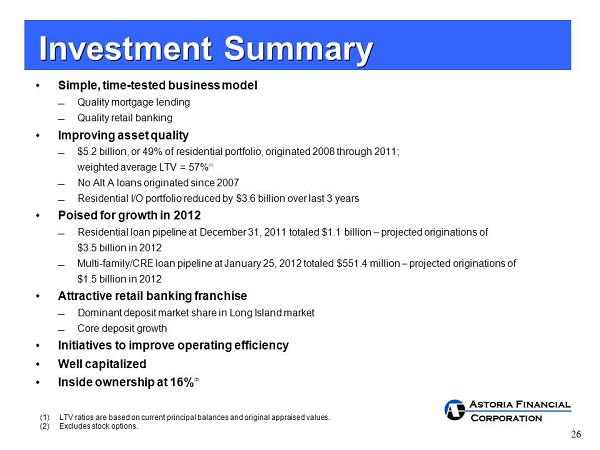
Astoria Financial Corporation 26 • Simple, time - tested business model Quality mortgage lending Quality retail banking • Improving asset quality $5.2 billion, or 49% of residential portfolio, originated 2008 through 2011; weighted average LTV = 57% (1) No Alt A loans originated since 2007 Residential I/O portfolio reduced by $3.6 billion over last 3 years • Poised for growth in 2012 Residential loan pipeline at December 31, 2011 totaled $1.1 billion – projected originations of $3.5 billion in 2012 Multi - family/CRE loan pipeline at January 25, 2012 totaled $551.4 million – projected originations of $1.5 billion in 2012 • Attractive retail banking franchise Dominant deposit market share in Long Island market Core deposit growth • Initiatives to improve operating efficiency • Well capitalized • Inside ownership at 16% (2) Investment Summary (1) LTV ratios are based on current principal balances and original appraised values. (2) Excludes stock options.

Astoria Financial Corporation 27 Addendum
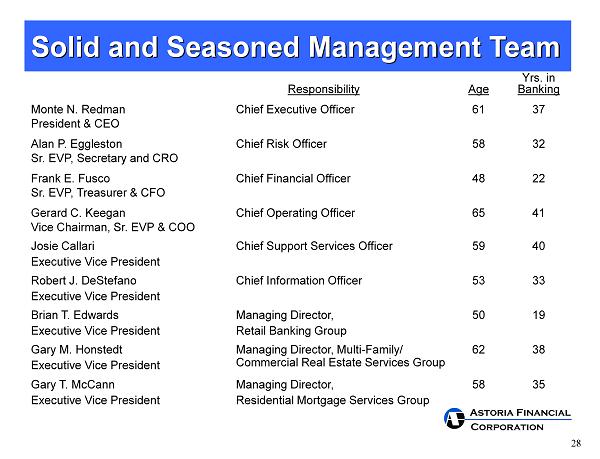
Astoria Financial Corporation 28 Responsibility Age Yrs. in Banking Monte N. Redman President & CEO Chief Executive Officer 61 37 Alan P. Eggleston Sr. EVP, Secretary and CRO Chief Risk Officer 58 32 Frank E. Fusco Sr. EVP, Treasurer & CFO Chief Financial Officer 48 22 Gerard C. Keegan Vice Chairman, Sr. EVP & COO Chief Operating Officer 65 41 Josie Callari Executive Vice President Chief Support Services Officer 59 40 Robert J. DeStefano Executive Vice President Chief Information Officer 53 33 Brian T. Edwards Executive Vice President Managing Director, Retail Banking Group 50 19 Gary M. Honstedt Executive Vice President Managing Director, Multi - Family/ Commercial Real Estate Services Group 62 38 Gary T. McCann Executive Vice President Managing Director, Residential Mortgage Services Group 58 35 Solid and Seasoned Management Team
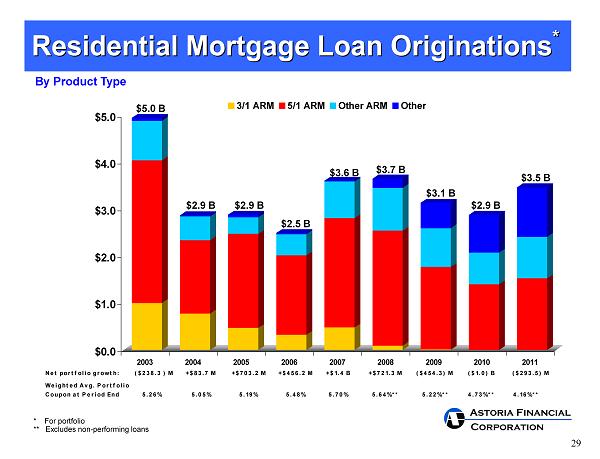
Astoria Financial Corporation 29 By Product Type $0.0 $1.0 $2.0 $3.0 $4.0 $5.0 2003 2004 2005 2006 2007 2008 2009 2010 2011 3/1 ARM 5/1 ARM Other ARM Other $2.9 B $2.9 B $2.5 B $3.6 B Residential Mortgage Loan Originations * Net portfolio growth: ($238.3 ) M +$83.7 M +$703.2 M +$456.2 M +$1.4 B +$721.3 M ($454.3) M ($1.0) B ($293.5) M Weighted Avg. Portfolio Coupon at Period End 5.26% 5.05% 5.19% 5.48% 5.70% 5.64%** 5.22%** 4.73%** 4.16%** $3.7 B $3.1 B $5.0 B * For portfolio ** Excludes non - performing loans $2.9 B $3.5 B
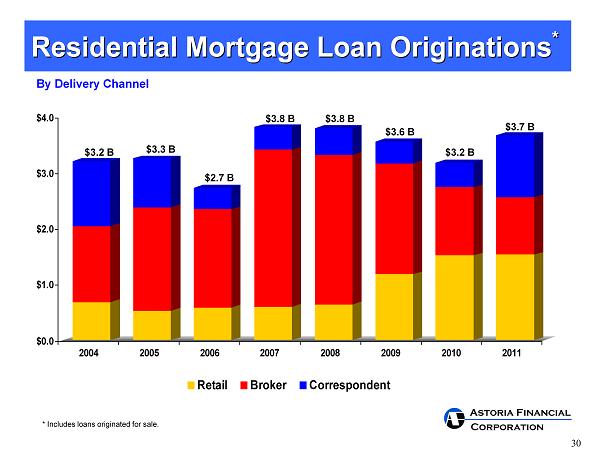
Astoria Financial Corporation 30 $0.0 $1.0 $2.0 $3.0 $4.0 2004 2005 2006 2007 2008 2009 2010 2011 Retail Broker Correspondent By Delivery Channel $3.2 B $3.3 B $2.7 B Residential Mortgage Loan Originations * $3.8 B $3.8 B $3.6 B * Includes loans originated for sale. $3.2 B $3.7 B
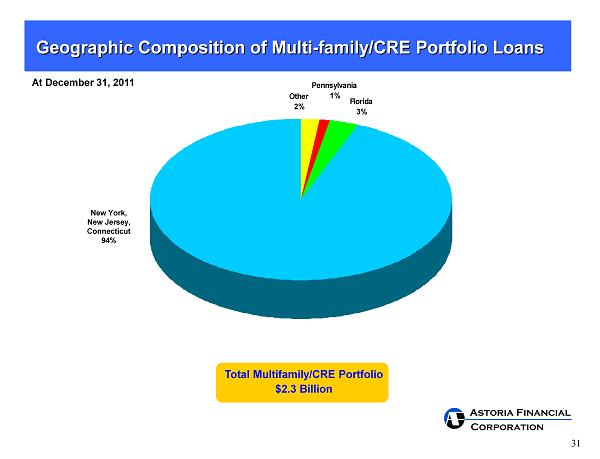
Astoria Financial Corporation 31 Other 2% Florida 3% Pennsylvania 1% Total Multifamily/CRE Portfolio $2.3 Billion At December 31, 2011 New York, New Jersey, Connecticut 94% Geographic Composition of Multi - family/CRE Portfolio Loans
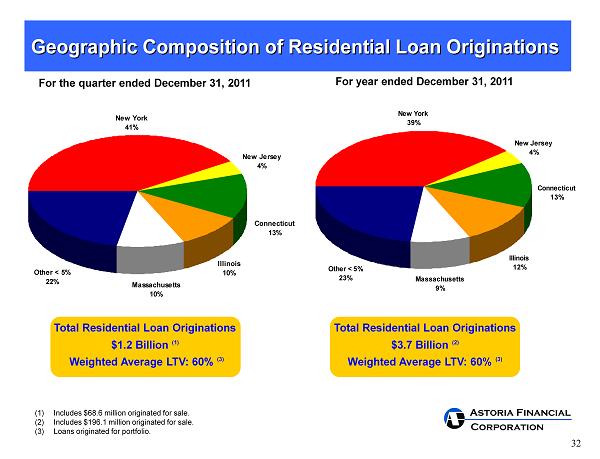
Astoria Financial Corporation 32 Total Residential Loan Originations $1.2 Billion (1) Weighted Average LTV: 60% (3) Total Residential Loan Originations $3.7 Billion (2) Weighted Average LTV: 60% (3) Geographic Composition of Residential Loan Originations Massachusetts 9% Other < 5% 23% New York 39% Illinois 12% Connecticut 13% New Jersey 4% For year ended December 31, 2011 Massachusetts 10% Other < 5% 22% New York 41% Illinois 10% Connecticut 13% New Jersey 4% For the quarter ended December 31, 2011 (1) Includes $68.6 million originated for sale. (2) Includes $196.1 million originated for sale. (3) Loans originated for portfolio.
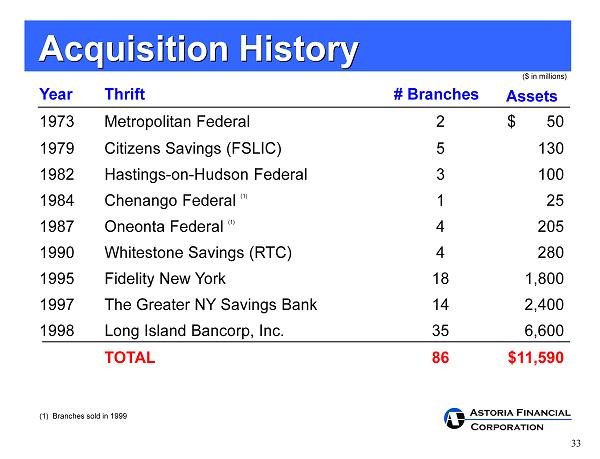
Astoria Financial Corporation 33 (1) Branches sold in 1999 Year Thrift # Branches Assets 1973 Metropolitan Federal 2 $ 50 1979 Citizens Savings (FSLIC) 5 130 1982 Hastings - on - Hudson Federal 3 100 1984 Chenango Federal (1) 1 25 1987 Oneonta Federal (1) 4 205 1990 Whitestone Savings (RTC) 4 280 1995 Fidelity New York 18 1,800 1997 The Greater NY Savings Bank 14 2,400 1998 Long Island Bancorp, Inc. 35 6,600 TOTAL 86 $11,590 ($ in millions) Acquisition History
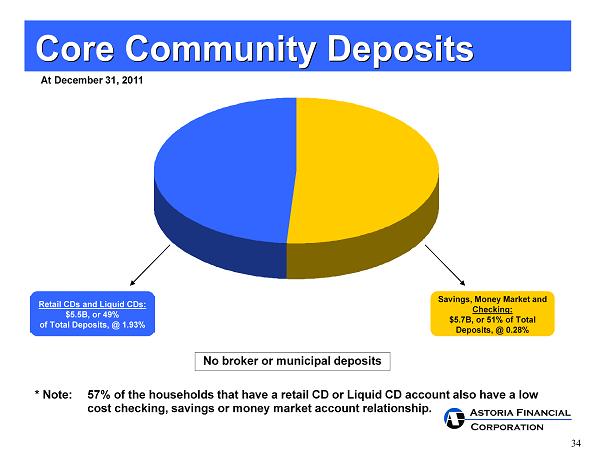
Astoria Financial Corporation 34 Savings, Money Market and Checking: $5.7B, or 51% of Total Deposits, @ 0.28% * Note: 57% of the households that have a retail CD or Liquid CD account also have a low cost checking, savings or money market account relationship. At December 31, 2011 Core Community Deposits Retail CDs and Liquid CDs: $5.5B, or 49% of Total Deposits, @ 1.93% No broker or municipal deposits

Astoria Financial Corporation 35 P erformance based on E nthusiasm, A ctions and K nowledge “Sales Oriented and Service Obsessed” x A “needs” based approach to sales rather than “product” based approach x Highly interactive program – daily and weekly meetings create a focus that is shared throughout the branch network x Incentives for strong performance, both individual and team Sales – PEAK Process

Astoria Financial Corporation 36 • 77% of Astoria customers are highly satisfied • 75% of Astoria customers are highly likely to recommend Astoria to friend/family member • Astoria customers are 30% more likely to net increase their deposit relationship than are competitor customers • Satisfaction with the branch is by far the strongest driver of overall satisfaction – 85% of Astoria customers are highly satisfied with quality of branch service Customer Satisfaction Key Findings : Favorably Positioned Against Competitors Survey results are based on a 2010 independent Customer Satisfaction Survey.

Astoria Financial Corporation 37 • Education First Supports lifelong learning, promotes saving and provides meaningful financial solutions to improve the way our customers live and the neighborhoods we serve • Neighborhood Outreach Through funding and volunteer efforts, supports over 700 community - based organizations and not - for - profit agencies that enrich the communities within our market area Reinforces community involvement by promoting neighborhood news and events in our local community branches • Results/Recognition Seven consecutive “Outstanding” Community Reinvestment Act ratings by OTS (OTS merged into OCC July 2011) Community Involvement Key Initiatives Astoria Federal is an integral part of the fabric of the communities it serves
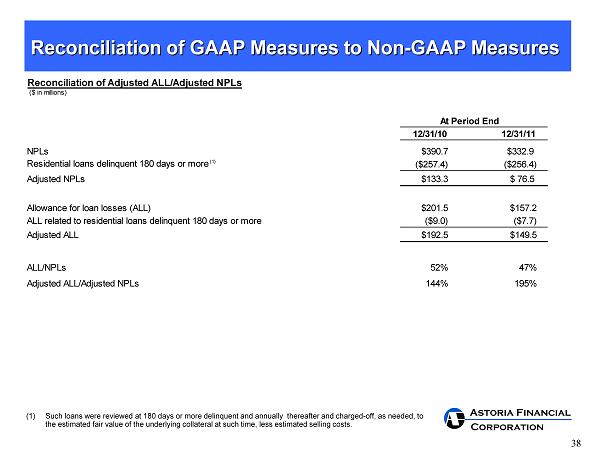
Astoria Financial Corporation 38 Reconciliation of GAAP Measures to Non - GAAP Measures ($ in millions) NPLs $390.7 $332.9 Residential loans delinquent 180 days or more (1) ($257.4) ($256.4) Adjusted NPLs $133.3 $ 76.5 Allowance for loan losses (ALL) $201.5 $157.2 ALL related to residential loans delinquent 180 days or more ($9.0) ($7.7) Adjusted ALL $192.5 $149.5 ALL/NPLs 52% 47% Adjusted ALL/Adjusted NPLs 144% 195% Reconciliation of Adjusted ALL/Adjusted NPLs At Period End 12/31/10 12/31/11 (1) Such loans were reviewed at 180 days or more delinquent and annually thereafter and charged - off, as needed, to the estimated fair value of the underlying collateral at such time, less estimated selling costs.

Astoria Financial Corporation 39 ALL − Allowance for Loan Losses ARM − Adjustable Rate Mortgage bp − Basis Point CRE − Commercial Real Estate ESOP − Employee Stock Ownership Plan GAAP − Generally Accepted Accounting Principles GSE − Government Sponsored Enterprise I/O − Interest - Only LTV − Loan - To - Value Ratio MBS − Mortgage - Backed Securities NPL − Non - Performing Loan OCC − Office of the Comptroller of the Currency OTS − Office of Thrift Supervision REO − Real Estate Owned Glossary
Astoria Financial Corporation 40 Contact Information Web site: www.astoriafederal.com Email: ir@astoriafederal.com Telephone: (516) 327 - 7869 Address: Astoria Financial Corporation Attn: Investor Relations One Astoria Federal Plaza Lake Success, NY 11042