Attached files
| file | filename |
|---|---|
| 8-K - FORM 8-K - Bristow Group Inc | d292899d8k.htm |
 Third Quarter FY 2012
Earnings Presentation
Bristow Group Inc.
February 3, 2012
Exhibit 99.1 |
 2
Third quarter earnings call agenda
Introduction
CEO remarks and operational highlights
Current and future financial performance
-
FY12 Q3 Financial discussion
-
Update on capital return
Closing remarks
Questions and answers
Linda McNeill, Director Investor Relations
Bill Chiles, President and CEO
Jonathan Baliff, SVP and CFO
Bill Chiles, President and CEO |
 3
Forward-looking statements
This
presentation
may
contain
“forward-looking
statements”
within
the
meaning
of
the
Private
Securities
Litigation Reform Act of 1995. Forward-looking statements include statements
about our future business, operations, capital expenditures, fleet
composition, capabilities and results; modeling information, earnings
guidance, expected operating margins and other financial projections; future
dividends, share repurchase and other uses of excess cash; plans, strategies and
objectives of our management, including our plans and strategies to grow
earnings and our business, our general strategy going forward and our
business model; expected actions by us and by third parties, including our
customers, competitors and regulators; the valuation of our company and its valuation relative to
relevant financial indices; assumptions underlying or relating to any of the
foregoing, including assumptions regarding factors impacting our business,
financial results and industry; and other matters. Our
forward-looking
statements
reflect
our
views
and
assumptions
on
the
date
of
this
presentation
regarding future events and operating performance. They involve known and unknown
risks, uncertainties
and
other
factors,
many
of
which
may
be
beyond
our
control,
that
may
cause
actual
results to differ materially from any future results, performance or achievements
expressed or implied by the
forward-looking
statements.
These
risks,
uncertainties
and
other
factors
include
those
discussed
under the captions “Risk Factors”
and “Management’s Discussion and Analysis of Financial Condition
and
Results
of
Operations”
in
our
Annual
Report
on
Form
10-K
for
the
fiscal
year
ended
March
31,
2011
and our Quarterly Report on Form 10-Q for the quarter ended December 31,
2011. We do not undertake any obligation, other than as required by
law, to update or revise any forward-looking statements, whether as a
result of new information, future events or otherwise. |
 Chief Executive comments
Bill
Chiles,
President
and
CEO
4 |
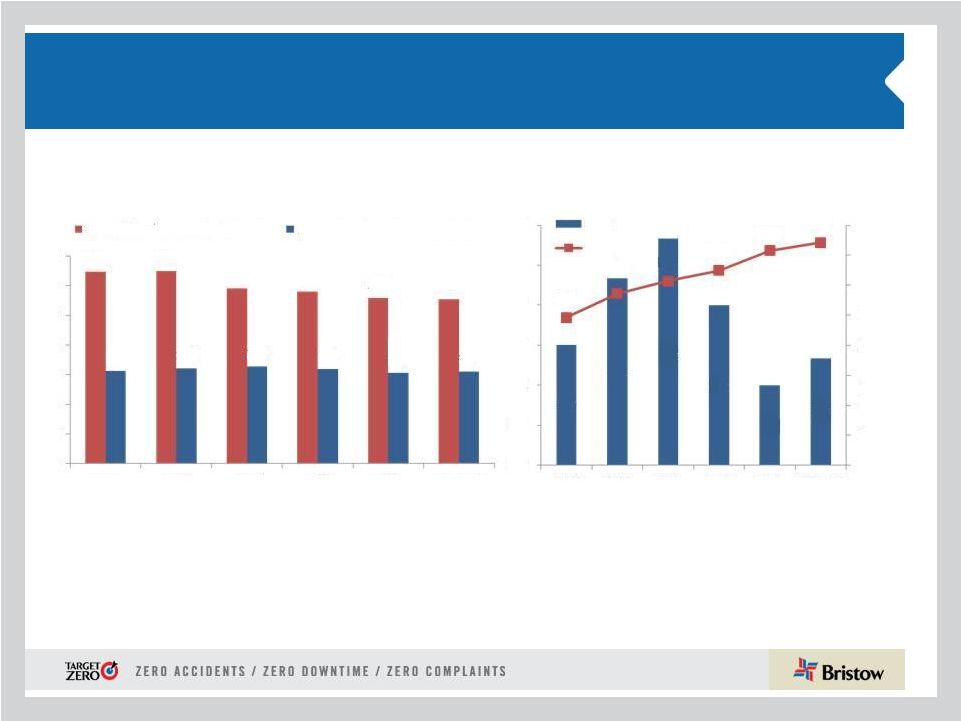
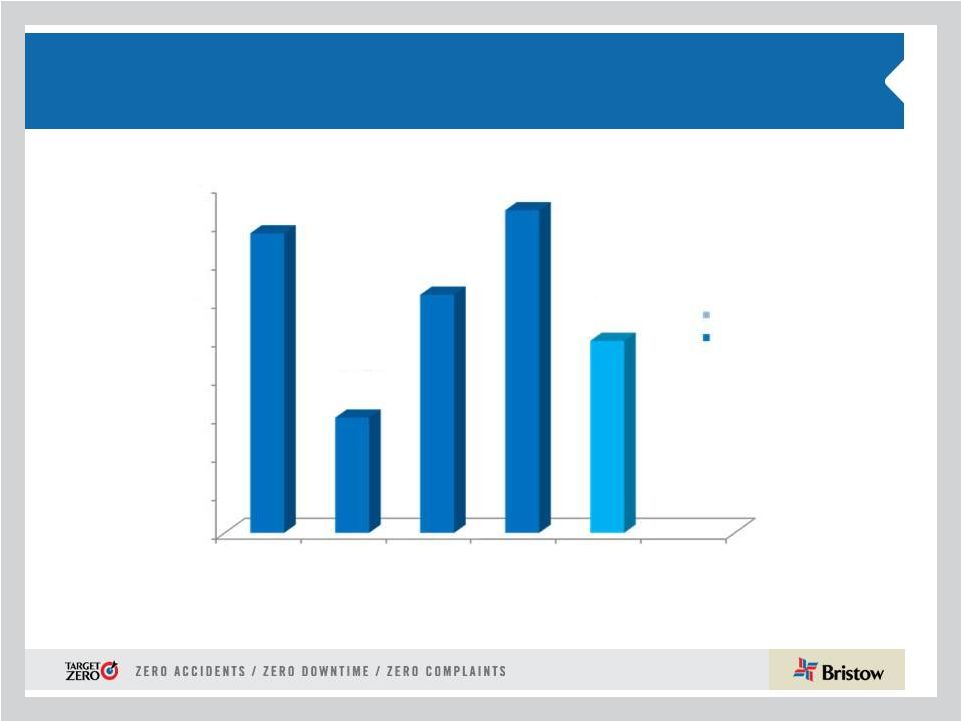
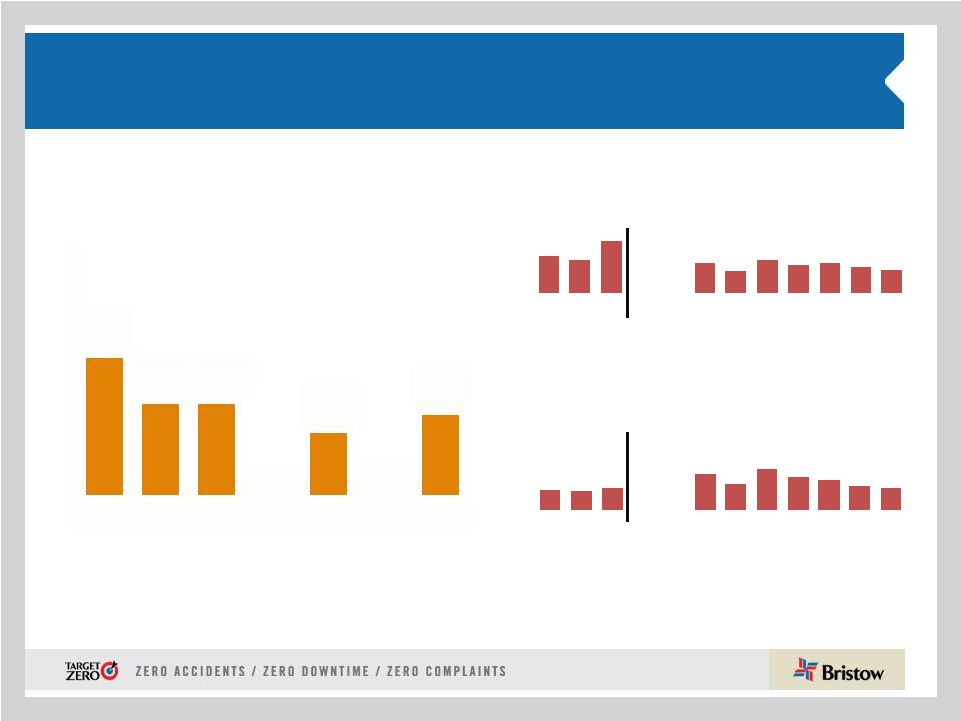 Operational safety review
* Includes consolidated commercial operations only
Total Reportable Injury Rate per 200,000 man-
hours (cumulative)
Lost Work Case Rate per 200,000
man-hours (cumulative)
Air Accident Rate* per 100,000
Flight Hours (Fiscal Year)
FY11
YTD FY12
FY11
YTD FY12
0.14
0.13
0.15
0.00
0.00
0.25
0.18
0.28
0.23
0.20
0.17
0.15
0.00
0.10
0.20
0.30
J
F
M
A
M
J
J
A
S
O
N
D
0.31
0.28
0.43
0.00
0.00
0.25
0.18
0.28
0.23
0.25
0.22
0.19
0.00
0.50
J
F
M
A
M
J
J
A
S
O
N
D
5
1.17
0.78
0.78
0.00
0.54
0.00
0.62
0.00
1.00
2.00
2006
2007
2008
2009
2010
2011
YTD 2012 |
 Q3
FY12 highlights •
Second half is better than the first half, even with current quarterly performance
reduced due to earnings from unconsolidated affiliates and a loss on disposal
of assets •
$25 million accelerated share repurchase initiated in December
•
Q3 operating revenue of $296.7M (5% increase from Q3 FY11, no change from Q2
FY12) •
Q3 GAAP EPS of $0.70 (38% decrease from Q3 FY11, up from
$0.07 in Q2 FY12) •
Q3 adjusted EPS * of $0.76 (7% increase from Q3 FY11, 20.6% increase from Q2
FY12) •
Q3 operating income of $43.6M (6.6% decrease from Q3 FY11, up
from $9.6M in Q2 FY12) •
Q3 adjusted operating income * of $46.4M (7.5% increase from Q3 FY11, 20.6%
increase from Q2 FY12) •
Q3 adjusted EBITDA * of $68.9M (7% increase from Q3 FY11, 11% increase from Q2
FY12) •
Q3 operating cash flow of $76.9M (66.5% increase from Q3 FY11, 20% increase from Q2
FY12) * Adjusted EPS, adjusted operating income and adjusted EBITDA
amounts exclude gains and losses on dispositions of assets and any special
items
during
the
period.
See
reconciliation
of
these
items
to
GAAP
measures
in
appendix
and
our
earnings
release
for
the
quarter
ended
December 31, 2011
6
•
Record cash flow of over $190 million from operations through Q3 FY12, almost doubled from
the same period last year, allows Bristow to deliver a balanced return to our shareholders
•
Reducing Bristow’s earnings per share guidance for the full FY12 to $2.90 - $3.10 |
 Current market environment
Source: Barclays Capital Research December 2011
7
•
Global spending on E&P is expected to increase 10% to $600 billion in 2012 versus $544
billion in 2011; forecast to top $800 billion by 2015
•
The top 20 E&P spenders globally account for nearly 57% of total spending. Of these
companies, five of them are our top revenue contributors
•
Continued cost pressure across the oil service sector
•
Increasing international helicopter demand and a faster recovery in the Gulf of Mexico
will cause tightness in the helicopter supply market
•
34% of five-year projected opportunities are in Latin America, with large helicopter
demand expected to almost double next year and then again by 2020 in this region
•
Bristow’s order and option book is aligned to meet this potential market growth; however
we also will need market signals that confirm this potential revenue growth before
investing significantly in new aircraft |
 •
Europe represents 37% of total Bristow
operating revenue and operating income in Q3
FY12
•
Operating revenue increased to $106.8M from
$100.1M in Q3 FY11 reflecting higher activity
levels
•
Operating margin declined to 19.5% from
25.4% in prior year quarter largely as a result
of labor and pension costs in Norway and
increased operational costs in the Southern
North Sea
Outlook:
•
Strong activity levels continue with early
contract start-ups
•
New technology large aircraft availability is
limited
•
Significant bid activity continues with major
tenders in Norway and UK for 15-20 large
aircraft and 6-10 medium aircraft with
awards within next 1-2 quarters
FY12 operating margin expected to
be ~ low twenties
Europe (EBU)
8 |
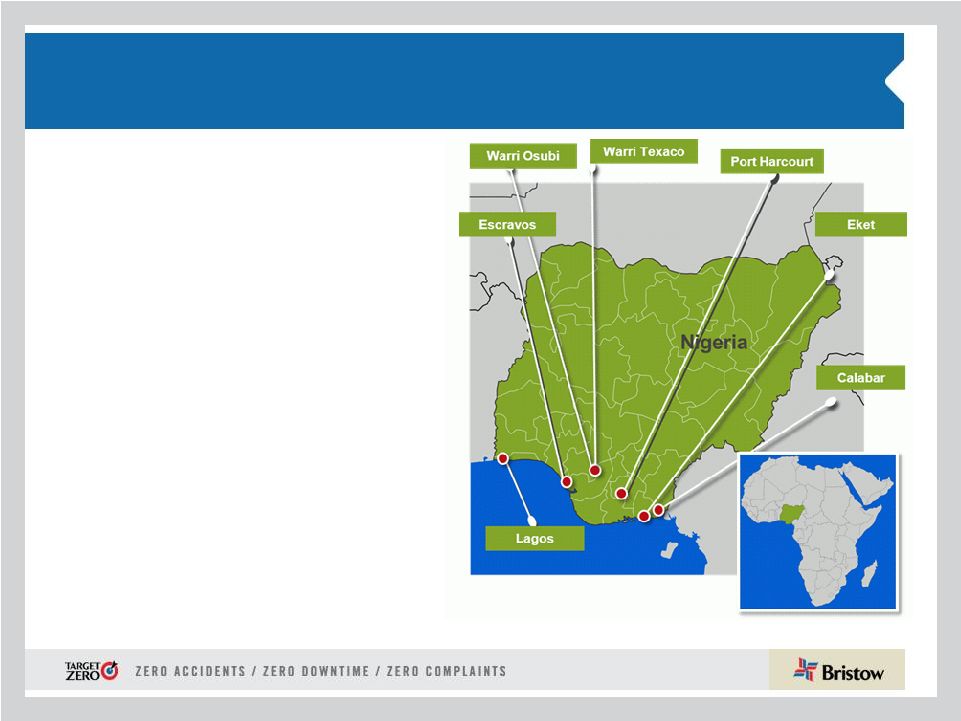 West
Africa (WASBU) •
Nigeria represents 23% of total Bristow operating
revenue and 32% of operating income in Q3 FY12
•
Operating revenue of $66.9M increased from $52.6M
in Q3 FY11 while operating income increased to
$18.1M from $16M in the prior year quarter
•
Operating margin of 27.1% vs 30.4% in prior year
quarter due to increase in maintenance, depreciation
and training expenses
•
Increased activity reflected in over 10% increase in
flying hours over prior year quarter
Outlook:
•
Incremental short-term or ad hoc work at attractive
rates
•
Sharing of large aircraft as activity continues to grow
•
Increased competition in the future
FY12 operating margin expected to be ~
low to mid twenties
9 |
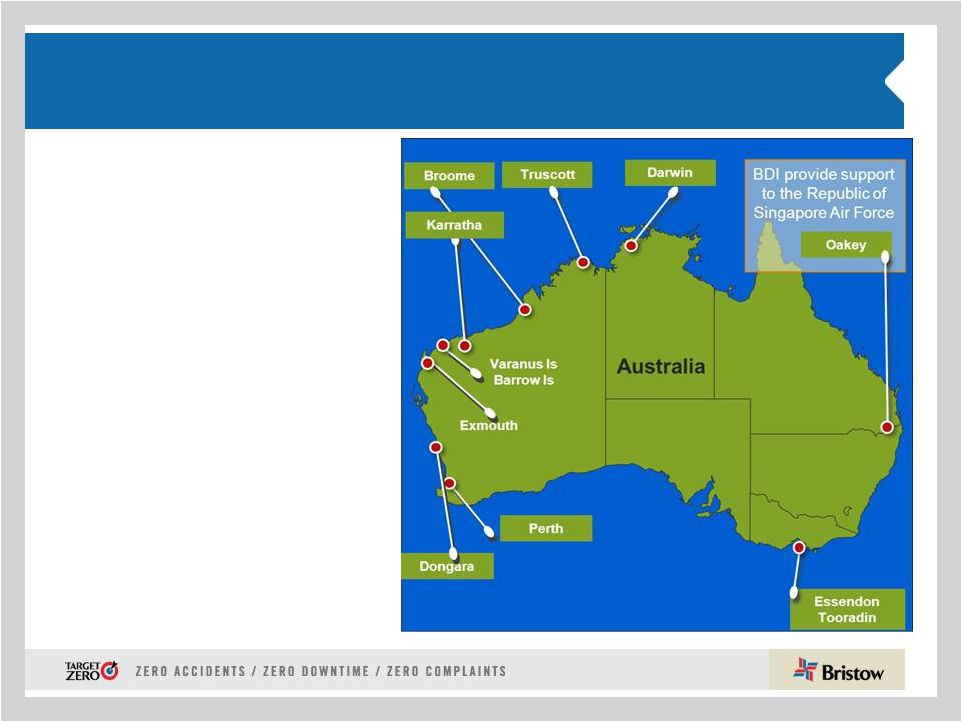 Australia (AUSBU)
•
Australia represented 12% of total Bristow
operating revenue and 6% of operating
income in Q3 FY12
•
Operating revenue of $33.5M declined from
$37.9M in Q3 prior year due to the previously
announced lost work
•
Operating income decreased from $7.1M in
Q3 FY11 to $3.1M in Q3 FY12
•
Sequentially an increase in operating margin
from 1.9% in Q2 FY12 to 9.4%, reflecting the
start up of short term contracts, but still lower
than Q3 FY11 of 18.8%
Outlook:
•
Incremental short-term work which started in
November and December will continue until
Q1 FY13
•
Q4 FY12 expecting margins to improve
•
Major bids in negotiation involving six large
and four medium aircraft
FY12 operating margin expected
to be ~ low teens
10 |
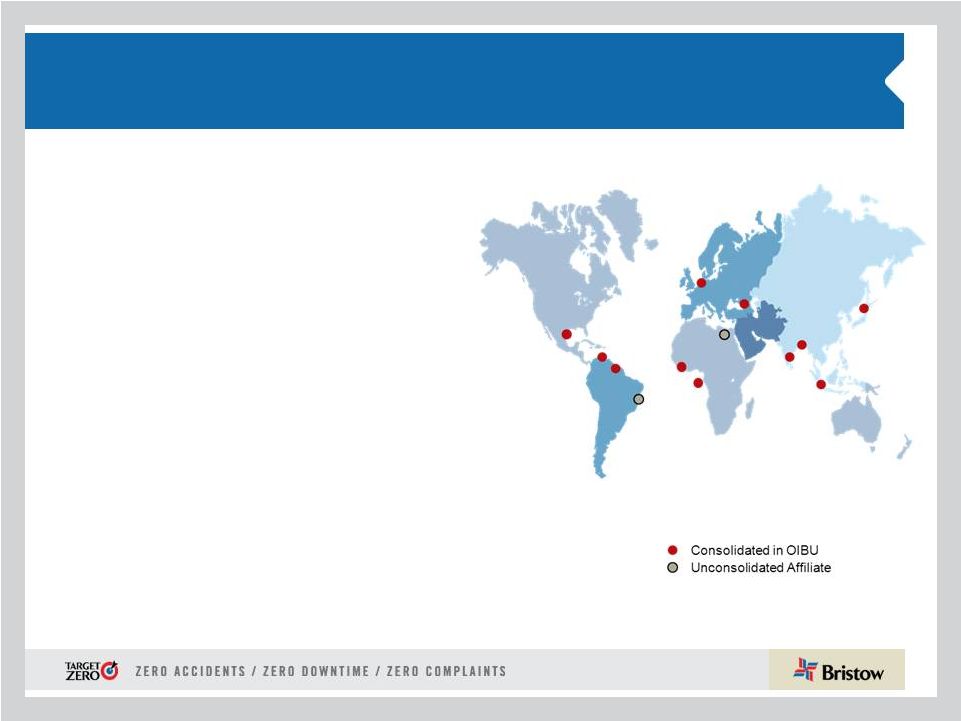 Other International (OIBU)
•
OIBU represented 13% of total Bristow operating revenue
and 22% of operating income for Q3 FY12
•
Operating revenue decreased to $37.2M versus $41.2M in
Q3 FY11 due to the cessation of providing maintenance
and support for aircraft in Mexico and Brazil and the
ceased operation in Libya which were partially offset by
new contracts
•
Increased operating margin of 33.5% over the prior year
quarter of 28.2%
•
Although operationally on plan, Lider equity earnings had
a negative impact of $0.4M for Q3 FY12 versus a positive
impact of $2.1M in the prior period quarter, due to foreign
exchange impact associated with US GAAP accounting
Outlook:
•
Incremental work in Bangladesh, Equatorial Guinea,
Suriname and Trinidad has begun
•
Two large aircraft were moved from Malaysia back to
Australia
FY12 operating margin expected to be ~ mid
to high twenties
11 |
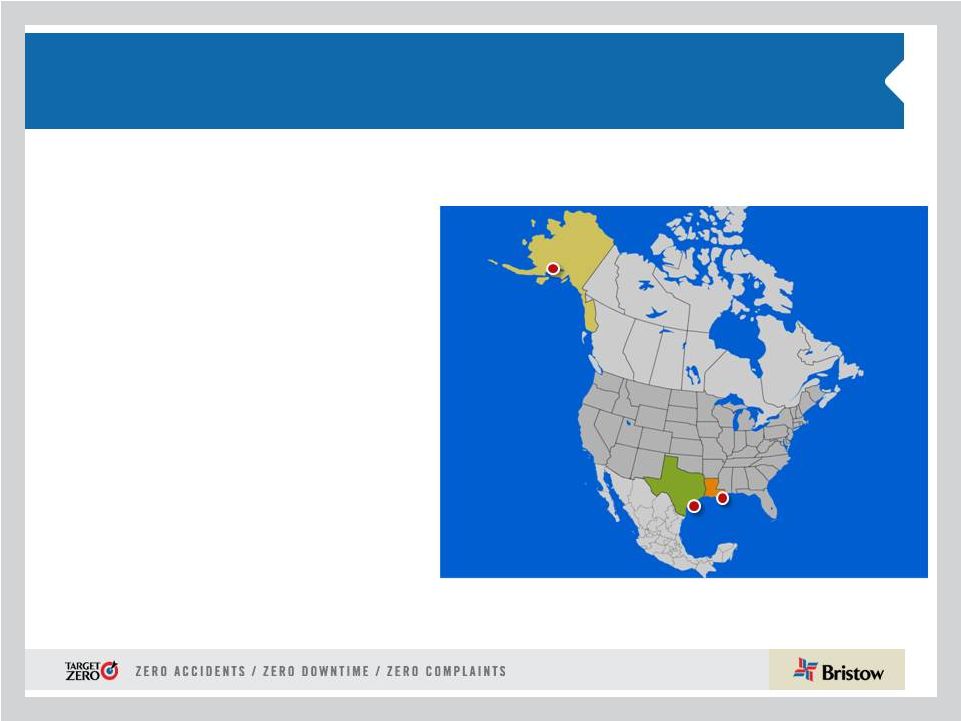 •
Operating revenue of $42.4M represents 15%
of total Bristow operating revenue
•
Operating income relatively flat $1.8M vs.
$1.9M in the prior year quarter
•
Operating margin of 4.3% relatively flat
compared to 4.2% prior year quarter
•
Ability to maintain operating income and margin
levels from prior year quarter is a result of
additional large aircraft contracted as well as
cost management
Outlook:
•
Activity in the Gulf of Mexico picking up;
however moving into FY13 dependent on
deepwater
rig availability for actual start ups
•
Two S-92s fully operational with increasing
flight hour utilization
•
Several inquiries for additional large aircraft to
support seismic and deep water exploration
FY12 operating margin expected to be
~ single digit range
North America (NABU)
12 |
 Financial discussion
Jonathan
Baliff,
SVP
and
CFO
13 |
 Financial highlights:
Adjusted EPS & EBITDA Summary
Q3 FY11 to Q3 FY12 adjusted EPS bridge
* Adjusted EPS, adjusted operating income and adjusted EBITDA amounts exclude
gains and losses on dispositions of assets and any special items during the period. See
reconciliation of these items to GAAP measures in appendix and our earnings release
for the quarter ended December 31, 2011. 14
Q3 FY11 to Q3 FY12 adjusted EBITDA bridge (in millions)
$0.09
Q3FY2011
Operations
Corporate and Other
FX Changes
Q3FY2012
Q3FY2011
Operations
Corporate and Other
FX Changes
Q3FY2012
$0.01
$0.03
$1.5
$5.2
$0.8
$0.71
$0.76
$68.9
$64.4 |
 LACE and LACE rate
LACE
and
LACE
Rate
excludes
Bristow
Academy,
affiliate
aircraft,
aircraft held for sale, aircraft
construction
in
progress,
and
reimbursable
revenue;
see
appendix
for LACE calculation
15
350
300
250
200
150
100
50
0
323
324
295
290
279
277
155
153
159
164
161
156
147
150
153
156
159
162
165
4.92
5.72
6.49
7.15
7.42
FY11
FY10
YTDF12
FY09
FY08
FY07
FY11
FY10
YTDF12
FY09
FY08
FY07
6.14
156
161
164
159
153
155
Consolidated commerical aircraft
Large Aircraft Equivalent (LACE)
LACE
LACE Rate
8
0
1
2
3
4
5
6
7 |
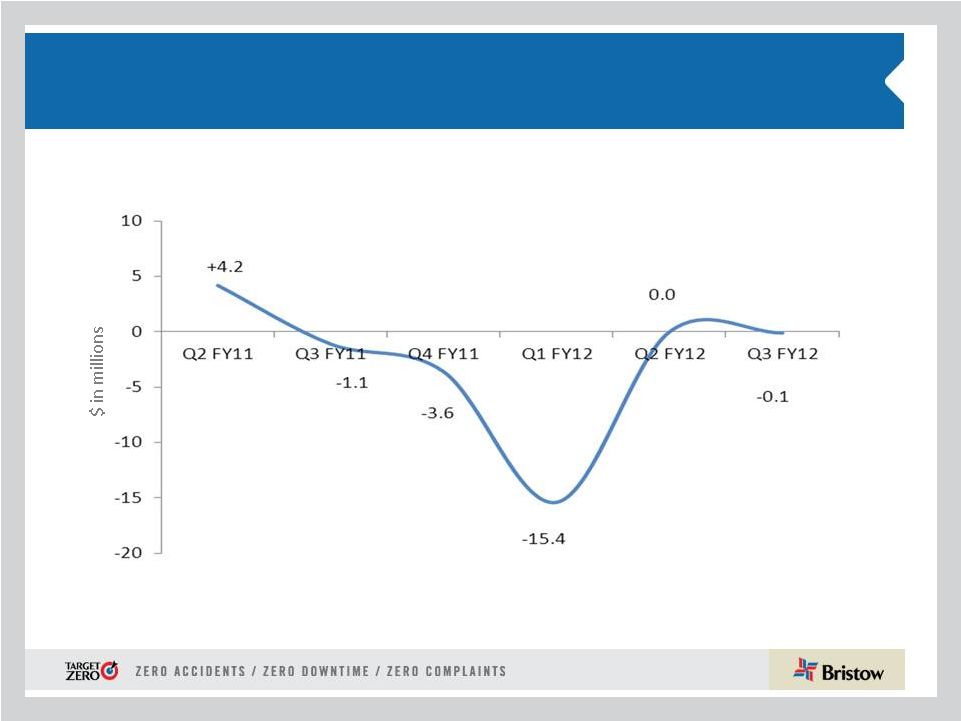 Absolute BVA –
Six Quarters
Sequential quarterly improvement needs to continue
Absolute BVA Q2 FY11 –
Q3 FY12
See 10-Q/10-K for more information on BVA
16 |
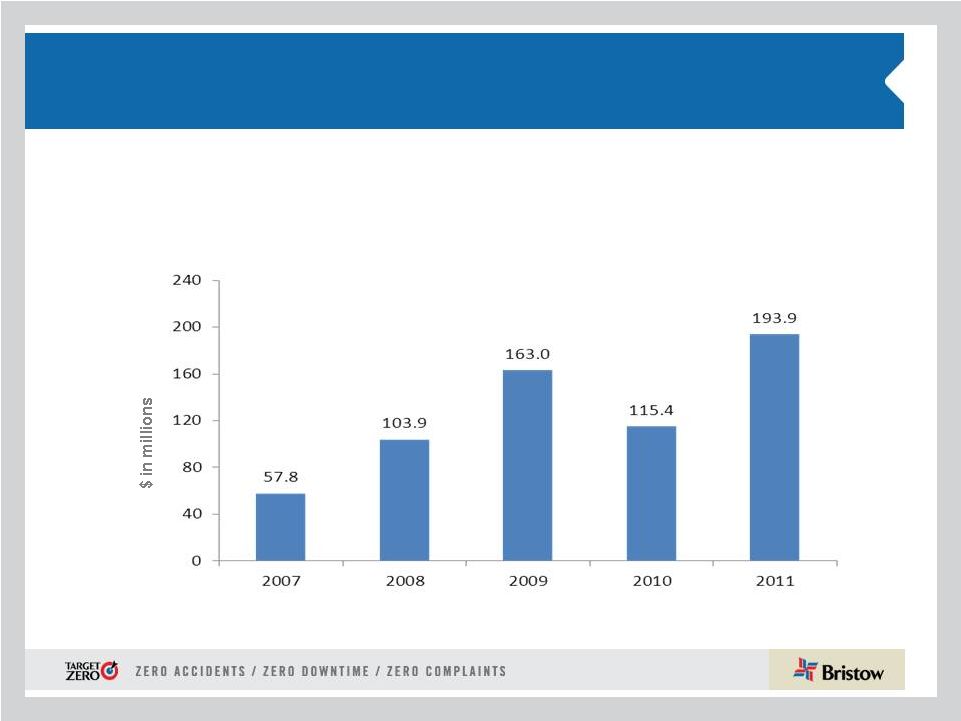 Financial highlights:
Strong operating cash flow generation
We generated 68% more operating cash flow through Q3 FY12
compared to the same period last year
Nine months ended December 31
Net cash provided by operating activities
17 |
 Lowering the cost of capital proactively
•
Increased revolving credit facility to $200 million, the term loan to
$250 million, extended the maturity date to December 2016 and
lowered the credit spread by 62.5 basis points (26% reduction)
•
Demonstrating our belief in the value of our company, we initiated
a $25 million accelerated share repurchase agreement in
December, which we expect to be completed soon
•
We continue to focus on global fleet management as we
anticipate a tightening supply of new technology medium and
large helicopters. This quarter we sold seven old technology
helicopters with proceeds of $11.1 million
18 |
 19
•
Aircraft leasing market is very attractive to Bristow, offering lower rates and
better terms than previously anticipated
•
In December 2011 we entered into four operating lease transactions for new
technology large aircraft. We expect to execute similar transactions within
the next twelve months as the market continues to be strong
•
Financial statement impact: rent expense is part of direct cost;
operating leases
will increase cash flow from investing activity and decrease capital
expenditures •
Going forward, adjusted EBITDAR is a more relevant metric of operational
performance
compared
to
adjusted
EBITDA
as
we
increase
our
lease
portfolio
•
Our initial goal is to utilize this financing strategy for up to 20-30 percent of our
LACE aircraft over the next few years Operating lease
strategy – opportunistically entering market |
 Financial highlights:
Revised FY12 guidance
* Excludes Bristow Academy, aircraft held for sale, CIP, and reimbursable
revenue. 20
•
EPS guidance range $2.90 - $3.10, excluding aircraft sales and special items
•
Depreciation and amortization expense ~ $90 – $95 million
•
SG & A expense ~ $130 - $135 million
•
Interest expense ~ $35 - $40 million
•
Tax ~ 20% - 24 % (assuming revenue earned in same regions and same mix)
•
LACE* (Large Aircraft Equivalent) = 157
•
Revenue/LACE Rate* ~ $7.40 - $7.50 million per LACE aircraft per year |
 Conclusions
•
We have just announced major commercial and operational changes
that will enhance our operational execution and ensure that we deliver
on our promises
•
Our
key
objective
is
to
improve
our
safe
and
reliable
operations
while
creating acceptable returns in our base business
•
Cash flow generation is strong and allows Bristow to have a prudent
financial profile, strategic flexibility and deliver a balanced return for
shareholders
21 |
 Appendix
22 |
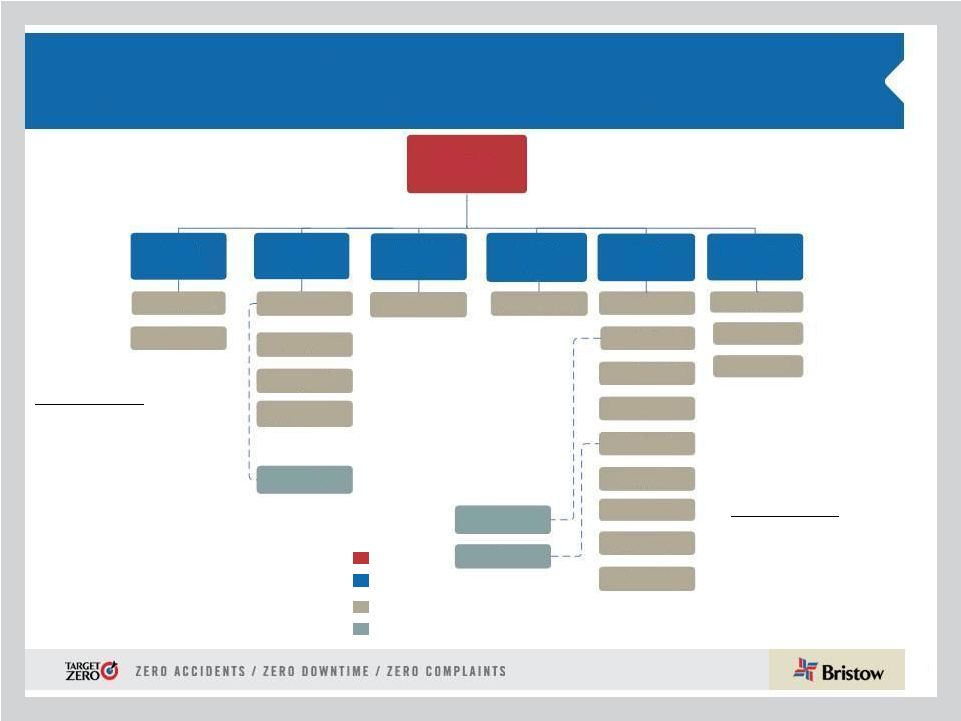 Organizational Chart -
as of December 31, 2011
23
Corporate
Region
( # of Aircraft / # of Locations)
Joint Venture
(No. of aircraft)
Key
Operated Aircraft
Bristow owns and/or operates 364
aircraft as of December 31, 2011
Affiliated Aircraft
Bristow affiliates and joint
ventures operate 186 aircraft
as of December 31, 2011
Business Unit
(*
%
of
YTD
FY12
Operating
Revenue)
NABU
15%*
AUSBU
12%
EBU
37%
WASBU
21%
OIBU
12%
3%
U.S. GoM
–
80/7
Alaska
–
13/3
UK –38/4
Netherlands –
4/1
Norway
–
14/3
FBH -
64
BRS Academy
Denmark –
1/1
Trinidad
–
10/1
Mexico –
16/5
Brazil
–10/9
Lider -
77
Nigeria –
48/7
Australia –
30/10
Other
–
14/1
Russia
–
7/3
Egypt
–
–/–
India
–
1/2
Turkmenistan
–
2/1
PAS -
45
Florida
–
54/1
Louisiana
–
15/1
U. K.
–
2/1
Malaysia –
5/2
Bristow |
 Aircraft Fleet –
Medium and Large
As of December 31, 2011
Next Generation Aircraft
Medium capacity 12-16 passengers
Large capacity 18-25 passengers
Mature Aircraft Models
Aircraft
Type
No. of PAX
Engine
Consl
Unconsl
Total
Ordered
Large Helicopters
AS332L Super Puma
18
Twin Turbine
30
-
30
-
AW189
16
Twin Turbine
-
-
-
6
EC225
25
Twin Turbine
18
-
18
-
Mil MI 8
20
Twin Turbine
7
-
7
-
Sikorsky S-61
18
Twin Turbine
2
-
2
-
Sikorsky S-92
19
Twin Turbine
28
2
30
10
85
2
87
16
LACE
79
Medium Helicopters
AW139
12
Twin Turbine
7
2
9
-
Bell 212
12
Twin Turbine
2
14
16
-
Bell 412
13
Twin Turbine
35
20
55
-
EC155
13
Twin Turbine
3
-
3
-
Sikorsky S-76A/A++
12
Twin Turbine
17
6
23
-
Sikorsky S-76C/C++
12
Twin Turbine
54
28
82
-
118
70
188
-
LACE
55
24 |
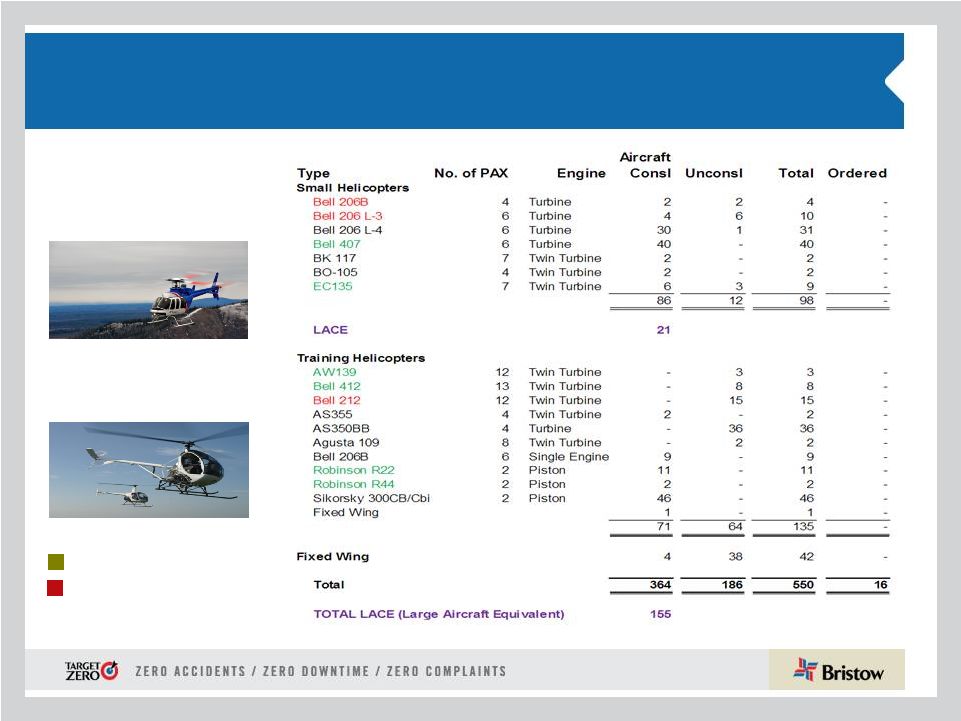 Aircraft Fleet –
Small, Training and Fixed
As of December 31, 2011 (continued)
Next Generation Aircraft
Mature Aircraft Models
Small capacity 4-7 passengers
Training capacity 2-6 passengers
•LACE does not include held for sale, training and fixed wing
helicopters 25 |
 Consolidated Fleet Changes and Aircraft Sales for
Q3 FY12
EBU
WASBU
AUSBU
OIBU
NABU
Total
Large
3
-
3
-
-
6
Medium
2
1
1
3
1
8
Small
-
2
-
-
-
2
Total
5
3
4
3
1
16
Aircraft held for sale by BU
Q 1 FY12
Q 2 FY12
Q 3 FY12
YTD
Fleet Count Beginning Period
373
372
366
373
Delivered
EC225
2
1
3
S-92
2
3
5
Citation XLS
1
1
Total Delivered
2
3
4
9
Removed
Sales
(3)
(5)
(7)
(15)
Other*
(4)
1
(3)
Total Removed
(3)
(9)
(6)
(18)
372
366
364
364
* Includes destroyed aircraft, lease returns and commencements
Fleet changes
EBU
WASBU
AUSBU
OIBU
NABU
BA
Total
Large
3
-
-
-
2
-
5
Medium
-
-
-
-
9
-
9
Small
-
-
2
-
1
-
3
Fixed
-
1
-
-
-
-
1
Training
-
-
-
-
-
23
23
Total
3
1
2
-
12
23
41
Leased aircraft in consolidated fleet
# of A/C Sold
Cash
Received*
Q1 FY12
3
2,478
Q2 FY12
5
10,674
Q3 FY12
9
81,248
Totals
17
94,400
26
* Amounts stated in thousands; In Q3 FY12 two aircraft were sold for
$47.9 million and entered into lease back agreements and two aircraft
interest previously included in CIP were sold for $23.4 million. |
 #
Helicopter
Class
Delivery Date
Location
Contracted
#
Helicopter
Class
Delivery Date
Location
1
Large
March 2012
EBU
1 of 1
4
Medium
June 2012
EBU
1
Large
June 2012
OIBU
1 of 1
1
Medium
December 2012
OIBU
1
Large
June 2012
WASBU
1 of 1
1
Medium
March 2013
OIBU
4
Large
December 2012
EBU
1 of 4
2
Medium
June 2013
OIBU
3
Large
March 2013
EBU
3 of 3
1
Medium
September 2013
OIBU
1
Large
September 2014
NABU
1
Medium
September 2013
AUSBU
1
Large
December 2014
OIBU
1
Large
September 2013
AUSBU
1
Large
March 2015
OIBU
2
Medium
December 2013
AUSBU
1
Large
June 2015
EBU
4
Large
December 2013
EBU
1
Large
March 2016
EBU
1
Large
December 2013
AUSBU
1
Large
June 2016
AUSBU
1
Large
March 2014
AUSBU
16
7 of 16
1
Large
June 2014
AUSBU
1
Large
September 2014
AUSBU
* Six large ordered aircraft expected to enter service late
1
Large
December 2014
AUSBU
calendar 2014 are subject to the successful development
1
Large
March 2015
AUSBU
and certification of the aircraft.
1
Large
June 2015
AUSBU
Order book does not include two large leased aircraft
1
Large
June 2015
NABU
under contract with delivery dates in June and September
1
Large
September 2015
OIBU
2012 quarters.
1
Large
September 2015
EBU
1
Large
December 2015
OIBU
1
Large
December 2015
EBU
1
Large
March 2016
OIBU
2
Large
June 2016
EBU
1
Large
September 2016
OIBU
1
Large
September 2016
EBU
1
Large
December 2016
EBU
1
Large
December 2016
AUSBU
1
Large
March 2017
OIBU
1
Large
June 2017
EBU
1
Large
September 2017
OIBU
1
Large
December 2017
OIBU
40
ORDER BOOK*
OPTIONS BOOK
Order and options book as of December 31, 2011
Fair market value of our fleet is ~$1.9
billion as of December 31, 2011.
27 |
 Adjusted EBITDAR margin trend
1) Calculated by taking adjusted EBITDAR divided by operating revenue
2) Adjusted EBITDAR excludes special items and asset dispositions
28
27.0%
26.5%
26.0%
24.0%
23.5%
25.5%
23.0%
25.0%
24.5%
22.5%
26.4%
24.0%
25.0%
26.7%
25.6%
2008
2009
2010
2011
2012
9 Mos Ended 12/31
Full Year |
 Adjusted EBITDAR reconciliation
29
($ in millions)
2006
2007
2008
2009
Income from continuing operations
$54.5
$72.5
$107.7
$125.5
Income tax expense
$14.7
$38.8
$44.5
$50.5
Interest expense
$14.7
$10.9
$23.8
$35.1
Gain on disposal of assets
($0.1)
($10.6)
($9.4)
($9.1)
Depreciation and amortization
42.1
42.5
54.1
65.5
Special items
–
–
(1.4)
(42)
EBITDA Subtotal
125.8
154.1
219.3
225.6
Rental expense
12.1
18.8
22.8
21.1
Adjusted EBITDAR
$137.9
$172.9
$242.1
$246.7
($ in millions)
2010
2011
Income from continuing operations
$113.5
$133.3
Income tax expense
$29.0
$7.1
Interest expense
$42.4
$46.2
Gain on disposal of assets
(18.7)
(10.2)
Depreciation and amortization
74.7
90.9
Special items
–
1.2
EBITDA Subtotal
240.9
268.5
Rental expense
27.3
29.2
Adjusted EBITDAR
$268.2
$297.7
($ in millions)
YTD FY11
YTD FY12
TTM as of
12/31/2011
12/31/2011
12/31/2011
Income from continuing operations
$102.1
$50.7
$81.9
Income tax expense
0.0
11.8
18.9
Interest expense
36.3
28.2
38.1
Gain on disposal of assets
(3.6)
3.1
(3.5)
Depreciation and amortization
61.6
70.8
100.1
Special items
(1.2)
24.6
27.1
EBITDA Subtotal
195.2
189.1
262.4
Rental expense
21.4
30.9
38.6
Adjusted EBITDAR
$216.7
$220.0
$301.1
March 31,
March 31, |
 Operating margin trend
Bristow Group
Operating Margin Trend
Actual
2008
2009
2010
2011
2012
As Reported
Full Year
Full Year
Q1
Q2
Q3
Q4
FY
Q1
Q2
Q3
Q4
FY
Q1
Q2
Q3
EBU
23.6%
19.3%
17.2%
16.7%
16.1%
18.1%
17.0%
18.0%
18.4%
19.6%
18.8%
18.8%
17.3%
16.8%
15.5%
WASBU
17.9%
21.5%
24.9%
29.3%
25.4%
34.7%
28.5%
26.5%
29.5%
29.8%
24.0%
27.4%
20.6%
25.2%
25.9%
NABU
14.5%
12.1%
8.9%
9.7%
3.3%
2.2%
6.1%
10.1%
16.1%
4.2%
-4.0%
7.5%
3.6%
5.3%
4.3%
AUSBU
17.2%
5.9%
20.1%
23.1%
24.5%
24.5%
23.2%
22.5%
16.3%
17.2%
17.4%
18.2%
10.0%
1.7%
8.7%
OIBU
17.3%
27.0%
21.8%
35.1%
15.5%
1.8%
19.2%
6.9%
30.6%
27.7%
45.8%
28.4%
33.6%
5.8%
32.6%
Consolidated
16.0%
17.8%
15.4%
18.4%
13.1%
15.2%
15.5%
13.6%
17.1%
14.7%
16.1%
15.4%
11.3%
2.9%
13.1%
New methodology (operating income/operating revenue)
2008
2009
2010
2011
2012
Revised *
Full Year
Full Year
Q1
Q2
Q3
Q4
FY
Q1
Q2
Q3
Q4
FY
Q1
Q2
Q3
EBU
29.2%
24.3%
20.9%
20.5%
19.8%
22.4%
20.8%
21.4%
22.1%
25.4%
23.6%
23.6%
21.5%
20.7%
19.5%
WASBU
19.4%
22.8%
26.8%
30.0%
27.3%
35.7%
29.9%
27.1%
30.5%
30.4%
26.1%
28.6%
21.5%
26.4%
27.1%
NABU
14.5%
12.2%
8.9%
9.7%
3.3%
2.2%
6.2%
10.2%
16.4%
4.2%
-4.0%
7.6%
3.6%
11.0%
4.3%
AUSBU
17.9%
6.3%
21.0%
24.5%
25.5%
25.6%
24.3%
23.6%
17.8%
18.8%
19.1%
19.8%
11.1%
1.9%
9.4%
OIBU
17.4%
27.3%
21.9%
35.9%
15.3%
1.9%
19.4%
6.9%
30.9%
28.2%
47.1%
28.8%
34.5%
5.9%
33.5%
Consolidated **
16.4%
14.7%
15.9%
17.4%
14.2%
13.9%
15.3%
14.0%
18.0%
15.3%
18.3%
16.4%
12.2%
13.0%
15.6%
* -
All amounts revised to exclude reimbursable revenue from denominator.
** -
Revised to exclude aircraft sales from numerator.
30 |
 GAAP reconciliation
31
Adjusted EBITDA
Gain (loss) on disposal of assets
.................................................. Special items
Interest expense
Depreciation and amortization
..................................................... Benefit
(provision) for income taxes ............................................
Net income
Adjusted operating income
Gain (loss) on disposal of
assets................................................. Special items
Gain (loss) on disposal of assets
Special items
Operating income
Adjusted net income
Net
income attributable to Bristow Group
Adjusted earnings per share
Gain (loss) on disposal of assets
Special items
Earnings per share
..............................................................................
Three Months Ended
Nine Months Ended
December 31,
December 31,
2011
2010
2011
2010
(In thousands, except per share amounts)
$
68,933
$
64,435
$
189,132
$
195,221
(2,865)
(33)
(3,060)
3,582
—
1,200
(24,610)
1,200
(9,756)
(13,773)
(28,170)
(36,263)
(22,709)
(21,338)
(70,848)
(61,637)
11,823
(11,779)
(33)
(7,118)
$
26,485
$
42,314
$
50,665
$
102,070
$
46,418
$
119,900
$
132,795
(2,865)
(33)
(3,060)
3,582
3,500
(27,287)
3,500
43,172
$
—
$
43,553
$
46,639
$
89,553
$
139,877
$
27,790
$
26,285
$
71,089
$
82,133
(2,258)
(27)
2,972
15,501
(19,319)
16,342
(2,482)
—
$
$
41,759
$
$
101,447
25,532
49,288
$
0.76
$
0.71
$
1.93
$
2.24
(0.06)
(0.07)
0.08
—
0.42
(0.53)
0.45
0.70
1.13
1.34
2.77
—
................................................................................
…......................................................................
…….................................................................................
…….......................................................
................................................................................
.............................................................................
.........................................................................
................................................
...............................................................................
........................................
............................................................
...........................................................................
...............................................................................
................................................
|
 Special items reconciliation
Three Months Ended
December 31, 2010
Adjusted
Operating
Income
Adjusted
EBITDA
Adjusted
Net Income
Adjusted
Diluted
Earnings
Per
Share
(In thousands, except per share amounts)
Power-by-the-hour credit
................................
$
3,500
$
3,500
$
2,894
$
0.08
Retirement of 6 1/8% Senior Notes…………..
—
(2,300)
(3,966)
(0.11)
Tax items........................................................
—
—
16,573
0.45
Total special items
.....................................
$
3,500
$
1,200
$
15,501
0.42
Nine Months Ended
December 31, 2011
Adjusted
Operating
Income
Adjusted
EBITDA
Adjusted
Net Income
Adjusted
Diluted
Earnings
Per
Share
(In thousands, except per share amounts)
Impairment of inventories
................................
$
(24,610)
$
(24,610)
$
(17,579)
$
(0.48)
Impairment of assets in Creole, Louisiana ….
(
2,677)
—
(1,740)
(0.05)
Total special items
......................................
$
(27,287)
$
(24,610)
$
(19,319)
(0.53)
Nine Months Ended
December 31, 2010
Adjusted
Operating
Income
Adjusted
EBITDA
Adjusted
Net Income
Adjusted
Diluted
Earnings
Per
Share
(In thousands, except per share amounts)
Power-by-the-hour credit
................................
$
3,500
$
3,500
$
2,904
$
0.08
Retirement of 6 1/8% Senior Notes…………..
—
(2,300)
(3,900)
(0.11)
Tax items.........................................................
—
—
17,338
0.47
Total special items
…..................................
$
3,500
$
1,200
$
16,342
0.45
32 |
 Leverage Reconciliation
*Adjusted EBITDAR exclude gains and losses on dispositions of assets
Debt
Investment
Capital
Leverage
(a)
(b)
(c) = (a) + (b)
(a) / (c)
(in millions)
As of December 31, 2011
$
832.8
$ 1,523.5
$ 2,356.3
35.3%
Adjust for:
Unfunded Pension Liability
97.2
97.2
NPV of Lease Obligations
165.0
165.0
Guarantees
15.5
15.5
Letters of credit
1.7
1.7
Adjusted
$
1,112.1
(d)
$ 1,523.5
$ 2,635.6
42.2%
Calculation of debt to adjusted EBITDAR multiple
Adjusted EBITDAR*:
FY 2012
$
301.1
(e)
Annualized
$
401.4
= (d) / (e)
3.69:1
33 |
 Bristow Group Inc. (NYSE: BRS)
2103
City
West
Blvd.,
4
th
Floor
Houston, Texas 77042
t
713.267.7600
f
713.267.7620
bristowgroup.com
Contact Us
34 |