Attached files
| file | filename |
|---|---|
| EX-31.1 - EXHIBIT 31.1 - Measurement Specialties Inc | v300067_ex31-1.htm |
| EX-31.2 - EXHIBIT 31.2 - Measurement Specialties Inc | v300067_ex31-2.htm |
| EX-32.1 - EXHIBIT 32.1 - Measurement Specialties Inc | v300067_ex32-1.htm |
| EXCEL - IDEA: XBRL DOCUMENT - Measurement Specialties Inc | Financial_Report.xls |
UNITED STATES
SECURITIES AND EXCHANGE COMMISSION
WASHINGTON, D.C. 20549
FORM 10-Q
(MARK ONE)
x QUARTERLY REPORT PURSUANT TO SECTION 13 or 15 (d) OF THE SECURITIES
EXCHANGE ACT OF 1934
FOR THE FISCAL QUARTERLY PERIOD ENDED DECEMBER 31, 2011
OR
o TRANSITION REPORT PURSUANT TO SECTION 13 or 15 (d) OF THE SECURITIES
EXCHANGE ACT OF 1934
COMMISSION FILE NUMBER: 1-11906
![]()
MEASUREMENT SPECIALTIES, INC.
(EXACT NAME OF REGISTRANT AS SPECIFIED IN ITS CHARTER)
| New Jersey | 22-2378738 | |
|
(STATE OR OTHER JURISDICTION OF INCORPORATION OR ORGANIZATION) |
(I.R.S. EMPLOYER IDENTIFICATION NO. ) |
1000 LUCAS WAY, HAMPTON, VA 23666
(ADDRESS OF PRINCIPAL EXECUTIVE OFFICES)
(757) 766-1500
(REGISTRANT’S TELEPHONE NUMBER, INCLUDING AREA CODE)
Indicate by check mark whether the registrant (1) has filed all reports required to be filed by Section 13 or 15(d) of the Securities Exchange Act of 1934 during the preceding 12 months (or for such shorter period that the registrant was required to file such reports), and (2) has been subject to such filing requirements for the past 90 days. Yes x No o.
Indicate by check mark whether the registrant has submitted electronically and posted on its corporate Web site, if any, every Interactive Data File required to be submitted and posted pursuant to Rule 405 Regulation S-T during the preceding 12 months (or for such shorter period that the registrant was required to submit and post such files). Yes x No o.
Indicate by check mark whether the registrant is a large accelerated filer, an accelerated filer, a non-accelerated filer, or a smaller reporting company. See definition of “large accelerated filer,” “accelerated filer” and “smaller reporting company” in Rule 12b-2 of the Securities Exchange Act of 1934. (Check one):
| Large accelerated filer o | Accelerated filer x | Non-accelerated filer o | Smaller reporting company o |
| (Do not check if a smaller reporting company) | |||
Indicate by check mark whether the registrant is a shell company (as defined in Rule 12b-2 of the Securities Exchange Act of 1934). Yes o No x.
Indicate the number of shares outstanding of each of the issuer’s classes of stock, as of the latest practicable date: On January 26, 2012, the number of shares outstanding of the Registrant’s common stock was 15,113,450.
EASUREMENT SPECIALTIES, INC.
FORM 10-Q
TABLE OF CONTENTS
DECEMBER 31, 2011
| PART I. | FINANCIAL INFORMATION | 3 | |
| ITEM 1. | FINANCIAL STATEMENTS | 3 | |
| CONDENSED CONSOLIDATED STATEMENTS OF OPERATIONS (UNAUDITED) | 3 | ||
| CONDENSED CONSOLIDATED BALANCE SHEETS (UNAUDITED) | 4 | ||
| CONDENSED CONSOLIDATED STATEMENTS OF SHAREHOLDERS’ EQUITY AND COMPREHENSIVE INCOME (UNAUDITED) | 6 | ||
| CONDENSED CONSOLIDATED STATEMENTS OF CASH FLOWS (UNAUDITED) | 7 | ||
|
NOTES TO CONDENSED CONSOLIDATED FINANCIAL STATEMENTS (UNAUDITED) |
8 | ||
| ITEM 2. | MANAGEMENT’S DISCUSSION AND ANALYSIS OF FINANCIAL CONDITION AND RESULTS OF OPERATIONS | 23 | |
| ITEM 3. | QUANTITATIVE AND QUALITATIVE DISCLOSURES ABOUT MARKET RISK | 39 | |
| ITEM 4. | CONTROLS AND PROCEDURES | 40 | |
| PART II. | OTHER INFORMATION | 40 | |
| ITEM 1. | LEGAL PROCEEDINGS | 40 | |
| ITEM 1A. | RISK FACTORS | 40 | |
| ITEM 6. | EXHIBITS | 40 | |
| SIGNATURES | 41 | ||
| 2 |
PART I. FINANCIAL INFORMATION
ITEM 1. FINANCIAL STATEMENTS
MEASUREMENT SPECIALTIES, INC. AND SUBSIDIARIES
CONDENSED CONSOLIDATED STATEMENTS OF OPERATIONS
(UNAUDITED)
| Three months ended December 31, | Nine months ended December 31, | |||||||||||||||
| (Amounts in thousands, except per share amounts) | 2011 | 2010 | 2011 | 2010 | ||||||||||||
| Net sales | $ | 76,341 | $ | 71,687 | $ | 226,768 | $ | 198,022 | ||||||||
| Cost of goods sold | 47,470 | 42,030 | 135,449 | 114,424 | ||||||||||||
| Gross profit | 28,871 | 29,657 | 91,319 | 83,598 | ||||||||||||
| Selling, general, and administrative expenses | 22,406 | 20,752 | 66,282 | 58,065 | ||||||||||||
| Operating income | 6,465 | 8,905 | 25,037 | 25,533 | ||||||||||||
| Interest expense, net | 806 | 753 | 1,932 | 2,395 | ||||||||||||
| Foreign currency exchange loss (gain) | 27 | (63 | ) | 47 | 134 | |||||||||||
| Equity income in unconsolidated joint venture | (240 | ) | (153 | ) | (612 | ) | (402 | ) | ||||||||
| Other expense (income) | (10 | ) | (24 | ) | 41 | 110 | ||||||||||
| Income before income taxes | 5,882 | 8,392 | 23,629 | 23,296 | ||||||||||||
| Income tax expense | 1,187 | 893 | 4,269 | 3,453 | ||||||||||||
| Net income | $ | 4,695 | $ | 7,499 | $ | 19,360 | $ | 19,843 | ||||||||
| Earnings per common share - Basic: | ||||||||||||||||
| Net income - Basic | $ | 0.31 | $ | 0.51 | $ | 1.29 | $ | 1.36 | ||||||||
| Net income - Diluted | $ | 0.30 | $ | 0.49 | $ | 1.22 | $ | 1.30 | ||||||||
| Weighted average shares outstanding - Basic | 15,040 | 14,684 | 15,059 | 14,609 | ||||||||||||
| Weighted average shares outstanding - Diluted | 15,818 | 15,447 | 15,918 | 15,222 | ||||||||||||
See accompanying notes to condensed consolidated financial statements.
| 3 |
MEASUREMENT SPECIALTIES, INC. AND SUBSIDIARIES
CONDENSED CONSOLIDATED BALANCE SHEETS
(UNAUDITED)
| (Amounts in thousands) | December 31, 2011 | March 31, 2011 | ||||||
| ASSETS | ||||||||
| Current assets: | ||||||||
| Cash and cash equivalents | $ | 24,552 | $ | 20,860 | ||||
| Accounts receivable trade, net of allowance for | ||||||||
| doubtful accounts of $678 and $714, respectively | 45,027 | 43,624 | ||||||
| Inventories, net | 56,920 | 52,212 | ||||||
| Deferred income taxes, net | 2,652 | 3,212 | ||||||
| Prepaid expenses and other current assets | 5,215 | 5,514 | ||||||
| Other receivables | 1,583 | 1,222 | ||||||
| Assets held for sale | 1,829 | — | ||||||
| Total current assets | 137,778 | 126,644 | ||||||
| Property, plant and equipment, net | 54,004 | 50,303 | ||||||
| Goodwill | 145,617 | 115,864 | ||||||
| Acquired intangible assets, net | 50,792 | 28,656 | ||||||
| Deferred income taxes, net | 2,283 | 2,883 | ||||||
| Investment in unconsolidated joint venture | 3,019 | 2,578 | ||||||
| Other assets | 4,732 | 2,838 | ||||||
| Total assets | $ | 398,225 | $ | 329,766 | ||||
See accompanying notes to condensed consolidated financial statements.
| 4 |
MEASUREMENT SPECIALTIES, INC. AND SUBSIDIARIES
CONDENSED CONSOLIDATED BALANCE SHEETS
(UNAUDITED)
| (Amounts in thousands, except share amounts) | December 31, 2011 | March 31, 2011 | ||||||
| LIABILITIES AND SHAREHOLDERS' EQUITY | ||||||||
| Current liabilities: | ||||||||
| Current portion of long-term debt | $ | 133 | $ | 171 | ||||
| Current portion of capital lease obligations | 35 | 39 | ||||||
| Promissory notes payable | 2,660 | 2,713 | ||||||
| Accounts payable | 26,520 | 21,815 | ||||||
| Accrued expenses | 7,532 | 5,441 | ||||||
| Accrued compensation | 8,716 | 12,646 | ||||||
| Income taxes payable | 1,157 | 2,491 | ||||||
| Deferred income taxes, net | 430 | 444 | ||||||
| Other current liabilities | 2,899 | 2,752 | ||||||
| Total current liabilities | 50,082 | 48,512 | ||||||
| Revolver | 80,327 | 46,000 | ||||||
| Long-term debt, net of current portion | 20,722 | 20,901 | ||||||
| Capital lease obligations, net of current portion | 35 | 17 | ||||||
| Acquisition earn-out contingencies | 3,948 | — | ||||||
| Deferred income taxes, net | 12,025 | 3,532 | ||||||
| Other liabilities | 2,441 | 1,735 | ||||||
| Total liabilities | 169,580 | 120,697 | ||||||
| Equity: | ||||||||
| Serial preferred stock; 221,756 shares authorized; none outstanding | — | — | ||||||
| Common stock, no par; 25,000,000 shares authorized; 15,087,099 shares | ||||||||
| and 14,989,675 shares issued and outstanding | — | — | ||||||
| Additional paid-in capital | 96,707 | 93,608 | ||||||
| Retained earnings | 120,669 | 101,309 | ||||||
| Accumulated other comprehensive income | 11,269 | 14,152 | ||||||
| Total equity | 228,645 | 209,069 | ||||||
| Total liabilities and shareholders' equity | $ | 398,225 | $ | 329,766 | ||||
See accompanying notes to condensed consolidated financial statements.
| 5 |
MEASUREMENT SPECIALTIES, INC. AND SUBSIDIARIES
CONDENSED CONSOLIDATED STATEMENTS OF SHAREHOLDERS’ EQUITY
AND COMPREHENSIVE INCOME
FOR THE NINE MONTHS ENDED DECEMBER 31, 2011 AND 2010
(UNAUDITED)
| Accumulated | Compre- | |||||||||||||||||||||||
| Shares of | Additional | Other | hensive | |||||||||||||||||||||
| Common | Paid-in | Retained | Comprehensive | Income | ||||||||||||||||||||
| (Dollars in thousands) | Stock | Capital | Earnings | Income | Total | (Loss) | ||||||||||||||||||
| Balance, March 31, 2010 | 14,534,431 | $ | 85,338 | $ | 73,134 | $ | 8,524 | $ | 166,996 | |||||||||||||||
| Comprehensive income: | ||||||||||||||||||||||||
| Net income | — | 19,843 | — | 19,843 | $ | 19,843 | ||||||||||||||||||
| Currency translation adjustment | — | 2,833 | 2,833 | 2,833 | ||||||||||||||||||||
| Comprehensive income | $ | 22,676 | ||||||||||||||||||||||
| Non-cash equity based compensation | 2,231 | — | — | 2,231 | ||||||||||||||||||||
| Amounts from exercise of stock options | 372,165 | 4,818 | — | — | 4,818 | |||||||||||||||||||
| Tax benefit from exercise of stock options | 122 | — | — | 122 | ||||||||||||||||||||
| Balance, December 31, 2010 | 14,906,596 | $ | 92,509 | $ | 92,977 | $ | 11,357 | $ | 196,843 | |||||||||||||||
| Balance, March 31, 2011 | 14,989,675 | $ | 93,608 | $ | 101,309 | $ | 14,152 | $ | 209,069 | |||||||||||||||
| Comprehensive income: | ||||||||||||||||||||||||
| Net income | — | 19,360 | — | 19,360 | $ | 19,360 | ||||||||||||||||||
| Currency translation adjustment | — | — | (2,883 | ) | (2,883 | ) | (2,883 | ) | ||||||||||||||||
| Comprehensive income | $ | 16,477 | ||||||||||||||||||||||
| Non-cash equity based compensation | 3,662 | — | — | 3,662 | ||||||||||||||||||||
| Amounts from exercise of stock options | 327,335 | 5,123 | — | — | 5,123 | |||||||||||||||||||
| Tax benefit from exercise of stock options | 819 | — | — | 819 | ||||||||||||||||||||
| Purchases of company stock | (229,911 | ) | (6,505 | ) | — | — | (6,505 | ) | ||||||||||||||||
| Balance, December 31, 2011 | 15,087,099 | $ | 96,707 | $ | 120,669 | $ | 11,269 | $ | 228,645 | |||||||||||||||
See accompanying notes to condensed consolidated financial statements.
| 6 |
MEASUREMENT SPECIALTIES, INC. AND SUBSIDIARIES
CONDENSED CONSOLIDATED STATEMENTS OF CASH FLOWS
(UNAUDITED)
| Nine months ended December 31, | ||||||||
| (Amounts in thousands) | 2011 | 2010 | ||||||
| Cash flows from operating activities: | ||||||||
| Net income | $ | 19,360 | $ | 19,843 | ||||
| Adjustments to reconcile net income to net cash | ||||||||
| provided by operating activities: | ||||||||
| Depreciation and amortization | 11,948 | 11,226 | ||||||
| Gain on sale of assets | — | (3 | ) | |||||
| Non-cash equity based compensation | 3,662 | 2,231 | ||||||
| Deferred income taxes | (479 | ) | 360 | |||||
| Equity income in unconsolidated joint venture | (612 | ) | (402 | ) | ||||
| Unconsolidated joint venture distributions | 582 | 114 | ||||||
| Net change in operating assets and liabilities: | ||||||||
| Accounts receivable, trade | 2,142 | (5,264 | ) | |||||
| Inventories | (2,932 | ) | (10,316 | ) | ||||
| Prepaid expenses, other current assets and other receivables | 596 | (864 | ) | |||||
| Other assets | (1,910 | ) | 62 | |||||
| Accounts payable | 1,622 | 451 | ||||||
| Accrued expenses, accrued compensation, other current and other liabilities | (3,576 | ) | 3,365 | |||||
| Income taxes payable | (3,209 | ) | 1,784 | |||||
| Net cash provided by operating activities | 27,194 | 22,587 | ||||||
| Cash flows from investing activities: | ||||||||
| Purchases of property and equipment | (9,759 | ) | (6,676 | ) | ||||
| Proceeds from sale of assets | — | 33 | ||||||
| Acquisition of business, net of cash acquired, and acquired intangible assets | (46,317 | ) | (27,037 | ) | ||||
| Net cash used in investing activities | (56,076 | ) | (33,680 | ) | ||||
| Cash flows from financing activities: | ||||||||
| Borrowings from revolver | 48,900 | 62,746 | ||||||
| Borrowings from long-term debt | — | 20,000 | ||||||
| Repayments of revolver, and capital leases | (14,559 | ) | (59,700 | ) | ||||
| Repayments of long-term debt | (141 | ) | (8,145 | ) | ||||
| Payment of deferred financing costs | (353 | ) | (1,568 | ) | ||||
| Purchase of treasury stock | (6,500 | ) | — | |||||
| Proceeds from exercise of options and employee stock purchase plan | 5,123 | 4,818 | ||||||
| Excess tax benefit from exercise of stock options | 819 | 122 | ||||||
| Net cash provided by (used in) financing activities | 33,289 | 18,273 | ||||||
| Net change in cash and cash equivalents | 4,407 | 7,180 | ||||||
| Effect of exchange rate changes on cash | (715 | ) | 371 | |||||
| Cash, beginning of year | 20,860 | 23,165 | ||||||
| Cash, end of period | $ | 24,552 | $ | 30,716 | ||||
| Supplemental Cash Flow Information: | ||||||||
| Cash paid or received during the period for: | ||||||||
| Interest paid | $ | (1,627 | ) | $ | (2,935 | ) | ||
| Income taxes paid | (3,939 | ) | (1,876 | ) | ||||
| Income taxes refunded | 72 | 1,890 | ||||||
See accompanying notes to condensed consolidated financial statements.
| 7 |
MEASUREMENT SPECIALTIES, INC. AND SUBSIDIARIES
NOTES TO CONDENSED CONSOLIDATED FINANCIAL STATEMENTS
FOR THE THREE AND NINE MONTHS ENDED DECEMBER 31, 2011 AND 2010
(UNAUDITED)
(Amounts in thousands, except share and per share amounts)
1. DESCRIPTION OF BUSINESS
Interim financial statements: The information presented as of December 31, 2011 and for the three and nine months ended December 31, 2011 and 2010 is unaudited, and reflects all adjustments (consisting only of normal recurring adjustments) which Measurement Specialties, Inc. (the “Company,” “MEAS,” or “we”) considers necessary for the fair presentation of the Company’s financial position as of December 31, 2011, the results of its operations for the three and nine months ended December 31, 2011 and 2010, and cash flows for the nine months ended December 31, 2011 and 2010. The Company’s March 31, 2011 condensed consolidated balance sheet information was derived from the audited consolidated financial statements for the year ended March 31, 2011, which is included as part of the Company’s Annual Report on Form 10-K.
The condensed consolidated financial statements included herein have been prepared in accordance with U.S. generally accepted accounting principles (“U.S. GAAP”) and the instructions to Form 10-Q and Regulation S-X. Accordingly, certain information and footnote disclosures normally included in financial statements prepared in accordance with U.S. generally accepted accounting principles have been condensed or omitted. These condensed consolidated financial statements should be read in conjunction with the Company’s audited consolidated financial statements for the year ended March 31, 2011, which are included as part of the Company’s Annual Report on Form 10-K.
Description of business: Measurement Specialties, Inc. is a global leader in the design, development and manufacture of sensors and sensor-based systems for original equipment manufacturers (“OEM”) and end users, based on a broad portfolio of proprietary technology and typically characterized by the MEAS brand name. We are a global business and we believe we have a high degree of diversity when considering our geographic reach, broad range of products, number of end-use markets and breadth of customer base. The Company is a multi-national corporation with fourteen primary manufacturing facilities strategically located in the United States, China, France, Ireland, Germany, Switzerland and Scotland, enabling the Company to produce and market globally a wide range of sensors that use advanced technologies to measure precise ranges of physical characteristics. These sensors are used for engine and vehicle, medical, general industrial, consumer and home appliance, military/aerospace, water monitoring and test and measurement applications. The Company’s sensor products include pressure sensors and transducers, pressure and temperature scanning instrumentation, linear/rotary position sensors, piezoelectric polymer film sensors, custom microstructures, load cells, accelerometers, optical sensors, humidity, temperature, fluid property sensors and hydrostatic pressure transducers. The Company's advanced technologies include piezo-resistive silicon sensors, application-specific integrated circuits, micro-electromechanical systems (“MEMS”), piezoelectric polymers, foil strain gauges, force balance systems, fluid capacitive devices, linear and rotational variable differential transformers, electromagnetic displacement sensors, hygroscopic capacitive sensors, ultrasonic sensors, optical sensors, negative thermal coefficient (“NTC”) ceramic sensors, torque sensors, mechanical resonators, reed switch and submersible hydrostatic level sensors.
2. SUMMARY OF SIGNIFICANT ACCOUNTING POLICIES:
Principles of consolidation: The condensed consolidated financial statements include the accounts of the Company and its wholly-owned subsidiaries (the “Subsidiaries”). All significant intercompany balances and transactions have been eliminated in consolidation.
The Company accounts for its 50 percent ownership interest in Nikkiso-THERM (“NT”), a joint venture in Japan and the Company’s one variable interest entity (“VIE”), under the equity method of accounting. Under the equity method of accounting, the Company does not consolidate the VIE but recognizes its proportionate share of the profits and losses of the unconsolidated VIE.
| 8 |
Use of estimates: The preparation of the consolidated financial statements, in accordance with U.S. generally accepted accounting principles, requires management to make estimates and assumptions which affect the reported amounts of assets and liabilities and the disclosure of contingent assets and liabilities at the date of the financial statements and revenues and expenses during the reporting period. Significant items subject to such estimates and assumptions include the useful lives of fixed assets, carrying amount and analysis of recoverability of property, plant and equipment, assets held for sale, acquired intangibles, goodwill, deferred tax assets, valuation allowances for receivables, inventories, income tax uncertainties and other contingencies, including acquisition earn-outs, and stock based compensation. Actual results could differ from those estimates.
Recently adopted accounting pronouncements: In October 2009, the Financial Accounting Standards Board (“FASB”) issued new accounting standards for multiple-deliverable revenue arrangements. These new standards establish the accounting and reporting guidance for arrangements, including multiple revenue-generating activities, and provide amendments to the criteria for separating deliverables and measuring and allocating arrangement consideration to one or more units of accounting. The amendments also establish a selling price hierarchy for determining the selling price of a deliverable. Significantly enhanced disclosures are also required to provide information about a vendor’s multiple-deliverable revenue arrangements, including information about the nature and terms, significant deliverables, and its performance within arrangements. The amendments also require providing information about the significant judgments made and changes to those judgments and about how the application of the relative selling-price method affects the timing or amount of revenue recognition. The new accounting standards requirements were effective for fiscal years beginning after June 15, 2010, which is the Company’s 2012 fiscal year. Early adoption of the standard was permitted and various options for prospective or retroactive adoption were available. The Company adopted these new accounting standards effective April 1, 2011. The impact of these new requirements was not material to the Company’s results of operations or financial condition.
Recently issued accounting pronouncements: In June 2011, the FASB issued new accounting standards for reporting comprehensive income. The new accounting standards revise the presentation of comprehensive income in financial statements and require that net income and other comprehensive income be reported either in a single, continuous statement of comprehensive income or in two separate, but consecutive, statements. Presentation of components of comprehensive income in the statements as changes in stockholders’ equity will no longer be allowed. Adjustments for items that are reclassified from other comprehensive income to net income must be presented on the face of the financial statements where the components of net income and other comprehensive income are presented. These new reporting requirements are effective for fiscal years, and interim periods within those years, beginning after December 15, 2011, which is the Company’s 2013 fiscal year. Early adoption of the standard is permitted. The Company will apply the new reporting requirements retrospectively effective April 1, 2012. The adoption will not have an impact on the Company’s consolidated results of operations or financial position.
In September 2011, the FASB issued new guidance on testing goodwill for impairment. Entities will have an option of performing a qualitative assessment before calculating the fair value of their reporting units. If, based on the qualitative assessment, an entity concludes it is more likely than not that the fair value of the reporting unit exceeds its carrying value, quantitative testing for impairment is not necessary. The new accounting standard is applicable for goodwill impairment testing performed in years beginning after December 15, 2011 and early adoption is permitted. The Company will apply the new reporting requirements effective April 1, 2012. The adoption is not expected to have an impact on the Company’s consolidated results of operations or financial position.
3. STOCK BASED COMPENSATION AND PER SHARE INFORMATION
Non-cash equity-based compensation expense for the three months ended December 31, 2011 and 2010 was $1,162 and $974, respectively, and for the nine months ended December 31, 2011 and 2010 was $3,662 and $2,231, respectively. During the three months ended December 31, 2011, the Company did not grant any stock awards, and during the nine months ended December 31, 2011, the Company granted 22,778 restricted stock units and options from the 2010 Equity Incentive Plan (the “2010 Plan”). The estimated fair value of restricted stock units granted during nine months ended December 31, 2011 approximated $631, net of expected forfeitures and is being recognized over the respective vesting periods. During the three and nine months ended December 31, 2011, the Company recognized $144 and $315, respectively, of expense related to these restricted stock units.
| 9 |
The Company has five share-based compensation plans for which equity awards are currently outstanding. These plans are administered by the compensation committee of the Board of Directors, which approves grants to individuals eligible to receive awards and determines the number of shares and/or options subject to each award, the terms, conditions, performance measures, and other provisions of the award. The Chief Executive Officer can also grant individual awards up to certain limits as approved by the compensation committee. Awards are generally granted based on the individual’s performance. Terms for stock option awards include pricing based on the closing price of the Company’s common stock on the award date, and generally vest over three to five year requisite service periods using a graded vesting schedule or subject to performance targets established by the compensation committee. Shares issued under stock option plans are newly issued common stock. Readers should refer to Note 13 of the consolidated financial statements in the Company’s Annual Report on Form 10-K for the fiscal year ended March 31, 2011 for additional information related to the five share-based compensation plans under which awards are currently outstanding.
The Company uses the Black-Scholes-Merton option pricing model to estimate the fair value of equity-based awards with the following assumptions for the indicated periods.
| Three months ended December 31, | Nine months ended December 31, | |||||||||||||||
| 2011 | 2010 | 2011 | 2010 | |||||||||||||
| Dividend yield | — | — | — | — | ||||||||||||
| Expected volatility | 74.1 | % | 68.8 | % | 74.1 | % | 68.3 | % | ||||||||
| Risk free interest rate | 1.3 | % | 0.9 | % | 1.3 | % | 1.1 | % | ||||||||
| Expected term after vesting (in years) | 2.0 | 2.0 | 2.0 | 2.0 | ||||||||||||
| Weighted-average grant-date fair value | $ | 31.90 | $ | 13.71 | $ | 31.90 | $ | 13.00 | ||||||||
The assumptions above are based on multiple factors, including historical exercise patterns of employees with respect to exercise and post-vesting employment termination behaviors, expected future exercise patterns for these employees and the historical volatility of our stock price. The expected term of options granted is derived using company-specific, historical exercise information and represents the period of time that options granted are expected to be outstanding. The risk-free interest rate for periods within the contractual life of the option is based on the U.S. Treasury yield curve in effect at the time of grant.
During the nine months ended December 31, 2011, 327,335 stock options were exercised yielding $5,123 in cash proceeds and excess tax benefit of $819 recognized as additional paid-in capital. At December 31, 2011, there was $2,258 of unrecognized compensation cost adjusted for estimated forfeitures related to share-based payments, which is expected to be recognized over a weighted-average period of approximately 1 year.
Per share information: Basic and diluted per share calculations are based on net income. Basic per share information is computed based on the weighted average common shares outstanding during each period. Diluted per share information additionally considers the shares that may be issued upon exercise or conversion of stock options, less the shares that may be repurchased with the funds received from their exercise. Outstanding awards relating to approximately 139,902 and 688,540 weighted shares were excluded from the calculation for the three months ended December 31, 2011 and 2010, respectively, and outstanding awards relating to approximately 417,635 and 1,762,164 weighted shares were excluded from the calculation for the nine months ended December 31, 2011 and 2010, respectively, as the impact of including such awards in the calculation of diluted earnings per share would have had an anti-dilutive effect.
The computation of the basic and diluted net income per common share is as follows:
| 10 |
| Net income (Numerator) | Weighted Average Shares in thousands (Denominator) | Per-Share Amount | ||||||||||
| Three months ended December 31, 2011: | ||||||||||||
| Basic per share information | $ | 4,695 | 15,040 | $ | 0.31 | |||||||
| Effect of dilutive securities | — | 778 | (0.01 | ) | ||||||||
| Diluted per-share information | $ | 4,695 | 15,818 | $ | 0.30 | |||||||
| Three months ended December 31, 2010: | ||||||||||||
| Basic per share information | $ | 7,499 | 14,684 | $ | 0.51 | |||||||
| Effect of dilutive securities | — | 763 | (0.02 | ) | ||||||||
| Diluted per-share information | $ | 7,499 | 15,447 | $ | 0.49 | |||||||
| Nine months ended December 31, 2011: | ||||||||||||
| Basic per share information | $ | 19,360 | 15,059 | $ | 1.29 | |||||||
| Effect of dilutive securities | — | 859 | (0.07 | ) | ||||||||
| Diluted per-share information | $ | 19,360 | 15,918 | $ | 1.22 | |||||||
| Nine months ended December 31, 2010: | ||||||||||||
| Basic per share information | $ | 19,843 | 14,609 | $ | 1.36 | |||||||
| Effect of dilutive securities | — | 613 | (0.06 | ) | ||||||||
| Diluted per-share information | $ | 19,843 | 15,222 | $ | 1.30 | |||||||
4. INVENTORIES
Inventories are valued at the lower of cost or market (‘LCM’) using the first-in first-out method. Inventories and inventory reserves for slow-moving, obsolete and lower of cost or market exposures at December 31, 2011 and March 31, 2011 are summarized as follows:
| December 31, 2011 | March 31, 2011 | |||||||
| Raw Materials | $ | 32,421 | $ | 30,608 | ||||
| Work-in-Process | 10,867 | 10,330 | ||||||
| Finished Goods | 18,303 | 15,650 | ||||||
| 61,591 | 56,588 | |||||||
| Inventory Reserves | (4,671 | ) | (4,376 | ) | ||||
| $ | 56,920 | $ | 52,212 | |||||
5. PROPERTY, PLANT AND EQUIPMENT
Property, plant and equipment are stated at cost. Equipment under capital leases is stated at the present value of minimum lease payments. Property, plant and equipment are summarized as follows:
| December 31, 2011 | March 31, 2011 | Useful Life | ||||||||||
| Production equipment and tooling | $ | 58,780 | $ | 55,295 | 3-10 years | |||||||
| Building and leasehold improvements | 31,127 | 27,192 | 39 to 45 years or lesser of useful life or remaining term of lease | |||||||||
| Furniture and equipment | 15,826 | 14,783 | 3-10 years | |||||||||
| Construction-in-progress | 1,220 | 1,880 | ||||||||||
| Total | 106,953 | 99,150 | ||||||||||
| Less: accumulated depreciation and amortization | (52,949 | ) | (48,847 | ) | ||||||||
| $ | 54,004 | $ | 50,303 |
Total depreciation was $2,267 and $2,182 for the three months ended December 31, 2011 and 2010, respectively. Total depreciation was $6,503 and $6,163 for the nine months ended December 31, 2011 and 2010, respectively. Property and equipment included $70 and $56 in capital leases at December 31, 2011 and March 31, 2011, respectively.
6. ACQUISITIONS, GOODWILL IMPAIRMENT TESTING, ACQUIRED INTANGIBLES AND ASSETS HELD FOR SALE
| 11 |
Acquisitions: The Company continually evaluates potential acquisitions that either strategically fit with the Company’s existing portfolio or expand the Company’s portfolio into new and attractive business areas. The Company has completed a number of acquisitions that have been accounted for as purchases and have resulted in the recognition of goodwill in the Company’s financial statements. This goodwill arises because the purchase prices for these businesses reflect a number of factors, including the future earnings and cash flow potential of these businesses, and other factors at which similar businesses have been purchased by other acquirers, the competitive nature of the process by which the Company acquired the business, and the complementary strategic fit and resulting synergies these businesses bring to existing operations.
Goodwill balances presented in the consolidated balance sheets of foreign acquisitions are translated at the exchange rate in effect at each balance sheet date; however, opening balance sheets used to calculate goodwill and acquired intangible assets are based on purchase date exchange rates, except for earn-out payments, which are recorded at the exchange rates in effect on the date the earn-out is accrued. The following table shows the roll forward of goodwill reflected in the financial statements for the nine months ended December 31, 2011:
| Accumulated goodwill | $ | 119,217 | ||
| Accumulated impairment losses | (3,353 | ) | ||
| Balance March 31, 2011 | 115,864 | |||
| Attributable to 2008 acquisitions | 8 | |||
| Attributable to 2011 acquisitions | 173 | |||
| Attributable to 2012 acquisitions | 30,056 | |||
| Effect of foreign currency translation | (484 | ) | ||
| Balance December 31, 2011 | $ | 145,617 |
The following briefly describes the Company’s acquisitions since March 31, 2010 forward and any acquisition for which purchase price allocation remains preliminary or subject to earn-out contingencies, as well as the Intersema acquisition with related notes payable information.
Visyx: Effective November 20, 2007, the Company acquired certain assets of Visyx Technologies, Inc. (Visyx”) based in Sunnyvale, California for $1,624 ($1,400 at close, $100 held-back to cover certain expenses, and $124 in acquisition costs). The Seller has the potential to receive up to an additional $2,000 in the form of a contingent payment based on successful commercialization of specified sensors prior to December 31, 2011, and an additional $9,000 earn-out based on a percentage of sales through calendar year 2011, of which $4,000 remains available through December 31, 2011. In December 2010, the Company paid $2,000 in connection with the earn-out related to the successful commercialization of certain sensors, which was recorded as additional purchase price. Through December 31, 2011, approximately $121 of the sales based earn-out had been recorded as additional purchase price. Visyx has a range of sensors that measure fluid properties, including density, viscosity and dielectric constant, for use in heavy truck/off road engines and transmissions, compressors/turbines, refrigeration and air conditioning.
Intersema: Effective December 28, 2007, the Company completed the acquisition of all of the capital stock of Intersema Microsystems S.A. (“Intersema”), a sensor company headquartered in Bevaix, Switzerland, for $40,160 ($31,249 in cash at closing, $8,708 in unsecured Promissory Notes (“Intersema Notes”), and $203 in acquisition costs). The Intersema Notes bear interest of 4.5% per annum and are payable in four equal annual installments on January 15 of each year. The selling shareholders had the potential to receive up to an additional 20,000 Swiss francs or approximately $18,946 (based on December 31, 2008 exchange rates) tied to calendar 2009 earnings growth objectives. The established conditions of the contingencies were not met, and no amounts were recorded as an additional element of the cost of the acquisition. Intersema is a designer and manufacturer of pressure sensors and modules with low pressure, harsh media and ultra-small package configurations for use in barometric and sub-sea depth measurement markets. The transaction was financed with borrowings under the Company’s previous amended credit facility.
| 12 |
Pressure Systems, Inc.: On September 8, 2010, the Company acquired all of the capital stock of Pressure Systems, Inc. (“PSI”), a sensor company based in Hampton, Virginia, for $25,037 ($25,000 in cash at close and approximately $37 paid after closing). PSI is a global leader in pressure sensing instrumentation for the aerospace industry and for water monitoring within operational and resource management applications. The water monitoring industry is large and a significant growth opportunity for the Company. Additionally, the Company achieved cost synergies with the PSI business combination mainly through the consolidation of operations due to the close proximity of the acquisition to the Company’s existing Hampton facility. The transaction was funded from a combination of available cash on hand and borrowings under the Company’s Senior Secured Credit Facility. PSI had annual aggregate sales of approximately $18,000 based on its most recently completed fiscal year ended October 31, 2009. From the acquisition date to December 31, 2010, approximately $7,190 of sales and approximately $745 of net income are included in the Company’s condensed consolidated financial statements, as well as $176 in transaction related costs. The Company’s final purchase price allocation related to the PSI acquisition is as follows:
| Assets: | ||||
| Accounts receivable | $ | 2,290 | ||
| Inventory | 2,017 | |||
| Prepaid and other | 88 | |||
| Property and equipment | 2,808 | |||
| Other | 59 | |||
| Acquired intangible assets | 8,770 | |||
| Goodwill | 13,748 | |||
| 29,780 | ||||
| Liabilities: | ||||
| Accounts payable | (737 | ) | ||
| Accrued expenses and other liabilities | (630 | ) | ||
| Deferred income taxes | (3,376 | ) | ||
| (4,743 | ) | |||
| Total Purchase Price | $ | 25,037 |
Eureka: On July 8, 2011, the Company acquired certain assets of Eureka Environmental, Inc. (“Eureka”), a sensor company based in Austin, Texas, for $2,250. The sellers have the potential to receive additional amounts in the form of a contingent payment based on certain earnings thresholds through calendar 2013, for which the Company has recorded as part of purchase price the fair value estimate of $2,100. Acquisition earn-out contingency is discounted at an industry specific weighted average cost of capital adjusted for, among other factors, time and risk. The estimate for this earn-out is based on certain assumptions and actual amounts could differ significantly and changes to this estimate will be recorded to earnings in future periods. Eureka manufactures a range of multi-probe pressure sensors mainly used for monitoring water quality. The water monitoring industry is large and a significant growth opportunity for the Company. The transaction was funded from available cash on hand. Eureka had annual aggregate sales of approximately $2,000 based on its most recently completed fiscal year. For the three and nine months ended December 31, 2011, approximately $290 and $696 of net sales and approximately $108 and $144 of net losses related to Eureka are included in the Company’s condensed consolidated financial statements, and transaction-related costs of approximately $97 were recorded as a component of selling, general and administrative expenses. The Company’s preliminary purchase price allocation related to the Eureka acquisition is as follows:
| Assets: | ||||
| Inventory | $ | 183 | ||
| Prepaid and other | 41 | |||
| Property and equipment | 27 | |||
| Acquired intangible assets | 722 | |||
| Goodwill | 3,393 | |||
| 4,366 | ||||
| Liabilities: | ||||
| Accrued expenses | (16 | ) | ||
| Accrued Earn-out Contingency | (2,100 | ) | ||
| (2,116 | ) | |||
| Cash Paid | 2,250 | |||
| Accrued Earn-out Contingency | 2,100 | |||
| Total Purchase Price | $ | 4,350 | ||
| 13 |
Celesco: On September 30, 2011, the Company completed the acquisition of all of the capital stock of Transducer Controls Corporation, a sensor company doing business as Celesco (“Celesco”) based in Chatsworth, California, for $37,375, including an estimated $2,375 in acquired cash. The purchase price is subject to additional consideration adjustments based on final calculations of established working capital levels. Celesco is a leading supplier to OEMs of a range of position sensors, including short and long stroke string pot, linear potentiometer and rotary sensors. The transaction was funded from borrowings under the Company’s Senior Secured Credit Facility, as defined in Note 8 below. Celesco had annual aggregate sales of approximately $14,000 based on its most recently completed fiscal year. The Company has recorded transaction-related costs of approximately $258 as a component of selling, general and administrative expenses. For the three months ended December 31, 2011, $4,110 in net sales and $492 in net income from Celesco are included in the Company’s condensed consolidated financial statements. The Company’s preliminary purchase price allocation related to the Celesco acquisition is as follows:
| Assets: | ||||
| Cash | $ | 4,618 | ||
| Accounts receivable | 2,338 | |||
| Inventory | 1,842 | |||
| Prepaid and other | 668 | |||
| Property and equipment | 75 | |||
| Other | 29 | |||
| Acquired intangible assets | 18,660 | |||
| Goodwill | 21,436 | |||
| 49,666 | ||||
| Liabilities: | ||||
| Accounts payable | (701 | ) | ||
| Accrued expenses and other liabilities | (1,856 | ) | ||
| Income taxes payable | (2,255 | ) | ||
| Deferred income taxes | (7,479 | ) | ||
| (12,291 | ) | |||
| Total Purchase Price | $ | 37,375 |
The opening balance sheet for Celesco includes acquired cash of approximately $2,375, as well as $2,243 of cash and seller transaction related obligations for certain post-close payments.
Gentech: On October 31, 2011, the Company completed the acquisition of all of the capital stock of Timesquest Limited, a holding company and the sole shareholder of Gentech International Limited (“Gentech”), for £6,500 or approximately $10,200, net of cash acquired, based on foreign currency exchange rates at the date of the acquisition. Gentech is a level sensor and non-contact level switch company based in Ayrshire, Scotland. The seller can earn up to an additional £1,500 or approximately $2,400 if certain sales performance goals for the two year period ending calendar 2013 are achieved, for which the Company has recorded as part of purchase price a preliminary fair value estimate of £1,196 or approximately $1,930 based on exchange rates at the date of acquisition. Acquisition earn-out contingencies are discounted at an industry specific weighted average cost of capital adjusted for, among other factors, time and risk. The estimate for this earn-out is based on certain assumptions and actual amounts could differ significantly and changes to this estimate once finalized within the permitted measurement period will be recorded to earnings in future periods. Gentech is a leading supplier to OEMs of a range of level and position sensors, as well as reed switch technology, including level sensors used in SCR (urea) tanks. Gentech is expected to allow the Company to compete in the urea tank market with combined level and quality sensors. The transaction was funded from borrowings under the Company’s Senior Secured Credit Facility. The Company has recorded transaction-related costs of approximately $308 as a component of selling, general and administrative expenses. For the three months ended December 31, 2011, $2,459 in net sales and $93 in net loss from Gentech are included in the Company’s condensed consolidated financial statements. Gentech had annual aggregate sales of approximately £5,000 or approximately $8,000 for the year ended December 31, 2010. The Company’s preliminary purchase price allocation related to the Gentech acquisition is as follows:
| 14 |
| Assets: | ||||
| Cash | $ | 1,328 | ||
| Accounts receivable | 2,591 | |||
| Inventory | 1,164 | |||
| Prepaid and other | 122 | |||
| Property and equipment | 299 | |||
| Other | — | |||
| Acquired intangible assets | 7,081 | |||
| Goodwill | 5,227 | |||
| 17,812 | ||||
| Liabilities: | ||||
| Accounts payable | (1,191 | ) | ||
| Accrued expenses and other liabilities | (2,949 | ) | ||
| Income taxes payable | — | |||
| Deferred income taxes | (1,876 | ) | ||
| (6,016 | ) | |||
| Cash paid | 11,796 | |||
| Accrued Earn-out Contingency | 1,930 | |||
| Total Purchase Price | $ | 13,726 | ||
Assets held for sale: The Company completed the consolidation of the former PSI facility into the existing MEAS Hampton facility. Since May 2011, the PSI facility was no longer utilized for manufacturing and is held for sale. Accordingly, the former PSI facility is classified as an asset held for sale in the condensed consolidated balance sheet, since it meets the held for sale criteria under the applicable accounting guidelines. The carrying value of the former PSI facility of $1,829, of which $635 represents land value, approximates fair value less cost to sell.
Acquired intangible assets: In connection with all acquisitions, the Company acquired certain identifiable intangible assets, including customer relationships, proprietary technology, patents, trade-names, order backlogs and covenants-not-to-compete. Additionally, the Company has purchased certain identifiable intangible assets as asset acquisitions.
Sentelligence: On August 31, 2011, the Company acquired a license to certain intellectual property rights related to fluid property sensors utilizing optical spectral technology for $1,717 through a 10 year license agreement with Sentelligence, Inc. The Company recorded the $1,717 payment as an acquired intangible asset subject to amortization over the life of the license agreement. Additionally, the license agreement includes annual royalty payments based on a percentage of net sales with certain annual minimum royalty requirements to maintain exclusive rights under the license agreement. As part of the cost of the intellectual property, the Company recorded $617 for the present value of the minimum royalty liability.
The gross amounts and accumulated amortization, along with the range of amortizable lives, are as follows:
| December 31, 2011 | March 31, 2011 | |||||||||||||||||||||||||||
| Weighted-Average Life in years | Gross Amount | Accumulated Amortization | Net | Gross Amount | Accumulated Amortization | Net | ||||||||||||||||||||||
| Amortizable intangible assets: | ||||||||||||||||||||||||||||
| Customer relationships | 8 | $ | 57,480 | $ | (19,729 | ) | $ | 37,751 | $ | 36,333 | $ | (16,977 | ) | $ | 19,356 | |||||||||||||
| Patents | 15 | 3,966 | (1,684 | ) | 2,282 | 4,179 | (1,585 | ) | 2,594 | |||||||||||||||||||
| Tradenames | 2 | 2,497 | (2,308 | ) | 189 | 2,356 | (2,294 | ) | 62 | |||||||||||||||||||
| In-process research & development | Indefinite | 230 | — | 230 | 230 | — | 230 | |||||||||||||||||||||
| Backlog | 1 | 4,835 | (4,157 | ) | 678 | 3,506 | (3,506 | ) | — | |||||||||||||||||||
| Covenants-not-to-compete | 3 | 1,197 | (1,055 | ) | 142 | 1,116 | (1,035 | ) | 81 | |||||||||||||||||||
| Proprietary technology | 12 | 12,251 | (2,731 | ) | 9,520 | 8,522 | (2,189 | ) | 6,333 | |||||||||||||||||||
| $ | 82,456 | $ | (31,664 | ) | $ | 50,792 | $ | 56,242 | $ | (27,586 | ) | $ | 28,656 | |||||||||||||||
| 15 |
Amortization expense for acquired intangible assets for the three months ended December 31, 2011 and 2010 was $2,501 and $1,832, respectively and amortization expense for the nine months ended December 31, 2011 and 2010 was $5,176 and $4,269, respectively. Annual amortization expense for the years ending December 31 is estimated as follows:
| Amortization | ||||
| Year | Expense | |||
| 2012 | $ | 7,364 | ||
| 2013 | 5,709 | |||
| 2014 | 5,459 | |||
| 2015 | 5,398 | |||
| 2016 | 5,073 | |||
| Thereafter | 21,789 | |||
| $ | 50,792 | |||
Pro forma Financial Data (Unaudited): The following represents the Company’s pro forma consolidated income from continuing operations, net of income taxes, for the three and nine months ended December 31, 2011 and 2010, based on purchase accounting information assuming the PSI, Eureka, Celesco and Gentech acquisitions occurred as of April 1, 2010, giving effect to purchase accounting adjustments. The pro forma data is for informational purposes only and may not necessarily reflect results of operations had the acquired company been operated as part of the Company since April 1, 2010.
| Three months ended December 31, | Nine months ended December 31, | |||||||||||||||
| 2011 | 2010 | 2011 | 2010 | |||||||||||||
| Net sales | $ | 77,282 | $ | 77,069 | $ | 240,542 | $ | 223,483 | ||||||||
| Net income | $ | 4,763 | $ | 8,109 | $ | 21,740 | $ | 20,294 | ||||||||
| Net income per share: | ||||||||||||||||
| Basic | $ | 0.32 | $ | 0.55 | $ | 1.44 | $ | 1.39 | ||||||||
| Diluted | $ | 0.30 | $ | 0.52 | $ | 1.37 | $ | 1.33 | ||||||||
7. FINANCIAL INSTRUMENTS:
Fair value of financial instruments: Fair value is an exit price, representing the amount that would be received to sell an asset or paid to transfer a liability in an orderly transaction between market participants. As such, fair value is a market-based measurement that should be determined based on assumptions that market participants would use in pricing an asset and liability. As a basis for considering such assumptions, the principles establish a fair value hierarchy that prioritizes the inputs used to measure fair value. The hierarchy gives the highest priority to unadjusted quoted prices in active markets for identical assets or liabilities (level 1 measurements) and the lowest priority to unobservable inputs (level 3 measurements). The three levels of the fair value hierarchy are as follows:
Level 1 - Quoted prices in active markets for identical assets or liabilities;
Level 2 - Quoted prices for similar instruments in active markets; quoted prices for identical or similar instruments in markets that are not active; and
Level 3 - Unobservable inputs in which there is little or no market data which require the reporting entity to develop its own assumptions.
Foreign currency contracts are recorded at fair value. Financial assets and liabilities are classified in their entirety based on the lowest level of input that is significant to the fair value measurement. The Company's assessment of the significance of a particular input to the fair value measurement requires judgment, and may affect the valuation of fair value of assets and liabilities and their placement within the fair value hierarchy levels. The fair value of the Company’s cash and cash equivalents was determined using Level 1 measurements in the fair value hierarchy. The fair value of the Company’s foreign currency contracts was based on Level 2 measurements in the fair value hierarchy. The fair value of the foreign currency contracts is based on forward exchange rates relative to current exchange rates which were obtained from independent financial institutions reflecting market quotes.
| 16 |
The following methods and assumptions were used to estimate the fair value of each class of financial instruments:
For cash and cash equivalents, accounts receivable, other receivables, prepaid and other assets (current), accounts payable, and accrued expenses and other liabilities (non-derivatives), the carrying amounts approximate fair value because of the short maturity of these instruments. Assets held for sale, which is the former PSI facility, approximate fair value less cost to sell. The fair value of the asset held for sale is based on management’s best estimates using various valuation considerations, including sale comparison approach for similar assets. Non-current other assets consist of various miscellaneous items such as deposits and deferred costs and non-current other liabilities consist mostly of deferred rent. Acquisition earn-out contingencies are recorded at fair value based on a valuation report, which is considered a Level 3 measurement. Deferred financing costs, deposits and deferred rent are by their nature recorded at their historical cost. Investment in unconsolidated joint venture is not recorded at fair value, but accounted for under the equity method.
For promissory notes payable, capital lease obligations, deferred acquisition payments and such other non-current liabilities, the fair value is determined as the present value of expected future cash flows discounted at the current interest rate, which approximates rates currently offered by lending institutions for loans of similar terms to companies with comparable credit risk. These are considered Level 2 inputs.
The fair value of the revolver approximates carrying value due to the variable interest nature of the debt. For long-term debt, the fair value of the Company’s long-term debt is estimated by discounting future cash flows of each instrument at current rates, which approximately rates currently offered to the Company for similar debt instruments of comparable maturities by the Company’s lenders. These are considered Level 2 inputs.
Derivative instruments and risk management: The Company is exposed to market risks from changes in interest rates, commodities, credit and foreign currency exchange rates, which could impact its results of operations and financial condition. The Company attempts to address its exposure to these risks through its normal operating and financing activities. In addition, the Company’s relatively broad-based business activities help to reduce the impact that volatility in any particular area or related areas may have on its operating results as a whole.
Interest Rate Risk: Under our term and revolving credit facilities, we are exposed to a certain level of interest rate risk. Interest on the principal amount of our borrowings under our revolving credit facility is variable and accrues at a rate based on either a LIBOR rate plus a LIBOR margin or at an Indexed (prime based) Rate plus an Index Margin. The LIBOR or Index Rate is at our election. With our revolving credit facility, our results will be adversely affected by an increase in interest rates. Interest on the principal amounts of our borrowings under our term loans accrue at fixed rates. If interest rates decline, the Company would not be able to benefit from the lower rates on our long-term debt. We do not currently hedge these interest rate exposures.
Commodity Risk: The Company uses a wide range of commodities in its products, including steel, non-ferrous metals and petroleum based products, as well as other commodities required for the manufacture of its sensor products. Changes in the pricing of commodities directly affect its results of operations and financial condition. The Company attempts to address increases in commodity costs through cost control measures or pass these added costs to its customers, and the Company does not currently hedge such commodity exposures.
Credit Risk: Financial instruments that potentially subject the Company to significant concentrations of credit risk consist of cash and temporary investments, foreign currency forward contracts when in an asset position and trade accounts receivable. The Company is exposed to credit losses in the event of nonperformance by counter parties to its financial instruments. The Company places cash and temporary investments with various high-quality financial institutions throughout the world. Although the Company does not obtain collateral or other security to secure these obligations, it does periodically monitor the third-party depository institutions that hold our cash and cash equivalents. Our emphasis is primarily on safety and liquidity of principal and secondarily on maximizing yield on those funds. In addition, concentrations of credit risk arising from trade accounts receivable are limited due to the diversity of the Company’s customers. The Company performs ongoing credit evaluations of its customers’ financial conditions and the Company does not generally obtain collateral, credit insurance or other security. Notwithstanding these efforts, the current distress in the global economy may increase the difficulty in collecting accounts receivable.
| 17 |
Foreign Currency Exchange Rate Risk: Foreign currency exchange rate risk arises from the Company’s investments in subsidiaries owned and operated in foreign countries, as well as from transactions with customers in countries outside the U.S. and transactions denominated in currencies other than the applicable functional currency.
The effect of a change in currency exchange rates on the Company’s net investment in international subsidiaries is reflected in the “accumulated other comprehensive income” component of shareholders’ equity. The Company does not hedge the Company’s net investment in subsidiaries owned and operated in countries outside the U.S.
Although the Company has a U.S. dollar functional currency for reporting purposes, it has manufacturing and operating sites throughout the world and a large portion of its sales are generated in foreign currencies. A substantial portion of the Company’s revenue is priced in U.S. dollars, and most of its costs and expenses are priced in U.S. dollars, with the remaining priced in Chinese RMB, Euros, Swiss francs and British pounds. Sales by subsidiaries operating outside of the United States are translated into U.S. dollars using exchange rates effective during the respective period. As a result, the Company is exposed to movements in the exchange rates of various currencies against the U.S. dollar. Accordingly, the competitiveness of its products relative to products produced locally (in foreign markets) may be affected by the performance of the U.S. dollar compared with that of our foreign customers’ currencies. Refer to Note 10, Segment Information, for details concerning net sales invoiced from our facilities within the U.S. and outside of the U.S., as well as long-lived assets. Therefore, both positive and negative movements in currency exchange rates against the U.S. dollar will continue to affect the reported amount of sales, profit, and assets and liabilities in the Company’s consolidated financial statements.
During the nine months ended December 31, 2011, the RMB appreciated approximately 3.0% relative to the U.S. dollar. The RMB appreciated approximately 4% relative to the U.S. dollar during fiscal 2011, and did not appreciate during fiscal 2010. The Chinese government no longer pegs the RMB to the U.S. dollar, but established a currency policy letting the RMB trade in a narrow band against a basket of currencies. The Company has more expenses in RMB than sales (i.e., short RMB position), and as such, if the U.S. dollar weakens relative to the RMB, our operating profits will decrease. We continue to consider various alternatives to hedge this exposure, and we are attempting to manage this exposure through, among other things, forward purchase contracts, pricing and monitoring balance sheet exposures for payables and receivables.
Fluctuations in the value of the Hong Kong dollar have not been significant since October 17, 1983, when the Hong Kong government tied the value of the Hong Kong dollar to that of the U.S. dollar. However, there can be no assurance that the value of the Hong Kong dollar will continue to be tied to that of the U.S. dollar.
The Company’s French, Irish and German subsidiaries have more sales in Euros than expenses in Euros and the Company’s Swiss subsidiary has more expenses in Swiss francs than sales in Swiss francs, and as such, if the U.S. dollar weakens relative to the Euro and Swiss franc, our operating profits increase in France, Ireland and Germany, but decrease in Switzerland. The Company’s British subsidiary has more expenses in British pounds than sales in British pounds, and as such, if the U.S. dollar weakens relative to the British pound, our operating profits decrease in the United Kingdom.
The Company has a number of foreign currency exchange contracts in Asia and in the United Kingdom in an attempt to hedge the Company’s exposure to the RMB and British pound. The RMB/U.S. dollar currency contracts have notional amounts totaling $16,100, with exercise dates through March 29, 2013 at average exchange rates of $0.158 (RMB to U.S. dollar conversion rate). With the RMB/U.S. dollar contracts, for every 1% depreciation of the RMB, the Company would be exposed to approximately $161 in additional foreign currency exchange losses. The British pound/U.S. dollar currency contracts have notional amounts totaling $1,380, with exercise dates through February 2012 at average exchange rates of $1.56 (British pound to U.S. dollar conversion rate). With the British pound/U.S. dollar contracts, for every 10% depreciation of the British pound, the Company would be exposed to approximately $138 in additional foreign currency exchange losses. Since these derivatives are not designated as hedges for accounting purposes, changes in their fair value are recorded in results of operations, not in other comprehensive income. To manage our exposure to potential foreign currency transaction and translation risks, we may purchase additional foreign currency exchange forward contracts, currency options, or other derivative instruments, provided such instruments may be obtained at suitable prices.
| 18 |
Fair values of derivative instruments not designated as hedging instruments are as follows:
| December 31, | March 31, | |||||||||||
| Financial position: | 2011 | 2011 | Location | |||||||||
| Foreign currency contracts - RMB | $ | 20 | $ | 143 | Other assets (liabilities) | |||||||
| Foreign currency contracts - British pound | (1 | ) | — | Other assets (liabilities) | ||||||||
The effect of derivative instruments not designated as hedging instruments on the statements of operations and cash flows for the three and nine months ended December 31, 2011 and 2010 is as follows:
| Three months ended December 31, | Nine months ended December 31, | |||||||||||||||||||
| Results of operations: | 2011 | 2010 | 2011 | 2010 | Location | |||||||||||||||
| Foreign currency contracts - RMB | $ | 8 | $ | (123 | ) | $ | (149 | ) | $ | (307 | ) | Foreign currency exchange (gain) loss | ||||||||
| Foreign currency contracts - Euro | — | 3 | — | 22 | Foreign currency exchange (gain) loss | |||||||||||||||
| Foreign currency contracts - British pound | 1 | — | — | — | Foreign currency exchange (gain) loss | |||||||||||||||
| Total | $ | 9 | $ | (120 | ) | $ | (149 | ) | $ | (285 | ) | |||||||||
| Nine months ended December 31, | ||||||||||||
| Cash flows from operating activities: Source (Use) | 2011 | 2010 | Location | |||||||||
| Foreign currency exchange contracts - RMB | $ | 277 | $ | 112 | ||||||||
| Foreign currency exchange contracts - Euro | — | (61 | ) | Prepaid expenses, other assets (Accrued expenses, other liabilities) | ||||||||
| Foreign currency contracts - British pound | — | — | Prepaid expenses, other assets (Accrued expenses, other liabilities) | |||||||||
| Total | $ | 277 | $ | 51 | ||||||||
8. LONG-TERM DEBT:
Long-term debt and revolver: The Company entered into a Credit Agreement (the "Senior Secured Credit Facility") dated June 1, 2010, among JPMorgan Chase Bank, N.A., as administrative agent and collateral agent (in such capacity, the "Senior Secured Facility Agents"), Bank America, N.A., as syndication agent, HSBC Bank USA, N.A., as document agent, and certain other parties thereto (the "Credit Agreement") to refinance the Amended and Restated Credit Agreement effective as of April 1, 2006 among the Company, General Electric Capital Corporation (“GE”), as agent and a lender, and certain other parties thereto and to provide for the working capital needs of the Company including to effect permitted acquisitions.
The Senior Secured Credit Facility, as amended, consists of a $110,000 revolving credit facility (the "Revolving Credit Facility") with a $75,000 accordion feature enabling expansion of the Revolving Credit Facility to $185,000 and matures on November 8, 2016. The Revolving Credit Facility has a variable interest rate based on either the London Inter-bank Offered Rate ("LIBOR") or the ABR Rate (prime based rate) with applicable margins ranging from 1.25% to 2.00% for LIBOR based loans or 0.25% to 1.00% for ABR Rate loans. The applicable margins may be adjusted quarterly based on a change in the leverage ratio of the Company. The Senior Secured Credit Facility also includes the ability to borrow in currencies other than U.S. dollars, such as the Euro and Swiss Franc, up to $66,000, of which the Company utilized approximately $6,600 as of December 31, 2011. Commitment fees on the unused balance of the Revolving Credit Facility range from 0.25% to 0.375% per annum of the average amount of unused balances. The Revolving Credit Facility will expire on November 8, 2016 and all balances outstanding under the Revolving Credit Facility will be due on such date. The Company has provided a security interest in substantially all of the Company's U.S. based assets as collateral for the Senior Secured Credit Facility and private placement of credit facilities entered into by the Company from time to time not to exceed $50,000, including the Prudential Shelf Facility (as defined below). The Senior Secured Credit Facility includes an inter-creditor arrangement with Prudential and is on a pari passu (equal force) basis with the Prudential Shelf Facility.
| 19 |
The Senior Secured Credit Facility, as amended, includes specific financial covenants for maximum leverage ratio and minimum fixed charge coverage ratio, as well as customary representations, warranties, covenants and events of default for a transaction of this type. Consolidated earnings before interest, taxes, depreciation and amortization (“EBITDA”) for debt covenant purposes is the Company's consolidated net income determined in accordance with GAAP minus the sum of income tax credits, interest income, gain from extraordinary items for such period, any non-cash gains, and gains due to fluctuations in currency exchange rates, plus the sum of any provision for income taxes, interest expense, loss from extraordinary items, any aggregate net loss during such period arising from the disposition of capital assets, the amount of non-cash charges for such period, amortized debt discount for such period, losses due to fluctuations in currency exchange rates and the amount of any deduction to consolidated net income as the result of any grant to any members of the management of the Company of any equity interests. The Company's leverage ratio consists of total debt less unrestricted cash maintained in U.S. bank accounts which are subject to control agreements in favor of JPMorgan Chase Bank, N.A., as Collateral Agent, to Consolidated EBITDA. Adjusted fixed charge coverage ratio is Covenant EBITDA less capital expenditures for the last twelve months, excluding capital expenditures for the last twelve months in connection with the facilities being constructed in France in an aggregate amount of $11,000 and China in an aggregate amount of $6,000 through March 31, 2013, divided by fixed charges. Fixed charges are the last twelve months of scheduled principal payments, taxes paid in cash and consolidated interest expense. All of the aforementioned financial covenants are subject to various adjustments, many of which are detailed in the Credit Agreement.
As of December 31, 2011, the Company utilized the LIBOR based rate for $80,327 of the Revolving Credit Facility. The weighted average interest rate applicable to borrowings under the Revolving Credit Facility was approximately 1.9% at December 31, 2011. As of December 31, 2011, the outstanding borrowings on the Revolving Credit Facility, which is classified as non-current, were $80,327. The Company’s borrowing capacity is limited by financial covenant ratios, including earnings ratios, and as such, our borrowing capacity is subject to change. At December 31, 2011, the Company could have borrowed an additional $29,673 under the Revolving Credit Facility.
On June 1, 2010, the Company entered into a Master Shelf Agreement (the "Prudential Shelf Facility") with Prudential Investment Management, Inc. ("Prudential") whereby Prudential agreed to purchase up to $50,000 of senior secured notes (the "Senior Secured Notes") issued by the Company. Prudential purchased two Senior Secured Notes each for $10,000 and the remaining $30,000 of such Senior Secured Notes may be purchased at the discretion of Prudential or one or more of its affiliates upon the request of the Company. The Prudential Shelf Facility has a fixed interest rate of 5.70% and 6.15% for each of the two $10,000 Senior Secured Notes issued by the Company and the Senior Secured Notes issued thereunder are due on June 1, 2015 and 2017, respectively. The Prudential Shelf Facility includes specific financial covenants for maximum total leverage ratio and minimum fixed charge coverage ratio consistent with the Senior Secured Credit Facility, as well as customary representations, warranties, covenants and events of default. The Prudential Shelf Facility includes an inter-creditor arrangement with the Senior Secured Facility Agents and is on a pari passu (equal force) basis with the Senior Secured Facility.
The Company was in compliance with financial covenants at December 31, 2011.
Deferred financing costs: Amortization of deferred financing costs totaled $79 and $92 for the three months ended December 31, 2011 and 2010, respectively, and amortization of deferred financing costs totaled $269 and $911 for the nine months ended December 31, 2011 and 2010, respectively. Approximately $585 of the deferred financing costs for the nine months ended December 31, 2010 related to the write-off of the deferred financing costs associated with the previous credit facility. Annual amortization expense of deferred financing costs associated with the refinancing is estimated to be approximately $280.
| 20 |
Chinese credit facility: On November 3, 2009, the Company’s subsidiary in China (“MEAS China”) entered into a two year credit facility agreement (the “China Credit Facility”) with China Merchants Bank Co., Ltd (“CMB”). On December 23, 2011, MEAS China renewed the China Credit Facility and extended the expiration to November 25, 2013. The China Credit Facility permits MEAS China to borrow up to RMB 68,000 (approximately $10,800). Specific covenants include customary limitations, compliance with laws and regulations, use of proceeds for operational purposes, and timely payment of interest and principal. MEAS China has pledged its Shenzhen facility to CMB as collateral. The interest rate will be based on the London Inter-bank Offered Rate (“LIBOR”) plus a LIBOR spread, depending on the term of the loan when drawn. The purpose of the China Credit Facility is primarily to provide additional flexibility in funding operations of MEAS China. At December 31, 2011, MEAS China had not borrowed any amounts under the China Credit Facility.
European credit facility: On July 21, 2010, the Company’s subsidiary in France (“MEAS Europe”) entered into a five year credit facility agreement (the “European Credit Facility”) with La Societe Bordelaise de Credit Industriel et Commercial (“CIC”). The European Credit Facility permits MEAS Europe to borrow up to €2,000 (approximately $2,800). Specific covenants include certain financial covenants for maximum leverage ratio and net debt to equity ratio, as well as customary limitations, compliance with laws and regulations, use of proceeds, and timely payment of interest and principal. MEAS Europe has pledged its Les Clayes-sous-Bois, France facility to CIC as collateral. The interest rate is based on the EURIBOR Offered Rate (“EURIBOR”) plus a spread of 1.8%. The EURIBOR interest rate will vary depending on the term of the loan when drawn. The purpose of the European Credit Facility is primarily to provide additional flexibility in funding operations of MEAS Europe. At December 31, 2011, there were no amounts borrowed against the European Credit Facility and MEAS Europe could borrow €2,000.
Promissory notes: In connection with the acquisition of Intersema Microsystems SA (“Intersema”), the Company issued 10,000 Swiss franc unsecured promissory notes (the “Intersema Notes”). At December 31, 2011, the Intersema Notes totaled $2,660 all of which was classified as current. The Intersema Notes are payable in four equal annual installments through January 15, 2012, and bear an interest rate of 4.5% per year. The Intersema Notes were paid in full in January 2012.
Long-term debt and promissory notes: Below is a summary of the long-term debt and promissory notes outstanding at December 31, 2011 and March 31, 2011:
| December 31, | March 31, | |||||||
| 2011 | 2011 | |||||||
| Term notes at 5.70% due in full on June 1, 2015 | $ | 10,000 | $ | 10,000 | ||||
| Term notes at 6.15% due in full on June 1, 2017 | 10,000 | 10,000 | ||||||
| Five year term-loan at prime or LIBOR plus 4.50% or 3.00% | — | — | ||||||
| Governmental loans from French agencies at no interest and payable based on R&D expenditures | 855 | 1,008 | ||||||
| Term credit facility with six French banks at an interest rate of 4% | — | 64 | ||||||
| 20,855 | 21,072 | |||||||
| Less current portion of long-term debt | 133 | 171 | ||||||
| $ | 20,722 | $ | 20,901 | |||||
| 4.5% promissory note payable in four equal annual installments through January 15, 2012 | $ | 2,660 | $ | 2,713 | ||||
| Less current portion of promissory notes payable | 2,660 | 2,713 | ||||||
| $ | — | $ | — | |||||
The annual principal payments of long-term debt, promissory notes and revolver as of December 31, 2011 are as follows:
| 21 |
| Year ended December 31, | Term | Other | Subtotal | Notes | Revolver | Total | ||||||||||||||||||
| 2012 | $ | — | $ | 133 | $ | 133 | $ | 2,660 | $ | — | $ | 2,793 | ||||||||||||
| 2013 | — | 194 | 194 | — | — | 194 | ||||||||||||||||||
| 2014 | — | 130 | 130 | — | — | 130 | ||||||||||||||||||
| 2015 | 10,000 | 398 | 10,398 | — | — | 10,398 | ||||||||||||||||||
| 2016 | — | — | — | — | 80,327 | 80,327 | ||||||||||||||||||
| Thereafter | 10,000 | — | 10,000 | — | — | 10,000 | ||||||||||||||||||
| Total | $ | 20,000 | $ | 855 | $ | 20,855 | $ | 2,660 | $ | 80,327 | $ | 103,842 | ||||||||||||
9. COMMITMENTS AND CONTINGENCIES:
Litigation:
Pending Legal Matters
There are currently no material pending legal proceedings. From time to time, the Company is subject to legal proceedings and claims in the ordinary course of business. The Company currently is not aware of any such legal proceedings or claims that the Company believes will have, individually or in the aggregate, a material adverse effect on the Company’s business, financial condition, or operating results.
Contingency: Exports of technology necessary to develop and manufacture certain of the Company’s products are subject to U.S. export control laws and similar laws of other jurisdictions, and the Company may be subject to adverse regulatory consequences, including government oversight of facilities and export transactions, monetary penalties and other sanctions for violations of these laws. All exports of technology necessary to develop and manufacture the Company’s products are subject to U.S. export control laws. In certain instances, these regulations may prohibit the Company from developing or manufacturing certain of its products for specific end applications outside the United States. In late May 2009, the Company became aware that certain of its piezo products when designed or modified for use with or incorporation into a defense article are subject the International Traffic in Arms Regulations ("ITAR") administered by the United States Department of State. Certain technical data relating to the design of the products may have been exported to China without authorization from the U.S. Department of State. As required by the ITAR, the Company conducted a thorough investigation into the matter. Based on the investigation, the Company filed in December 2009 a final voluntary disclosure with the U.S. Department of State relating to that matter, as well as to exports and re-exports of other ITAR-controlled technical data and/or products to Canada, India, Ireland, France, Germany, Italy, Israel, Japan, the Netherlands, South Korea, Spain and the United Kingdom, which disclosure has since been supplemented. In the course of the investigation, the Company also became aware that certain of its products may have been exported from France without authorization from the relevant French authorities. The Company investigated this matter thoroughly. In December 2009, it also voluntarily submitted to French customs authorities a list of products that may have required prior export authorization, which has since been supplemented to exclude certain products. In addition, the Company has taken steps to mitigate the impact of potential violations, and we are in the process of strengthening our export-related controls and procedures. The U.S. Department of State and other regulatory authorities encourage voluntary disclosures and generally afford parties mitigating credit for submitting such voluntary disclosures. The Company nevertheless could be subject to potential regulatory consequences related to these possible violations ranging from a no-action letter, government oversight of facilities and export transactions, monetary penalties, and in extreme cases, debarment from government contracting, denial of export privileges and/or criminal penalties. It is not possible at this time to predict the precise timing or probable outcome of any potential regulatory consequences related to these possible violations. Moreover, due to the unpredictable nature of the probable outcome of these voluntary proceedings, the Company cannot make a reasonable estimate of the possible loss or range of losses at this time. The Company has incurred during fiscal 2012 and cumulatively approximately $6 and $572, respectively, in legal fees associated with the ITAR matters.
| 22 |
Acquisition Earn-Outs and Contingent Payments: At December 31, 2011, the Company has a sales performance based earn-out totaling $4,000 in connection with the Visyx acquisition, of which approximately $121 has been recorded as additional purchase price since this portion of the established criteria is determinable and has been met. The Company has an earnings based earn-out in connection with the Eureka acquisition, for which the Company has recorded an estimated fair value of $2,100. The Company has a sales based earn-out in connection with the Gentech acquisition, for which the Company has recorded a preliminary fair value estimate of £1,196 or approximately $1,930 based on exchange rates at the date of acquisition. The estimates for the Eureka and Gentech earn-outs are based on certain assumptions and actual amounts could differ significantly and changes to these estimates once finalized within the measurement period will be recorded to earnings in future periods.
10. SEGMENT INFORMATION:
The Company continues to have one reporting segment, a sensor business, under applicable accounting guidelines for segment reporting. For a description of the products and services of the Sensor business, see Note 1. Management continually assesses the Company’s operating structure, and this structure could be modified further based on future circumstances and business conditions.
Geographic information for revenues based on country from which invoiced and long-lived assets based on country of location, which includes property, plant and equipment, but excludes intangible assets and goodwill, net of related depreciation and amortization follows:
| Three months ended December 31, | Nine months ended December 31, | |||||||||||||||
| 2011 | 2010 | 2011 | 2010 | |||||||||||||
| Net Sales: | ||||||||||||||||
| United States | $ | 26,734 | $ | 27,307 | $ | 79,699 | $ | 72,159 | ||||||||
| France | 13,023 | 11,226 | 39,606 | 31,514 | ||||||||||||
| Germany | 4,246 | 5,062 | 15,242 | 12,941 | ||||||||||||
| Ireland | 6,219 | 7,180 | 21,581 | 22,857 | ||||||||||||
| Switzerland | 4,971 | 4,356 | 13,420 | 11,270 | ||||||||||||
| Scotland | 2,459 | — | 2,459 | — | ||||||||||||
| China | 18,689 | 16,556 | 54,761 | 47,281 | ||||||||||||
| Total: | $ | 76,341 | $ | 71,687 | $ | 226,768 | $ | 198,022 | ||||||||
| December 31, | March 31, | |||||||||||||||
| 2011 | 2011 | |||||||||||||||
| Long Lived Assets: | ||||||||||||||||
| United States | $ | 7,284 | $ | 9,079 | ||||||||||||
| France | 13,247 | 9,086 | ||||||||||||||
| Germany | 3,021 | 3,540 | ||||||||||||||
| Ireland | 3,115 | 3,310 | ||||||||||||||
| Switzerland | 2,164 | 2,290 | ||||||||||||||
| Scotland | 277 | — | ||||||||||||||
| China | 24,896 | 22,998 | ||||||||||||||
| Total: | $ | 54,004 | $ | 50,303 | ||||||||||||
At December 31, 2011, approximately $6,514 of the Company’s cash is maintained in China, which is subject to certain restrictions on the transfer to another country because of currency control regulations.
ITEM 2. MANAGEMENT’S DISCUSSION AND ANALYSIS OF FINANCIAL CONDITION AND RESULTS OF OPERATIONS
(Amounts in thousands, except per share data)
Information Relating To Forward-Looking Statements
| 23 |
This report includes forward-looking statements within the meaning of Section 21E of the Securities Exchange Act of 1934, as amended. Certain information included or incorporated by reference in this Quarterly Report, in press releases, written statements or other documents filed with or furnished to the Securities and Exchange Commission (“SEC”), or in our communications and discussions through webcasts, phone calls, conference calls and other presentations and meetings, may be deemed to be “forward-looking statements” within the meaning of the federal securities laws. All statements other than statements of historical fact are statements that could be deemed forward-looking statements, including statements regarding: projections of revenue, margins, expenses, tax provisions (or tax benefits), earnings or losses from operations, cash flows, synergies or other financial items; plans, strategies and objectives of management for future operations, including statements relating to potential acquisitions, executive compensation and purchase commitments; developments, performance or industry or market rankings relating to products or services; future economic conditions or performance; future compliance with debt covenants; the outcome of outstanding claims or legal proceedings; assumptions underlying any of the foregoing; and any other statements that address activities, events or developments that Measurement Specialties, Inc. (“MEAS,” the “Company,” “we,” “us,” “our”) intends, expects, projects, believes or anticipates will or may occur in the future. Forward-looking statements may be characterized by terminology such as “forecast,” “believe,” “anticipate,” “should,” “would,” “intend,” “plan,” “will,” “expects,” “estimates,” “projects,” “positioned,” “strategy,” and similar expressions. These statements are based on assumptions and assessments made by our management in light of their experience and perception of historical trends, current conditions, expected future developments and other factors they believe to be appropriate.
Any such forward-looking statements are not guarantees of future performance and involve a number of risks and uncertainties, many of which are beyond our control. Actual results, developments and business decisions may differ materially from those envisaged by such forward-looking statements. These forward-looking statements speak only as of the date of the report, press release, statement, document, webcast or oral discussion in which they are made. Factors that might cause actual results to differ materially from the expected results described in or underlying our forward-looking statements include:
| · | Conditions in the general economy, including risks associated with the current financial markets and worldwide economic conditions and demand for products that incorporate our products; |
| · | Competitive factors, such as price pressures and the potential emergence of rival technologies; |
| · | Compliance with export control laws and regulations; |
| · | Fluctuations in foreign currency exchange and interest rates; |
| · | Interruptions in supply chain, distribution systems, suppliers’ operations or the refusal of our suppliers to provide us or our customers with component materials, particularly in light of the current economic conditions, natural or man-made disasters and potential for suppliers to fail; |
| · | Timely development, market acceptance and warranty performance of new products; |
| · | Changes in product mix, costs and yields; |
| · | Uncertainties related to doing business in Europe and China; |
| · | Legislative initiatives, including tax legislation and other changes in the Company’s tax position; |
| · | Legal proceedings; |
| · | Product liability, warranty and recall claims; |
| · | Compliance with debt covenants, including events beyond our control; |
| 24 |
| · | Conditions in the credit markets, including our ability to raise additional funds; |
| · |
Adverse developments in the housing industry and other markets served by us; |
| · |
Changes in estimated fair value of acquisition earn-out contingencies due to changes in assumptions and expected results of applicable financial criteria; and |
| · | The risk factors listed from time to time in the reports we file with the SEC, including those described under “Item 1A. Risk Factors” in the Annual Report on Form 10-K. |
This list is not exhaustive. Except as required under federal securities laws and the rules and regulations promulgated by the SEC, we do not intend to update publicly any forward-looking statements after the filing of this Quarterly Report on Form 10-Q, whether as a result of new information, future events, changes in assumptions or otherwise.
Overview
Measurement Specialties, Inc. is a global leader in the design, development and manufacture of sensors and sensor-based systems for original equipment manufacturers and end users. Our products are based on a broad portfolio of proprietary technology and typically sold under the MEAS brand name. We are a global business and we believe we have a relatively high degree of diversity when considering our geographic reach, our broad range of products, number of end-use markets and breadth of customer base. The Company is a multi-national corporation with fourteen primary manufacturing facilities strategically located in the United States, China, France, Ireland, Germany, Switzerland and Scotland, enabling the Company to produce and market world-wide a broad range of sensors that use advanced technologies to measure precise ranges of physical characteristics. These sensors are used for engine and vehicles, including automotive, off-road and heavy truck, medical, consumer, military/aerospace, industrial and test and measurement applications. The Company’s sensor products include pressure sensors and transducers, pressure and temperature scanning instrumentation, linear/rotary position sensors, piezoelectric polymer film sensors, custom microstructures, load cells, accelerometers, optical sensors, humidity, temperature, fluid property sensors and hydrostatic pressure transducers. The Company's advanced technologies include piezo-resistive silicon sensors, application-specific integrated circuits, micro-electromechanical systems, piezoelectric polymers, foil strain gauges, force balance systems, fluid capacitive devices, linear and rotational variable differential transformers, electromagnetic displacement sensors, hygroscopic capacitive sensors, ultrasonic sensors, optical sensors, negative thermal coefficient ceramic sensors, torque sensors, mechanical resonators, reed-switch and submersible hydrostatic level sensors. We compete in growing global market segments driven by demand for products that are smarter, safer, more energy-efficient, and environmentally-friendly. We deliver a strong value proposition to our customers through our willingness to customize sensor solutions, leveraging our innovative portfolio of core technologies and exploiting our low-cost manufacturing model based on our 16-year presence in China.
Executive Summary
Our vision is to be the supplier of choice to OEMs and select end-users for all their physical sensing needs. To that end, MEAS continues to expand our market position as a leading global sensor supplier. Our sales growth exceeds overall market increases, as supported by our seven year fiscal Compounded Annual Growth Rate (“CAGR”) in excess of 19%. The Company’s strong recovery since fiscal 2010 reflects the positive returns from our significant investments in research and development for new programs and the $249,500 invested in our 18 acquisitions since June 2004, expanding our product offering and geographic reach.
The Company remains focused on creating long-term shareholder value through continued development of innovative technologies and strengthening our market position by expanding customer relationships. To accomplish this goal, we continue to take measures we believe will result in sales performance in excess of the overall market and generation of positive earnings before interest, tax, depreciation and amortization (“EBITDA”). A core tenant of our long-term strategy to increase profitability is to grow the size and scale of the Company in order to improve our leverage of SG&A expenses. Accordingly, our goal is to target a 20% EBITDA Margin (EBITDA as a percent of Net Sales). We have implemented aggressive actions that position the Company for future growth in sales and profitability, all of which we ultimately expect to translate to enhanced shareholder value. We believe we currently have one of the strongest product development pipelines in the history of the Company, which we expect to lay the foundation for future sales growth. Research and development will continue to play a key role in our efforts to maintain product innovations for new sales and to improve profitability. Our broad range of products and geographic diversity provide the Company with a variety of opportunities to leverage technology, products, manufacturing base and our financial performance.
| 25 |
The Company made three acquisitions during the nine months ended December 31, 2011. On July 8, 2011, the Company purchased the assets of Eureka Environmental, a multi-probe sensor for monitoring water quality. On September 30, 2011, the Company purchased the stock of Transducer Controls Corporation, also known as Celesco, a manufacturer of a range of position sensors, including short and long stroke “string pot,” linear potentiometer and rotary sensors. On October 31, 2011, the Company completed the acquisition of all of the capital stock of Timesquest Limited, a holding company and the sole shareholder of Gentech International Limited (“Gentech”), a designer and manufacturer of position sensors used largely for tank liquid level measurement, including urea tank level in heavy truck SCR systems sensor based in Ayrshire, Scotland. Additionally, the Company acquired certain intellectual property rights for fluid property sensors utilizing optical spectral technology through a license agreement with Sentelligence. Acquisitions are a key component of the Company’s growth strategy, though there is no specific timetable for any acquisitions.
Trends
There are a number of trends that we expect to materially affect our future operating results, including improving global economic conditions with the resulting impact on our sales, profitability, and capital spending, changes in foreign currency exchange rates relative to the U.S. dollar, shifts in our overall effective tax rate, changes in our debt levels and applicable interest rates, and prices of raw materials and other costs, such as labor. Additionally, sales and results of operations could be impacted by additional acquisitions.
Overall, the Company expects moderate sales growth during fiscal 2012. Many of the Company’s customers remained cautious during the previous several months due to challenging economic conditions with, among other factors, the euro-zone debt crisis, fears of a double-dip recession, high unemployment and weaknesses in the housing market. Consequently, customers have continued to closely manage inventory levels by delaying and pushing-out orders; however, toward the end of the third quarter, the Company had stronger bookings, which the Company believes will support a recovery in sales during the fourth quarter. As a result of and due to limited customer visibility in product demand, we have set our outlook for sales accordingly: Including Eureka, Celesco and Gentech, the Company expects sales to range from $308,000 to $311,000 for fiscal 2012. We remain positive with regard to sales contribution coming from product developments and expect small contributions in fiscal 2012 and strong contributions in fiscal 2013 and in future periods. Additionally, we expect the sensor market will continue to perform well relative to the overall economy as a result of the increase in sensor content in various products across most end markets in the U.S., Europe and Asia. Sensor content continues to increase at a faster rate than overall product unit growth, as OEMs add “intelligence” in products across most market verticals to promote improved energy efficiency and cleaner technologies, to meet regulatory compliance requirements and to improve user safety and convenience.
The following graph details the Company’s quarterly net sales and adjusted EBITDA over the previous two years.
| 26 |
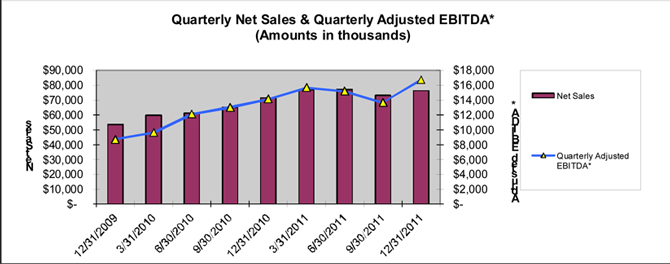
Adjusted EBITDA is a non-GAAP financial measure that is not in accordance with, or an alternative to, measures prepared in accordance with GAAP. The Company believes certain financial measures which meet the definition of non-GAAP financial measures provide important supplemental information. The Company considers Adjusted EBITDA an important financial measure because it provides a financial measure of the quality of the Company’s earnings from a cash flow perspective (prior to taking into account the effects of changes in working capital and purchases of property and equipment and debt service). Other companies may calculate Adjusted EBITDA differently than we do, which might limit its usefulness as a comparative measure. Adjusted EBITDA is used by management in addition to and in conjunction with the results presented in accordance with GAAP. Additionally, we believe quarterly Adjusted EBITDA provides the current run-rate for trending purposes rather than a trailing twelve month historical amount. The following table details quarterly net sales and also provides a non-GAAP reconciliation of quarterly Adjusted EBITDA to the applicable GAAP financial measures.
| Quarter Ended | Net Sales | Quarterly Adjusted EBITDA* | Quarterly Adjusted EBITDA* Margin | Income (Loss) from Continuing Operations | Interest | Foreign Currency Exchange Loss (Gain) | Depreciation and Amortization | Income Taxes | Share-based Compensation | Other* | ||||||||||||||||||||||||||||||
| 12/31/2009 | $ | 53,595 | $ | 8,709 | 16 | % | $ | 3,265 | $ | 905 | $ | (64 | ) | $ | 3,630 | $ | (191 | ) | $ | 865 | $ | 300 | ||||||||||||||||||
| 3/31/2010 | $ | 59,772 | $ | 9,633 | 16 | % | $ | 4,202 | $ | 808 | $ | 50 | $ | 3,237 | $ | 317 | $ | 943 | $ | 76 | ||||||||||||||||||||
| 6/30/2010 | $ | 61,170 | $ | 12,123 | 20 | % | $ | 5,589 | $ | 758 | $ | (81 | ) | $ | 3,770 | $ | 1,386 | $ | 691 | $ | 10 | |||||||||||||||||||
| 9/30/2010 | $ | 65,166 | $ | 13,018 | 20 | % | $ | 6,757 | $ | 884 | $ | 277 | $ | 3,350 | $ | 1,175 | $ | 567 | $ | 8 | ||||||||||||||||||||
| 12/31/2010 | $ | 71,687 | $ | 14,176 | 20 | % | $ | 7,499 | $ | 753 | $ | (63 | ) | $ | 4,106 | $ | 893 | $ | 974 | $ | 14 | |||||||||||||||||||
| 3/31/2011 | $ | 76,766 | $ | 15,691 | 20 | % | $ | 8,330 | $ | 650 | $ | 305 | $ | 3,667 | $ | 1,383 | $ | 1,356 | $ | — | ||||||||||||||||||||
| 6/30/2011 | $ | 77,184 | $ | 15,277 | 20 | % | $ | 8,008 | $ | 579 | $ | 399 | $ | 3,520 | $ | 1,453 | $ | 1,245 | $ | 73 | ||||||||||||||||||||
| 9/30/2011 | $ | 73,243 | $ | 13,685 | 19 | % | $ | 6,656 | $ | 548 | $ | (378 | ) | $ | 3,581 | $ | 1,630 | $ | 1,254 | $ | 394 | |||||||||||||||||||
| 12/31/2011 | $ | 76,341 | $ | 13,057 | 17 | % | $ | 4,695 | $ | 806 | $ | 27 | $ | 4,847 | $ | 1,187 | $ | 1,162 | $ | 333 |
* - Adjusted EBITDA = Income from Continuing Operations before Interest, Foreign Currency Exchange Loss (Gain), Depreciation and Amortization, Income Taxes, Share-based Compensation and Other. Other represents legal fees incurred related to certain International Traffic in Arms Regulations matters and professional fees related to acquisitions. Adjusted EBITDA Margin = Adjusted EBITDA divided Net Sales.
The primary factors that impact our costs of sales include production and sales volumes, product sales mix, foreign currency exchange rates, changes in the price of raw materials and the impact of various cost control measures. Although we expect continued pressures on our gross margins given our expectation that costs, including raw material and labor costs, will increase, we expect product mix to improve, largely due to slower Sensata sales growth relative to other more profitable product lines and expect to continue to increase leverage of our fixed manufacturing overhead. Despite our third quarter gross margins falling below 40%, we expect our gross margins during our fourth quarter and for fiscal 2012 to range from approximately 40% to 42%. The lower gross margins in the third quarter of fiscal 2012 were mainly due to product mix and lower volumes resulting in decreased absorption of overhead, as well as higher scrap and labor costs with several large new development programs. Gross margins for certain quarters could be outside this expected range based upon a number of possible factors. Gross margins have trended down over the past several years, largely due to unfavorable product sales mix (both in terms of organic growth and acquired sales) and the impact of the increase in the value of the RMB relative to the U.S. dollar. However, our gross margins increased in fiscal 2011 as compared to the prior year mainly because of the increase in overall volume of business after the recession. As with all manufacturers, our gross margins are sensitive to the overall volume of business (i.e., economies of scale) in that certain costs are fixed. Since our overall level of business increased in fiscal 2011, our gross margins and overall level of profits increased accordingly. During the nine months ended December 31, 2011, the RMB appreciated approximately 3.0%, and during fiscal 2011, the RMB appreciated approximately 4.0% relative to the U.S. dollar. There are indications this trend may continue in the near term. We estimate in 2012 for every 1% increase in the value of the RMB relative to the U.S. dollar, our gross margins decline by approximately $200.
| 27 |
Total selling, general and administrative expense (“Total SG&A”) as a percentage of net sales was lower in fiscal 2011 as compared to the prior year, mainly reflecting our ability to successfully leverage our SG&A expense by growing sales at a higher rate than SG&A expenses. As a percent of sales, Total SG&A was 28.6% and 34.1% in fiscal years 2011 and 2010, respectively. During the nine months ended December 31, 2011, Total SG&A as a percent of sales was approximately 29.3%. Higher SG&A expense during the first nine months of fiscal 2012 is due in part to acquisition-related costs, such as legal fees. During the first nine months of fiscal 2012, the Company incurred approximately $791 in professional fees associated with acquisition-related activity. We are expecting in 2012 an increase in our SG&A as a percentage of net sales mainly due to continued investment in R&D for new programs, increased amortization expense, higher non-cash equity based compensation and transaction related costs.
Amortization of acquired intangible assets and deferred financing costs increased over the past two years mainly due to the acquisitions of PSI in 2011 and Atexis and FGP in 2009 (the “2009 Acquisitions”). Amortization is disproportionately loaded more in the initial years of the acquisition, and therefore amortization expense is higher in the quarters immediately following a transaction, and declines in later years based on how various intangible assets are valued and the differing useful lives for which the respective intangible assets are amortized. For example, backlog is amortized over a period less than 1 year and patents are amortized over a weighted average life of 16 years. Amortization of acquired intangible assets is expected to increase in fiscal 2012 as compared to fiscal 2011, due to the acquisitions of Eureka, Celesco and Gentech (the “2012 Acquisitions”), and acquired intellectual property rights licensed from Sentelligence.
In addition to the margin exposure as a result of the depreciation of the U.S. dollar relative to the RMB, the Company also has foreign currency exchange exposures related to balance sheet accounts. When foreign currency exchange rates fluctuate, there is a resulting revaluation of assets and liabilities denominated and accounted for in foreign currencies other than the subsidiary’s functional currency. Foreign currency exchange (“fx”) losses or gains due to the revaluation of local subsidiary balance sheet accounts with realized and unrealized fx transactions increased sharply in recent years, because of, among other factors, volatility of foreign currency exchange rates. For example, our Swiss company, which uses the Swiss franc as its functional currency, holds cash denominated in foreign currencies (U.S. dollar and Euro). As the Swiss franc appreciates against the U.S. dollar and/or Euro, the cash balances held in those denominations are devalued when stated in terms of Swiss francs. These fx transaction gains and losses are reflected in our “Foreign Currency Exchange Gain or Loss.” Aside from cash, our foreign entities generally hold receivables and payables in foreign currencies. We recorded net fx losses of $439 in 2011 and net fx gains of $987 in 2010. During the nine months ended December 31, 2011, the Company recorded net fx losses of $47 . The Company’s operations outside of the U.S. and the volume of business denominated in other currencies have expanded over the years from acquisitions. We expect to see continued fx losses or gains associated with volatility of foreign currency exchange rates.
The Company uses and may continue to use foreign currency contracts to hedge these fx exposures. The Company does not hedge all of its fx exposures, but has accepted some exposure to exchange rate movements. The Company does not apply hedge accounting when derivative financial instruments are used to manage these fx exposures. Since the Company does not apply hedge accounting, the changes in the fair value of those derivative financial instruments are reported in earnings in the fx gains or losses caption. We expect the value of the U.S. dollar will continue to fluctuate relative to the RMB, Euro, Swiss franc and British pound. Therefore, both positive and negative movements in currency exchange rates relative to the U.S. dollar will continue to affect the reported amounts of sales, profits, and assets and liabilities in the Company’s consolidated financial statements.
| 28 |
Our overall effective tax rate will continue to fluctuate as a result of the allocation of earnings among the various taxing jurisdictions in which we operate and their varying tax rates. This is particularly challenging due to the different timing and rates of economic growth around the world. We expect our 2012 overall estimated effective tax rate without discrete tax adjustments to range from approximately 21% to approximately 24%, an increase as compared to the prior year. The increase in the estimated overall effective tax rate mainly reflects the shift of taxable earnings to tax jurisdictions with higher tax rates. The overall estimated effective tax rate is based on expectations and other estimates and involves complex domestic and foreign tax issues, which the Company monitors closely, but are subject to change.
In fiscal 2010, the Company’s subsidiary in China, MEAS China, received approval from the Chinese authorities for High New Technology Enterprise (“HNTE”) status. HNTE status decreased the tax rate for MEAS China from 18% to 15% through December 31, 2011. The Company is working with Chinese authorities for renewal of HNTE status, and based on current tax law and tax status, management believes MEAS China will obtain recertification for HNTE status. To qualify for this reduced rate the Company must continue to meet various criteria in regard to its operations related to sales, research and development activity, and intellectual property rights. If the Company does not continue to receive HNTE status, the Company’s income tax rate in China would increase to 25%.
The Company plans to continue investing in various capital projects in fiscal 2012 to generate higher sales in new and expanded programs, and expects these expenditures to range between 3% and 4% of sales. Additionally, the Company plans to invest in two new manufacturing facilities in Toulouse, France and Chengdu, China. The Toulouse facility is expected to be completed in the second half of calendar 2012 at a cost of approximately $10,000, excluding value added taxes (“VAT”). The Chengdu facility is expected to be built over a two year period at a cost of approximately $6,000, excluding land and VAT. As part of the transition to new facilities, the Company expects to temporarily increase certain inventory levels.
Assets held for sale: With the purchase of PSI, the Company acquired an additional facility in Hampton, Virginia. The Company completed the consolidation of the former PSI facility into the existing MEAS Hampton facility. Since May 2011, the PSI facility was no longer utilized for manufacturing and is held for sale. Accordingly, the former PSI facility is classified as an asset held for sale since it meets the held for sale criteria under the applicable accounting guidelines. The carrying value of the former PSI facility of $1,829, of which $635 represents land, approximates fair value less cost to sell.
RESULTS OF OPERATIONS
THREE MONTHS ENDED DECEMBER 31, 2011 COMPARED TO THREE MONTHS ENDED DECEMBER 31, 2010
The following table sets forth certain items from operations in our condensed consolidated statements of operations for the three months ended December 31, 2011 and 2010, respectively:
| 29 |
| Three months ended December 31, | ||||||||||||||||
| 2011 | 2010 | Change | Percent Change | |||||||||||||
| Net sales | $ | 76,341 | $ | 71,687 | $ | 4,654 | 6.5 | |||||||||
| Cost of goods sold | 47,470 | 42,030 | 5,440 | 12.9 | ||||||||||||
| Gross profit | 28,871 | 29,657 | (786 | ) | (2.7 | ) | ||||||||||
| Operating expenses: | ||||||||||||||||
| Selling, general, and administrative | 18,664 | 17,854 | 810 | 4.5 | ||||||||||||
| Non-cash equity based compensation | 1,162 | 974 | 188 | 19.3 | ||||||||||||
| Amortization of acquired intangibles and deferred financing costs | 2,580 | 1,924 | 656 | 34.1 | ||||||||||||
| Total selling, general and administrative expenses | 22,406 | 20,752 | 1,654 | 8.0 | ||||||||||||
| Operating income | 6,465 | 8,905 | (2,440 | ) | (27.4 | ) | ||||||||||
| Interest expense, net | 806 | 753 | 53 | 7.0 | ||||||||||||
| Foreign currency exchange loss (gain) | 27 | (63 | ) | 90 | (142.9 | ) | ||||||||||
| Equity income in unconsolidated joint venture | (240 | ) | (153 | ) | (87 | ) | 56.9 | |||||||||
| Other income | (10 | ) | (24 | ) | 14 | (58.3 | ) | |||||||||
| Income before income taxes | 5,882 | 8,392 | (2,510 | ) | (29.9 | ) | ||||||||||
| Income tax expense from continuing operations | 1,187 | 893 | 294 | 32.9 | ||||||||||||
| Income from continuing operations, net of income taxes | $ | 4,695 | $ | 7,499 | $ | (2,804 | ) | (37.4 | ) | |||||||
Net sales: For the three months ended December 31, 2011, net sales totaled $76,341, an increase of $4,654 or 6.5% over the same period last year. Organic sales, defined as net sales excluding sales attributed to the Eureka, Celesco and Genetech acquisitions of $6,859 for the three months ending December 31, 2011, decreased $2,205 or approximately 3.1%. Sales decreases were in all sensor product lines, except Sensata, humidity, vibration and position, with the largest decreases in pressure, temperature and piezo product lines. The overall decrease in organic sales is largely driven by reduced demand due to global economic uncertainties. Many of the Company’s customers were more cautious during the previous several months due to challenging economic conditions with, among other factors, the euro-zone debt crisis, fears of recession, high unemployment and weaknesses in the housing market. Consequently, customers have been closely managing inventory levels by delaying and pushing-out orders; however, toward the end of the third quarter, the Company had stronger bookings, which the Company believes will support a recovery in sales during the fourth quarter. We expect the sensor market to continue to perform well relative to the overall economy as a result of the increase in sensor content in various products across most end markets in the U.S., Europe and Asia. Sensor content continues to increase at a faster rate than overall product unit growth, as OEMs add “intelligence” in products across most market verticals to promote improved energy efficiency and cleaner technologies, to meet regulatory compliance requirements and to improve user safety and convenience.
Gross margin: Gross margin (gross profit as a percent of net sales) decreased to approximately 37.8% from approximately 41.4%. The decrease in gross margin is mainly due to changes in product mix (i.e., higher Sensata sales which carry lower margin than other product line averages), and lower overhead absorption, largely driven by lower production and associated sales during the quarter, as well as higher scrap costs relative to prior periods and the appreciation of the RMB. The Company sold a larger proportion of products with lower gross margin during the current period as compared to the corresponding period last year, mainly reflecting the increase in automotive related sales and the decrease in piezo and temperature product line sales. In comparing the three months ending December 31, 2011 to the corresponding period last year, the RMB appreciated approximately 4.6% relative to the U.S. dollar. This translates to an annualized decrease in profits of approximately $920 based on an estimate decrease in our operating income of approximately $200 for every 1% appreciation of the RMB against the U.S. dollar.
On a continuing basis, our gross margin may vary due to product mix, sales volume, availability and cost of raw materials, foreign currency exchange rates, and other factors.
Selling, general and administrative: Overall, total selling, general and administrative (“SG&A”) expenses increased $1,654 or 8.0% to $22,406. Organic SG&A costs, defined as total SG&A excluding SG&A costs associated with the Eureka, Celesco and Gentech acquisitions and acquired intellectual property from Sentelligence of $3,039 for the three months ending December 31, 2011, decreased $1,385 or approximately 6.7%, despite increases in research and development costs. The decrease in organic SG&A mainly reflects a decrease in wage and benefit costs driven by the reversal of $1,000 management bonus during the quarter, since financial results have not met established targets. The increase in research and development costs is mostly due to the Company’s continued investment in new programs in support of future sales growth.
| 30 |
Total SG&A expenses as a percent of net sales increased to 29.3% from 28.9%. The increase in total SG&A as a percent of net sales is due to costs increasing at a higher rate than net sales, including the increases in acquisition related expenses, research and development costs, and amortization of acquired intangible assets.
Non-cash equity based compensation: Non-cash equity based compensation increased $188 to $1,162. The increase in non-cash equity based compensation is mainly due to a higher grant-date fair value assigned to options granted during the prior fiscal year. The grant-date fair value is calculated using the Black-Scholes-Merton option-pricing valuation model which is based on a number of variables, including share price, expected volatility, expected term and risk free interest rate. The higher fair value mainly reflects the increase in the Company’s share price. Total compensation cost related to share based payments not yet recognized totaled $2,258 at December 31, 2011, which is expected to be recognized over a weighted average period of approximately 1 year.
Amortization of acquired intangible assets and deferred financing costs: Amortization of acquired intangible assets and deferred financing costs increased $656 to $2,580 as compared to $1,924 during the same period last year. The increase in amortization expense is mainly because the additional amortization expense related to the acquisitions of Eureka, Celesco and Gentech (the “2012 Acquisitions”) and intellectual property rights licensed from Sentelligence. The Company expects amortization expense to increase next quarter as a result of the 2012 Acquisitions. Amortization expense is generally higher during the first year after an acquisition because, among other things, the order back-log is fully amortized during the initial year.
Interest expense, net: Interest expense increased $53 to $806 from $753. The increase in interest expense is primarily due to the increase in outstanding debt, which was partially offset by the decreases in average interest rates. Total consolidated average outstanding debt increased to approximately $106,378 for the three months ended December 31, 2011 as compared to $91,344 for the three months ended December 31, 2010, mainly reflecting additional borrowings to fund the 2012 Acquisitions. Interest rates declined to approximately 2.9% for the three months ended December 31, 2011 from about 3.4% the same period last year. The decrease in interest rates mainly reflects improved pricing with the amendment to the Company’s Credit Agreement (the "Senior Secured Credit Facility") effective November 8, 2011, which was partly offset by the increase in the London Inter-Bank Offered Rate (“LIBOR”) interest rate.
Foreign currency exchange gains and losses: Foreign currency exchange gains and losses represent the impact of changes in foreign currency exchange rates with, among other things, the revaluation of balance sheet accounts and foreign currency contracts. When foreign currency exchange rates fluctuate, there is a resulting revaluation of assets and liabilities denominated and accounted for in foreign currencies other than the business’ functional currency. For example, our Irish subsidiary, which uses the Euro as its functional currency, holds cash denominated in foreign currencies, including the U.S. dollar. As the Euro appreciates against the U.S. dollar, the cash balances held in other denominations are devalued when stated in terms of Euro, resulting in a foreign currency exchange loss.
The change from a foreign currency exchange from a gain last year to an exchange loss this year is mainly due to exchange losses with the appreciation of the RMB relative to the U.S. dollar, partially offset with gains due to the fluctuations in the value of the Euro. The Company continues to be impacted by volatility in foreign currency exchange rates, including the impact of the fluctuation of the U.S. dollar relative to the Euro and Swiss franc, as well as the appreciation of the RMB relative to the U.S. dollar.
Income Taxes: Income tax expense for the three months ended December 31, 2011 increased $294 to $1,187 from $893 for the corresponding period last year. The increase in income tax expense is primarily due to the increase in the estimated annual effective tax rate (“estimated ETR”) and the generation of higher profits before taxes during the current period as compared to the same period last year, which was partially offset by a discrete non-cash income tax credit adjustment.
| 31 |
The Company’s overall effective tax rate (income tax expense divided by income before income taxes) for the three months ended December 31, 2011 was approximately 20%, as compared to approximately 11% the same period last year. Income tax expense during interim periods is based on an estimated ETR. The estimated ETR without discrete items for fiscal 2012 is approximately 21%, as compared to 17% estimated ETR without discrete items for the three months ended December 31, 2010. The increase in the estimated annual effective tax rate without discrete adjustments mainly reflects a higher proportion of taxable income in tax jurisdictions with higher tax rates, including the U.S. and Germany. The overall estimated ETR is based on expectations and other estimates and involves complex domestic and foreign tax issues, which the Company monitors closely and are subject to change.
NINE MONTHS ENDED DECEMBER 31, 2011 COMPARED TO NINE MONTHS ENDED DECEMBER 31, 2010
The following table sets forth certain items from operations in our condensed consolidated statements of operations for the nine months ended December 31, 2011 and 2010, respectively:
| Nine months ended December 31, | ||||||||||||||||
| 2011 | 2010 | Change | Percent Change | |||||||||||||
| Net sales | $ | 226,768 | $ | 198,022 | $ | 28,746 | 14.5 | |||||||||
| Cost of goods sold | 135,449 | 114,424 | 21,025 | 18.4 | ||||||||||||
| Gross profit | 91,319 | 83,598 | 7,721 | 9.2 | ||||||||||||
| Operating expenses: | ||||||||||||||||
| Selling, general, and administrative | 57,175 | 50,771 | 6,404 | 12.6 | ||||||||||||
| Non-cash equity based compensation | 3,662 | 2,231 | 1,431 | 64.1 | ||||||||||||
| Amortization of acquired intangibles and deferred financing costs | 5,445 | 5,063 | 382 | 7.5 | ||||||||||||
| Total selling, general and administrative expenses | 66,282 | 58,065 | 8,217 | 14.2 | ||||||||||||
| Operating income | 25,037 | 25,533 | (496 | ) | (1.9 | ) | ||||||||||
| Interest expense, net | 1,932 | 2,395 | (463 | ) | (19.3 | ) | ||||||||||
| Foreign currency exchange loss | 47 | 134 | (87 | ) | (64.9 | ) | ||||||||||
| Equity income in unconsolidated joint venture | (612 | ) | (402 | ) | (210 | ) | 52.2 | |||||||||
| Other expense | 41 | 110 | (69 | ) | (62.7 | ) | ||||||||||
| Income before income taxes | 23,629 | 23,296 | 333 | 1.4 | ||||||||||||
| Income tax expense | 4,269 | 3,453 | 816 | 23.6 | ||||||||||||
| Net income | $ | 19,360 | $ | 19,843 | $ | (483 | ) | (2.4 | ) | |||||||
Net sales: For the nine months ended December 31, 2011, net sales totaled $226,768, and represented an increase of $28,746 or 14.5% over the same period last year. Organic sales, defined as net sales excluding sales attributed to the PSI, Eureka, Celesco and Gentech acquisitions of $19,538 and $7,190 for the nine months ending December 31, 2011 and 2010, respectively, increased $16,398 or 8.6%. Sales increases were in all sensor product lines, except optical and piezo, with the largest increases in Sensata, humidity, position and vibration. The overall increase in organic sales is mainly due to new sales from broader product adoptions and new programs.
We expect the sensor market to continue to perform well relative to the overall economy as a result of the increase in sensor content in various products across most end markets in the U.S., Europe and Asia. Sensor content continues to increase at a faster rate than overall product unit growth, as OEMs add “intelligence” in products across most market verticals to promote improved energy efficiency and cleaner technologies, to meet regulatory compliance requirements and to improve user safety and convenience.
Contributing to the increase in sales was a translation increase in sales resulting from changes in foreign currency exchange rates. If the average U.S. dollar / Euro exchange rate had not changed during the nine months ended December 31, 2011 as compared to the nine months ended December 31, 2010, the Company’s net sales would have been lower by approximately $2,025. Since a portion of the Company’s sales are denominated in Euros and translated into U.S. dollars, there can be a translation decrease or a translation increase in the Company’s net sales depending on changes in exchange rates. The U.S. dollar depreciated relative to the Euro in comparing average exchange rates for the nine months ended December 31, 2011 to the nine months ended December 31, 2010. For example, €1,000 is translated to $1,400 based on the nine month average exchange rate ended December 31, 2011, but the same €1,000 is translated to $1,359 using nine month average exchange rate ending December 31, 2010.
| 32 |
Gross margin: Gross margin (gross profit as a percent of net sales) decreased to approximately 40.3% from approximately 42.2%. The decrease in gross margin is mainly due to product sales mix, increases in material costs and wages, higher scrap and the appreciation of the RMB. The Company sold a larger proportion of products with lower gross margin during the current period as compared to the corresponding period last year, mainly reflecting the increase in Sensata and other engine and vehicle related sales and the decrease in piezo sales. In comparing the first nine months of fiscal 2012 to the corresponding period last year, the RMB appreciated approximately 5.1% relative to the U.S. dollar, as compared to the corresponding period last year. This translates to a decrease in profits of approximately $1,020 based on an estimate decrease in our operating income of approximately $200 for every 1% appreciation of the RMB against the U.S. dollar.
On a continuing basis, our gross margin may vary due to product mix, sales volume, availability and cost of raw materials, foreign currency exchange rates, and other factors.
Selling, general and administrative: Overall, total selling, general and administrative (“SG&A”) expenses increased $8,217 or 14.2% to $66,282. Organic SG&A costs, defined as total SG&A excluding SG&A costs associated with the PSI, Eureka, Celesco and Gentech acquisitions and acquired intellectual property from Sentelligence of $6,281 and $2,806 for the nine months ending December 31, 2011 and 2010, respectively, increased $4,742 or 8.6%. The increase in organic SG&A mainly reflects increases in research and development costs and higher compensation costs, including wages and non-cash equity based compensation, as well as the translation increase in SG&A expenses resulting from the changes in foreign currency exchange rates and the increase in amortization of intangible assets. The increase in research and development costs is mostly due to the Company’s continued investment in new programs. The increase in compensation is due to, among other things, higher headcount and higher compensation levels, including non-cash equity based compensation, as part of the Company’s overall growth. If the average U.S. dollar / Euro exchange rate had not changed during the nine months ended December 31, 2011 as compared to the nine months ended December 31, 2010, SG&A expenses would have been lower by approximately $684.
Total SG&A expenses as a percent of net sales remained at approximately 29.3% as compared to the corresponding period last year.
Non-cash equity based compensation: Non-cash equity based compensation increased $1,431 to $3,662. The increase in non-cash equity based compensation is mainly due to a higher grant-date fair value assigned to options granted during the prior fiscal year. The grant-date fair value is calculated using the Black-Scholes-Merton option-pricing valuation model which is based on a number of variables, including share price, expected volatility, expected term and risk free interest rate. The higher fair value mainly reflects the increase in the Company’s share price. Total compensation cost related to share based payments not yet recognized totaled $2,258 at December 31, 2011, which is expected to be recognized over a weighted average period of approximately 1 year.
Amortization of acquired intangible assets and deferred financing costs: Amortization of acquired intangible assets and deferred financing costs increased $382 to $5,445 as compared to $5,063 the same period last year. The decrease in amortization expense is mainly because of the prior year write-off of $585 in deferred financing costs associated with the previous credit facility, which was partially offset by the increase in amortization associated with the PSI and the 2012 Acquisitions and acquired intellectual property from Sentelligence.
Interest expense, net: Interest expense decreased $463 to $1,932 from $2,395. The decrease in interest expense is primarily due to the decrease in average interest rates, which was partially offset by an increase in average outstanding debt. Interest rates declined to approximately 3.4% for the nine months ended December 31, 2011 from about 3.9% the same period last year. The decrease in interest rates mainly reflects improved pricing with the amendment to the Senior Secured Credit Facility effective November 8, 2011, which was partly offset by the increase in the LIBOR interest rate.
Total average outstanding debt increased to approximately $81,275 for the nine months ended December 31, 2011 as compared to $80,469 for the nine months ended December 31, 2010, mainly reflecting additional borrowing to fund the 2012 Acquisitions.
| 33 |
Foreign currency exchange gains and losses: Foreign currency exchange gains and losses represent the impact of changes in foreign currency exchange rates with, among other things, the revaluation of balance sheet accounts and foreign currency contracts. When foreign currency exchange rates fluctuate, there is a resulting revaluation of assets and liabilities denominated and accounted for in foreign currencies other than the business’ functional currency. For example, our Irish subsidiary, which uses the Euro as its functional currency, holds cash denominated in foreign currencies, including the U.S. dollar. As the Euro appreciates against the U.S. dollar, the cash balances held in other denominations are devalued when stated in terms of Euro, resulting in a foreign currency exchange loss.
The decrease in foreign currency exchange loss is mainly due to the foreign currency exchange gains recorded in the second quarter of fiscal 2012 with the favorable fluctuation of the Euro relative to the U.S. dollar with the revaluation of the U.S. dollar denominated net asset position of the Company’s European operations. The Company continues to be impacted by volatility in foreign currency exchange rates, including the impact of the fluctuation of the U.S. dollar relative to the Euro, Swiss franc and British pound, as well as the appreciation of the RMB relative to the U.S. dollar.
Income Taxes: Income tax expense for the nine months ended December 31, 2011 increased $816 to $4,269 from $3,453 for the corresponding period last year. The increase in income tax expense is primarily due to the increase in the estimated annual effective tax rate (“estimated ETR”) and the generation of higher profits before taxes during the current period as compared to the same period last year, which was partially offset by a discrete non-cash income tax credit adjustment.
The Company’s overall effective tax rate (income tax expense divided by income before income taxes) for the nine months ended December 31, 2011 was approximately 18%, as compared to approximately 15% the same period last year. Income tax expense during interim periods is based on an estimated ETR. The estimated ETR without discrete items for fiscal 2012 is approximately 21%, as compared to 17% estimated ETR without discrete items for the nine months ended December 31, 2010. The increase in the estimated annual effective tax rate without discrete adjustments mainly reflects a higher proportion of taxable income in tax jurisdictions with higher tax rates, including the U.S. and Germany. The overall estimated ETR is based on expectations and other estimates and involves complex domestic and foreign tax issues, which the Company monitors closely and are subject to change.
During the three months ended June 30, 2011, the Company recorded a discrete non-cash income tax credit adjustment of $612 for the remeasurement of the net deferred tax liabilities in Switzerland resulting from a decrease in Swiss tax rates. The regional tax rate, or also referred to as the “cantonal” tax rate, for the Company’s subsidiary in Switzerland will decrease from 20% to 10% over the next five years.
LIQUIDITY AND CAPITAL RESOURCES
Cash balances totaled $24,552 at December 31, 2011, an increase of $3,692 as compared to March 31, 2011, reflecting, among other factors, higher cash flows generated from operating activities, proceeds from stock-option exercises and borrowings from revolver, which were partially offset by cash used in investing activities for acquisitions and capital expenditures, share buy-back and debt payments.
The following compares the primary categories of the consolidated statement of cash flows for the nine months ended December 31, 2011 and 2010:
| 34 |
| Nine months ended December 31, | ||||||||||||
| 2011 | 2010 | Change | ||||||||||
| Net cash provided by operating activities | $ | 27,194 | $ | 22,587 | $ | 4,607 | ||||||
| Net cash used in investing activities | (56,076 | ) | (33,680 | ) | (22,396 | ) | ||||||
| Net cash provided by (used in) financing activities | 33,289 | 18,273 | 15,016 | |||||||||
| Effect of exchange rate changes on cash | (715 | ) | 371 | (1,086 | ) | |||||||
| Net change in cash and cash equivalents | $ | 3,692 | $ | 7,551 | $ | (3,859 | ) | |||||
A key source of the Company’s liquidity is its ability to generate positive operating cash flows. Cash flows provided by operating activities increased $4,607 to $27,194. The increase in operating cash flows is mainly due to the $15,961 increase in cash flows from operating working capital (net changes in trade accounts receivable, inventory and accounts payable). In comparing cash flows generated from operating working capital for the nine months ended December 31, 2011 to the corresponding period last year, the largest drivers of the increase in cash flows from operating working capital were the favorable trends with trade receivables and inventory. The current period net change in accounts receivable was a decrease or source of cash flows of $2,142, as compared to an increase or a use of cash flows of $5,264 for the same period last year. The improvement in the change in trade receivables mainly reflects continued positive collection trends and the relative level of sales toward the end of the third quarter of fiscal 2012. The net increases in inventory for the current and prior periods were $2,932 and $10,316, respectively. The improvement in the change in inventory balances for operating cash flows is largely due to efforts to closely manage inventory levels. The decrease in income tax payable mainly reflects higher tax payments, and the increase in income tax payments during the current period as compared to the same period last year is due to higher levels of taxable income during the prior fiscal year.
Net cash used in investing activities for the nine months ended December 31, 2011 was $56,076 as compared to $33,680 for the corresponding period last year. The increase in cash used in investing activities mainly reflects higher value of purchase price and cash outlays for the 2012 Acquisitions and acquired intellectual property from Sentelligence, as compared to the corresponding period last year with the acquisition of PSI. The increase in capital expenditures primarily reflects the purchase of equipment for the manufacturing of new products and programs, as well as capital additions of $2,718 related to the new manufacturing facility in France.
Net cash provided by financing activities for the nine months ended December 31, 2011 totaled $33,289, as compared to $18,273 in net cash provided in financing activities the same period last year. The Company’s credit facilities are mainly utilized to fund acquisitions. The Company funded all of the Celesco and Gentech acquisitions and most of the PSI acquisition last year from borrowings under the Company’s revolver. During the nine months ended December 31, 2011, the Company made approximately $14,700 in revolver and other debt payments. Additionally, the Company executed a share buy-back plan and purchased 229,911 shares for $6,500 of the Company’s stock. Offsetting the revolver and debt payments were the proceeds from the exercise of stock options and the related excess tax benefit from the exercise of stock options. Proceeds from the exercise of stock options totaled $5,123.
The effect of exchange rate changes on cash is the translation decrease or increase in cash due to the fluctuation of foreign currency exchange rates. The decrease in cash for the current year impact of exchange rate changes is primarily due to the appreciation of the U.S. dollar relative to the Euro. The prior year increase in cash from the effect of exchange rate changes is mainly due to the depreciation of the U.S. dollar relative to the Euro and RMB.
Long-term debt: The Company entered into a new Credit Agreement (the "Senior Secured Credit Facility") dated June 1, 2010 among JPMorgan Chase Bank, N.A., as administrative agent and collateral agent (in such capacity, the "Senior Secured Facility Agents"), Bank America, N.A., as syndication agent, HSBC Bank USA, N.A., as document agent, and certain other parties thereto (the "Credit Agreement") to refinance the Amended and Restated Credit Agreement effective as of April 1, 2006 among the Company, General Electric Capital Corporation, as agent and a lender, and certain other parties thereto and to provide for the working capital needs of the Company including to effect permitted acquisitions.
| 35 |
The Senior Secured Credit Facility, as amended, consists of a $110,000 revolving credit facility (the "Revolving Credit Facility") with a $75,000 accordion feature enabling expansion of the Revolving Credit Facility to $185,000 and matures on November 8, 2016. The Revolving Credit Facility has a variable interest rate based on either the London Inter-bank Offered Rate ("LIBOR") or the ABR Rate (prime based rate) with applicable margins ranging from 1.25% to 2.00% for LIBOR based loans or 0.25% to 1.00% for ABR Rate loans. The applicable margins may be adjusted quarterly based on a change in the leverage ratio of the Company. The Senior Secured Credit Facility also includes the ability to borrow in currencies other than U.S. dollars, such as the Euro and Swiss Franc, up to $66,000, of which the Company has utilized approximately $6,600 as of December 31, 2011. Commitment fees on the unused balance of the Revolving Credit Facility range from 0.25% to 0.375% per annum of the average amount of unused balances. The Revolving Credit Facility will expire on November 8, 2016 and all balances outstanding under the Revolving Credit Facility will be due on such date. The Company has provided a security interest in substantially all of the Company's U.S. based assets as collateral for the Senior Secured Credit Facility and private placement of credit facilities entered into by the Company from time to time not to exceed $50,000, including the Prudential Shelf Facility (as defined below). The Senior Secured Credit Facility includes an inter-creditor arrangement with Prudential and is on a pari passu (equal force) basis with the Prudential Shelf Facility.
The Senior Secured Credit Facility includes specific financial covenants for maximum leverage ratio and minimum fixed charge coverage ratio, as well as customary representations, warranties, covenants and events of default for a transaction of this type. Consolidated EBITDA for debt covenant purposes is the Company's consolidated net income determined in accordance with GAAP minus the sum of income tax credits, interest income, gain from extraordinary items for such period, any non-cash gains, and gains due to fluctuations in currency exchange rates, plus the sum of any provision for income taxes, interest expense, loss from extraordinary items, any aggregate net loss during such period arising from the disposition of capital assets, the amount of non-cash charges for such period, amortized debt discount for such period, losses due to fluctuations in currency exchange rates and the amount of any deduction to consolidated net income as the result of any grant to any members of the management of the Company of any equity interests. The Company's leverage ratio consists of total debt less unrestricted cash maintained in U.S. bank accounts which are subject to control agreements in favor of JPMorgan Chase Bank, N.A., as Collateral Agent, to Consolidated EBITDA. Adjusted fixed charge coverage ratio is Consolidated EBITDA less capital expenditures for the last twelve months, excluding capital expenditures in connection with the facilities being constructed in France in an aggregate amount of $11,000 and China in an aggregate amount of $6,000 through March 31, 2013, divided by fixed charges. Fixed charges are the last twelve months of scheduled principal payments, taxes paid in cash and consolidated interest expense. All of the aforementioned financial covenants are subject to various adjustments, many of which are detailed in the Credit Agreement.
As of December 31, 2011, the Company utilized the LIBOR based rate for $80,327 of the Revolving Credit Facility. The weighted average interest rate applicable to borrowings under the Revolving Credit Facility was approximately 1.9% at December 31, 2011. As of December 31, 2011, the outstanding borrowings on the Revolving Credit Facility, which is classified as non-current, were $80,327. The Company’s borrowing capacity is limited by financial covenant ratios, including earnings ratios, and as such, our borrowing capacity is subject to change. At December 31, 2011, the Company could have borrowed an additional $29,673.
On June 1, 2010, the Company entered into a Master Shelf Agreement (the "Prudential Shelf Facility") with Prudential Investment Management, Inc. ("Prudential") whereby Prudential agreed to purchase up to $50,000 of senior secured notes (the "Senior Secured Notes") issued by the Company. Prudential purchased two Senior Secured Notes each for $10,000 and the remaining $30,000 of such Senior Secured Notes may be purchased at the discretion of Prudential or one or more of its affiliates upon the request of the Company. The Prudential Shelf Facility has a fixed interest rate of 5.70% and 6.15% for each of the two $10,000 Senior Secured Notes issued by the Company and the Senior Secured Notes issued there under are due on June 1, 2015 and 2017, respectively. The Prudential Shelf Facility includes specific financial covenants for maximum total leverage ratio and minimum fixed charge coverage ratio consistent with the Senior Secured Credit Facility, as well as customary representations, warranties, covenants and events of default. The Prudential Shelf Facility includes an inter-creditor arrangement with the Senior Secured Facility Agents and is on a pari passu (equal force) basis with the Senior Secured Credit Facility.
The Company was in compliance with financial covenants at December 31, 2011.
| 36 |
China credit facility: On November 3, 2009, the Company’s subsidiary in China (“MEAS China”) entered into a two year credit facility agreement (the “China Credit Facility”) with China Merchants Bank Co., Ltd (“CMB”). On December 23, 2011, MEAS China renewed the China Credit Facility and extended the expiration to November 25, 2013. The China Credit Facility permits MEAS China to borrow up to RMB 68,000 (approximately $10,800). Specific covenants include customary limitations, compliance with laws and regulations, use of proceeds for operational purposes, and timely payment of interest and principal. MEAS China has pledged its Shenzhen facility to CMB as collateral. The interest rate will be based on the London Inter-bank Offered Rate (“LIBOR”) plus a LIBOR spread, depending on the term of the loan when drawn. The purpose of the China Credit Facility is primarily to provide additional flexibility in funding operations of MEAS China. At December 31, 2011, MEAS China had not borrowed any amounts under the China Credit Facility.
European credit facility: On July 21, 2010, the Company’s subsidiary in France (“MEAS Europe”) entered into a five year credit facility agreement (the “European Credit Facility”) with La Societe Bordelaise de Credit Industriel et Commercial (“CIC”). The European Credit Facility permits MEAS Europe to borrow up to €2,000 (approximately $2,600). Specific covenants include specific financial covenants for maximum leverage ratio and net debt to equity ratio, as well as customary limitations, compliance with laws and regulations, use of proceeds, and timely payment of interest and principal. MEAS Europe has pledged its Les Clayes-sous-Bois, France facility to CIC as collateral. The interest rate is based on the EURIBOR Offered Rate (“EURIBOR”) plus a spread of 1.8%. The EURIBOR interest rate will vary depending on the term of the loan when drawn. The purpose of the European Credit Facility is primarily to provide additional flexibility in funding operations of MEAS Europe. At December 31, 2011, there were no amounts borrowed against the European Credit Facility and MEAS Europe could borrow €2,000.
Promissory notes: In connection with the acquisition of Intersema Microsystems SA (“Intersema”), the Company issued 10,000 Swiss franc unsecured promissory notes (the “Intersema Notes”). At December 31, 2011, the Intersema Notes totaled $2,660, all of which was classified as current. The Intersema Notes are payable in four equal annual installments through January 15, 2012, and bear an interest rate of 4.5% per year.
Acquisition earn-outs and contingent payments: In connection with the Visyx acquisition, the Company has a sales performance based earn-out totaling $4,000. At December 31, 2011, the Company has recorded approximately $121 as additional purchase price for the sales based earn-out related to Visyx, since the related sales based targets had been achieved. The Company has an earnings based earn-out in connection with the Eureka acquisition, for which the Company recorded an estimated fair value of $2,100. The Company has sales based earn-out in connection with the Gentech acquisition, for which the Company recorded a preliminary fair value estimate of £1,196 or approximately $1,930, based on exchange rates at the date of acquisition. The estimates for the Eureka and Gentech earn-outs are based on certain assumptions and actual amounts could differ significantly and changes to this estimate once finalized within the measurement period will be recorded to earnings in future periods.
LIQUIDITY: Management assesses the Company’s liquidity in terms of available cash, our ability to generate cash and our ability to borrow to fund operating, investing and financing activities. The Company continues to generate cash from operating activities, and the Company remains in a positive financial position with availability under existing credit facilities. The Company will continue to have cash requirements to support working capital needs, capital expenditures, earn-outs related to acquisitions, and to pay interest and service debt. We believe the Company’s financial position, generation of cash and the existing credit facility, in addition to the potential to refinance or obtain additional financing will be sufficient to meet funding of day-to-day and material short and long-term commitments for the foreseeable future.
At December 31, 2011, we had approximately $24,552 of available cash and approximately $29,637 of borrowing capacity, after considering the limitations set on the Company’s total leverage under the revolving credit facility. This cash balance includes cash of $6,514 in China, which is subject to certain restrictions on the transfer to another country because of currency control regulations. The Company’s cash balances are generated and held in numerous locations throughout the world, including substantial amounts held outside the United States. The Company utilizes a variety of tax planning and financing strategies in an effort to ensure that its worldwide cash is available in the locations in which it is needed. Wherever possible, cash management is centralized and intra-company financing is used to provide working capital to the Company’s operations. Cash balances held outside the United States could be repatriated to the United States, but, under current law, would potentially be subject to United States federal income taxes, less applicable foreign tax credits. Repatriation of some foreign balances is restricted or prohibited by local laws. Where local restrictions prevent an efficient intra-company transfer of funds, the Company’s intent is that cash balances would remain in the foreign country and it would meet United States liquidity needs through ongoing cash flows, external borrowings, or both.
| 37 |
ACCUMULATED OTHER COMPREHENSIVE INCOME: Accumulated other comprehensive income primarily consists of foreign currency translation adjustments, which relate to the Company’s European and Asian operations and the effects of changes in the exchange rates of the U.S. dollar relative to the Euro, Chinese RMB, Hong Kong dollar, Japanese Yen, Swiss franc and British pound. Foreign currency translation adjustments are generally not adjusted for income taxes as they related to indefinite investments in non-U.S. subsidiaries. Accumulated other comprehensive income also includes unrecognized pension costs.
DIVIDENDS: We have not declared cash dividends on our common equity. Additionally, the payment of dividends is restricted under our Senior Secured Credit Facility. We intend to retain earnings to support our growth strategy and we do not anticipate paying cash dividends in the foreseeable future.
At present, there are no material restrictions on the ability of our Hong Kong and European subsidiaries to transfer funds to us in the form of cash dividends, loans, advances, or purchases of materials, products, or services. Chinese laws and regulations, including currency exchange controls, however, restrict distribution and repatriation of dividends by our China subsidiary.
SEASONALITY: As a whole, there is no material seasonality in our sales. However, general economic conditions have an impact on our business and financial results, and certain end-use markets experience certain seasonality. For example, European sales are often lower in summer months and OEM sales are often stronger immediately preceding and following the introduction of new products.
INFLATION: We compete on the basis of product design, features, and value. Accordingly, our prices generally have kept pace with inflation, notwithstanding that inflation in the countries where our subsidiaries are located has been consistently higher than inflation in the United States. We have recently experienced increases in materials and labor costs, and as a result, we suffered pressure on our margins.
OFF BALANCE SHEET ARRANGMENTS: We do not have any financial partnerships with unconsolidated entities, such as entities often referred to as structured finance, special purpose entities or variable interest entities which are often established for the purpose of facilitating off-balance sheet arrangements or other contractually narrow or limited purposes. The Company does have an unconsolidated joint venture in Japan, N-T, which is not considered to be a special purpose entity or variable interest entity for the purposes of facilitating off-balance sheet arrangements or such limited purposes. Accordingly, we are not exposed to any financing, liquidity, market or credit risk that could arise if we had such relationships.
The Company has acquired and divested of certain assets, including the acquisition of businesses and the sale of the Consumer business. In connection with these acquisitions and divestitures, the Company often provides representations, warranties and/or indemnities to cover various risks and unknown liabilities, such as claims for damages arising out of the use of products or relating to intellectual property matters, commercial disputes, environmental matters or tax matters. The Company cannot estimate the potential liability from such representations, warranties and indemnities because they relate to unknown conditions. However, the Company does not believe that the liabilities relating to these representations, warranties and indemnities will have a material adverse effect on the Company’s financial position, results of operations or liquidity.
| 38 |
AGGREGATE CONTRACTUAL OBLIGATIONS: As of December 31, 2011, the Company’s contractual obligations, including payments due by period, are as follows:
| Contractual Obligations: | Payment due by period | |||||||||||||||||||
| Total | 1 year | 2-3 years | 4-5 years | >5 years | ||||||||||||||||
| Long-term debt obligations | $ | 103,842 | $ | 2,793 | $ | 324 | $ | 90,725 | $ | 10,000 | ||||||||||
| Interest obligation on long-term debt | 13,826 | 2,833 | 5,508 | 5,212 | 273 | |||||||||||||||
| Capital lease obligations | 70 | 35 | 35 | — | — | |||||||||||||||
| Operating lease obligations | 22,178 | 4,349 | 7,452 | 4,358 | 6,019 | |||||||||||||||
| Purchase obligations | 11,154 | 11,139 | 15 | — | — | |||||||||||||||
| Other long-term obligations* | 8,932 | 4,038 | 4,194 | 250 | 450 | |||||||||||||||
| Total | $ | 160,002 | $ | 25,187 | $ | 17,528 | $ | 100,545 | $ | 16,742 | ||||||||||
* Other long-term obligations on the Company’s balance sheet under GAAP primarily consist of obligations under warranty polices, foreign currency contracts, acquisition earn-outs, certain annual minimum royalty requirements, contractual obligations related to the construction of new facilities and tax liabilities. The timing of cash flows associated with these obligations is based upon management’s estimate over the terms of these arrangements and are largely based on historical experience.
The above contractual obligation table excludes certain contractual obligations, such as possible severance payments to certain executives, since these contractual commitments are not accrued as liabilities at December 31, 2011 or otherwise indeterminable. These contractual obligations are accrued as liabilities when the respective contingencies are determinable or achieved.
Item 3. Quantitative and Qualitative Disclosures about Market Risk
Since March 31, 2011, the Company experienced the following significant changes to our market risk:
There was an increase in the notional amount of RMB/U.S. dollar forward currency contracts and the additional foreign currency exposures associated with the acquisition of Gentech. For a discussion of market risk affecting us, refer to Part II, Item 7A “Quantitative and Qualitative Disclosures About Market Risk” included in our Annual Report on Form 10-K for the year ended March 31, 2011.
The Company has entered into a number of foreign currency exchange contracts in China in an attempt to hedge the Company’s exposure to the RMB. The RMB/U.S. dollar currency contracts have gross notional amounts totaling $16,100 with exercise dates through March 29, 2013 at an average exchange rate of $0.158 (RMB to U.S. dollar conversion rate). With these RMB/U.S. dollar contracts, for every 1% depreciation of the RMB or a 1% appreciation of the RMB, the Company would be exposed to an additional fx gains and losses, respectively, of approximately $161. Since these derivatives are not designated as hedges for accounting purposes, changes in their fair value are recorded in the results of operations, not in other comprehensive income.
On October 31, 2011, the Company completed the acquisition of all of the capital stock of Timesquest Limited, a holding company and the sole shareholder of Gentech International Limited, a level sensor and non-contact level switch company based in Ayrshire, Scotland for £6,500 or approximately $10,200, net of cash acquired, based on foreign currency exchange rates at the date of the acquisition. With the purchase of Gentech, the Company acquired a number of foreign currency contracts, as well as added an operating entity with the British pound as the functional reporting currency. The British pound/U.S. dollar currency contracts have gross notional amounts totaling $1,380 with exercise dates through February 2012 at an average exchange rate of $1.56 (British pound to U.S. dollar conversion rate). With these British pound/U.S. dollar contracts, for every 10% depreciation of the British pound or a 10% appreciation of the British pound, the Company would be exposed to an additional fx gains and losses, respectively, of approximately $138. Gentech had annual aggregate sales of approximately £5,000 or approximately $8,000 for the year ended December 31, 2010. Based on our net exposure of British pound to U.S. dollars, we estimate a negative impact of $60 to operating income for every 10% appreciation of the British pound against the U.S. dollar for fiscal 2012.
| 39 |
The Company has an earnings based earn-out contingency in connection with the Eureka acquisition, for which the Company has recorded an estimated fair value of $2,100. The Company has a sales based earn-out in connection with the Gentech acquisition, for which the Company has recorded a preliminary fair value estimate of £1,196 or approximately $1,930, based on exchange rates at the date of acquisition. The estimates for the Eureka and Gentech earn-outs are based on certain assumptions and actual amounts could differ significantly and changes to this estimate once finalized within the measurement period will be recorded to earnings in future periods. The acquisition earn-out contingencies are preliminary at December 31, 2011, and as such, changes will be recorded to goodwill; however, once finalized within the permitted measurement period, if the earn-out contingencies with Eureka and Gentech acquisitions are understated by 10%, we estimate a negative impact to earnings of $210 and $193, respectively.
ITEM 4. CONTROLS AND PROCEDURES
(Amounts in thousands)
(a) Evaluation of Disclosure Controls and Procedures
The Company’s Chief Executive Officer and Chief Financial Officer with the participation of management evaluated the effectiveness of our disclosure controls and procedures as of December 31, 2011. The term “disclosure controls and procedures,” as defined in Rules 13a-15(e) and 15d-15(e) under the Securities Exchange Act of 1934, as amended (the “Exchange Act”), means controls and other procedures of a company that are designed to ensure that information required to be disclosed by the company in the reports that it files or submits under the Exchange Act is recorded, processed, summarized and reported, within the time periods specified in the SEC’s rules and forms. Disclosure controls and procedures include, without limitation, controls and procedures designed to ensure that information required to be disclosed by a company in the reports that it files or submits under the Exchange Act is accumulated and communicated to the company’s management, including its principal executive and principal financial officers, as appropriate to allow timely decisions regarding required disclosure. Management recognizes that any controls and procedures, no matter how well designed and operated, can provide only reasonable assurance of achieving their objectives and management necessarily applies its judgment in evaluating the cost-benefit relationship of possible controls and procedures. Based on the evaluation of our disclosure controls and procedures as of December 31, 2011, our Chief Executive Officer and Chief Financial Officer concluded that, as of such date, our disclosure controls and procedures were effective.
(b) Changes in Internal Control Over Financial Reporting
During the fiscal quarter ended December 31, 2011, management did not identify any changes in the Company’s internal control over financial reporting that have materially affected, or are reasonably likely to materially affect, the Company’s internal control over financial reporting.
Management’s evaluation of the Company’s internal controls and procedures as of December 31, 2011 excluded the evaluation of internal controls for the Company’s recent acquisitions of Eureka, Celesco and Gentech. At December 31, 2011, Eureka represented approximately $4,539 in total assets and $696 in net sales for the nine months ended December 31, 2011. Celesco, which was acquired on September 30, 2011, represented approximately $44,042 in total assets at December 31, 2011, and $4,110 of net sales for the nine months ended December 31, 2011. Gentech, which was acquired on October 31, 2011, represented approximately $15,954 in total assets at December 31, 2011, and $2,459 of net sales for the nine months ended December 31, 2011.
PART II. OTHER INFORMATION
ITEM 1. LEGAL PROCEEDINGS
Pending Matters: From time to time, the Company is subject to legal proceedings and claims in the ordinary course of business. The Company currently is not aware of any legal proceedings or claims that the Company believes will have, individually or in the aggregate, a material adverse effect on the Company’s business, financial condition, or operating results.
ITEM 1A. RISK FACTORS
While we attempt to identify, manage and mitigate risks and uncertainties associated with our business to the extent practical under the circumstances, some level of risk and uncertainty will always be present. Item 1A of our Annual Report on Form 10-K for the year ended March 31, 2011 describes some of the risks and uncertainties associated with our business. These risks and uncertainties have the potential to materially affect our results of operations and our financial condition. We do not believe that there have been any material changes to the risk factors previously disclosed in our Annual report on Form 10-K for the year ended March 31, 2011.
ITEM 6. EXHIBITS
See Exhibit Index.
| 40 |
SIGNATURES
Pursuant to the requirements of the Securities Exchange Act of 1934, the registrant has duly caused this report to be signed on its behalf by the undersigned thereunto duly authorized.
|
Measurement Specialties, Inc. (Registrant) | ||
| Date: February 1, 2012 | By: | /s/ Frank D. Guidone |
| Frank D. Guidone President, Chief Executive Officer (Principal Executive Officer) | ||
| Date: February 1, 2012 | By: | /s/ Mark Thomson |
| Mark Thomson Chief Financial Officer (Principal Financial Officer) | ||
| 41 |
EXHIBIT INDEX
|
EXHIBIT NUMBER |
DESCRIPTION | |
| 31.1 | Certification of Frank D. Guidone required by Rule 13a-14(a) or Rule 15d-14(a) | |
| 31.2 | Certification of Mark Thomson required by Rule 13a-14(a) or Rule 15d-14(a) | |
| 32.1 | Certification of Frank D. Guidone and Mark Thomson required by Rule 13a-14(b) or Rule 15d-14(b) and Section 906 of the Sarbanes-Oxley Act of 2002, 18 U.S.C. Section 1350 |
| 42 |