Attached files
| file | filename |
|---|---|
| 8-K - FORM 8-K - BRINKS CO | form_8k.htm |
| EX-99.1 - EXHIBIT 99.1 - BRINKS CO | exhibit_99-1.htm |

Exhibit 99.2
The Brink’s Company
Fourth-Quarter 2011 Earnings
Conference Call
The Brink’s Company
Fourth-Quarter 2011 Earnings
Conference Call
NYSE:BCO
February 2, 2012

Forward-Looking Statements
These materials contain forward-looking statements. Actual
results could differ materially from projected or estimated
results. Information regarding factors that could cause such
differences is available in today's release and in The Brink’s
Company’s most recent SEC filings.
results could differ materially from projected or estimated
results. Information regarding factors that could cause such
differences is available in today's release and in The Brink’s
Company’s most recent SEC filings.
Information discussed today is representative as of today
only and Brink's assumes no obligation to update any
forward-looking statements. These materials are
copyrighted and may not be used without written permission
from Brink's.
only and Brink's assumes no obligation to update any
forward-looking statements. These materials are
copyrighted and may not be used without written permission
from Brink's.
2

The Brink’s Company
Ed Cunningham
Director - Investor Relations

Summary of Fourth-Quarter Non-GAAP Results
• Non-GAAP EPS $.56 vs $.80
• Revenue up 13% (9% organic)
• Profit Declines in North America, EMEA
• Continued Profit Growth in Latin America
• Higher Security Costs
Note: See reconciliation to GAAP results in Appendix
4

The Brink’s Company
Tom Schievelbein
Interim President and
Chief Executive Officer

CEO Overview
• CEO Search
• Security Costs
• North America
• EMEA
• Latin America
• Strategy and Outlook
6

The Brink’s Company
Joe Dziedzic
Vice President and Chief
Financial Officer
Financial Officer
Review and Outlook

4Q11 Non-GAAP Results
($ millions, except EPS)
|
|
|
|
|
|
Margin
|
9.6%
|
|
7.4%
|
Note: See reconciliation to GAAP results in Appendix
8

Non-GAAP EPS: 2011 Versus 2010
2010 2011
(per diluted share)
Note: See reconciliation to GAAP results in Appendix
9

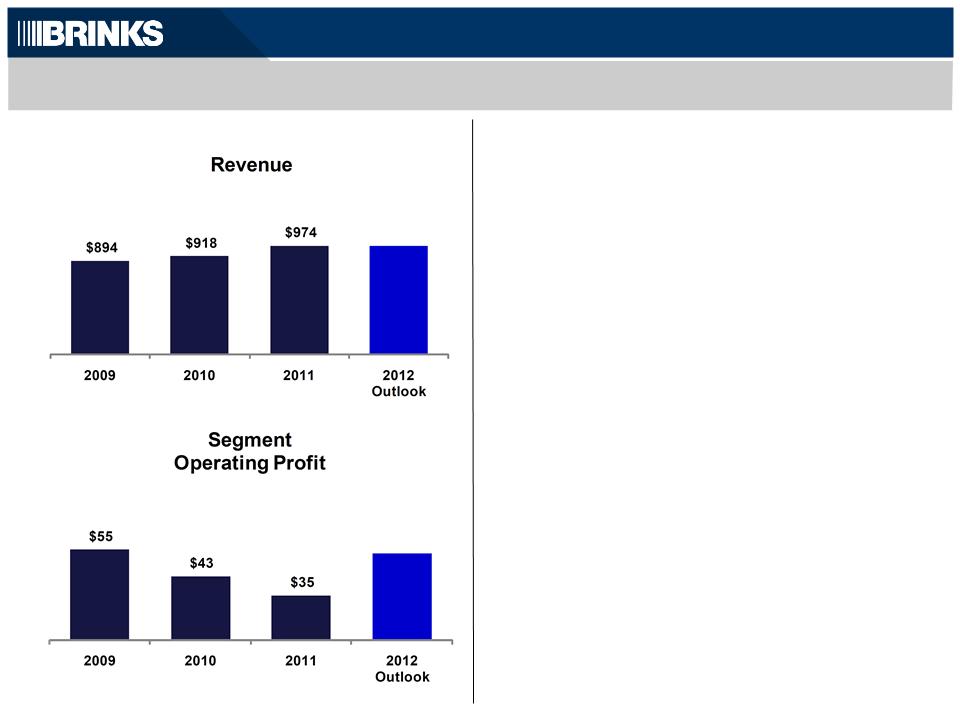
Total Non-GAAP Segment Results and Outlook
($ millions)
|
Organic
|
|
|
|
|
|
|
Growth
|
0%
|
|
5%
|
8%
|
5% - 8%
|
2011 Results
2012 Outlook
— 5% - 8% organic revenue growth
— U.S. actions improve profitability
— Unfavorable currency:
— Revenue down 3% - 5%
— Operating profit down $10-$15 million
— Continued strong Latin America growth
— Organic revenue growth back to pre-
recession level
recession level
— Continued difficult U.S. and European
markets
markets
— 6.8% margin excluding Mexico
— Average year for security costs versus
exceptional 2010
exceptional 2010
|
|
|
|
|
|
|
|
Margin
|
6.0%
|
|
7.2%
|
6.3%
|
6.5% - 7.0%
|
(a)
(a) See reconciliation to GAAP results in Appendix
(a)
10
North America Non-GAAP Segment Results and Outlook
($ millions)
2011 Results
2012 Outlook
|
|
|
|
|
|
|
|
Margin
|
6.1%
|
|
4.7%
|
3.6%
|
4.5% - 5.5%
|
|
Organic
|
|
|
|
|
|
|
Growth
|
(3%)
|
|
1%
|
-
|
-
|
— Revenue flat, Canada acquisition +$50
— U.S. revenue flat as fuel recovery and
CompuSafe® service growth offset CIT
volume and pricing pressure
CompuSafe® service growth offset CIT
volume and pricing pressure
— Branch cost actions exceed volume
reductions
reductions
— Flat revenue
— Continued volume and pricing pressures
— CompuSafe® service growth
— Focus on smaller financial institutions
— Investment and efficiencies
— Six regions consolidated to four
— Back-office reductions
— IT investments
(a)
(a) See reconciliation to GAAP results in Appendix A
11
(a)

International Non-GAAP Segment Results and Outlook
|
Organic
|
|
|
|
|
|
|
Growth
|
2%
|
|
8%
|
12%
|
7% - 10%
|
2011 Results
2012 Outlook
|
|
|
|
|
|
|
|
Margin
|
5.9%
|
|
8.2%
|
7.3%
|
7.0% - 8.0%
|
($ millions)
— Revenue Growth
— Mexico acquisition +$364
— Organic +$262
— Currency +$106
— Profit Growth
— Organic +$11
— Acquisitions/Dispositions +$10
— Currency +$10
— 8.1% margin excluding Mexico
— Continued strong organic revenue growth
driven by Latin America and Asia
driven by Latin America and Asia
— Unfavorable currency impact
— Revenue down 4% - 6%
— Operating profit down $10 - $15 million
— Slight improvement in Mexico, positioned
for margin expansion 2013+
for margin expansion 2013+
(a) See reconciliation to GAAP results in Appendix
(a)
(a)
12

Non-GAAP Cash Flow, Capital Investment, and Net Debt
13
International
North
America
(a)
($ millions)
(a)
(a) See reconciliation to GAAP results in Appendix
13

Long-Term Segment Growth Plan
— North America Operating Profit at 8-10%
— Cost structure and efficiencies
— Revenue mix to High Value Services
— Latin America
— Continued strong revenue growth
— Mexico improves to 10% margins
— EMEA
— Fix underperforming countries
— Margins expand to 7%
— Asia
— Continued strong revenue growth
— Expand footprint and maintain margins
Growth Plan
(a) See reconciliation to GAAP results in Appendix
(a)
8% - 10%
14

Non-GAAP Reporting Change
for U.S. Retirement Costs
for U.S. Retirement Costs

Reporting Change for U.S. Retirement Plans - Why?
— Costs relate to former businesses and frozen plans
— Significant volatility in discount rate and asset returns creates EPS volatility
— Removing costs from Non-GAAP results provides more clarity on operating
performance
performance
— Increased disclosure of funding requirements improves transparency and provides
an alternative for valuing these obligations
an alternative for valuing these obligations
16
16

2012 Outlook

2012 Outlook
— Non-Segment expenses flat at $41
— Tax rate 37% - 40% vs. 38%
— Interest expense $23 - $26 vs. $24
— Noncontrolling interest $24 - $28 vs. $23
— Capital expenditures and capital leases
$240 - $260 vs. $239
$240 - $260 vs. $239
Other Metrics: 2012 vs. 2011
($ millions)
• 5% - 8% Organic growth
• (3%) - (5%) Currency impact
|
|
|
|
|
Margin
|
6.3%
|
6.5% - 7.0%
|
(a)
(a) See reconciliation to GAAP results in Appendix
18

Appendix - Supplemental U.S.
Retirement Plan Information
and Non-GAAP Reconciliations
Retirement Plan Information
and Non-GAAP Reconciliations

Reporting Change for U.S. Retirement Plans - Obligations and Assets
($ millions)
Former Coal - Black Lung
Former Coal - UMWA Medical
Current Brink’s
Former Coal
Former BAX Global
Former Brink’s Home Security
U.S. Pension
Plans
$991
Former Coal - UMWA Medical (VEBA)
U.S. Pension Plans
Note: No assets associated with
the Black Lung obligations
Obligations
(12/31/2011)
Assets
(12/31/2011)
20
— 74% of liability related to Businesses no longer part of Brink’s
— 100% of liability related to current business is frozen, employees not earning additional benefits

History of U.S. Retirement Plans Funded Status
($ millions)
$0
Underfunded
drop in
asset values
asset values
$150
voluntary
contribution
voluntary
contribution
70 basis point
drop in discount
rate
drop in discount
rate
Discount Rate
(Primary U.S.
Pension Plan)
60 basis point
drop in discount
rate
drop in discount
rate
21

EPS Impact (a)
Income Statement Impact of U.S. Retirement Plans
($ millions, except EPS)
— Minimal impact on Segment results
— Significant impact on EPS driven by asset returns and discount rate volatility
(a) Using 48.1 million diluted shares
22
Operating Profit Impact

U.S. Retirement Plans - Funded Status and Payments
($ millions)
Investors decide how to value obligations
—GAAP underfunding at year-end 2011 $628 million
—Discounted cash flows at Plan discount rates $489 million. See reconciliation to GAAP in Appendix
23

Non-GAAP Reconciliations - 1Q11 to 3Q11
24
See page 26 for notes.
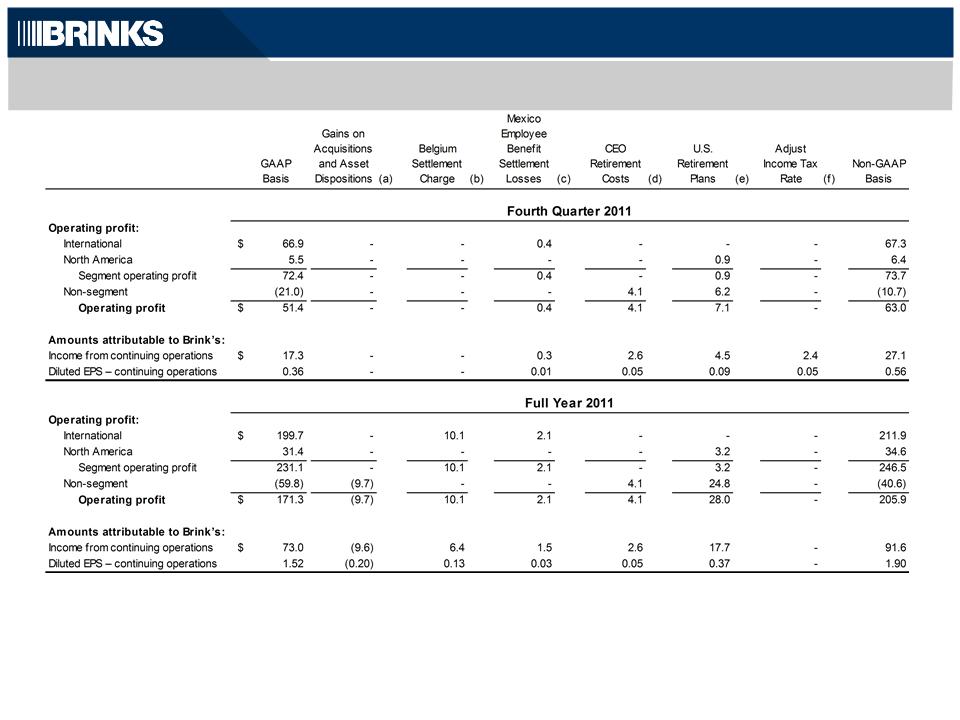
Non-GAAP Reconciliations - 4Q11 and FY 2011
25
Amounts may not add due to rounding. See page 26 for notes.

26
Non-GAAP Reconciliations - 2011 Footnotes
(b) To eliminate settlement charge related to exit of Belgium cash-in-transit business.
(c) To eliminate employee benefit settlement loss related to Mexico. Portions of Brink’s Mexican subsidiaries’ accrued employee
termination benefit were paid in the second and third quarters of 2011. The employee termination benefit is accounted for under
FASB ASC Topic 715, Compensation - Retirement Benefits. Accordingly, the severance payments resulted in settlement losses.
termination benefit were paid in the second and third quarters of 2011. The employee termination benefit is accounted for under
FASB ASC Topic 715, Compensation - Retirement Benefits. Accordingly, the severance payments resulted in settlement losses.
(d) To eliminate the costs related to the retirement of the former CEO.
(e) To eliminate expenses related to U.S. retirement liabilities.
(f) To adjust effective income tax rate to be equal to the full-year non-GAAP effective income tax rate. The non-GAAP effective tax rate
for 2011 is 38.6%.
for 2011 is 38.6%.
(a) To eliminate gain recognized on the sale of the U.S. document destruction business, gains on available-for-sale equity and debt
securities, gains related to acquisition of controlling interest in subsidiaries that were previously accounted for as equity or cost method
investments, and gains on sales of former operating assets, as follows:
securities, gains related to acquisition of controlling interest in subsidiaries that were previously accounted for as equity or cost method
investments, and gains on sales of former operating assets, as follows:
|
|
|
|
First Quarter 2011
|
|
Third Quarter 2011
|
|
Full Year 2011
|
|
||||||
|
|
|
|
|
EPS
|
|
|
EPS
|
|
Operating
Profit
|
|
EPS
|
|
||
|
|
Sale of U.S. Document Destruction business
|
$
|
-
|
|
-
|
|
(6.7)
|
|
(0.09)
|
|
(6.7)
|
|
(0.09)
|
|
|
|
Gains on available-for-sale equity and debt securities
|
|
-
|
|
(0.05)
|
|
-
|
|
-
|
|
-
|
|
(0.05)
|
|
|
|
Acquisition of controlling interests
|
|
(0.4)
|
|
(0.01)
|
|
(2.1)
|
|
(0.04)
|
|
(2.5)
|
|
(0.05)
|
|
|
|
Sale of former operating assets
|
|
-
|
|
-
|
|
(0.5)
|
|
(0.01)
|
|
(0.5)
|
|
(0.01)
|
|
|
|
|
$
|
(0.4)
|
|
(0.06)
|
|
(9.3)
|
|
(0.14)
|
|
(9.7)
|
|
(0.20)
|
|

Non-GAAP Reconciliations - 1Q10 to 3Q10
27
See page 29 for notes.

Non-GAAP Reconciliations - 4Q10 and FY 2010
28
Amounts may not add due to rounding. See page 29 for notes.

Non-GAAP Reconciliations - 2010 Footnotes
29

Non-GAAP Reconciliations - FY 2009
30

Non-GAAP Reconciliations - Cash Flows
31
32
|
NET DEBT RECONCILED TO GAAP
|
|
|
December 31,
|
|||||
|
|
|
|
2011
|
|
2010
|
|||
|
Debt:
|
|
|
|
|
|
|||
|
|
Short-term debt
|
|
$
|
25.4
|
|
36.5
|
||
|
|
Long-term debt
|
|
|
364.0
|
|
352.7
|
||
|
|
|
|
|
|
||||
|
|
|
|
|
|
|
|
|
|
|
Cash and cash equivalents
|
|
|
182.9
|
|
183.0
|
|||
|
|
|
|
||||||
|
|
|
|
Amount available for general corporate purposes
|
|
|
157.8
|
|
144.5
|
|
|
|
|
|
|
|
|
|
|
|
|
|
Net Debt
|
|
$
|
231.6
|
|
244.7
|
|
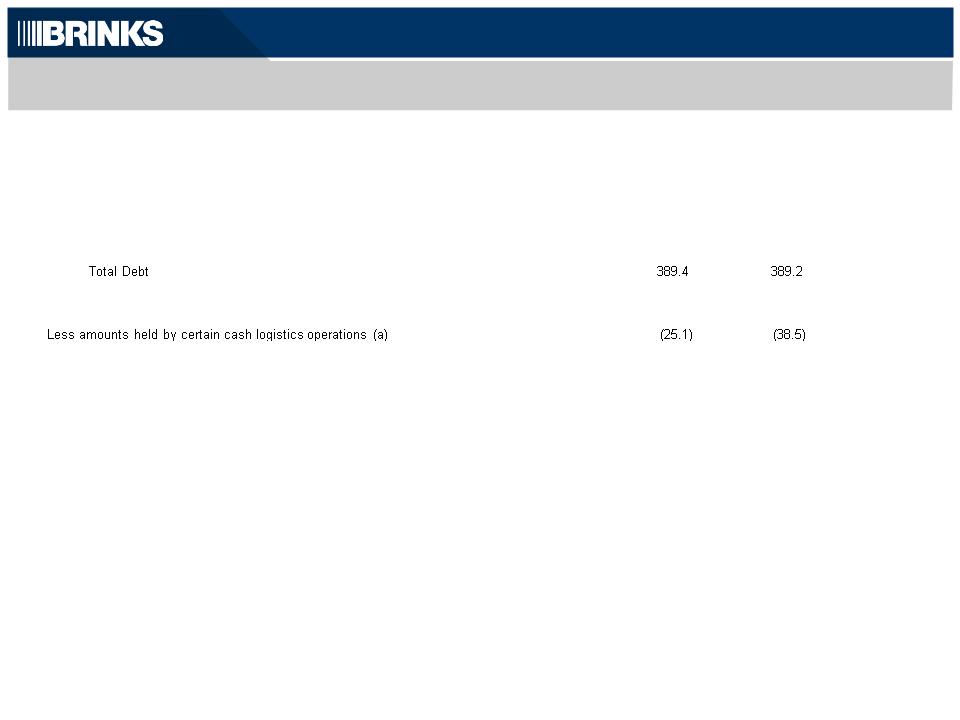
(a) Title to cash received and processed in certain of our secure cash logistics operations transfers to us for a short period of time. The cash is
generally credited to customers’ accounts the following day and we do not consider it as available for general corporate purposes in the
management of our liquidity and capital resources and in our computation of Net Debt.
Net Debt is a supplemental financial measure that is not required by, or presented in accordance with GAAP. We use Net Debt as a measure of
our financial leverage. We believe that investors also may find Net Debt to be helpful in evaluating our financial leverage. Net Debt should not be
our financial leverage. We believe that investors also may find Net Debt to be helpful in evaluating our financial leverage. Net Debt should not be
considered as an alternative to Debt determined in accordance with GAAP and should be reviewed in conjunction with our consolidated balance
sheets. Set forth above is a reconciliation of Net Debt, a non-GAAP financial measure, to Debt, which is the most directly comparable financial
measure calculated and reported in accordance with GAAP, as of December 31, 2011, and December 31,2010. Net Debt excluding cash
and debt in Venezuelan operations was $242 million at December 31, 2011, and $251 million at December 31, 2010.
Non-GAAP Reconciliations - Net Debt

33
Non-GAAP Reconciliations - U.S. Retirement Plans Obligation
|
DISCOUNTED CASH FLOWS AT PLAN DISCOUNT RATES - RECONCILED TO AMOUNTS REPORTED UNDER U.S. GAAP
|
|||||||||||
|
|
|
|
December 31, 2011
|
||||||||
|
|
|
|
|
|
Primary U.S.
pension plan (b) |
|
UMWA plans
(c) |
|
Other unfunded
U.S. plans |
|
Total
|
|
|
|
|
|
|
|
|
|
|
|
|
|
|
|
Funded status of U.S. retirement plans - GAAP
|
|
$
|
279
|
|
262
|
|
87
|
|
628
|
|
|
|
Present value of projected earnings of plan assets (a)
|
|
|
(82)
|
|
(57)
|
|
-
|
|
(139)
|
|
|
|
|
|
|
|
|
|
|
|
|
|
|
|
|
|
Discounted cash flows at plan discount rates - Non-GAAP
|
|
$
|
197
|
|
205
|
|
87
|
|
489
|
|
|
|
|
|
|
|
|
|
|
|
|
|
|
|
|
Plan discount rate
|
|
|
4.60%
|
|
4.40%
|
|
|
|
|
|
|
|
Expected return of assets
|
|
|
8.25%
|
|
8.50%
|
|
|
|
|
(a) Under GAAP, the funded status of a benefit plan is reduced by the fair market value of plan assets at the balance sheet date, and the present value
of the projected earnings on plan assets does not reduce the funded status at the balance sheet date. The non-GAAP measure presented above
additionally reduces the funded status as computed under GAAP by the present value of projected earnings of plan assets using the expected return
on asset assumptions of the respective plan.
(b) For the primary U.S. pension plan, we are required by ERISA regulations to maintain minimum funding levels, and as a result, we estimate we will
be required to make minimum required contributions from 2012 to 2017. We have estimated that we will achieve the required funded ratio after the
2017 contribution.
be required to make minimum required contributions from 2012 to 2017. We have estimated that we will achieve the required funded ratio after the
2017 contribution.
(c) There are no minimum funding requirements for the UMWA plans because they are not covered by ERISA funding regulations. Using assumptions
at the end of 2011, we project that the plan assets plus expected earnings on those investments will cover the benefit payments for these plans until
2023. We project that Brink’s will be required to contribute cash to the plan beginning in 2023 to pay beneficiaries.
at the end of 2011, we project that the plan assets plus expected earnings on those investments will cover the benefit payments for these plans until
2023. We project that Brink’s will be required to contribute cash to the plan beginning in 2023 to pay beneficiaries.
Discounted cash flows at plan discount rates are supplemental financial measures that are not required by, or presented in accordance with GAAP. The
purpose of the discounted cash flows at plan discount rate is to present our retirement obligations after giving effect to the benefit of earning a return on
purpose of the discounted cash flows at plan discount rate is to present our retirement obligations after giving effect to the benefit of earning a return on
plan assets. We believe this measure is helpful in assessing the present value of future funding requirements of the company in order to meet plan
benefit obligations. Discounted cash flows at plan discount rates should not be considered as an alternative to the funded status of the U.S. retirement
plans at December 31, 2011, as determined in accordance with GAAP and should be read in conjunction with our consolidated balance sheets.