Attached files
| file | filename |
|---|---|
| 8-K - FORM 8-K - JONES LANG LASALLE INC | d292607d8k.htm |
| EX-99.1 - EX-99.1 - JONES LANG LASALLE INC | d292607dex991.htm |
 Supplemental Information
Fourth Quarter
Earnings Call
2011
Exhibit 99.2 |
 Market & Financial Overview |
 3
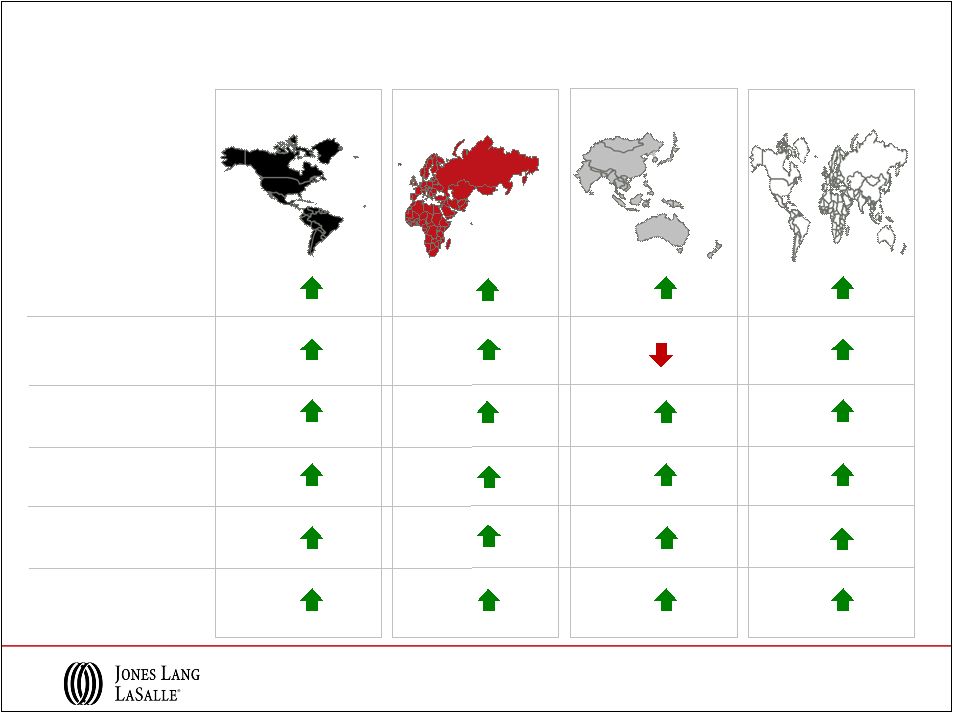
Americas
EMEA
Asia
Pacific
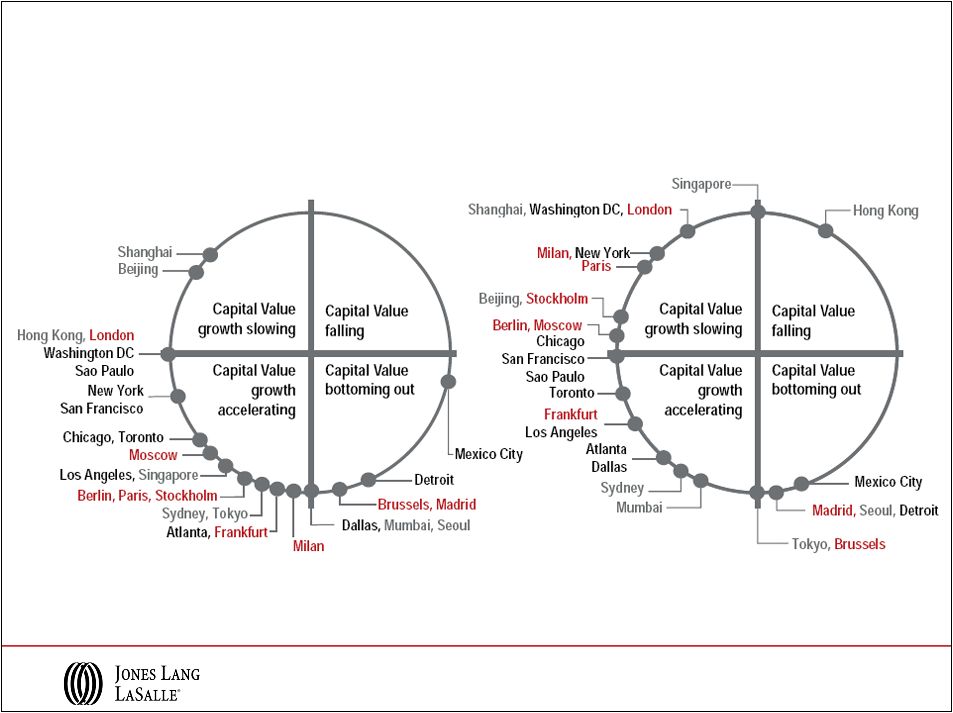
Capital
Values
As
of
Q4
2011
The
Jones
Lang
LaSalle
Property
Clocks
SM
Q4
2011
Q4
2010 |
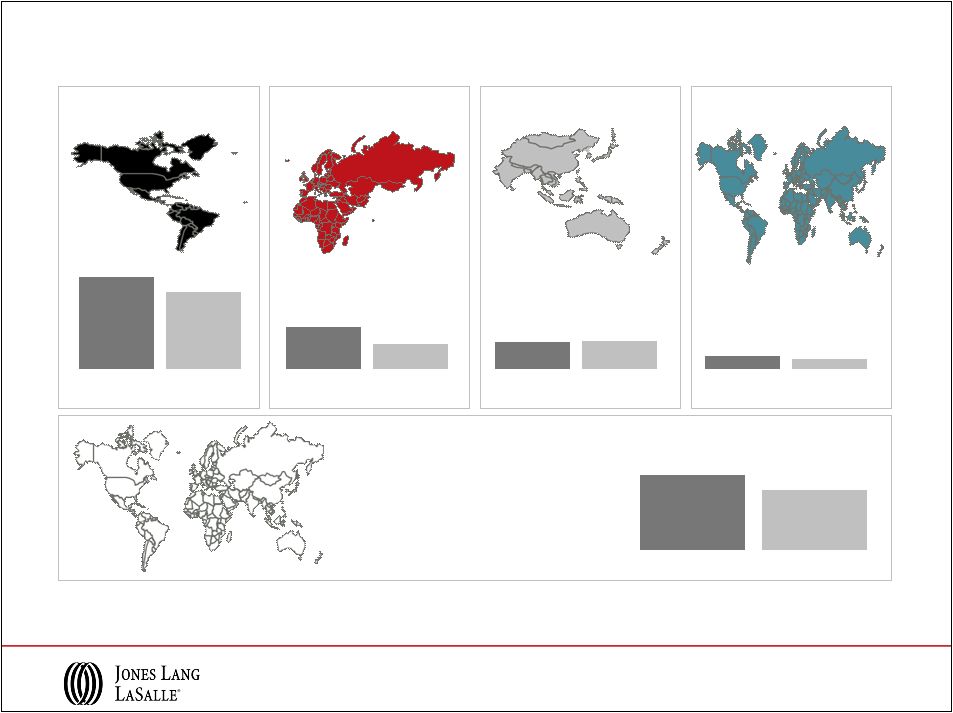
 4
Leasing
Market
Fundamentals
Q4
2010
As
of
Q4
2011
The
Jones
Lang
LaSalle
Property
Clocks
SM
Americas
EMEA
Asia
Pacific
Q4
2011 |
 Q4 Selected Business Wins and Expansions
5
Americas
EMEA
Asia Pacific
–
AMC
Theaters
–
4M
sf
–
1800
9
th
Avenue,
Seattle
–
$77M
–
70
Pine
Street,
New
York
–
$205M
–
55
West
Monroe,
Chicago
–
$136M
–
Paramount
Hotel,
New
York
–
$255M
–
DIRECTV,
Los
Angeles
–
630K
sf
–
AMA,
Chicago
–
275K
sf
–
Guggenheim
Partners,
New
York
–
185K
sf
–
UBS
–
27
countries
–
UK
Logistics
–
£312M
–
PEP
Shopping
Centre,
Munich
–
€400M+
–
Industrial
portfolio,
Czech
Republic
–
€135M
–
W
Hotel,
London
–
$295M
–
Tesco
International,
Slovakia
–
460K
sf
–
St.
David’s
Mall,
Cardiff
–
1.4M
sf
–
Fonterra
Group,
China
–
4.4M
sf
–
Commerce
Point,
Singapore
–
$161M
–
RREEF
Investment,
Dalian
–
960K
sf
–
Cairns
Central
Shopping
Centre,
Australia
–
AUD
261M
–
MAPS,
Seoul
–
700K
sf
–
Baker
&
McKenzie,
Thailand
–
65K
sf
–
Merck,
Sharp
&
Dohme,
Beijing
–
545K
sf
–
Mercedes-Benz,
Bangalore
–
200K
sf
Global
–
GlaxoSmithKline
–
80M
sf |
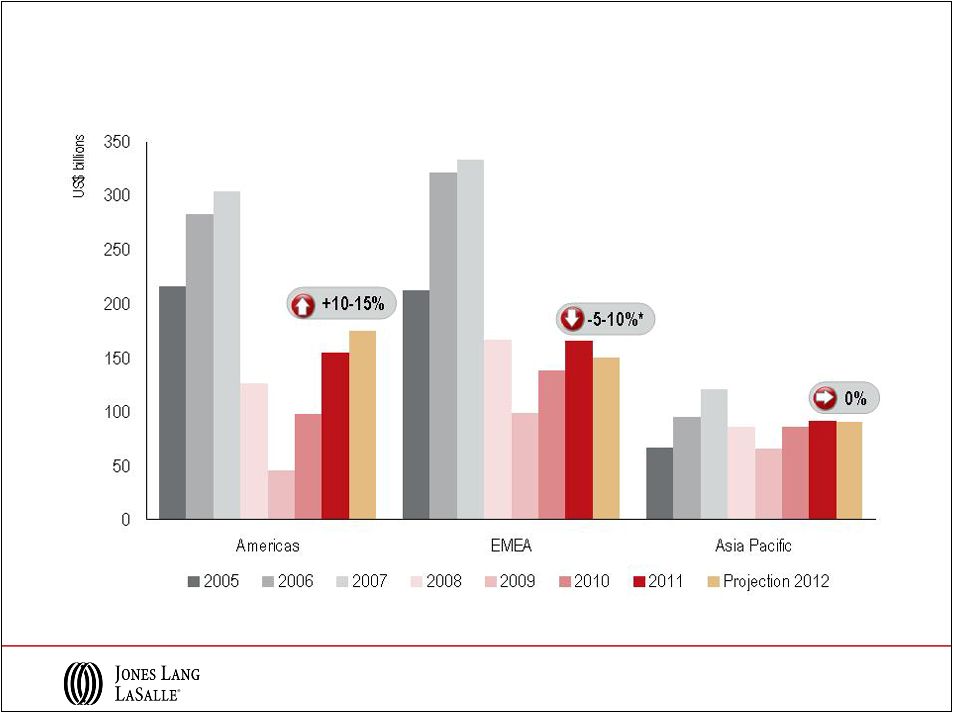 Direct
Commercial
Real
Estate
Investment,
2005
-
2012
*
EMEA:
Presented
In
US$
terms.
Volumes
unchanged
in
Euro
terms.
Source:
Jones
Lang
LaSalle,
January
2012
6 |
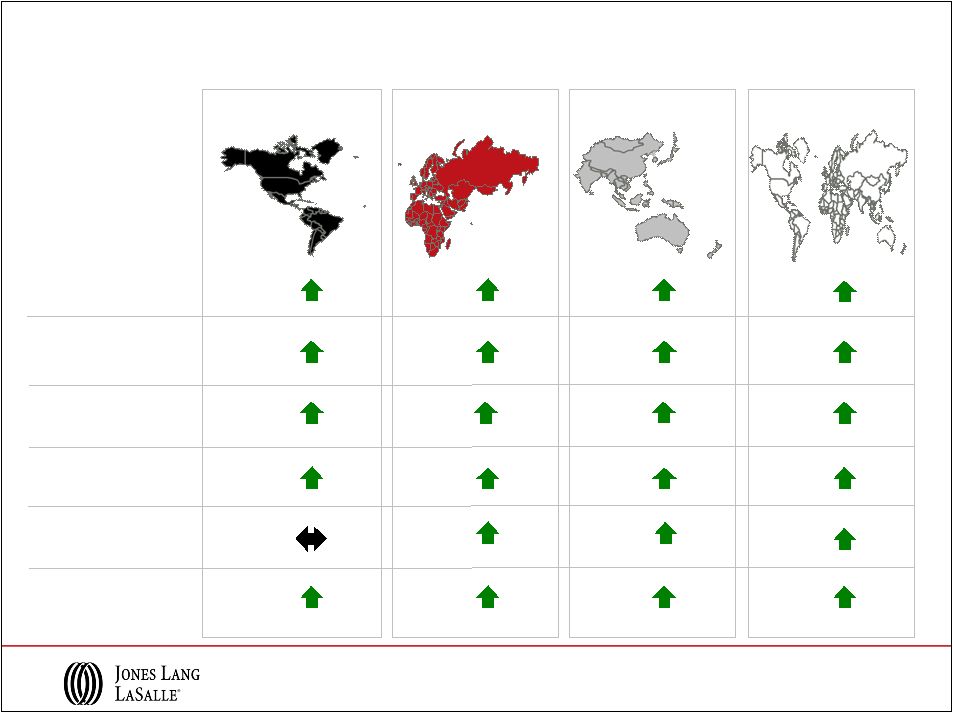
 +
10-20% Capital Values
Rental Values
+ 5-10%
+ 0-5%
-
0-5%
-
5-10%
Moscow, Shanghai, Mumbai
Sydney, Tokyo
Sao Paulo, New York*
London*, Frankfurt, Paris, Stockholm
Boston, Chicago, Los Angeles, Washington DC
+ 20%
Toronto, Tokyo, Moscow
San Francisco, New York*
Sydney, Mumbai
Boston, Chicago, Los Angeles
Washington DC, Sao Paulo, Stockholm
Shanghai, London*, Frankfurt
Provisional.
*New
York
–
Midtown,
London
–
West
End.
Nominal
rates
in
local
currency.
Source:
Jones
Lang
LaSalle,
January
2012
-
10-20%
Dubai
Brussels, Madrid, Mexico City
Brussels, Madrid, Paris
Mexico City
Dubai
Toronto, San Francisco
Hong Kong, Singapore
Hong Kong, Singapore
Beijing
Beijing
7
2012 Market Outlook
Projected Change in Prime Office Values |
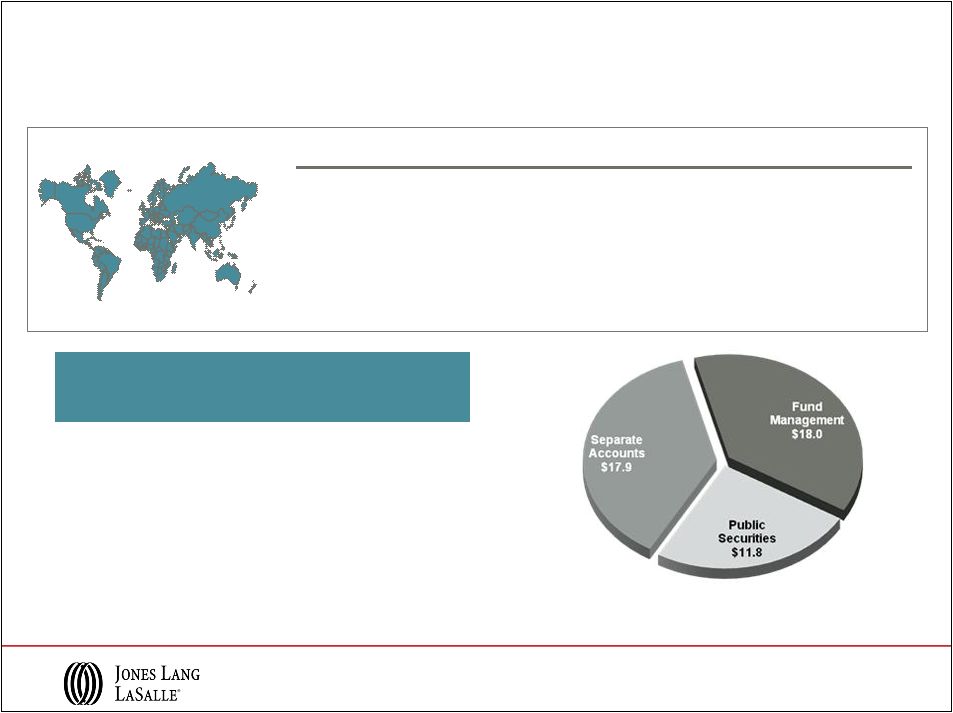
 Financial Information |
 FY 2011 Consolidated Revenue Mix
2011 Revenue = $3.6 billion
Service Line
Geography
9 |
 10
FY
2011
Revenue
Performance
Note:
Equity
earnings
(losses)
of
$6.4M
and
($11.4M)
in
2011
and
2010,
respectively,
are
included
in
segment
results,
however,
are
excluded
from
Consolidated
totals.
Americas
EMEA
Asia Pacific
LIM
Consolidated
$3,584.5
$2,925.6
2011
2010
($
in
millions;
%
change
in
USD )
21%
$1,525.3
$1,261.5
2011
2010
$816.5
$678.5
2011
2010
$275.4
$245.4
2011
2010
$973.7
$728.8
2011
2010
34%
20%
12%
23% |
 Asia
Pacific 11
FY 2011 Real Estate Services Revenue
($ in millions; % change in USD )
Americas
EMEA
Leasing
Capital Markets &
Hotels
Property & Facility
Management
Project &
Development Services
Advisory, Consulting
& Other
Total RES
Operating Revenue
$760.2
$136.1
$335.6
$178.5
$112.2
$1,522.6
19%
62%
25%
12%
2%
21%
$236.1
$229.1
$152.8
$182.5
$173.5
$974.0
17%
62%
7%
59%
36%
34%
$192.3
$94.8
$364.6
$80.8
$83.8
$816.3
22%
16%
20%
27%
17%
20%
$1,188.6
$460.0
$853.0
$441.8
$369.5
$3,312.9
19%
50%
19%
31%
20%
24%
Total RES
Revenue
Note:
Segment
and
Consolidated
Real
Estate
Services
(“RES”)
operating
revenue
exclude
Equity
earnings
(losses). |
 $235.9
$223.2
2011
2010
$66.2
$66.8
2011
2010
$340.3
$237.4
2011
2010
12
Q4
2011
Revenue
Performance
Note:
Equity
earnings
(losses)
of
$3.7M
and
($0.4M)
in
2011
and
2010,
respectively,
are
included
in
segment
results,
however,
are
excluded
from
Consolidated
totals.
Americas
EMEA
Asia Pacific
$509.5
$428.5
2011
2010
Consolidated
$1,148.2
$956.3
2011
2010
($
in
millions,
%
change
in
USD)
LIM
19%
43%
6%
1%
20% |
 Asia
Pacific 13
Q4 2011 Real Estate Services Revenue
Americas
EMEA
Leasing
Capital Markets &
Hotels
Property & Facility
Management
Project &
Development Services
Advisory, Consulting
& Other
Total RES
Operating Revenue
$258.4
$48.2
$115.2
$54.4
$33.3
$509.5
13%
37%
34%
13%
8%
19%
$81.0
$103.1
$42.4
$51.6
$62.2
$340.3
17%
98%
4%
60%
44%
43%
$69.1
$22.0
$98.9
$20.9
$25.0
$235.9
12%
(25%)
11%
11%
4%
6%
$408.5
$173.3
$256.5
$126.9
$120.5
$1,085.7
14%
49%
19%
28%
22%
Total RES
Revenue
23%
Note:
Segment
and
Consolidated
Real
Estate
Services
(“RES”)
operating
revenue
exclude
Equity
earnings
(losses).
($ in millions; % change in USD ) |
 A
premier
global
investment
manager
LaSalle
Investment
Management
Note: AUM data reported on a one-quarter lag
2011 Highlights
AUM by Fund type
($ in billions)
•
Investment
performance
at
or
above
benchmarks
for
all
business
segments
•
Nearly
$5
billion
of
net
capital
raised
in
2011,
consistent
with
2010
•
High-margin
advisory
fees
contribute
to
operating
income
margin
of
21%
•
Trinity
Funds
Management
acquisition
added
$700
M
of
AUM
and
established
LaSalle
as
a
domestic
player
in
capital-rich
Australia
Product
Assets Under
Management
($ in billions)
Average
Performance
Private Equity
U.K.
$11.9
Above benchmark
Continental Europe
$4.3
Return: >1x equity
North America
$10.7
Above benchmark
Asia Pacific
$9.0
Return: >1x equity
Public Securities
$11.8
Above benchmark
Total Q4 2011 AUM
$47.7 B
14 |
 Solid Cash Flows and Balance Sheet Position
•
Steady
quarterly
improvement
in
Cash
from
Operations
-
Cash
from
earnings,
excluding
Restructuring
and
acquisition
charges,
increased
$30
million
versus
Q4
2010
-
Working
capital
impacted
by
higher
receivables
resulting
from
strong
year
end
transaction
revenue
•
Fourth
quarter
acquisition
activity
includes
Pacific
Real
Estate
Partners,
Procon
and
DST
-
Smaller
transactions
in
strategically
important
markets
•
Investment
grade
balance
sheet;
Baa2
/
BBB-
(Stable)
-
Low
debt
cost:
2011
net
interest
expense
of
$36
million
vs.
$46
million
in
2010
-
Total
net
debt
reduced
$184
million
in
Q4
2011
to
end
year
at
$643
million
2011 Highlights
($ in millions)
2011
2010
Q1
Q2
Q3
Q4
Q4
Cash from Earnings
$42
$81
$68
$120
$124
Working Capital
(239)
(20)
27
133
152
Cash (used in) from Operations
($197)
$61
$95
$253
$276
Primary Uses
Capital Expenses
(17)
(19)
(20)
(36)
(25)
Acquisitions & Deferred Payment Obligations
(25)
(210)
(162)
(19)
(17)
Co-Investment
(2)
2
(47)
2
6
Dividends
-
(7)
-
(7)
(5)
Net Cash Outflows
($44)
($234)
($229)
($60)
($41)
Net Share Activity & Other Financing
(4)
(2)
(8)
(2)
4
Net Bank Debt Borrowings
($245)
($175)
($142)
$191
$239
15 |
 Appendix |
 17
FY 2011 Adjusted EBITDA* Performance
Americas
EMEA
Asia Pacific
LIM
$201.2
$183.9
2011
2010
Consolidated
$394.9
$336.7
2011
2010
*
Refer
to
slide
20
for
Reconciliation
of
GAAP
Net
Income
to
adjusted
EBITDA
for
the
twelve
months
ended
December
31,
2011,
and
2010,
for
details
relative
to
these
adjusted
EBITDA
calculations.
Segment
EBITDA
is
calculated
by
adding
the
segment’s
Depreciation
and
amortization
to
its
reported
Operating
income,
which
excludes
Restructuring
and
acquisition
charges.
Consolidated
adjusted
EBITDA
is
the
sum
of
the
EBITDA
of
the
four
segments
less
net
income
attributable
to
non-controlling
interest
and,
dividends
on
unvested
common
stock.
($ in millions)
$38.3
$57.3
2011
2010
$78.4
$62.4
2011
2010
$59.7
$53.0
2011
2010 |
 18
Q4 2011 Adjusted EBITDA* Performance
Americas
EMEA
Asia Pacific
LIM
$94.1
$78.7
2011
2010
Consolidated
$179.0
$143.1
2011
2010
*
Refer
to
slide
20
for
Reconciliation
of
GAAP
Net
Income
to
adjusted
EBITDA
for
the
three
months
ended
December
31,
2011,
and
2010,
for
details
relative
to
these
adjusted
EBITDA
calculations.
Segment
EBITDA
is
calculated
by
adding
the
segment’s
Depreciation
and
amortization
to
its
reported
Operating
income,
which
excludes
Restructuring
and
acquisition
charges.
Consolidated
adjusted
EBITDA
is
the
sum
of
the
EBITDA
of
the
four
segments
less
net
income
attributable
to
non-controlling
interests
and
dividends
on
unvested
common
stock.
($ in millions)
$43.0
$25.6
2011
2010
$28.2
$28.7
2011
2010
$13.9
$10.4
2011
2010 |
 19
($ in millions)
Reconciliation of GAAP Net Income to Adjusted Net Income
Three Months Ended
December 31,
Twelve Months Ended
December 31,
2011
2010
2011
2010
GAAP Net income attributable to common
shareholders
$ 84.8
$ 84.4
$ 164.0
$ 153.5
Shares (in 000s)
44,402
44,235
44,367
44,084
GAAP earnings per share
$ 1.91
$ 1.91
$ 3.70
$ 3.48
GAAP Net income attributable to common
shareholders
$ 84.8
$ 84.4
$ 164.0
$ 153.5
Restructuring and acquisition charges, net
25.2
0.7
41.9
4.9
Intangible amortization, net
3.6
-
8.6
-
Non-cash co-investment charges, net
-
0.7
-
7.9
Adjusted net income
$ 113.6
$ 85.8
$ 214.5
$ 166.3
Shares (in 000s)
44,402
44,235
44,367
44,084
Adjusted earnings per share
$ 2.56
$ 1.94
$ 4.83
$ 3.77 |
 20
($ in millions)
Reconciliation of GAAP Net Income to Adjusted EBITDA
Three Months Ended
December 31,
Twelve Months Ended
December 31,
2011
2010
2011
2010
GAAP Net income attributable to
common shareholders
$84.8
$84.4
$164.0
$153.5
Interest expense, net of interest income
8.4
10.1
35.6
45.8
Provision for income taxes
29.5
28.2
56.4
49.0
Depreciation and amortization
22.3
18.6
82.8
71.6
EBITDA
$ 145.0
$ 141.3
$ 338.8
$ 319.9
Restructuring and acquisition charges
34.0
0.9
56.1
6.4
Non-cash co-investment charges
-
0.9
-
10.4
Adjusted EBITDA
$ 179.0
$ 143.1
$ 394.9
$ 336.7
|